Tratamiento con células madres para el infarto de miocardio agudo
Resumen
Antecedentes
El trasplante de células ofrece un enfoque terapéutico potencial para la reparación y la regeneración del tejido vascular y cardíaco lesionado después del infarto de miocardio agudo (IMA). Este hecho ha motivado la realización de múltiples ensayos controlados aleatorios (ECA) en todo el mundo.
Objetivos
Determinar la seguridad y la eficacia de las células madres autólogas de médula ósea adulta como tratamiento para el infarto de miocardio agudo (IMA), con énfasis en los resultados clínicos.
Métodos de búsqueda
Esta revisión Cochrane es una actualización de una versión anterior (publicada en 2012). Se hicieron búsquedas en el Registro Cochrane Central de Ensayos Controlados (Cochrane Central Register of Controlled Trials) (CENTRAL 2015, número 2), MEDLINE (1950 hasta marzo 2015), EMBASE (1974 hasta marzo 2015), CINAHL (1982 hasta marzo 2015) y en la Transfusion Evidence Library (1980 hasta marzo 2015). Además, se realizaron búsquedas en varias bases de datos internacionales y de ensayos en curso en marzo 2015 y búsquedas manuales en actas de congresos relevantes hasta enero 2011.
Criterios de selección
Fueron elegibles los ECA que compararon las células autólogas derivadas de médula ósea con ninguna célula en pacientes con diagnóstico de IMA.
Obtención y análisis de los datos
Dos autores de la revisión de forma independiente examinaron todas las referencias, evaluaron el riesgo de sesgo de los ensayos incluidos y extrajeron los datos. Para los metanálisis se utilizaron modelos de efectos aleatorios durante toda la revisión. Se analizaron los resultados del seguimiento a corto plazo (menos de 12 meses) y a largo plazo (12 meses o más). Los resultados dicotómicos se informan como cocientes de riesgos (CR) y los resultados continuos se informan como diferencia de medias (DM) o DM estandarizada (DME). Se realizaron análisis de sensibilidad para evaluar los resultados en el contexto del riesgo de sesgo de selección, de realización y de desgaste. El análisis exploratorio de subgrupos investigó los efectos de la función cardíaca al inicio (fracción de expulsión ventricular izquierda, FEVI) y la dosis, el tipo y el momento de administración de las células, así como la administración de heparina en la solución final de células.
Resultados principales
Fueron elegibles para inclusión 41 ECA con 2732 participantes (1564 tratamiento con células, 1168 controles). El tratamiento con células no se asoció con ningún cambio en el riesgo de mortalidad por todas las causas (34/538 versus 32/458; CR 0,93; IC del 95%: 0,58 a 1,50; 996 participantes; 14 estudios; pruebas de calidad moderada), mortalidad cardiovascular (23/277 versus 18/250; CR 1,04; IC del 95%: 0,54 a 1,99; 527 participantes; nueve estudios; pruebas de calidad moderada) o una medida compuesta de mortalidad, reinfarto y reingreso por insuficiencia cardíaca (24/262 versus 33/235; CR 0,63; IC del 95%: 0,36 a 1,10; 497 participantes; seis estudios; pruebas de calidad moderada) al seguimiento a largo plazo. La heterogeneidad estadística fue baja (I2 = 0% a 12%). Los eventos adversos graves alrededor del procedimiento fueron poco frecuentes y en general fue poco probable que estuvieran relacionados con el tratamiento con células. Además, el tratamiento con células no tuvo efecto sobre la morbilidad, la calidad de vida / el rendimiento o la FEVI medida mediante resonancia magnética. Los metanálisis de la FEVI medidos por ecocardiografía, tomografía computarizada de emisión de fotón único y la angiografía ventricular izquierda mostró pruebas de diferencias en la FEVI media entre los grupos de tratamiento, aunque las diferencias medias variaron entre el 2% y el 5%, que se acepta que no son clínicamente relevantes. Los resultados fueron consistentes con respecto al riesgo de sesgo de selección, realización y desgaste de los estudios individuales.
Conclusiones de los autores
Los resultados de esta revisión indican que no hay pruebas suficientes de un efecto beneficioso del tratamiento con células en los pacientes con IMA. Sin embargo, la mayoría de las pruebas provienen de ensayos pequeños que no mostraron diferencias en resultados clínicamente relevantes. Se necesitan ensayos adicionales con poder estadístico suficiente, y hasta entonces la eficacia de esta intervención aún no se ha comprobado.
PICO
Resumen en términos sencillos
Tratamiento con células madres después de un ataque al corazón
Pregunta de la revisión: ¿Las células de médula ósea son seguras y eficaces como tratamiento después de un ataque cardíaco?
Antecedentes: Actualmente el tratamiento estándar para los pacientes que presentan un ataque cardíaco (debido a un bloqueo en la arteria que irriga el corazón) es abrir directamente la arteria con un balón pequeño mediante un procedimiento denominado angioplastia primaria e introducir un tubo pequeño en la arteria (stent) para mantenerla abierta. El uso de la angioplastia primaria y los stents para volver a abrir la arteria bloqueada puede dar lugar a una reducción del 35% en la mortalidad asociada con esta enfermedad. En años recientes, las células madres / progenitoras de médula ósea se han investigado como un posible tratamiento. Pueden prevenir el daño al músculo cardíaco causado por un ataque cardíaco cuando se utilizan además del tratamiento ofrecido mediante la angioplastia primaria y el tratamiento médico estándar.
Características de los estudios: Fueron elegibles para esta revisión los ensayos aleatorios que compararon las células derivadas de médula ósea con ninguna célula en los pacientes con diagnóstico de infarto de miocardio agudo. Se realizaron búsquedas en las bases de datos hasta marzo 2015. Esta revisión fue apoyada por el National Institute of Health Research (NIHR) a través de su programa Cochrane Incentive Award.
Resultados clave:En esta revisión sistemática actualizada se analizaron los datos de un total de 41 ensayos con más de 2700 pacientes. La evaluación de las pruebas actualmente disponibles indica que este tratamiento puede no dar lugar a mejoría en comparación con el tratamiento estándar, cuando se midió según la frecuencia de muertes, ataques cardíacos o insuficiencia cardíaca que requiere reingreso después del tratamiento, y mediante pruebas de la función del corazón, a corto y a largo plazo.
Calidad de la evidencia para los resultados primarios:Las pruebas en esta revisión son de calidad moderada debido al pequeño número de eventos.
Authors' conclusions
Summary of findings
| Cells compared to no cells for acute myocardial infarction (AMI) | ||||||
| Patient or population: patients with AMI | ||||||
| Outcomes | Illustrative comparative risks* (95% CI) | Relative effect | No of participants | Quality of the evidence | Comments | |
| Assumed risk | Corresponding risk | |||||
| No cells | Cells | |||||
| All‐cause mortality ‐ short‐term follow‐up (< 12 months) | Study population | RR 0.80 | 1365 | ⊕⊕⊕⊝ | Further research may change the estimate | |
| 28 per 1000 | 23 per 1000 | |||||
| All‐cause mortality ‐ long‐term follow‐up (≥ 12 months) | Study population | RR 0.93 | 996 | ⊕⊕⊕⊝ | Further research may change the estimate | |
| 70 per 1000 | 65 per 1000 | |||||
| Cardiovascular mortality ‐ short‐term follow‐up (< 12 months) | Study population | RR 0.72 | 290 | ⊕⊕⊕⊝ | Further research may change the estimate | |
| 54 per 1000 | 39 per 1000 | |||||
| Cardiovascular mortality ‐ long‐term follow‐up (≥ 12 months) | Study population | RR 1.04 | 527 | ⊕⊕⊕⊝ | Further research may change the estimate | |
| 72 per 1000 | 75 per 1000 | |||||
| Composite death, reinfarction and hospitalisation for heart failure ‐ short‐term follow‐up (< 12 months) | Study population | RR 0.36 | 379 | ⊕⊕⊕⊝ | Further research may change the estimate | |
| 66 per 1000 | 24 per 1000 | |||||
| Composite death, reinfarction and hospitalisation for heart failure ‐ long‐term follow‐up (≥ 12 months) | Study population | RR 0.63 | 497 | ⊕⊕⊕⊝ | Further research may change the estimate | |
| 140 per 1000 | 88 per 1000 | |||||
| *The assumed risk is based on the observed incidence across the pooled control groups. The corresponding risk (and its 95% confidence interval) is based on the assumed risk in the comparison group and the relative effect of the intervention (and its 95% CI). | ||||||
| GRADE Working Group grades of evidence | ||||||
| 1Imprecision: information size criterion not met. Small size effect. | ||||||
Background
Description of the condition
Despite major advances in treatment regimes, ischaemic heart disease remains a major cause of mortality and morbidity worldwide (BHF 2014). In the UK alone there are more than 2.3 million people living with ischaemic heart disease, causing approximately 153 deaths for every 100,000 people and representing a substantial cost to our healthcare system (BHF 2014). For example, more than GBP 6.8 billion was spent on treating the disease within NHS England in 2012/2013 (BHF 2014). The main symptom of ischaemic heart disease is a heart attack or myocardial infarction. Acute myocardial infarction (AMI) most often occurs when there is rupture of an atherosclerotic plaque into a coronary artery, which may cause thrombosis and occlusion of the artery, stopping the blood supply in that region of the heart and causing necrosis of the affected area (Falk 1995). Subsequently, both infarcted and unaffected myocardium undergo adverse remodelling that can sometimes extend to the entire ventricular wall. The first changes occur almost immediately after coronary occlusion and lead to loss of contractility, followed by the growth of the necrotic areas in the following days. The infarcted region would have healed after two to three months, leaving a scar (fibrotic, non‐contracting region) in the ventricular wall (ESC/ACC 2000).
Current medical treatment can ameliorate the symptoms of the disease. First thrombolytic therapy and, most recently, primary angioplasty have become the standard treatment choice for those suffering from AMI. However, although optimal medical therapy reduces mortality (Hartwell 2005), patients continue to face risks of heart failure following heart attacks (Velagaleti 2008). Therefore, the search for treatment options that prevent this adverse ventricular remodelling following AMI has been at the forefront of clinical research in cardiology.
Description of the intervention
For more than a decade cell therapies have been developed as new treatments for patients suffering from AMI (Strauer 2002). The first non‐randomised trials demonstrated the feasibility of infusing bone marrow‐derived mononuclear cells (BMMNC) into the infarcted area of the myocardium via the infarct‐related artery (IRA) using a procedure similar to percutaneous coronary intervention or PCI (Assmus 2002; Fernandez‐Aviles 2004; Meyer 2006; Strauer 2002; Tse 2003). This was later expanded to the direct injection of cells into the ischaemic cardiac muscle during coronary artery bypass graft (CABG) (Stamm 2003). The study by Stamm in 2003 administered bone marrow‐derived CD133+ haematopoietic progenitor cells and showed that these cells could improve revascularisation of the infarcted myocardium (Stamm 2003). The success of these first trials resulted in a number of larger randomised controlled clinical trials (RCTs) world‐wide (Cao 2009; Gao 2013; Grajek 2010; Hirsch 2011; Janssens 2006; Lee 2014; Lunde 2006; Nogueira 2009; Roncalli 2010; Schachinger 2006; Sürder 2013; Tendera 2009; Traverse 2010; Traverse 2011; Traverse 2012; Wohrle 2010; Wollert 2004; Yao 2009). To date, the majority of RCTs infuse a pool of BMMNC, but recently the first placebo‐controlled study comparing enriched CD34+ haematopoietic progenitor cells with non‐selected BMMNC has been published (Tendera 2009). In addition, bone marrow‐derived mesenchymal stromal cells (BM‐MSC) have been also tested in the clinic as a treatment for AMI (Gao 2013; Lee 2014).
Bone marrow harvest, containing the mononuclear cells and a small proportion of stem/progenitor cells (e.g. CD34+ or CD133+ enriched progenitor cells), is undertaken by a haematologist, whilst a specialised technician or scientist undertakes the isolation of the mononuclear cells or the selection of stem/progenitor cells. Finally, the cardiologist undertakes the infusion or injection of the cells.
Bone marrow harvest and isolation of BMMNC is a standard procedure in bone marrow transplantation for haematological malignancies. Cell transplantation in the context of heart disease is not currently available as standard clinical practice. The treatment is only available in research‐associated facilities, whilst its safety and efficacy is tested, but it is conceivable that this procedure may be available to all myocardial infarction patients, if long‐term effectiveness, prevention of heart failure and reduced morbidity are demonstrated.
The procedure at the current time is as follows: the bone marrow is harvested under general anaesthesia from the pelvic bone of the recipient using large suction needles. Thereafter, the BMMNC, CD34+ or CD133+ haematopoietic progenitor cells (BM‐HPCs) are enriched away from other bone marrow cells in sterile conditions by a specialised technician or scientist. The bone marrow harvest and separation of stem cells may take several hours. Unlike BMMNC, BM‐MSC have to be cultured in the laboratory for two to four weeks to obtain a large enough number of cells prior to their administration. The enriched or cultured cell populations are infused directly into the recipient's heart by a cardiologist during angioplasty (e.g. PCI) with a catheter allowing the administration of cells in a stop‐flow technique via a special balloon catheter (Strauer 2002). The time interval between the removal of the cells from the participant and their reinfusion varies.
The costs of the intervention may be high depending on the procedures used, and currently relate to the costs of the cell procedure (cell harvest) and the costs of the isolation of the stem/progenitor cells (approximately a 10th of the cost of the trial) or the cost of culturing cells in a dish.
How the intervention might work
Regardless of intensive preclinical and clinical research in the field in the past decade, the mode of action of cell therapies has remained unclear or at least controversial. Although transplanted cells are thought to benefit heart function through direct mechanisms, such as homing to the site of injury and differentiating into neighbouring cardiac tissues (Leri 2009), there is growing evidence that their benefit might be indirect. There is presently a shift in the regenerative concept of cell therapies in heart disease towards the hypothesis that cell‐based therapies primarily have a paracrine effect (for review see Bartunek 2010; Behfar 2014). Paracrine signalling is that in which the target cell is a different type of cell but it is close by the signal‐releasing cell. Transplanted cells would produce stimulatory cytokines, which may increase vascularity and collateral growth, promote cardiomyocyte proliferation, limit or reduce fibrosis and/or activate endogenous resident stem cells (Bartunek 2010; Behfar 2014; Cheng 2014). This could lead to reverse remodelling of the infarcted tissue and reduction in scar size.
Why it is important to do this review
In 2004, the first RCTs administering cell therapies as a treatment for AMI were reported (Chen 2004; Wollert 2004). Two years later, the number of RCTs published had increased significantly (Ge 2006; Huang 2006; Janssens 2006; Kang 2006; Karpov 2005; Lunde 2006; Ruan 2005; Schachinger 2006; Wollert 2004; Yao 2006). The first version of this review evaluated the clinical evidence from 13 RCTs, the majority of which had short‐term follow‐up (e.g. less than six months follow‐up) (Martin‐Rendon 2008a; Martin‐Rendon 2008b). Those first‐generation clinical trials were not powered to assess the effect of cell therapies on clinical outcomes such as mortality. The main aim of those trials was to assess the safety of the intervention and the benefit of the treatment, measuring left ventricular ejection fraction (LVEF) as surrogate outcome. We defined safety as the absence of adverse events (e.g. increased mortality and morbidity, increased risk of secondary infarction, restenosis and arrhythmias, development of heart failure) and efficacy as improvement in cardiac function associated with cell therapy.
The second version of this review, Clifford 2012, evaluated 33 RCTs and long‐term follow‐up data had started to emerge (Cao 2009; Grajek 2010; Jin 2008; Meluzin 2008; Penicka 2007; Piepoli 2010; Yao 2009; Zhukova 2009). In that update of the review we included 20 new studies. Unlike other systematic reviews where a total of 50 trials were assessed (Jeevanantham 2012), our systematic review was the first to determine that there was no evidence of a difference in the risk of mortality between treated participants and controls (Clifford 2012).
There is currently a high degree of uncertainty about the beneficial effect of cell therapies as treatment for AMI. Both RCTs (Hirsch 2011; Lunde 2006; Roncalli 2010; Schachinger 2006), and previous systematic reviews and meta‐analyses (Clifford 2012; Delewi 2014; Gyöngyösi 2015; Jeevanantham 2012), have shown divergent results. Additionally, in light of recent studies suggesting that there are inconsistencies in the reporting of clinical trials and that the effect size of the treatment is correlated with the number of discrepancies (Nowbar 2014), it is even more important to review the clinical evidence thoroughly.
We have extracted and analysed data collected from the newly identified and included studies using the same methodology as described in the previous versions of the review (Clifford 2012; Martin‐Rendon 2007; Martin‐Rendon 2008a; Martin‐Rendon 2008b). We have also carried out 'Risk of bias' assessment of the new included studies following the same methods as previously. We have performed a new meta‐analysis that includes all 41 studies. In this version of the systematic review, we have reduced the number or surrogate outcomes analysed to focus on clinical outcomes, LVEF and quality of life outcomes. As it has become clear that cell therapies for AMI are safe and have no major adverse effects, the main questions to address in this systematic review are whether the intervention is efficacious and has a clinical benefit, and whether the findings from this systematic review can inform ongoing or future trials.
Objectives
To determine the safety and efficacy of autologous adult bone marrow stem cells as a treatment for acute myocardial infarction (AMI), focusing on clinical outcomes.
Methods
Criteria for considering studies for this review
Types of studies
Randomised controlled trials.
Types of participants
Any participants with a clinical diagnosis of AMI with no restriction on age.
Types of interventions
Studies involving the administration of autologous adult bone marrow‐derived cells following successful revascularisation by angioplasty or cardiac surgery.
Participants in the comparator treatment arm of the trial would have had either no intervention or placebo (e.g. medium where the stem cells are suspended, or plasma). Trials where surgery (e.g. coronary artery bypass graft (CABG)) or percutaneous angioplasty (e.g. PCI) have been administered were eligible.
In summary:
-
any autologous human adult bone marrow stem cells;
-
any method of stem/progenitor cell isolation or enrichment;
-
any route of administration;
-
any co‐intervention (e.g. surgery or angioplasty); and
-
any single dose or multiple doses of intervention.
Types of outcome measures
Primary outcomes
-
All‐cause mortality
-
Cardiovascular mortality
-
Composite measures of major adverse cardiac events (MACE)
-
Periprocedural adverse events
Secondary outcomes
-
Morbidity including reinfarction, incidence of arrhythmias, incidence of restenosis, target vessel revascularisation and re‐hospitalisation for heart failure
-
Quality of life and performance status (if measured separately from a quality of life measurement)
-
Left ventricular ejection fraction (LVEF)
We assessed all outcomes at short‐term (less than 12 months) and long‐term (12 months or more) follow‐up.
In this version of the review, we have focused on clinical outcomes. However, the surrogate endpoint of LVEF is a standard, widely reported surrogate for cardiac function and has been retained as a reference point with other trials and systematic reviews in AMI. Surrogate outcomes other than LVEF reported in previous versions of this review, namely engraftment and survival of the infused stem cells, left ventricular end‐systolic volume, left ventricular end‐diastolic volume, wall motion score, stroke volume index and infarct size, are no longer included as outcomes.
Search methods for identification of studies
Electronic searches
We updated the searches, originally run in August 2007 (Appendix 1), in January 2011 (Appendix 2) and then again in March 2015 (Appendix 3). We identified relevant studies from searching the following:
-
Cochrane Central Register of Controlled Trials (CENTRAL 2015, Issue 2);
-
MEDLINE (OvidSP, 1946 to 11 March 2015);
-
EMBASE (OvidSP, 1974 to 11 March 2015);
-
CINAHL (EBSCOhost, 1982 to 11 March 2015);
-
PubMed (for e‐publications only, 11 March 2015);
-
LILACS (1982 to 11 March 2015);
-
KoreaMed (1997 to 11 March 2015);
-
IndMed (1986 to 11 March 2015);
-
PakMediNet (1995 to 11 March 2015);
-
Web of Science: Conference Proceedings Citation Index ‐ Science (CPCI‐S) (1990 to 11 March 2015).
Searching other resources
In addition, we carried out the following.
-
Handsearching of conference abstracts from relevant heart and/or stem cell conferences, e.g. the American Heart Association, International Society of Stem Cell Research (from 2005 to January 2011). Handsearching was not continued post‐January 2011, as these conference abstracts are now included within EMBASE.
-
Searches of three databases of ongoing trials, all performed on 11 March 2015:
-
-
ClinicalTrials.gov (https://clinicaltrials.gov/);
-
ISRCTN Register (http://www.isrctn.com/);
-
World Health Organization (WHO) International Clinical Trials Registry Platform (ICTRP) (http://apps,who.int/trialsearch/).
-
-
Searches of the reference lists of all identified eligible papers and relevant systematic and/or narrative reviews.
We applied no language or date restrictions.
Data collection and analysis
Selection of studies
The information specialist (CD) conducted the electronic search for potentially relevant papers and removed references that were duplicates, clearly irrelevant and/or included in previous search results. Two review authors (SF, EMR for this update) independently screened all titles and abstracts of references identified by the review search strategy for relevancy to the review question. We exclude studies that clearly did not meet the eligibility criteria at this stage. Two review authors (SF, EMR) independently assessed all other studies on the basis of their full text for inclusion/exclusion using the criteria indicated above (type of studies, participants, interventions and outcome measures). We resolved disagreements through discussion.
Data extraction and management
Two review authors (SF, HZ for this update) extracted data onto customised data extraction forms, which we created and piloted specifically for this review, and undertook data extraction for all eligible studies independently. Aside from details relating to the quality of included studies, we extracted the following two groups of data:
-
Trial characteristics: place of publication, date of publication, population characteristics, setting, detailed nature of intervention, detailed nature of comparator, detailed nature of outcomes. A key purpose of these data was to explain clinical heterogeneity between included studies independently from analysis of the results.
-
Results of included studies for each of the main outcomes indicated in the review question. For dichotomous outcomes, we recorded the numbers of outcomes in the treatment and control groups. For continuous outcomes, we recorded the mean and standard deviation. Where standard deviations of mean change from baseline values were not explicitly reported, where possible we calculated the standard deviation based on reported confidence intervals or P values as described in the Cochrane Handbook for Systematic Reviews of Interventions (Higgins 2011), and we used these values in the analysis. In the writing of this version of the review we identified a systematic error in the previous versions of the review in the calculation of standard deviations for mean change from baseline values. This issue has now been corrected; the discrepancies between the correct and previously reported values were small in all cases. In some studies it was not possible to calculate the value of the standard deviation and imputation techniques were deemed unsuitable due to the relatively high proportion of studies with missing standard deviations in some analyses (Higgins 2011). These studies, previously analysed as mean change from baseline values, are now incorporated in combined analyses using the mean endpoint value.
We resolved data extraction disagreements by consensus between the review authors. When disagreements regarding any of the above could not be resolved through discussion, we attempted to contact authors of the original trials to provide further details (see Dealing with missing data below). We then transcribed the data into the systematic review computer software Review Manager 5.3 (Review Manager 2014).
In light of the number of studies included in the previous version of this review that have had additional publications since, we checked all previous data included in the review. This resulted in a number of minor data errors being identified; these are corrected in the current version of the review. These errors made a negligible difference to the previous results and did not affect the conclusions.
Assessment of risk of bias in included studies
Two review authors (SF, HZ for this update), undertaking the data extraction independently, assessed the risk of bias for each trial using the criteria outlined in the Cochrane Handbook for Systematic Reviews of Interventions (Higgins 2011). We assessed the design, conduct and analysis of the trial using a three‐point scale: low, high or unclear risk of bias. To assess risks of bias, the authors included the following questions in the 'Risk of bias' table for each included trial:
-
Was the allocation sequence adequately generated?
-
Was allocation adequately concealed?
-
Was knowledge of the allocated intervention adequately prevented (i.e. blinded) throughout the trial?
-
Were incomplete outcome data adequately addressed for every outcome?
-
Were reports of the trial free of selective outcome reporting?
-
Was the trial apparently free of other problems that could put it at risk of bias?
For trials included in the previous version of this review, we re‐evaluated the risk of bias in the context of the revised outcomes and updated this accordingly. We resolved disagreements through discussion with a third review author.
A study of trials published in Chinese medical journals that were described as randomised found that a high proportion of these trials did not adhere to accepted methodology for randomisation and hence could not be deemed authentic RCTs (Wu 2009). It is now widely accepted that trials carried out in China may lack appropriate randomisation, therefore we deemed any Chinese studies for which methods of randomisation were not described and could not be clarified with trial authors to have a high risk of selection bias; we evaluated sensitivity to these trials through sensitivity analyses (see Sensitivity analysis section below).
Unit of analysis issues
In the analysis of quality of life outcomes, we converted Minnesota Living with Heart Failure (MLHF) scores to negative values in order to include these in a meta‐analysis with other measures on different scales using the standardised mean difference.
Dealing with missing data
We sought clarification of the extent of possible participant overlap between potentially related studies from nine trial authors by email contact. Eight authors responded and we reached the following conclusions through email correspondence:
-
Twenty treatment arm participants and 10 control arm participants were included in two trials published separately (Plewka 2009). Due to the extensive participant overlap and the shared protocol design of these two studies, we extracted and combined data as a single trial.
-
In a large trial of 200 participants (Tendera 2009), 12 patients were also included in a separate trial (Grajek 2010). In view of the small degree of overlap, we have extracted data from these trials separately and included as them independent studies in this review.
-
A 2014 publication by Ryabov et al was a long‐term follow‐up of an earlier trial already included in an early version of this review (Karpov 2005).
-
A 2012 conference abstract published by Turan et al described long‐term follow‐up of an earlier trial reported in full (Turan 2012).
The following issues are awaiting resolution:
-
The extent of possible participant overlap between two conference abstracts (Huang 2007b; Huang 2008), and four separate studies from the same research group (Ge 2006; Huang 2006; Huang 2007; Yao 2006), could not be confirmed as email contact with the authors was unsuccessful. As a result, we have listed both Huang 2007b and Huang 2008 as studies awaiting classification.
We contacted a further four authors of trials published in abstract form only at the time of study selection to establish whether these trials were expected to be published in full. Two of these trials have now been published in full (Hirsch 2011; Roncalli 2010), and we have since excluded one trial (Perez‐Oteyza 2006). No further publications have been identified for the fourth trial (Fernandez‐Pereira 2006); this trial is therefore included in studies awaiting classification. We contacted one trial author to clarify the publication of further follow‐up data (Roncalli 2010).
We made attempts to contact the authors of 20 included studies by email requesting additional information on the trial design and methodology, clarification regarding data discrepancies, further detail about patient demographics and/or additional data (Cao 2009; Colombo 2011; Chen 2004; Huang 2006; Huang 2007; Janssens 2006; Jazi 2012; Jin 2008; Lunde 2006; Nogueira 2009; Piepoli 2010; Ruan 2005; Schachinger 2006; Sürder 2013; Tendera 2009; Turan 2012; Wang 2014; Wohrle 2010; Xiao 2012; Yao 2006). Authors of five trials kindly responded as follows; key data provided by authors included the following:
-
Lunde 2006: mean change from baseline echocardiography, MRI and SPECT data were confirmed.
-
Piepoli 2010: the number of participants included in the analyses and details of withdrawals and exclusions were clarified; mean and standard deviation values for echocardiography data were provided.
-
Schachinger 2006: surrogate endpoint data from MRI at 24‐month follow‐up were provided.
-
Tendera 2009: mean and standard deviation values for MRI data were provided.
-
Turan 2012: details of the number of withdrawals and exclusions with reasons were provided, together with clarification of patient demographics.
Assessment of reporting biases
Although we believe that we made every effort to identify unpublished studies, we assessed publication bias for the primary outcome of mortality using a funnel plot and with a formal test for publication bias using Egger's test for asymmetry (Egger 1997), implemented with the statistical software programme R v2.14.1 (R Core Team 2013).
Data synthesis
We undertook meta‐analyses using Review Manager 5.3 (Review Manager 2014), using random‐effects models throughout due to the anticipated heterogeneity arising from differences in participant characteristics, interventions and duration of follow‐up. This differs from the previous version of the review in which fixed‐effect models were used for meta‐analyses in the first instance. Although quantitative synthesis was the main method of analysis, we incorporated insights from a qualitative evaluation of studies for an overall interpretation of the data. We based conclusions on patterns of results identified across clearly tabulated results of included studies as well as summary measures, taking both direction and magnitude of any mean effect sizes from random‐effects models into account. We included all studies in the main analyses irrespective of risk of bias; we performed sensitivity analyses for risk of selection, performance and attrition bias as described in the Sensitivity analysis subsection below. We summarised periprocedural adverse events for each trial in tabular form and evaluated them descriptively.
Within each included trial, all participants were analysed in the treatment groups to which they had been randomised. We have undertaken an available case analysis, including all participants who were randomised to treatment and were included in the analysis, irrespective of whether or not they received their randomised treatment.
We carried out separate analyses according to the duration of follow‐up after treatment: short‐term (less than 12 months) and long‐term (12 months or more). We expressed dichotomous data for each arm in a particular trial as a proportion or risk and the treatment effect as a risk ratio (RR) with 95% confidence intervals (CIs). We expressed continuous data for each arm in a particular trial as a mean and standard deviation, and the mean treatment effect as the mean difference (MD) if outcomes were measured in the same way across trials. For outcomes measured using different scales (physical capacity and quality of life measures), we combined the treatment effect data and analysed them using the standardised mean difference (SMD).
Although we intended to analyse continuous outcomes as mean change from baseline, several studies only reported baseline and endpoint data. Where possible, we calculated the standard deviation of the mean change from baseline based on reported confidence intervals or P values as described in the Cochrane Handbook for Systematic Reviews of Interventions (Higgins 2011), and we used these values in the analysis. However, for several studies, insufficient information was reported to calculate the standard deviation. The mean difference based on the change from baseline can be assumed to address the same underlying intervention effects as an analysis based on final measures (i.e. the differences in mean final values will on average be the same as the differences in mean change scores). Therefore we combined studies reporting mean change from baseline values with those reporting endpoint values (using preferentially mean change values where both were reported), but presented mean change and endpoint values separately as well as in combined analyses for clarity, as suggested in the Cochrane Handbook for Systematic Reviews of Interventions (Higgins 2011). We did not conduct this pooling of studies by method of reporting of continuous measures for analyses of quality of life or physical capacity, since the assumption of consistent underlying effects does not hold for standardised mean differences.
Six trials reported multiple intervention groups. In order to avoid double‐counting of controls, in the main analyses we pooled data from active intervention arms across different doses (high dose/low dose (Meluzin 2008) or high/medium/low dose (Quyyumi 2011)), delivery routes (arterial or venous) (Nogueira 2009), timing of cell delivery (early or late) (Sürder 2013), type of cells (selected or unselected (Tendera 2009)) or number of cell doses (Yao 2009).
We produced a 'Summary of findings' table for the primary outcomes of all‐cause mortality, cardiovascular mortality and the composite measure of major adverse clinical cardiac events at both short‐term and long‐term follow‐up, using the GRADEpro GDT software (GRADEpro GDT 2014). We calculated risk ratios excluding trials with a high risk of randomisation sequence selection bias, assuming an underlying control risk from the observed data from included trials.
Trial sequential analysis
Cumulative meta‐analyses may result in type I errors due to an increased risk of random error arising from repeated testing of accumulating data (Borm 2009; Hu 2007; Lan 2003). Trial sequential analysis provides a method of adjusting the thresholds for statistical significance while maintaining the overall desired type I error rate (Wettersley 2008). These adjusted thresholds are known as trial sequential monitoring boundaries (TSMBs). If the cumulative Z‐curve crosses the TSMB, then statistical significance has been reached whilst maintaining the overall type I error rate. Futility boundaries may also be produced such that if the cumulative Z‐curve crosses the futility threshold, there is evidence that the two treatments do not differ more than the anticipated effect size. Trial sequential analysis also provides a required information size, the meta‐analysis information size needed to detect a statistically significant effect given a defined underlying model. We applied trial sequential analysis to the primary outcomes of all‐cause mortality, cardiovascular mortality and composite MACE, assuming a long‐term mortality incidence rate of 6.1% in the control group (as observed in our control data); we estimated control group incidence rates for cardiovascular mortality and composite MACE from the observed control data similarly. For each outcome we calculated the information size required for a relative risk reduction of 35% (equivalent to the reduce risk of mortality associated with PCI (Hartwell 2005). Using the TSA program (TSA 2011), we calculated two‐sided TSMBs using the O'Brien‐Fleming β‐spending function for an overall 5% type I error rate and 80% power. We made a model variance based heterogeneity correction to incorporate the minimal heterogeneity observed for the outcomes of cardiovascular mortality and composite major adverse clinical events. We made no adjustment for heterogeneity for the outcome of mortality, consistent with the lack of heterogeneity observed in the meta‐analysis. We produced no futility boundaries as the information fraction was too small to produce an inner wedge futility area from the trial sequential analysis program. We included studies that had reported outcomes at more than one long‐term follow‐up time point in the trial sequential analysis according to the time at which they first reported long‐term follow‐up (and hence were included in meta‐analyses).
Subgroup analysis and investigation of heterogeneity
A range of different methods were used to measure LVEF across studies (magnetic resonance imaging (MRI), left ventricular angiography (LVA), single photon emission computed tomography (SPECT), echocardiography and radionuclide ventriculography (RNV)), with several studies reporting LVEF as an outcome using more than one method of measurement. The limitations of some of these methods are well known (Arnesen 2007). Consistent with the previous version of this review, we subgrouped analyses of LVEF according to the measurement method used.
We grouped trials according to baseline cardiac function (defined by mean baseline LVEF < 45% or ≥ 45%), mean cell dose (≤ 108, > 108 and ≤ 109, > 109), timing of stem cell administration (within 10 days or more than 10 days after AMI) and use of heparinised cell solution. Planned subgroup analysis of the type/route of cell delivery was not possible as all but one trial, Nogueira 2009, administered cells into the coronary artery.
We performed a priori subgroup analyses for the primary outcome of mortality. For other outcomes with substantial observed heterogeneity (I2 ≥ 50%) (Higgins 2003), and a minimum of two studies in each subgroup, we investigated potential sources of heterogeneity by performing the subgroup analyses described above as exploratory analyses, and by visual inspection of forest plots with consideration of individual trial characteristics.
For trials with multiple active intervention arms, in subgroup analyses where the intervention arms were stratified across the subgrouping strata, we used the single control group as the comparator in each subgroup.
Sensitivity analysis
We assessed the robustness of results for the primary outcomes of all‐cause mortality, cardiovascular mortality and composite measures of MACE for sensitivity to risk of selection bias (excluding studies with a high risk of bias from random sequence generation) and attrition bias (excluding studies with a high or unclear risk of attrition bias). We also assessed the primary clinical outcomes for sensitivity to risk of performance bias (excluding those studies with a known lack of blinding of participants and clinicians).
We also assessed the primary outcome of mortality and any additional outcomes that showed evidence of a difference between trial arms for sensitivity to differences in the route of cell delivery, by excluding one trial that administered cells into the coronary artery (Nogueira 2009). This trial did not report the primary outcomes of cardiovascular mortality and composite measures of MACE.
Differences in methods of reporting for continuous outcomes across trials led us to combine mean change from baseline and endpoint data for LVEF (see Data synthesis above). We have presented the results separately as well as in combination for clarity and to assess the sensitivity of the results to the method of reporting.
Results
Description of studies
Given that a wide variety of products and terms have been used in the comparator arms of the included trials, for ease of reference we will use the term 'control' throughout this review to refer to the comparator treatment arm.
We identified a total of 6434 records (6293 references and 141 ongoing trial records) from electronic searches of the CENTRAL, MEDLINE, EMBASE, SRI Transfusion Evidence Library, ClinicalTrials.gov, CDSR, DARE, CINAHL and Current Controlled Trials databases to March 2015. Additionally, handsearching of the American Heart Association Scientific Sessions, European Society of Cardiology Congress and World Congress of Cardiology annual conference proceedings from 2005 to January 2011 identified an additional 96 references, and we identified four further references from reference lists of reviews identified in the database search to give a total of 6534 citations. De‐duplication and removal of all previously screened references by the SRI Information Specialist (CD) excluded 1753 references. Screening of the remaining 4781 records (4640 references and 141 ongoing trial records) by two review authors independently resulted in exclusion of 4465 records (4370 references and 95 ongoing trials), which were clearly irrelevant. Detailed assessment of the remaining 270 references and 46 ongoing trial records identified a total of 170 references (93 full papers and 77 abstracts) and 18 ongoing trial records, which described a total of 41 trials included in this review (see PRISMA study flow diagram in Figure 1).

Study flow diagram.
Trials excluded from the review
We excluded 53 trials (described in 77 references and seven ongoing trial records) from the review following full‐text eligibility assessment. In summary, the reasons for exclusion were as follows: six studies were not classified as AMI, 12 studies did not include a control arm, seven studies were non‐randomised controlled trials, five studies infused G‐CSF mobilised cells but did not administer G‐CSF to the control arm, three studies mobilised cells by G‐CSF but did not administer cells, five studies did not use autologous bone marrow stem cells, two studies were systematic reviews or meta‐analyses, seven studies were commentaries or summaries, two studies were experimental, in two studies the outcomes were not relevant, one trial treated patients with acute myocardial infarction and 'old' myocardial infarction and the data were combined, and one trial had no relevant outcomes (see Characteristics of excluded studies).
Trials awaiting assessment and ongoing trials
Twelve trials described in 13 references appeared to meet the eligibility criteria for this review but reported insufficient information for the trials to be included (see Characteristics of studies awaiting classification). We await further publications on these trials. We identified 22 eligible ongoing trials described in 10 references and 21 ongoing trial database records (see Characteristics of ongoing studies). Current ongoing trials intend to recruit over 4750 participants in total and include the pan‐European Phase III trial (the BAMI trial) (NCT01569178), which is aiming to recruit 3000 participants and is expected to be completed by May 2018. These ongoing trials will be included in future updates of the review.
Trials included in the review
We translated six trials from Chinese (Mandarin) to English (Huang 2006; Huang 2007; Jin 2008; Yao 2006; You 2008; Xiao 2012), and two from Russian to English (Karpov 2005; Zhukova 2009), prior to inclusion in this review, including one report of long‐term follow‐up, which we translated using Google Translate (https://translate.google.com/) for this update. An English version of a seventh Chinese paper was identified (Ruan 2005). Following careful cross‐checking between the Chinese and English versions of the paper, which confirmed that both papers reported the same data from one trial, we used the English version of the paper within this review.
One trial included in the previous version of the review was previously referred to as Meyer 2006. This study is now referred to as Wollert 2004 in accordance with the first publication that reported results from this trial. Three trials included in the previous version of the review are now not included: two trials that used G‐CSF to mobilise stem cells in the cell therapy arm did not give G‐CSF to the control group and in view of the lack of this co‐intervention in the control arm, these studies are now excluded (Kang 2006; Li 2006), and one trial published in abstract form only has been reclassified as awaiting classification as there were insufficient data provided for inclusion in any analyses (Fernandez‐Pereira 2006).
Five trials had three‐arm comparisons (Meluzin 2008; Nogueira 2009; Sürder 2013; Tendera 2009; Yao 2009), and one trial had a four‐arm comparison (Quyyumi 2011). In Meluzin 2008, the two treatment arms compared different doses (low dose or high dose) of stem/progenitor cells administered. Likewise, in Quyyumi 2011, the three treatment arms compared low, moderate and high‐dose administrations of selected CD34+ cells. The two treatment arms in Yao 2009 compared a single dose (SD arm) of stem/progenitor cells at three to seven days post‐AMI to a repeated dose (DD arm) ‐ i.e. administration of stem/progenitor cells at both three to seven days and three months post‐AMI. The two treatment arms in Nogueira 2009 compared intracoronary artery (arterial group – AG) delivery of stem/progenitor cells against intracoronary venous (venous group – VG) delivery of stem/progenitor cells. In Tendera 2009, the two treatment arms compared selected CD34+ CXCR4+ (selected –S) stem/progenitor cell administration versus non‐selected (unselected – U) mononuclear cell administration. Sürder 2013 included two intervention groups comparing either five to seven days (early ‐ E) or three to four weeks (late ‐ L) cell administration. As stated in the Methods section, we pooled active intervention arms for the main analyses and compared this with the single control group.
We included a total of 41 trials; the number of participants included in each trial ranged from 11 to 204, and a total of 2732 participants (1564 cell therapy and 1168 controls) were included in the 41 comparisons of the review. The mean age of participants across all included trials ranged from 46.6 years (Jazi 2012) to 65.2 years (Piepoli 2010), with the mean age of participants between 50 and 60 years in all but seven trials (Table 1). All trials included predominantly male participants, with the per cent male ranging from 60.6% (Wang 2014) to 100% (Colombo 2011; Zhukova 2009); four trials reported female participants in one arm of the trial only (Gao 2013; Ge 2006; Penicka 2007;Ruan 2005) (Table 1). Ethnicity data were not available.
| Study ID | Country of study | Patient population | Mean (SD) age of participants (years) | % Male | No. randomised participants receiving intervention | No. randomised participants receiving comparator | Mean duration of follow‐up |
| Brazil | STEMI with LVEF < 45%; successful PCI | n/r | n/r | 11 | 11 | 12 months | |
| China | STEMI; PCI within 12 hours, often with drug‐eluting stent implantation | BMMNC: 50.7 (SEM 1.1) | BMMNC: 95.1% | 41 | 45 | 48 months | |
| China | AMI; PCI within 12 hours, mostly with stent implantation | BMMNC: 58 (7.0) | BMMNC: 94% | 34 | 35 | 6 months | |
| Italy | Large anterior STEMI; PCI with bare metal stent implantation within 12 hours | CD133+: median 54 (range 47 to 60) | CD133+: 100% | 5 | 5 | 12 months | |
| China | Acute STEMI; PCI with stent implantation within 12 hours | BM‐MSC: 55.0 (SEM 1.6) | BM‐MSC: 100% | 21 | 22 | 24 months | |
| China | First STEMI within 24 hours; PCI with stent implantation | BMMNC: 58 (11) | BMMNC: 80% | 10 | 10 | 6 months | |
| Poland | First anterior AMI; PCI within 12 hours with bare metal stent implantation | BMMNC: 49.9 (8.4) | BMMNC: 87% | 31 | 14 | 12 months | |
| Hirsch 2011 | The Netherlands | First STEMI; PCI with stent implantation within 12 hours | BMMNC: 56 (9) | BMMNC: 84% | 69 | 65 | 60 months |
| China | AMI; PCI within 24 hours | BMMNC: 57.3 (10.1) | BMMNC: 65% | 20 | 20 | 6 months | |
| China | AMI; PCI within 24 hours with bare metal (35%) or drug‐eluting (65%) stent implantation | BMMNC: 54.8 (5.8) | BMMNC: 85% | 20 | 20 | 6 months | |
| Huikuri 2008 | Finland | STEMI; thrombolytic drugs initiated within 12 hours | BMMNC: 60 (10) | BMMNC: 90% | 40 | 40 | 6 months |
| Belgium | STEMI; PCI with bare metal stent implantation at median 3.7 hours (IQR 2.5 to 7.6) | BMMNC: 55.8 (11) | BMMNC: 82% | 33 | 34 | 4 months | |
| Iran | Anterior MI within 1 month with a history of anterior MI and LVEF < 35%; PCI | BMMNC: 48.0 (SEM 2.5) | BMMNC: 66% | n/r | n/r | 6 months | |
| China | AMI; thrombolytic drugs and PCI | BMMNC: 62.3 (7.7) | BMMNC: 71.4% | 14 | 12 | 12 months | |
| Russia | STEMI; PCI with bare metal stent implantation within 6.6 (4.9) hours and thrombolytic drugs | BMMNC: 55.2 (8.6) | BMMNC: 90% | 28 | 34 | 8.2 (0.72) years | |
| Lee 2014 | South Korea | STEMI within 24 hours enrolled < 72 hours after revascularisation by | BM‐MSC: 53.9 (10.5) | BM‐MSC: 90.0% | 40 | 40 | 6 months |
| Lunde 2006 | Norway | Anterior STEMI; PCI within 2 to 24 hours | BMMNC: 58.1 (8.5) | BMMNC: 84% | 50 | 51 | 36 months |
| Czech Republic | First STEMI; PCI with stent implantation within 12 hours or 3 days | BMMNC: 54 (SEM 2) | BMMNC: 90% (HD), 95% (LD) | n/r (a) | n/r (a) | 12 months | |
| Nogueira 2009 | Brazil | STEMI; thrombolytic drugs and PCI with stent implantation within 24 hours | BMMNC: 59.7 (14.3) (AG), 53.6 (8.3) (VG) | BMMNC: 71% (AG), 70% (VG) | 24 (14 AG, 10 VG) | 6 | 6 months |
| Czech Republic | First anterior STEMI and LVEF ≤ 50% | BMMNC: 61 (14) | BMMNC: 71% | 17 | 10 | 24 months | |
| Piepoli 2010 | Italy | Anterior STEMI; PCI with stent implantation within 2 to 6 hours | BMMNC: 63.1 (SEM 2.7) | BMMNC: 68.4% | 19 | 19 | 24 months |
| Poland | First anterior STEMI and LVEF < 40%; PCI within 12 hours | BMMNC: 59 (9) | BMMNC: 68% | 40 | 20 | 24 months | |
| Quyyumi 2011 | USA | Acute STEMI and LVEF ≤ 50% | CD34+: median 50.5 (IQR 45 ‐ 53) (HD), 63.0 (IQR 57 ‐ 66) (MD), 52.0 (IQR 51 ‐ 52) (LD) | CD34+: 100% (HD), 80% (MD), 80% (LD) | 16 (5 LD, 5 MD, 6 HD) | 15 | 12 months |
| Roncalli 2010 | France | Acute STEMI and LVEF ≤ 45%; PCI with bare metal stent implantation within 24 hours | BMMNC: 56 (12) | BMMNC: 80.8% | 52 | 49 | 12 months |
| China | AMI admitted within mean 12.1 (12.6) hours of onset; PCI | BMMNC: 61 (8) | BMMNC: 88.9 | 9 | 11 | 6 months | |
| Schachinger 2006 | Germany; Switzerland | Acute STEMI and visual estimated LVEF ≤ 45%; PCI with stent implantation at mean 7.5 (8.0) hours | BMMNC: 55 (11) | BMMNC: 82% | 101 | 103 | 60 months |
| Spain | Anterior STEMI within 12 hours; PCI (some with stent) or thrombolytics | BMMNC: 52 (12) | BMMNC: 80% | 10 | 10 | 3 months | |
| Sürder 2013 | Switzerland | Large STEMI with LVEF < 45%; thrombolytics and PCI with stent within 24 hours | BMMNC: median 55 (IQR 15) (E), 62 (IQR 15) (L) | BMMNC: 86.2% (E), 82.5 (L) | 133 (66 E, 67 L) | 67 | 12 months |
| Tendera 2009 | Poland | Anterior AMI and LVEF ≤ 40% | CD34/CXCR4+: median 58 BMMNC: median 55 | CD34/CXCR4+: 63.7% BMMNC: 70.6% | 160 (80 CD34/CXCR4+, 80 BMMNC) | 40 | 6 months |
| USA | First anterior STEMI; PCI mostly with drug‐eluting stent implantation | BMMNC: median 52.5 (IQR 43 ‐ 64) | BMMNC: 83.3% | 30 | 10 | 15 months | |
| Traverse 2011 | USA | STEMI with LVEF ≤ 45%; PCI with stent, mostly drug‐eluting, at median 3.4 (IQR 2.3 to 14.3) hours | BMMNC: 57.6 (11) | BMMNC: 79% | 59 | 29 | 6 months |
| Traverse 2012 | USA | Anterior STEMI with LVEF < 45%; PCI with stent, mostly drug‐eluting | BMMNC: 55.6 (10.8) (day 3)/58.2 (11.3) day 7) | BMMNC: 88.4% (day 3)/86.1% (day 7) | 43 (day 3) | 24 (day 3) | 12 months |
| Germany | Acute STEMI; PCI with stent implantation | BMMNC: 61 (15) | BMMNC: 67% | 42 | 20 | 12 months | |
| China | Acute STEMI; PCI predominantly with stent implantation within 8 hours | BM‐MSC: 58 (10.2) | BM‐MSC: 67.9% | 30 | 30 | 6 months | |
| Wohrle 2010 | Germany | AMI; PCI with stent, some drug eluting, within 6 to 48 hours | BMMNC: 61.0 (8.1) | BMMNC: 90% | 29 | 13 | 36 months |
| Wollert 2004 | Germany | STEMI within 5 days; PCI with bare metal stent implantation, some with thrombolytic drugs | BMMNC: 53.4 (14.8) | BMMNC: 67% | 33 | 32 | 60 months |
| China | AMI; undergoing elective PCI within 4 weeks of AMI | BM‐MSC: 60.4 (8.9) | BM‐MSC: 58.8% | 17 | 21 | 3 months | |
| China | STEMI within 1 week; PCI | BMMNC: 58.3 (9.5) | BMMNC: 89.1% | 92 | 92 | 30 months | |
| China | First anterior STEMI; PCI within 12 hours | BMMNC: 52.1 (6.3) (SD), 51.3 (7.4) (DD) | BMMNC: 83.3& (SD), 80.0% (DD) | 30 (15 SD, 15 DD) | 15 | 12 months | |
| China | AMI within 24 hours; thombolytic reperfusion | BM‐MSC: 60.5 | BM‐MSC: 71.4% | 7 | 16 | 8 weeks | |
| Russia | MI of the front wall; thrombolytic drugs and/or PCI with stent implantation | BMMNC: 48 (7) | BMMNC: 100% | 8 | 3 | 36 months |
STEMI, ST‐segment elevation myocardial infarction; AMI, acute myocardial infarction; PCI, percutaneous coronary intervention; LVEF, left ventricular ejection fraction; BMMNC, bone marrow mononuclear cells; BM‐MSC, bone marrow mesenchymal stem cells; SEM, standard error of the mean; SD, standard deviation; LD, low dose; MD, moderate dose; HD, high dose; AG, arterial group; VG, venous group; E, early cells; L, late cells; S, selected cells; U, unselected cells; SD, single dose; DD, double dose
(a)Meluzin 2008: 73 participants were randomised in total ‐ the number randomised to each group was not reported.
The trials included in the review were conducted in 17 countries, which included Belgium (Janssens 2006), Brazil (Angeli 2012; Nogueira 2009), China (Cao 2009; Chen 2004; Gao 2013; Ge 2006; Huang 2006; Huang 2007; Jin 2008; Ruan 2005; Wang 2014; Xiao 2012; Yao 2006; You 2008), Czech Republic (Meluzin 2008; Penicka 2007), Finland (Huikuri 2008), France (Roncalli 2010), Germany (Turan 2012; Wohrle 2010; Wollert 2004), Iran (Jazi 2012), Italy (Colombo 2011; Piepoli 2010; Yao 2009), the Netherlands (Hirsch 2011), Norway (Lunde 2006), Poland (Grajek 2010; Plewka 2009; Tendera 2009), Russia (Karpov 2005; Zhukova 2009), South Korea (Lee 2014), Spain (Suarez de Lezo 2007), Switzerland (Sürder 2013), and the USA (Quyyumi 2011; Traverse 2010; Traverse 2011; Traverse 2012), and one trial was carried out in Germany and Switzerland (Schachinger 2006).
Twenty‐three trials compared the active intervention (autologous bone marrow stem/progenitor cells) with no intervention and 18 trials compared the active intervention with placebo (Table 2). The majority of trials used PCI as the primary treatment for AMI. Thrombolytic therapy without PCI was used as the primary treatment in all patients in two trials (Huikuri 2008; You 2008), and some patients in two trials (Lee 2014; Zhukova 2009). Five trials used PCI in combination with thrombolytic therapy either in all patients (Jin 2008; Karpov 2005; Nogueira 2009; Sürder 2013), or in some patients (Wollert 2004) (Table 1). All trials maintained the patients with a standard set of drugs, including aspirin, clopidogrel, heparin, β‐blockers, statins, angiotensin converting enzyme (ACE) inhibitors, nitrates and/or diuretics.
| Study ID | Time of cell administration | Intervention given by: | Route of cell administration | Intervention cell type | How are cells obtained? (*) | What were they re‐suspended in? | Dose administered? | Comparator arm (placebo or control) |
| 5 to 9 days after AMI | Cardiologist | Infusion into IRCA | BMMNC | n/r | n/r | 260 (160) million cells | Placebo (n/r) | |
| 7 days after PCI | Cardiologist | Infusion into IRCA | BMMNC | BM aspiration (**) | Heparinised saline | 500 million cells | Placebo (heparinised saline) | |
| Mean 18.4 (0.5) days after PCI | Cardiologist | Infusion into IRCA | BMMNC | BM aspiration (**) | Heparinised saline | 48,000 (60,000) million cells | Placebo (heparinised saline) | |
| Day 9 to 16 after PCI | Cardiologist | Infusion into IRCA | CD133‐positive cells | BM aspiration (**), immunomagnetic selection to isolate CD133‐positive cells | 0.9% saline solution and 10% human serum albumin | Median (range): 5.9 (4.9 to 13.5) million cells | No additional therapy (Control) | |
| Mean 17.1 (0.6) hours after PCI | Cardiologist | Infusion into IRCA | BM‐MSC | BM aspiration (**), culture for 14 days to select MSC | Heparinised saline | 3.08 (0.52) million cells | No additional therapy (Control) | |
| Within 15 hours of AMI | Cardiologist | Infusion into IRCA | BMMNC | n/r | n/r | 40 million cells | Placebo (n/r) | |
| 5 to 6 days after PCI | Cardiologist | Infusion into IRCA | BMMNC | BM aspiration (**) | X‐vivo 15 medium and 2% autologous plasma | 410 (180) million cells | No additional therapy (Control) | |
| Hirsch 2011 | 3 to 8 days after PCI | Cardiologist | Infusion into IRCA | BMMNC | BM aspiration (**) | Heparinised saline and 4 % human serum albumin | 296 (164) million cells | No additional therapy (Control) |
| Within 2 hours of PCI | Cardiologist | Infusion into IRCA | BMMNC | BM aspiration (**) | Heparinised saline | 180 (420) million cells | Placebo (heparinised saline) | |
| Within 2 hours of PCI | Cardiologist | Infusion into IRCA | BMMNC | BM aspiration (**) | Heparinised saline | 120 (650) million cells | Placebo (heparinised saline) | |
| Huikuri 2008 | Mean 70 (36) hours after thombolysis | Cardiologist | Infusion into IRCA | BMMNC | BM aspiration (**) | Heparinised saline and 50% autologous serum | 402 (196) million cells | Placebo (heparinised saline and 50% autologous serum) |
| Within 20 hours of PCI | Cardiologist | Infusion into IRCA | BMMNC | BM aspiration (**) | Heparinised saline and 5% autologous serum solution | 172 (72) million cells | Placebo (heparinised saline and 5% autologous serum) | |
| Within 1 month of AMI | Cardiologist | Infusion into IRCA | BMMNC | BM aspiration (**) | M199 medium containing VEGF, bFGF, IGF‐1 and 10% human serum | 2460 (SEM 840) million cells | No additional therapy (Control) | |
| At least 7 to 10 days after AMI | Cardiologist | Infusion into IRCA | BMMNC | BM aspiration (**) | Heparinised saline | 62.7 (17.5) million cells | No additional therapy (Control) | |
| 7 to 21 days after AMI | Cardiologist | Infusion into IRCA | BMMNC | BM aspiration (**) | n/r | 88.5 (49.2) million cells | No additional therapy (Control) | |
| Lee 2014 | 25 (2.4) days after BM aspiration at 3.8 (1.5) days after admission | Cardiologist | Infusion into IRCA | BM‐MSC | BM aspiration (**), culture for 2 to 3 weeks to isolate MSC | n/r | 72 (9) million cells | No additional therapy (Control) |
| Lunde 2006 | 4 to 8 days after AMI | Cardiologist | Infusion into IRCA | BMMNC | BM aspiration (**) | Heparinised plasma | Median (interquartile range): 68 (54 to 130) million cells | No additional therapy (Control) |
| 5 to 9 days (mean 7 (0.3) days) after AMI | Cardiologist | Infusion into IRCA | BMMNC | BM aspiration (**) | n/r | LD: 10 million cells (range: 9 to 20 million) HD: 100 million cells (90 to 200 million cells) | No additional therapy (Control) | |
| Nogueira 2009 | AG: 3 to 6 days (mean 5.5 (1.28) days) after PCI VG: 3 to 6 days (mean 6.1 (1.37) days) after PCI | Cardiologist | Infusion into IRCA (AG) or IRCV (VG) | BMMNC | BM aspiration (**) | Saline solution and 5% human serum albumin | 100 million cells | No additional therapy (Control) |
| 4 to 11 days (median 9 days) after PCI | Cardiologist | Infusion into IRCA | BMMNC | BM aspiration (**) | n/r | 2,640 million cells | No additional therapy (Control) | |
| Piepoli 2010 | 4 to 7 days after AMI | Cardiologist | Infusion into IRCA | BMMNC | BM aspiration (**) | Phosphate buffered saline ‐ EDTA and 5% human serum albumin | 249 million cells | No additional therapy (Control) |
| 3 to 11 days (mean 7 (2) days after AMI | Cardiologist | Infusion into IRCA | BMMNC | BM aspiration (**) | Heparinised saline | 144 (49) million cells | No additional therapy (Control) | |
| Quyyumi 2011 | LD: median 191.4 (IQR 167 to 201) hours, MD: 210.0 (IQR 194 to 210) hours, HD: 207.3 (IQR 191 to 215) hours after AMI | Cardiologist | Infusion into IRCA | CD34‐positive cells | BM aspiration (**), immunomagnetic selection to isolate CD34‐positive cells | Heparinised phosphate buffered saline, 40% autologous serum and 1% human serum albumin | LD: 4.8 (0.4) million cells MD: 9.9 (0.7) million cells HD: 14.3 (1.6) million cells | No additional therapy (Control) |
| Roncalli 2010 | At 7 to 10 days (mean 9 (SD 1.7)) days | Cardiologist | Infusion into IRCA | BMMNC | BM aspiration (**) | 4% human serum albumin solution | 98.3 (8.7) million cells | No additional therapy (Control) |
| Within 2 hours of successful PTCA | Cardiologist | Infusion into IRCA | BMMNC | n/r | Diluted autologous serum | n/r | Placebo (diluted autologous serum) | |
| Schachinger 2006 | Within 5 days (mean 4.3 (1.3) days) of PCI | Cardiologist | Infusion into IRCA | BMMNC | BM aspiration (**) | X‐VIVO medium and 20% autologous serum | 236 (174) million cells | Placebo (X‐VIVO medium and 20% autologous serum) |
| 5 to 12 days (mean 7 (2) days) after AMI | Cardiologist | Infusion into IRCA | BMMNC | BM aspiration (**) | Heparinised saline | 900 (300) million | Placebo (heparinised saline) | |
| Sürder 2013 | 5 to 7 days (E) or 3 to 4 weeks (L) after PCI | Cardiologist | Infusion into IRCA | BMMNC | BM aspiration (**) | Serum‐free medium and 20% of autologous serum | E: 159.7 (125.8) million cells L: 139.5 (120.5) million cells | No additional therapy (Control) |
| Tendera 2009 | Median 7 (IQR 3 to 12) days after PCI | Cardiologist | Infusion into IRCA | Selected cells (S): CD34/CXCR4‐ positive cells Unselected cells (U): BMMNC | BM aspiration (**). Selected cells: immunomagnetic selection to isolate CD34/CXCR4‐positive cells | Phosphate‐buffered saline | S: 1.9 million cells U: 178 million cells | No additional therapy (Control) |
| 3 to 10 days (median 4.5 (IQR 4 to 7) days) after PCI | Cardiologist | Infusion into IRCA | BMMNC | BM aspiration (**) | 0.9% saline solution and 5% human serum albumin | 100 million cells | Placebo (0.9% saline solution and 5% human serum albumin) | |
| Traverse 2011 | 2 to 3 weeks (median 17.5 (IQR 15.5 to 20.0) days) after AMI | Cardiologist | Infusion into IRCA | BMMNC | BM aspiration (**) | 0.9% saline solution and 5% human serum albumin | 147 (17) million cells | Placebo (0.9% saline solution and 5% human serum albumin) |
| Traverse 2012 | 3 days or 7 days after AMI | Cardiologist | Infusion into IRCA | BMMNC | BM aspiration (**) | 0.9% saline solution and 5% human serum albumin | 150 million cells | Placebo (0.9% saline solution and 5% human serum albumin) |
| 7 days after AMI | Cardiologist | Infusion into IRCA | BMMNC | BM aspiration (**) | n/r | n/r | No additional therapy (control) | |
| 15 (1) days after PCI | Cardiologist | Infusion into IRCA | BM‐MSC | BM aspiration (**) and culture of MSC | Heparinised saline | 100 million cells | Placebo (heparinised saline) | |
| Wohrle 2010 | 5 to 7 days (median 6.1 (IQR 5.5 to 7.3) days) after AMI | Cardiologist | Infusion into IRCA | BMMNC | BM aspiration (**) | 0.9% saline solution, 2% human serum albumin and 0.1% autologous erythrocytes | 381 (130) million cells | Placebo (0.9% saline solution, 2% human serum albumin and 0.1% autologous erythrocytes) |
| Wollert 2004 | 4.7 (1.3) days after PCI | Cardiologist | Infusion into IRCA | BMMNC | BM aspiration (**) | Heparinised saline | 2460 (940) million cells | No additional therapy (Control) |
| Within 4 weeks of AMI | Cardiologist | Infusion into IRCA | BM‐MSC | BM aspiration (**) and culture of MSC | n/r | 460 (160) million cells | Placebo (heparinised saline) | |
| Within 7 days of AMI | Cardiologist | Infusion into IRCA | BMMNC | BM aspiration (**) | Lymphocyte isolation medium | 210 (370) million cells | No additional therapy (control) | |
| SD: 3 to 7 days after PCI DD 3 to 7 days after PCI; second dose at 3 months | Cardiologist | Infusion into IRCA | BMMNC | BM aspiration (**) | Heparinised plasma | SD: 410 million cells DD: 190 (SE 120) million cells | Placebo (heparinised plasma) | |
| At day 14 | Cardiologist | Infusion into IRCA | BM‐MSC | BM aspiration (**), second centrifugation and culture of MSC | n/r | 75 million cells | No additional therapy (control) | |
| 14 to 19 days after AMI | Cardiologist | Infusion into IRCA | BMMNC | BM aspiration (**) | Autologous serum | 50 million cells | No additional therapy (control) |
AMI ‐ acute myocardial infarction, PCI ‐ percutaneous coronary intervention, BM ‐ bone marrow, PTCA ‐ percutaneous transluminal coronary angioplasty, IRCA ‐ infarct‐related coronary artery, IRCV ‐ infarct‐related coronary vein, BMMNC ‐ bone marrow mononuclear cells, BM‐MSC ‐ mesenchymal stem cells; LD ‐ low dose, MD ‐ moderate dose, HD ‐ high dose, AG ‐ arterial group, VG ‐ venous group, E ‐ early cells, L ‐ late cells, S ‐ selected cells, U ‐ unselected cells, SD ‐ single dose, DD ‐ double dose
** BM aspiration‐ bone marrow aspiration and isolation of bone marrow mononuclear cells by gradient centrifugation
All but one trial, Zhukova 2009, reported short‐term follow‐up of less than 12 months with the majority reporting follow‐up after six months; only three trials reported maximum follow‐up of three months or less (Suarez de Lezo 2007; Xiao 2012; You 2008). No trial reported short‐term follow‐up of longer than six months. Twenty‐five trials reported long‐term follow‐up, all but five of which included reporting of outcomes at 12 months. Fourteen trials reported follow‐up of longer than 12 months, including 18 months (Wollert 2004), 24 months (Gao 2013; Hirsch 2011; Penicka 2007; Piepoli 2010; Plewka 2009; Schachinger 2006; Wohrle 2010; Zhukova 2009), 30 months (Yao 2006), 36 months (Lunde 2006; Wohrle 2010; Zhukova 2009), 48 months (Cao 2009), 60 months (Hirsch 2011; Schachinger 2006; Tendera 2009; Wollert 2004; Zhukova 2009), and a mean of 8.2 years (Karpov 2005). Long‐term follow‐up included both clinical outcomes and the surrogate endpoint of LVEF in all but four trials: one trial reported long‐term follow‐up of LVEF only (Janssens 2006), and three trials only reported clinical outcomes at long‐term follow‐up (Karpov 2005; Quyyumi 2011; Tendera 2009). We have analysed outcome data separately in this review; we have incorporated the maximum short‐term or long‐term time point from each trial into the analyses.
Trial design characteristics ‐ interventions
Details of the individual trial interventions are given in the Characteristics of included studies tables and are summarised in Table 2.
Thirty‐eight trials isolated the stem/progenitor cells by bone marrow aspiration and separated the mononuclear cell fraction by gradient centrifugation. Three trials failed to report the method of cell isolation or processing (Angeli 2012; Ge 2006; Ruan 2005).
Thirty‐four trials administered unfractionated bone marrow‐derived mononuclear cells intracoronally via an inflated balloon catheter. This mononuclear cell population contains stem/progenitor cells and other blood cells (Angeli 2012; Cao 2009; Chen 2004; Ge 2006; Grajek 2010; Hirsch 2011; Huang 2006; Huang 2007; Huikuri 2008; Janssens 2006; Jazi 2012; Jin 2008; Karpov 2005; Lunde 2006; Meluzin 2008; Nogueira 2009; Penicka 2007; Piepoli 2010; Plewka 2009; Roncalli 2010; Ruan 2005; Schachinger 2006; Suarez de Lezo 2007; Sürder 2013; Tendera 2009; Traverse 2010; Traverse 2011; Traverse 2012; Turan 2012; Wohrle 2010; Wollert 2004; Yao 2006; Yao 2009; Zhukova 2009). Three trials processed the mononuclear cell fraction using two‐step immunomagnetic selection to isolate and administer a suspension containing a selected CD133+ cell population (Colombo 2011; Quyyumi 2011), or in one intervention arm of a three‐arm trial, CD34+/CXCR4+ cells (Tendera 2009). Five trials cultured cells to isolate mesenchymal stem cells (BM‐MSC) (Gao 2013; Lee 2014; Wang 2014; Xiao 2012; You 2008).
One three‐arm trial also administered unfractionated mononuclear cells intravenously to the coronary vein corresponding to the culprit coronary artery via a multipurpose guiding catheter (Nogueira 2009). Simultaneous total occlusion of the coronary vein was achieved via an inflated balloon catheter in the culprit coronary artery.
Cells were suspended in heparinised saline (Cao 2009; Chen 2004; Gao 2013; Huang 2006; Huang 2007; Jin 2008; Plewka 2009; Suarez de Lezo 2007; Wang 2014; Wollert 2004), heparinised saline with human serum albumin (Hirsch 2011), or autologous serum (Huikuri 2008; Janssens 2006), heparinised plasma (Lunde 2006; Yao 2009), saline solution and human serum albumin (Colombo 2011; Nogueira 2009; Traverse 2010; Traverse 2011; Traverse 2012), with 0.1% autologous erythrocytes (Wohrle 2010), heparinised phosphase buffered saline, autologous serum and human serum albumin (Quyyumi 2011), human serum albumin solution (Roncalli 2010), diluted autologous serum (Ruan 2005; Sürder 2013), autologous serum (Zhukova 2009), X‐vivo medium and autologous serum (Schachinger 2006), or autologous plasma (Grajek 2010), M199 medium (Jazi 2012), phosphate buffered saline (Tendera 2009) with human serum albumin (Piepoli 2010), and lymphocyte isolation medium (Yao 2006).
Nine trials did not report details of the cell suspension (Angeli 2012; Ge 2006; Karpov 2005; Lee 2014; Meluzin 2008; Penicka 2007; Turan 2012; Xiao 2012; You 2008).
Timing of stem cell administration post‐AMI
Nineteen trials delivered cells within seven days of AMI: six trials within the first 24 to 48 hours (Gao 2013; Ge 2006; Huang 2006; Huang 2007; Janssens 2006; Ruan 2005), and 13 trials at up to seven days after AMI (Cao 2009; Grajek 2010; Huikuri 2008; Nogueira 2009; Piepoli 2010; Schachinger 2006; Sürder 2013; Traverse 2012; Turan 2012; Wohrle 2010; Wollert 2004; Yao 2009; You 2008), including two trials with patients randomised to receive cells at either three days or seven days (Traverse 2012), or at five to seven days or three to four weeks (Sürder 2013) after AMI, and one trial in which some patients were randomised to receive a second dose at three months (Yao 2009).
In nine trials cells were administered within seven days in some patients although other patients received cells at up to eight days (Hirsch 2011; Lunde 2006), nine days (Angeli 2012; Meluzin 2008), 10 days (Traverse 2010), 11 days (Penicka 2007; Plewka 2009), and 12 days (Suarez de Lezo 2007; Tendera 2009) after AMI.
Fourteen trials administered cells at more than seven days after AMI (Chen 2004; Colombo 2011; Jazi 2012; Jin 2008; Karpov 2005; Lee 2014; Quyyumi 2011; Roncalli 2010; Sürder 2013; Traverse 2011; Wang 2014; Xiao 2012; You 2008; Zhukova 2009)
Comparator arm
Eighteen trials administered a placebo intervention to the control group (Angeli 2012; Cao 2009; Chen 2004; Ge 2006; Huang 2006; Huang 2007; Huikuri 2008; Janssens 2006; Ruan 2005; Schachinger 2006; Suarez de Lezo 2007; Traverse 2010; Traverse 2011; Traverse 2012; Wang 2014; Wohrle 2010; Xiao 2012; Yao 2009). In two trials the placebo medium was not reported (Angeli 2012; Ge 2006). Of the remaining 16 trials, all but one, Xiao 2012, used the same media used to re‐suspend cells in the corresponding treatment arm to patients in the comparator arm (no cells). Xiao 2012 administered heparinised saline to the control group but did not report the re‐suspension medium used in the cell therapy group.
Twenty‐three trials did not use a placebo intervention (Colombo 2011; Gao 2013; Grajek 2010; Hirsch 2011; Jazi 2012; Jin 2008; Karpov 2005; Lee 2014; Lunde 2006; Meluzin 2008; Nogueira 2009; Penicka 2007; Piepoli 2010; Plewka 2009; Quyyumi 2011; Roncalli 2010; Sürder 2013; Tendera 2009; Turan 2012; Wollert 2004; Yao 2006; You 2008; Zhukova 2009); no other interventions were reported other than optimal medical therapy.
Dose of stem/progenitor cells administered
The dose of cells administered varied considerably between trials; for simplicity we have grouped trials according to the mean dose: 106 cells; 107 cells; 108 cells; 109 cells and 1010 cells.
Three trials administered magnetically selected cells at a dose of 106 CD133+ cells (Colombo 2011), 106 CD34+ CXCR4+ cells (Tendera 2009), and 106 or 107 CD34+ cells (three randomised cell dose groups) (Quyyumi 2011). In five trials that administered mesenchymal stem cells, cells were administered at a dose of 106 (Gao 2013), 107 (Lee 2014; Wang 2014; You 2008), and 108 (Xiao 2012).
Bone marrow mononuclear cells were administered to patients at a dose of up to 107 (Ge 2006; Jin 2008; Karpov 2005; Lunde 2006; Nogueira 2009; Roncalli 2010; Traverse 2010; Zhukova 2009), 108 (Angeli 2012; Cao 2009; Grajek 2010; Hirsch 2011; Huang 2006; Huang 2007; Huikuri 2008; Janssens 2006; Piepoli 2010; Plewka 2009; Schachinger 2006; Suarez de Lezo 2007; Sürder 2013; Tendera 2009; Traverse 2011; Traverse 2012; Wohrle 2010; Yao 2006; Yao 2009), 109 (Jazi 2012; Penicka 2007; Wollert 2004), and 1010 (Chen 2004). One trial compared two doses of BMMNC: 106 or 108 (Meluzin 2008). Only two trials did not give details of the cell dose administered to patients (Ruan 2005; Turan 2012).
Risk of bias in included studies
A description of the risk of bias for individual studies is given in the Characteristics of included studies tables. A summary of the risk of selection bias, performance and detection bias, attrition bias, reporting bias and other potential sources of bias including baseline imbalances between trial arms, publication bias and study funding is given below.
Allocation
Twenty trials provided details as to the generation of the randomisation sequence (Cao 2009; Colombo 2011; Gao 2013; Ge 2006; Grajek 2010; Hirsch 2011; Huikuri 2008; Janssens 2006; Lunde 2006; Nogueira 2009; Piepoli 2010; Roncalli 2010; Schachinger 2006; Sürder 2013; Traverse 2010; Traverse 2011; Traverse 2012; Wollert 2004; Yao 2009; You 2008). These methods included: sequential numbers (Gao 2013; Ge 2006; Wollert 2004), "uneven vs. even numbers" (Piepoli 2010), a randomisation table (You 2008), a randomisation list generated in permuted blocks of 10, stratified according to centre (Lunde 2006), a randomisation list generated in permuted blocks of six (Grajek 2010), a randomisation list generated in permuted blocks of undefined size (Colombo 2011), a randomisation list generated in permuted blocks with variable block sizes (Huikuri 2008), a randomisation list generated according to infarct size (Nogueira 2009), a permuted‐block randomisation list stratified according to centre, diabetes status and time to PCI after the onset of AMI (Roncalli 2010), an interactive web‐based randomisation session using randomly selected block sizes of six or nine, stratified by centre (Traverse 2011), a permuted‐block randomisation list stratified according to site (Hirsch 2011), computer‐generated random lists (Cao 2009; Janssens 2006; Schachinger 2006; Yao 2009; Traverse 2012), and a randomisation algorithm developed by a biostatistician (Traverse 2010). Four trials reported using sealed envelopes (Ge 2006; Nogueira 2009; Sürder 2013; Wollert 2004), and two trials generated randomisation lists at a site external to the trial site (Schachinger 2006; Wollert 2004). We defined 19 trials as having a low risk of selection bias due to random sequence generation; we considered one trial that allocated treatment using even versus uneven numbers to have a high risk of selection bias (Piepoli 2010); we also deemed this trial to have a high risk of selection bias due to insufficient allocation concealment. We also deemed 14 trials to have used an appropriate method of allocation concealment (Cao 2009; Colombo 2011; Ge 2006; Huikuri 2008; Janssens 2006; Lunde 2006; Nogueira 2009; Roncalli 2010; Schachinger 2006; Sürder 2013; Traverse 2010; Traverse 2011; Wollert 2004; Yao 2009). One trial reported that the randomisation scheme was not blinded and we therefore considered it to have a high risk of selection bias due to lack of allocation concealment (Traverse 2012). Allocation concealment was unclear in the remaining four trials (Gao 2013; Grajek 2010; Hirsch 2011; You 2008).
We defined the generation of the randomisation sequence as unclear in the 'Risk of bias' tables in 13 trials in which no description was given as to what methods were used to generate the random sequence (Angeli 2012; Jazi 2012; Karpov 2005; Lee 2014; Meluzin 2008; Penicka 2007; Plewka 2009; Quyyumi 2011; Suarez de Lezo 2007; Tendera 2009; Turan 2012; Wohrle 2010; Zhukova 2009). The method of generation of randomisation sequence was also not reported in eight Chinese trials, which we deemed to have a high risk of bias (Chen 2004; Huang 2006; Huang 2007; Jin 2008; Ruan 2005; Wang 2014; Xiao 2012; Yao 2006).
Blinding
In nine trials, the control group underwent bone marrow aspiration and were given a placebo injection. These trials also reported blinding of outcome assessors or described the trial as "double‐blind" and we therefore considered them to have a low risk of performance and detection bias (Chen 2004; Ge 2006; Huikuri 2008; Janssens 2006; Schachinger 2006; Traverse 2010; Traverse 2011; Traverse 2012; Wohrle 2010). In a further eight trials in which a placebo injection was also administered (Angeli 2012; Cao 2009; Huang 2006; Huang 2007; Ruan 2005; Suarez de Lezo 2007; Wang 2014; Xiao 2012), bone marrow aspiration in the control group was either not undertaken (Cao 2009; Suarez de Lezo 2007; Xiao 2012), or was not reported (Angeli 2012; Huang 2006; Huang 2007; Ruan 2005; Wang 2014); in these eight trials the risk of performance bias was unclear. Only four of these trials reported blinding of outcome assessors (Cao 2009; Ruan 2005; Suarez de Lezo 2007; Xiao 2012); blinding of outcome assessors was otherwise not reported (Angeli 2012; Huang 2006; Huang 2007; Wang 2014).
In one other trial, although the control group received a placebo injection, only the active intervention groups underwent bone marrow aspiration (Yao 2009). Furthermore, the active treatment groups were recalled for a second infusion of cells or placebo whereas the control group was not, and we therefore deemed these trials to have a high risk of performance bias.
Participants were not blinded to treatment in 23 trials in which no placebo infusion was administered (Colombo 2011; Gao 2013; Grajek 2010; Hirsch 2011; Jazi 2012; Jin 2008; Karpov 2005; Lee 2014; Lunde 2006; Meluzin 2008; Nogueira 2009; Penicka 2007; Piepoli 2010; Plewka 2009; Quyyumi 2011; Roncalli 2010; Sürder 2013; Tendera 2009; Turan 2012; Wollert 2004; Yao 2006; You 2008; Zhukova 2009), which we considered to have a high risk of performance bias. Outcome assessors were reported to be blinded in all trials except five: one trial stated that study processes were not blinded (Hirsch 2011), and in four trials blinding of outcome assessors was not reported (Jazi 2012; Karpov 2005; Yao 2006; You 2008).
Incomplete outcome data
Eighteen trials had a low risk of attrition bias as either all randomised participants were included in the analysis of all outcome data or all participant withdrawals were due to death or other major clinical adverse events (Angeli 2012; Cao 2009; Chen 2004; Colombo 2011; Ge 2006; Grajek 2010; Huang 2006; Huang 2007; Jin 2008; Nogueira 2009; Penicka 2007; Piepoli 2010; Ruan 2005; Suarez de Lezo 2007; Traverse 2010; Turan 2012; You 2008; Zhukova 2009). We also deemed a further 13 trials to have a low risk of attrition bias as withdrawals were low and balanced between treatment arms (Gao 2013; Hirsch 2011; Huikuri 2008; Janssens 2006; Lunde 2006; Roncalli 2010; Schachinger 2006; Traverse 2011; Traverse 2012; Wang 2014; Wohrle 2010; Wollert 2004; Yao 2009).
In two trials the risk of attrition bias was unclear as the number of participants randomised to each treatment arm was not reported (Jazi 2012; Meluzin 2008). The number of withdrawals was unbalanced in a further three trials (Quyyumi 2011; Xiao 2012; Yao 2006), although reasons for participant withdrawal were reported; these trials were considered to have an unclear risk of bias.
Five trials had a high risk of attrition bias. In three trials the number of withdrawals was high or unbalanced between treatment arms (Lee 2014; Sürder 2013; Tendera 2009), and in two trials there was incomplete participant overlap across multiple trial reports (Karpov 2005; Plewka 2009).
In the analysis of clinical outcomes, 24 trials included all randomised participants and 11 included over 90% of randomised participants. Four trials included between 80% and 90% (Grajek 2010; Meluzin 2008; Sürder 2013; Yao 2009). All four trials explained the reasons for participant withdrawal or exclusion although in one trial these did not fully account for discrepancies in the number of participants included in individual analyses (Sürder 2013). One trial only included 72.5% of randomised participants in the analysis of clinical outcomes (Lee 2014); reasons included protocol violation, loss to follow‐up and the opinion of the investigator. In one trial it was unclear how many participants were randomised to treatment (Jazi 2012).
In the analysis of LVEF, all trials that reported LVEF measured by echocardiography, SPECT, left ventricular angiography or radionuclide ventriculography included over 80% of randomised participants in the analysis of this outcome, with the exception of two trials, which analysed 72.5% (Lee 2014) and 60% (Plewka 2009) of randomised participants. A higher rate of withdrawals was observed in the analysis of LVEF measured by MRI in which five trials analysed less than 80% of randomised participants: 79.2% (Traverse 2012), 67.7% (Quyyumi 2011), 763.6% (Zhukova 2009), 58.5% (Tendera 2009) and 28.9% (Schachinger 2006), although it should be noted that not all participants are willing or able to undergo MRI leading to an expected reduction in the number of patients analysed.
One trial was terminated prematurely after enrolment of the first 27 participants (Penicka 2007). The trial was reported as being terminated early "due to the unexpected occurrence of serious complications in the BMSC group and no incremental functional effects of BMSC as compared with control patients". Fourteen of the 17 participants randomised to the BMSC arm provided scientific outcome data at four and 12‐month follow‐up assessments. All participants in the control arm were included in the final analysis in this trial.
Selective reporting
Out of 41 trials (with 2732 participants) only 18 trials (1567 participants) reported a published protocol (see Characteristics of included studies) and in this sub‐sample there was no evidence of selective reporting. However, given that the majority of trials did not report details of their protocol it is difficult to ascertain whether these trials are at low risk of selective reporting. We considered one trial to have a high risk of reporting bias as the authors failed to report quality of life and cost‐effectiveness despite these outcomes being described in their trial protocol (Nogueira 2009).
We identified no obvious asymmetry from a funnel plot for mortality (using the maximum duration of follow‐up for all trials that reported mortality) (Figure 2). In a regression test for asymmetry (Egger's test) at short‐term follow‐up the model intercept was 0.15 (P value = 0.01), suggesting that larger rather than smaller trials may be associated with a larger treatment effect. At long‐term follow‐up, the test for asymmetry was not significant (P value = 0.06) and there was no evidence of publication bias.
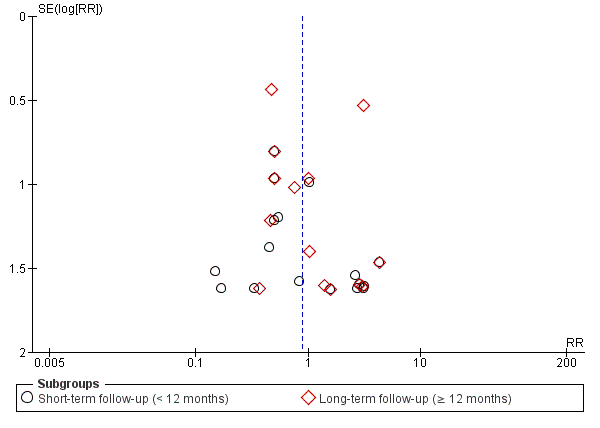
Funnel plot of comparison: 1 Cells compared to no cells, outcome: 1.1 All‐cause mortality.
Other potential sources of bias
Four trials reported statistically significant baseline differences in participant characteristics between trial arms: Sürder 2013 reported a lower percentage of smokers in the late treatment arm than controls (40.3% versus 62.7%; P value = 0.01) and a lower median baseline LVEF (median 35.6% versus 39.6%, P value = 0.03) in the cell therapy group compared with controls; Traverse 2011 reported a higher mean heart rate on initial presentation to the emergency department in the placebo group than the cell therapy group (90.3% versus 77.5%, P value = 0.01); Traverse 2012 observed high peak creatine kinase and troponin levels in the bone marrow cell (BMC) group randomised to day seven and a lack of diabetes in the placebo group randomised to day seven (P values not reported); and in Wohrle 2010 there was a significant baseline imbalance in the proportion of males (62% in the placebo group compared with 90% in the cell therapy group, P value = 0.04). These baseline differences are more likely to be a source of diversity than study bias.
Ten trials did not report the source of funding (Angeli 2012; Chen 2004; Huang 2006; Jazi 2012; Karpov 2005; Ruan 2005; Suarez de Lezo 2007; Wang 2014; Wohrle 2010; Zhukova 2009). Of 31 trials that reported funding and support, all but two trials, Lee 2014 and Schachinger 2006, received research grant funding from universities, charities or governmental agencies (see Characteristics of included studies). Schachinger 2006 received a research grant from Guidant (Guidant Corporation, part of Boston Scientific, which designs and manufactures cardiovascular medical products), as well as support from Eli Lilly (Eli Lilly is a global pharmaceutical company) and Lee 2014 was funded by PCB‐Pharmicell Company Limited, Seongnam, South Korea (a biotechnology company focusing on the development and commercialisation of stem cell therapeutics). Five trials were commercially funded in part: Huikuri 2008 received a research grant from Boston Scientific Sverige AB (a global pharmaceutical company); Grajek 2010 received a research grant from Servier Polska (a global pharmaceutical company); Hirsch 2011 received "unrestricted grants" from Biotronik (Biotronik designs and manufactures cardiovascular medical products), Boston Scientific, Guerbet (Guerbet designs and manufactures medical imaging products including contrast agents), Medtronic (Medtronic designs and manufactures cardiovascular medical products), Novartis, Pfizer and Sanofi‐Aventis (all global pharmaceutical companies); Quyyumi 2011 was funded by Amorcyte Inc (Amorcyte Inc. develops cell therapy products to treat cardiovascular disease); and in Nogueira 2009 cell preparation and characterisation was carried out by Exellion Biomedical Services S/A.
A total of 17 patients from eight trials randomised to cell therapy did not receive treatment as randomised but were included in the analysis (Hirsch 2011; Lunde 2006; Meluzin 2008; Nogueira 2009; Penicka 2007; Roncalli 2010; Traverse 2011; Yao 2009), as well as three patients randomised to a placebo arm who did not receive the placebo medium (Schachinger 2006); in all cases this was due to adverse clinical events, which precluded cell or placebo administration.
Effects of interventions
An overview of results for the primary outcomes of all‐cause mortality, cardiovascular mortality and composite measures of major adverse cardiac events (MACE) are given in summary of findings Table for the main comparison. A summary of outcome reporting is given in Table 3, together with the number and proportion of randomised participants from all trials included in the analysis of each outcome at short‐term and long‐term follow‐up. The number of events in each trial arm observed at the longest reported follow‐up of clinical (dichotomous) outcomes of all‐cause mortality, cardiovascular mortality, a composite measure of death, reinfarction and re‐hospitalisation for heart failure, reinfarction and target vessel revascularisation is given in Table 4.
| Study ID | Primary Outcomes | Secondary Outcomes | ||||||||||||||||||||||
| All‐cause mortality | Cardiovascular mortality | Composite MACE (a) | Reinfarction | Hospital readmission for HF | Target vessel revascularisation | Arrhythmias | Restenosis | NYHA class | Quality of life (QoL) | Exercise tolerance | LVEF (b) | |||||||||||||
| ST | LT | ST | LT | ST | LT | ST | LT | ST | LT | ST | LT | ST | LT | ST | LT | ST | LT | ST | LT | ST | LT | ST | LT | |
| PR* | PR* | PR* | PR* | NR | NR | NR | NR | NR | NR | NR | NR | NR | NR | NR | NR | NR | NR | NR | NR | NR | NR | FR | FR | |
| PR* | FR | NR | NR | NR | NR | PR* | PR* | NR | NR | PR* | FR | NR | NR | PR* | FR | NR | NR | NR | NR | NR | NR | FR | FR | |
| PR* | NR | NR | NR | NR | NR | NR | NR | NR | NR | NR | NR | PR* | NR | NR | NR | NR | NR | NR | NR | NR | NR | FR | NR | |
| PR* | PR* | NR | PR* | NR | NR | NR | NR | FR | PR | NR | NR | NR | FR | NR | NR | NR | NR | NR | NR | NR | PR | FR | FR | |
| FR | FR | FR | FR | NR | FR | FR | FR | NR | FR | NR | NR | PR* | PR* | NR | NR | NR | NR | NR | NR | NR | NR | FR | FR | |
| PR* | NR | NR | NR | NR | NR | NR | NR | NR | NR | NR | NR | PR* | NR | NR | NR | NR | NR | NR | NR | NR | NR | FR | NR | |
| NR | FR | NR | NR | NR | NR | FR | NR | NR | NR | FR | NR | NR | NR | FR | NR | NR | NR | NR | NR | FR | FR | FR | FR | |
| PR* | FR | NR | NR | FR | FR | FR | FR | FR | FR | FR | FR | FR | FR | NR | NR | NR | FR | NR | NR | NR | NR | FR | FR | |
| PR* | NR | NR | NR | NR | NR | PR* | NR | NR | NR | NR | NR | NR | NR | NR | NR | NR | NR | NR | NR | NR | NR | FR | NR | |
| NR | NR | NR | NR | NR | NR | NR | NR | NR | NR | NR | NR | NR | NR | NR | NR | NR | NR | NR | NR | NR | NR | FR | NR | |
| FR | NR | FR | NR | NR | NR | FR | NR | FR | NR | NR | NR | PR* | NR | PR | NR | NR | NR | NR | NR | FR | NR | FR | NR | |
| FR | NR | PR* | NR | NR | NR | NR | NR | NR | NR | PR* | NR | FR | NR | FR | NR | NR | NR | NR | NR | NR | NR | FR | FR | |
| PR* | NR | PR* | NR | NR | NR | PR* | NR | NR | NR | NR | NR | PR* | NR | PR* | NR | FR | NR | NR | NR | NR | NR | FR | NR | |
| NR | NR | NR | NR | NR | NR | NR | NR | NR | NR | NR | NR | NR | NR | NR | NR | FR | FR | FR | FR | NR | NR | FR | FR | |
| PR* | FR | PR* | FR | NR | NR | FR | FR | NR | NR | NR | NR | NR | NR | NR | NR | NR | PR | FR | NR | FR | NR | FR | NR | |
| PR* | NR | PR* | NR | NR | NR | FR | NR | NR | NR | PR* | NR | PR* | NR | NR | NR | NR | NR | NR | NR | NR | NR | FR | NR | |
| NR | FR | NR | NR | NR | NR | FR | FR | FR | FR | NR | FR | NR | FR | FR | NR | FR | NR | FR | NR | FR | NR | FR | FR | |
| PR* | PR* | PR* | PR* | NR | NR | FR | FR | FR | FR | NR | NR | PR* | NR | FR | PR | NR | NR | NR | NR | NR | NR | FR | FR | |
| FR | NR | PR* | NR | NR | NR | NR | NR | NR | NR | NR | NR | NR | NR | PR | NR | NR | NR | NR | NR | NR | NR | FR | NR | |
| FR | FR | FR | FR | NR | FR | FR | FR | FR | FR | NR | NR | NR | PR* | NR | FR | NR | FR | NR | PR | NR | NR | FR | FR | |
| FR | FR | FR | FR | NR | NR | NR | NR | NR | NR | NR | NR | PR | NR | NR | FR | NR | NR | NR | NR | FR | PR | FR | FR | |
| FR | FR | FR | FR | NR | PR | FR | FR | NR | FR | NR | NR | NR | NR | NR | NR | NR | NR | NR | NR | NR | NR | FR | FR | |
| FR | FR | FR | FR | NR | NR | NR | NR | NR | FR | NR | FR | NR | PR* | NR | FR | NR | NR | NR | NR | NR | NR | FR | NR | |
| FR | PR | NR | NR | NR | NR | NR | NR | FR | NR | NR | NR | FR | NR | FR | NR | NR | NR | PR | PR | NR | NR | FR | PR | |
| NR | NR | NR | NR | NR | NR | NR | NR | NR | NR | NR | NR | NR | NR | NR | NR | NR | NR | NR | NR | NR | NR | FR | NR | |
| FR | FR | NR | FR | FR | FR | FR | FR | FR | FR | FR | FR | FR | FR | NR | NR | NR | NR | NR | NR | NR | NR | FR | FR | |
| PR* | NR | PR* | NR | NR | NR | PR* | NR | NR | NR | PR* | NR | PR* | NR | PR* | NR | NR | NR | NR | NR | NR | NR | FR | NR | |
| FR | PR | NR | NR | PR | PR | FR | NR | FR | NR | NR | NR | NR | NR | NR | NR | FR | NR | NR | NR | NR | NR | FR | FR | |
| FR | NR | NR | NR | NR | NR | FR | NR | NR | NR | FR | NR | NR | NR | NR | NR | NR | NR | NR | NR | NR | NR | FR | NR | |
| PR* | NR | PR* | NR | NR | NR | NR | FR | NR | NR | NR | FR | NR | NR | NR | FR | NR | NR | NR | NR | NR | NR | FR | NR | |
| FR | NR | NR | NR | NR | NR | FR | NR | FR | NR | FR | NR | NR | NR | NR | NR | NR | NR | NR | NR | NR | NR | FR | NR | |
| FR | FR | NR | NR | PR | PR | FR | FR | FR | FR | FR | FR | NR | NR | NR | NR | NR | NR | NR | NR | NR | NR | FR | FR | |
| PR* | NR | PR* | NR | NR | NR | NR | NR | NR | NR | NR | NR | NR | NR | NR | NR | FR | FR | NR | NR | NR | NR | FR | FR | |
| FR | NR | NR | NR | NR | NR | NR | NR | NR | NR | NR | NR | NR | NR | NR | NR | NR | NR | NR | NR | NR | NR | FR | NR | |
| FR | NR | NR | NR | FR | FR | PR* | NR | FR | NR | PR* | NR | NR | NR | FR | NR | NR | NR | NR | NR | NR | NR | FR | FR | |
| PR* | FR | NR | FR | NR | FR | FR | FR | FR | FR | PR* | FR | NR | NR | FR | NR | NR | NR | NR | NR | NR | NR | FR | FR | |
| NR | NR | NR | NR | PR | NR | NR | NR | NR | NR | NR | NR | FR | NR | NR | NR | NR | NR | NR | NR | NR | NR | FR | NR | |
| NR | PR* | NR | PR* | NR | NR | NR | FR | NR | NR | NR | NR | NR | NR | FR | FR | NR | NR | NR | NR | NR | NR | FR | NR | |
| PR* | PR* | PR* | PR* | NR | NR | FR | FR | NR | NR | NR | NR | PR | PR | NR | NR | NR | NR | NR | NR | NR | NR | FR | FR | |
| PR* | NR | PR* | NR | NR | NR | NR | NR | NR | NR | NR | NR | PR* | NR | NR | NR | PR | NR | PR | NR | NR | NR | FR | NR | |
| FR | FR | FR | FR | NR | NR | NR | FR | NR | NR | NR | NR | NR | FR | NR | NR | NR | NR | NR | NR | NR | NR | NR | FR | |
| Total (%) analysed (c) | 1365 (50.0) | 996 (36.5) | 290 (10.6) | 527 (19.3) | 379 (13.9) | 497 (18.2) | 1521 (55.7) | 1116 (40.8) | 1194 (43.7) | 825 (30.2) | 789 (28.9) | 758 (27.7) | 525 (19.2) | 457 (16.7) | 641 (23.5) | 395 (14.4) | 398 (14.6) | 237 (8.7) | 154 (5.6) | 26 (1.0) | 267 (9.8) | 45 (1.6) | 1135 (41.5)(d) | 727 (26.6)(d) |
ST ‐ short‐term follow‐up (< 12 months)
LT ‐ long‐term follow‐up (≥ 12 months)
FR ‐ full reporting, outcome included in analysis
PR ‐ partial reporting, insufficient information on outcome reported for inclusion in analysis
* no incidence of outcome observed
NR ‐ outcome not reported
HF ‐ heart failure; NYHA ‐ New York Heart Association; LVEF ‐ left ventricular ejection fraction
(a)Composite measure of mortality, reinfarction or rehospitalisation for heart failure.
(b)LVEF measured by any method.
(c)Total number of participants included in meta‐analysis of outcome (% of total number of participants from all included studies).
(d)Total number analysed given for LVEF measured by magnetic resonance imaging.
| Study ID | Number of analysed participants | All‐cause mortality events | Cardiovascular mortality events | Reinfarction | Target vessel revascularisation | Composite MACE (death, reinfarction, rehospitalisation for HF) | |||||||||||
| Cells | No cells | Cells | No cells | Length of follow‐up | Cells | No cells | Length of follow‐up | Cells | No cells | Length of follow‐up | Cells | No cells | Length of follow‐up | Cells | No cells | Length of follow‐up | |
| 11 | 11 | 0 | 0 | 12 months | 0 | 0 | 12 months | NR | NR | ‐ | NR | NR | ‐ | NR | NR | ‐ | |
| 41 | 45 | 0 | 1 | 48 months | NR | NR | ‐ | 0 | 0 | 48 months | 0 | 1 | 48 months | NR | NR | ‐ | |
| 34 | 35 | 0 | 0 | 6 months | 0 | 0 | 6 months | NR | NR | ‐ | NR | NR | ‐ | NR | NR | ‐ | |
| 5 | 4 | 0 | 0 | 12 months | 0 | 0 | 12 months | NR | NR | ‐ | NR | NR | ‐ | NR | NR | ‐ | |
| 21 | 21 | 1 | 0 | 24 months | 1 | 0 | 24 months | 1 | 0 | 24 months | NR | NR | ‐ | 2 | 1 | 24 months | |
| 10 | 10 | 0 | 0 | 6 months | 0 | 0 | 6 months | NR | NR | ‐ | NR | NR | ‐ | NR | NR | ‐ | |
| 27 | 12 | 1 | 0 | 12 months | NR | NR | ‐ | 1 (a) | 1 (a) | 6 months | 3 (a) | 4 (a) | 6 months | NR | NR | ‐ | |
| 65 | 60 | 1 | 2 | 60 months | NR | NR | ‐ | 1 | 1 | 60 months | 20 | 14 | 60 months | 2 | 5 | 60 months | |
| 20 | 20 | 0 | 0 | 6 months | 0 | 0 | 6 months | 0 | 0 | 6 months | NR | NR | ‐ | NR | NR | ‐ | |
| 20 | 20 | NR | NR | ‐ | NR | NR | ‐ | NR | NR | ‐ | NR | NR | ‐ | NR | NR | ‐ | |
| 40 | 40 | 0 | 1 | 6 months | 0 | 1 | 6 months | 0 | 2 | 6 months | NR | NR | ‐ | NR | NR | ‐ | |
| 33 | 34 | 1 | 0 | 4 months | 0 | 0 | 4 months | NR | NR | 4 months | NR | NR | ‐ | NR | NR | ‐ | |
| 16 | 16 | 0 | 0 | 6 months | 0 | 0 | 6 months | 0 | 0 | 6 months | NR | NR | ‐ | NR | NR | ‐ | |
| 14 | 12 | NR | NR | ‐ | NR | NR | ‐ | NR | NR | ‐ | NR | NR | ‐ | NR | NR | ‐ | |
| 26 | 32 | 10 | 4 | 8.2 years | 8 | 2 | 8.2 years | 2 | 2 | 8.2 years | NR | NR | ‐ | NR | NR | ‐ | |
| 30 | 28 | 0 | 0 | 6 months | 0 | 0 | 6 months | 2 | 0 | 6 months | 0 | 0 | 6 months | NR | NR | ‐ | |
| 49 | 50 | 1 | 1 | 36 months | NR | NR | ‐ | 1 | 2 | 36 months | 12 | 9 | 36 months | NR | NR | ‐ | |
| 44 | 20 | 0 | 0 | 12 months | 0 | 0 | 12 months | 2 | 0 | 12 months | NR | NR | ‐ | NR | NR | ‐ | |
| 24 | 6 | 1 | 0 | 6 months | 0 | 0 | 6 months | NR | NR | ‐ | NR | NR | ‐ | NR | NR | ‐ | |
| 17 | 10 | 3 | 0 | 24 months | 2 | 0 | 24 months | 1 | 1 | 24 months | NR | NR | ‐ | 6 | 5 | 24 months | |
| 19 | 19 | 2 | 4 | 12 months | 2 | 3 | 12 months | NR | NR | ‐ | NR | NR | ‐ | NR | NR | ‐ | |
| 40 | 20 | 2 | 2 | 24 months | 2 | 2 | 24 months | 1 | 1 | 24 months | NR | NR | ‐ | NR (c) | NR (c) | ‐ | |
| 16 | 15 | 1 | 0 | 12 months | 1 | 0 | 12 months | NR | NR | ‐ | 2 | 1 | 12 months | NR | NR | ‐ | |
| 48 | 44 | 1 | 0 | 3 months | NR | NR | ‐ | NR | NR | ‐ | NR | NR | ‐ | NR | NR | ‐ | |
| 9 | 11 | NR | NR | ‐ | NR | NR | ‐ | NR | NR | ‐ | NR | NR | ‐ | NR | NR | ‐ | |
| 100 (b) | 100 (b) | 7 | 15 | 60 months | 5 | 9 | 60 months | 5 (b) | 7 (b) | 24 months | 18 (b) | 28 (b) | 60 months | 4 | 15 | 24 months | |
| 10 | 10 | 0 | 0 | 3 months | 0 | 0 | 3 months | 0 | 0 | 3 months | 0 | 0 | 3 months | NR | NR | ‐ | |
| 115 | 60 | 2 | 0 | 4 months | 0 | 0 | 4 months | 1 | 1 | 4 months | NR | NR | ‐ | NR (d) | NR (d) | ‐ | |
| 160 | 40 | 2 | 1 | 6 months | NR | NR | 3 | 2 | 6 months | 25 | 7 | 6 months | NR | NR | ‐ | ||
| 30 | 10 | 0 | 0 | 15 months | 0 | 0 | 15 months | 0 | 1 | 15 months | 0 | 1 | 15 months | NR | NR | ‐ | |
| 58 | 29 | 0 | 1 | 6 months | NR | NR | ‐ | 1 | 0 | 6 months | 1 | 2 | 6 months | NR | NR | ‐ | |
| 79 | 41 | 1 | 0 | 12 months | NR | NR | ‐ | 2 | 3 | 12 months | 4 | 4 | 12 months | NR (e) | NR (e) | ‐ | |
| 42 | 20 | 0 | 0 | 6 months | 0 | 0 | 6 months | NR | NR | ‐ | NR | NR | ‐ | NR | NR | ‐ | |
| 28 | 30 | 1 | 2 | 6 months | NR | NR | ‐ | NR | NR | ‐ | NR | NR | ‐ | NR | NR | ‐ | |
| 29 | 13 | 1 | 1 | 6 months | NR | NR | ‐ | 0 | 0 | 6 months | 0 | 0 | 6 months | 5 | 1 | 36 months | |
| 30 | 30 | 2 | 2 | 61 months | NR | NR | ‐ | 1 | 1 | 61 months | 6 | 4 | 61 months | 5 | 6 | 61 months | |
| 17 | 21 | NR | NR | 3 months | NR | NR | 3 months | NR | NR | 3 months | NR | NR | 3 months | NR (f) | NR (f) | 3 months | |
| 90 | 84 | 0 | 0 | 30 months | 0 | 0 | 30 months | 2 | 2 | 30 months | NR | NR | ‐ | NR | NR | ‐ | |
| 27 | 12 | 0 | 0 | 12 months | 0 | 0 | 12 months | 0 | 1 | 12 months | NR | NR | ‐ | NR | NR | ‐ | |
| 7 | 16 | 0 | 0 | 8 weeks | 0 | 0 | 8 weeks | NR | NR | ‐ | NR | NR | ‐ | NR | NR | ‐ | |
| 8 | 3 | 2 | 1 | 36 months * | 2 | 1 | 36 months * | 1 | 0 | 36 months | NR | NR | ‐ | NR | NR | ‐ | |
(a)Grajek 2010: 31 BMMNC and 14 controls available for analysis at 6 months.
(b)Schachinger 2006: 100 BMMNC and 101 controls analysed at 24 months; 3 patients (2 BMMNC and 1 control) only had mortality data at 60 months.
(c)Plewka 2009: Composite death, MI, hospitalisation for HF, TVR: 9 BMMNC and 11 controls at 24 months.
(d)Sürder 2013: Composite death, MI, revascularisation, hospitalisation for HF: 9 BMMNC and 8 controls at 12 months.
(e)Traverse 2012: Composite death, MI, hospitalisation for HF, revascularisation, ICD, stroke: 18 BMMNC and 9 controls at 12 months.
(f)Xiao 2012: Composite MACE (undefined): 3 BMMNC and 2 controls at 3 months.
Primary outcomes
All‐cause mortality
Seventeen trials reported incidences of mortality in the short‐term follow‐up period of less than 12 months from cell therapy (Gao 2013; Huikuri 2008; Janssens 2006; Nogueira 2009; Penicka 2007; Piepoli 2010; Plewka 2009; Quyyumi 2011; Roncalli 2010; Schachinger 2006; Sürder 2013; Tendera 2009; Traverse 2011; Traverse 2012; Wang 2014; Wohrle 2010; Zhukova 2009). All incidences of mortality in the short‐term follow‐up period occurred within six months of cell therapy. A further 17 trials reported that no deaths occurred during short‐term follow‐up (see Table 3).
In trials that reported long‐term follow‐up, 14 reported incidences of mortality (Cao 2009; Gao 2013; Grajek 2010; Hirsch 2011; Karpov 2005; Lunde 2006; Penicka 2007; Piepoli 2010; Plewka 2009; Quyyumi 2011; Schachinger 2006; Traverse 2012; Wollert 2004; Zhukova 2009), with nine trials reporting no deaths during long‐term follow‐up. The duration of long‐term follow‐up ranged from 12 months (Grajek 2010; Piepoli 2010; Quyyumi 2011; Traverse 2012), 24 months (Gao 2013; Penicka 2007; Plewka 2009), 36 months (Lunde 2006; Zhukova 2009) and 48 months (Cao 2009), to 60 months (Hirsch 2011; Schachinger 2006; Wollert 2004), and in one trial there was a mean follow‐up of 8.2 (standard deviation (SD) 0.72) years (Karpov 2005).
The mortality incidence rate was low in all trials. Overall, there was no evidence for a difference in the risk of mortality between patients who received cell therapy and those who received no cells at short‐term (21/836 versus 15/529; risk ratio (RR) 0.80, 95% confidence interval (CI) 0.43 to 1.49; 1365 participants; 17 studies) or long‐term follow‐up (34/538 versus 32/458; RR 0.93, 95% CI 0.58 to 1.50; 996 participants; 14 studies) with no evidence of heterogeneity (I2 = 0% in both analyses) (Analysis 1.1).
Sensitivity analyses did not affect the results for mortality. Exclusion of the trial that administered cells via the coronary artery, Nogueira 2009, did not affect short‐term mortality results (20/812 versus 15/523; RR 0.80, 95% CI 0.42 to 1.51; 1335 participants; 16 studies) (Analysis 2.1). Only one trial included in the analysis of short‐term follow‐up had a high risk of selection bias due to lack of appropriate randomisation sequence generation (Wang 2014); the difference in risk of mortality between groups when we excluded this trial was negligible (20/808 versus 13/499; RR 0.83, 95% CI 0.43 to 1.57; 1307 participants; 16 studies) (Analysis 3.1). No trials reporting long‐term follow‐up had a high risk of selection bias due to randomisation methods. When we excluded trials with a high or unclear risk of attrition bias, there remained no evidence for a difference in all‐cause mortality at either short‐term (14/505 versus 12/394; RR 0.78, 95% CI 0.38 to 1.61; 899 participants; 13 studies) or long‐term follow‐up (21/456 versus 26/391; RR 0.67, 95% CI 0.38 to 1.17; 847 participants; 11 studies) (Analysis 4.1; Analysis 4.2). Similarly, exclusion of trials with a high risk of performance bias due to lack of blinding revealed no evidence for differences in the risk of mortality at either short‐term (6/376 versus 8/293; RR 0.60, 95% CI 0.23 to 1.56; 669 participants; eight studies) or long‐term follow‐up (8/220 versus 16/186; RR 0.50, 95% CI 0.22 to 1.10; 406 participants; three studies) (Analysis 5.1; Analysis 5.2).
Subgroup analysis of mortality measured at short‐term follow‐up revealed no differences between trials grouped according to baseline left ventricular ejection fraction (LVEF) as measured by magnetic resonance imaging (MRI) (Analysis 6.1), cell type (Analysis 7.1), cell dose (Analysis 8.1), timing of cell infusion (Analysis 9.1), or use of heparinised cell solution (Analysis 10.1). However, stratification of trials by cell dose revealed a significant difference in the effect of cells on long‐term mortality (test for subgroup differences, P value = 0.02) (Analysis 8.2), with a reduced risk of mortality in patients who received > 108 and ≤ 109 cells (14/371 versus 24/297; RR 0.52, 95% CI 0.28 to 0.97; 668 participants; seven studies), whereas there was no evidence for a difference in the risk of long‐term mortality associated with a lower dose (≤ 108 cells) (15/120 versus 6/121; RR 2.20, 95% CI 0.97 to 4.95; 241 participants; five studies) (Analysis 8.2). Only two trials administered > 109 cells; there was no difference in the risk of mortality between treatment groups from meta‐analysis of these two trials (5/47 versus 2/40; RR 1.56, 95% CI 0.32 to 7.55; 87 participants; two studies). There was no difference in the risk of long‐term mortality associated with cell therapy associated with either baseline LVEF (Analysis 6.2), cell type (Analysis 7.2), timing of cell administration (Analysis 9.2), or use of heparinised cell solution (Analysis 10.2).
In trial sequential analysis of all‐cause mortality at long‐term follow‐up, the cumulative Z‐curve did not cross the conventional thresholds or trial sequential monitoring boundaries for significance (see Figure 3). The required information size, based on a random‐effects model and a relative risk reduction of 35%, a mean effect size equivalent to that associated with revascularisation by percutaneous coronary intervention (PCI) (Hartwell 2005), was 3275, suggesting that the current meta‐analysis is considerably underpowered to detect a reduction in relative risk of 35% or lower. Smaller relative risks would result in a considerably greater information size.

Trial sequential analysis of all‐cause mortality at long term follow‐up, assuming a long‐term mortality incidence rate of 6.1% in controls and a relative risk reduction of 35% in cell therapy patients
Cardiovascular mortality
Incidence of cardiovascular mortality was reported in seven trials at short‐term follow‐up (Gao 2013; Huikuri 2008; Penicka 2007; Piepoli 2010; Plewka 2009; Quyyumi 2011; Zhukova 2009), and nine trials at long‐term follow‐up (Gao 2013; Karpov 2005; Penicka 2007; Piepoli 2010; Plewka 2009; Quyyumi 2011; Schachinger 2006; Wollert 2004; Zhukova 2009). There was no evidence for a difference in the risk of cardiovascular mortality at either short‐term (7/161 versus 7/129; RR 0.72, 95% CI 0.28 to 1.82; 290 participants; seven studies) or at long‐term follow‐up (23/277 versus 18/250; RR 1.04, 95% CI 0.54 to 1.99; 527 participants; nine studies) (Analysis 1.2).
None of the trials that reported cardiovascular mortality had a high risk of selection bias. The lack of evidence for a difference in the risk of cardiovascular mortality remained when we excluded trials with a high or unclear risk of attrition bias at both short‐term (4/105 versus 5/94; RR 0.69, 95% CI 0.22 to 2.14; 199 participants; five studies) (Analysis 4.3) and long‐term follow‐up (12/195 versus 14/183; RR 0.71, 95% CI 0.34 to 1.50; 378 participants; six studies) (Analysis 4.4). The number of appropriately blinded trials precluded sensitivity analysis for performance bias.
Trial sequential analysis of cardiovascular mortality at long‐term follow‐up found an information size of 3064 participants based on a relative risk reduction of 35%, demonstrating that the current meta‐analysis is considerably underpowered to detect an effect of this magnitude.
Composite measures of major adverse cardiac events (MACE)
Composite measures of MACE were reported in 10 trials (Gao 2013; Hirsch 2011; Penicka 2007; Plewka 2009; Schachinger 2006; Sürder 2013; Traverse 2012; Wohrle 2010; Wollert 2004; Xiao 2012). Six trials defined composite MACE as death, reinfarction or re‐hospitalisation for heart failure (Gao 2013; Hirsch 2011; Penicka 2007; Schachinger 2006; Wohrle 2010; Wollert 2004). Other definitions of composite MACE were as follows: death, reinfarction or target vessel revascularisation (Hirsch 2011; Schachinger 2006), death, reinfarction, re‐hospitalisation for heart failure or revascularisation (Plewka 2009; Sürder 2013), death, reinfarction, re‐hospitalisation for heart failure, revascularisation, implantable cardioverter‐defibrillator (ICD) implantation or stroke (Traverse 2012), and death, reinfarction, re‐hospitalisation for heart failure, stroke or arrhythmia (Gao 2013). One trial did not define the composite measure of MACE (Xiao 2012). Analysis was restricted to composite death, reinfarction or re‐hospitalisation for heart failure due to the lack of data from alternative measures. Of note, one study with mortality data reported at five‐year follow‐up only reported two‐year follow‐up data for composite MACE, the incidence of which is lower than the five‐year mortality rate (Schachinger 2006).
There was no evidence for a reduction in the risk of composite death, reinfarction or re‐hospitalisation for heart failure associated with cell therapy at either short‐term (5/198 versus 12/181; RR 0.36, 95% CI 0.12 to 1.14; 379 participants; three studies) or long‐term follow‐up (24/262 versus 33/235; RR 0.63, 95% CI 0.36 to 1.10; 497 participants; six studies) with low or negligible heterogeneity in both analyses (I2 = 0%; I2 = 12% respectively) (Analysis 1.3). The limited number of trials that reported other composite measures of MACE at short‐term or long‐term follow‐up prevented formal analysis of these outcomes.
We did not perform sensitivity analysis as no trials that reported composite measures of MACE had a high risk of selection bias or a high or unclear risk of attrition bias, and the number of appropriately blinded trials precluded sensitivity analysis for performance bias.
Trial sequential analysis of cardiovascular mortality at long‐term follow‐up showed that based on a relative risk reduction of 35%, 1572 participants would be required, demonstrating that the current meta‐analysis is considerably underpowered to detect such a difference in the risk of composite MACE between treatment groups.
Periprocedural adverse events
Twenty‐seven trials reported periprocedural adverse events as an outcome, six of which reported no periprocedural adverse events (Colombo 2011; Ge 2006; Karpov 2005; Traverse 2010; Turan 2012; Wollert 2004) (see Table 5 for details). Adverse events associated with bone marrow aspiration were rare; only one trial reported a serious adverse event at the time of bone marrow harvest (one patient experienced a stent thrombosis with reinfarction which occurred immediately after the procedure) (Penicka 2007); a second trial reported three patients with mild self limiting vasovagal reactions during bone marrow aspiration (Huikuri 2008). No other adverse events associated with bone marrow harvest were reported. Three deaths were reported in patients randomised to cell therapy prior to cell infusion (one patient died due to subarachnoid haemorrhage (Traverse 2012) and in two patients the cause of death was not reported (Sürder 2013)), and three patients died soon after cell therapy was administered (one at three days after cell therapy due to suspected acute in‐stent thrombosis (Gao 2013), one from ventricular fibrillation attributed to recurrent myocardial infarction from stent thrombosis preceding cell infusion (Quyyumi 2011), and one with cause of death not reported (Schachinger 2006)). Other serious periprocedural adverse events observed in patients who received cell therapy included one transient acute heart failure (Cao 2009), one acute coronary occlusion during cell injection (Gao 2013), one patient with a small thrombus in the infarct‐related artery diagnosed immediately after cell transplantation (Meluzin 2008), one patient with sub‐acute stent thrombosis (Huikuri 2008), four patients with periprocedural myocardial infarction (Lee 2014; Schachinger 2006), one transient ischaemic attack (Roncalli 2010), and one post‐procedural arteriovenous fistula of the femoral artery (Tendera 2009). In summary, serious periprocedural adverse events were rare and unlikely to be associated with treatment.
| Study ID | Periprocedural adverse events |
| Not reported | |
| 1 x transient acute heart failure 7 days after cell transplantation | |
| Not reported | |
| No adverse events were reported until the end of hospitalisation | |
| 1 x death 3 days after cell transplantation due to suspected acute in‐stent thrombosis; 1 x serious complication of acute coronary occlusion during cell injection with subsequent recurrent MI | |
| No bleeding complications at BM puncture site and no angina aggravation, malignant diseases or substantial arrhythmias after PCI and BM transfer during hospitalisation in either treatment group | |
| Not reported | |
| No complications of cell harvesting. A CK or CK‐MB elevation between 1 and 2 times the ULN was detected in 4 patients and between 2 and 3 times the ULN in one patient. 1 x occluded infarct‐related artery (patient did not receive cell therapy as randomised). During cell catheterisation: 1 x coronary spasm, 1 x transient brachycardia and 1 x thrombus in the infarct related artery | |
| Not reported | |
| Not reported | |
| 3 x mild self terminating vasovagal reactions during BM aspiration; no other procedural complications relating to aspiration. Subacute stent thrombosis occurred in 4 patients (1 x cell therapy and 3 x placebo); 1 x cell therapy patient had 'no reflow' phenomenon after stenting of the infarcted artery | |
| 11 x treatment‐related tachycardia (supraventricular arrhythmia: 5 in the cell therapy group and 6 in the control group); 3 patients in the control group experienced non‐sustained ventricular tachycardia | |
| Not reported | |
| Not reported | |
| No complications of BM aspiration or cell infusion | |
| No serious inflammatory reactions or bleeding complications from BM aspiration. No (or mild) angina during balloon inflation. No serious procedural complications related to intracoronary administration of MSCs including ventricular arrhythmia, thrombus formation or dissection. Periprocedural MI occurred in 2 patients | |
| 2 x stent thrombosis in the acute phase in the cell therapy group (no cells administered as randomised); 1 x sustained ventricular tachycardia before cell administration; 1 x ventricular fibrillation at day 6, 24 hours after injection.1 x pulseless ventricular tachycardia in control patient ‐ converted to sinus rhythm by means of a precordial thump on day 2 | |
| 2 patients had fever and 1 patient had brachycardia, all within 20 hours prior to cells (these patients did not receive cell therapy as randomised). 3 x cell therapy‐related complications: 1 x intimal dissection during repeat balloon inflations at time of cell implantation, 1 x short‐lasting fever on day of scheduled transplantation, 1 x small thrombus in infarct‐related artery diagnosed immediately after cell transplantation. 2 x control patients had repeat MI 2 days after the hospital discharge due to in‐stent thrombosis | |
| Ck‐MB elevation (3 x normal value) in 3 patients in the arterial group and 1 patient in venous group. 1 x tortuous anterior interventricular vein (patient did not receive cell therapy as randomised). No new pericardial effusions | |
| 2 x serious complications (1 x stent thrombosis with reinfarction immediately after BM harvest, patient died 2 weeks later due to sepsis and acute respiratory distress syndrome; 1 x ventricular septal rupture before cell injection, patient died 3 months later from severe heart failure). | |
| All procedures well tolerated. No inflammatory reaction or abscess detected at the site of puncture after BM harvest. The invasive coronary catheterisation was associated with some mild angina during balloon inflations for cell infusions. No procedural complications during cardiac catheterisation related to cell injections (no ventricular arrhythmia, new thrombus formation or embolism after cell infusion or dissections due to balloon inflations) | |
| Not reported | |
| 1 high‐dose treatment group patient died soon after cell infusion from ventricular fibrillation attributed to recurrent MI from stent thrombosis preceding cell infusion. 1 x high‐dose treatment group patient with acute stent thrombosis before cell infusion (patient withdrawn from study). Cell therapy group: 1 x arrhythmia, 1 x chest pain, 3 x musculoskeletal pain, 2 x upper respiratory tract infection, 2 x rash, 3 x dyspnoea, 1 x fever. Control group: 1 x arrhythmia, 3 x musculoskeletal pain, 1 x upper respiratory tract infection, 1 x dyspnoea | |
| Cell therapy group: 1 x transient ischaemic attack and 1 x thrombopenia induced by GP2b3a inhibitor (both excluded before BM aspiration). Control group: 1 x steroids given for angioneurotic oedema; 1 x post‐MI ventricular septal defect (both withdrawn before day 7) | |
| Not reported | |
| No bleeding complications or haematoma formation at puncture site of BM aspiration. 1 x patient was excluded owing to fever and an increase in the level of C‐reactive protein. 1 x patient in placebo group had angiographic evidence of a thrombus in a non‐infarct‐related artery (placebo medium not infused). 2 x deaths, cause not reported (1 x cell therapy group and 1 x placebo) and 2 x reinfarction (cell therapy group) prior to discharge | |
| Not reported | |
| 1 death in cell therapy group prior to transplantation, cause of death not reported | |
| 1 patient developed arteriovenous fistula of the femoral artery after the procedure and required surgical treatment. No complications arising from BM cell transfer | |
| BM aspiration carried out without complications. No patient experienced a rise in troponin or procedure‐related complication following infusion | |
| No complications associated with BM aspiration. 2 x patients underwent additional stenting at time of cell infusion (1 x distal stent edge dissection related to primary PCI procedure; 1 x possible dissection related to stop‐flow procedure). 1 x postpartum spontaneous coronary dissection with diffuse thrombus throughout stented region of left anterior descending artery; 1 x presence of severe left main coronary stenosis identified before transfusion (this patient did not receive cell therapy as randomised). No patients experienced postprocedural increase in cardiac enzymes | |
| No complications associated with BM harvesting or intracoronary infusion. 1 x death in the BM cell therapy group due to subarachnoid haemorrhage prior to cell delivery | |
| No procedural or cell‐induced complications and no side effects in any patient | |
| Not reported | |
| Not reported | |
| No bleeding complications at BM harvest site. No increases in troponin T serum levels in any patients 24 hours after BM transfer | |
| Not reported | |
| 1 x temporary hypotension, 2 x brachycardia, 7 x new hyperuricaemia | |
| 1 x brachycardia with subsequent pacemaker implantation, 1 x fever (these patients did not receive cells as randomised) | |
| Not reported | |
| Not reported |
MI, acute myocardial infarction; PCI, percutaneous coronary intervention; BM, bone marrow; MSC, mesenchymal stem cells; ULN, upper limit of normal
Secondary outcomes
Reinfarction
Seventeen trials reported incidences of reinfarction in the short‐term follow‐up period of less than 12 months from stem cell therapy (Gao 2013; Grajek 2010; Hirsch 2011; Huikuri 2008; Karpov 2005; Lee 2014; Lunde 2006; Meluzin 2008; Penicka 2007; Plewka 2009; Sürder 2013; Tendera 2009; Traverse 2011; Traverse 2012; Wollert 2004; Yao 2006; Yao 2009). A further five trials reported that no incidences of reinfarction occurred during short‐term follow‐up (see Table 3).
Incidences of reinfarction occurred in 14 trials at long‐term follow‐up (Gao 2013; Hirsch 2011; Karpov 2005; Lunde 2006; Meluzin 2008; Penicka 2007; Plewka 2009; Schachinger 2006; Traverse 2010; Traverse 2012; Wollert 2004; Yao 2006; Yao 2009; Zhukova 2009); one further trial reported no incidences of reinfarction (Cao 2009).
There was no evidence for a difference in the risk of reinfarction between treatment groups at either short‐term (16/927 versus 16/594; RR 0.66, 95% CI 0.33 to 1.30; 1521 participants; 17 studies) or long‐term follow‐up (20/624 versus 25/492; RR 0.64, 95% CI 0.36 to 1.12; 1116 participants; 14 studies) with no evidence of heterogeneity (I2 = 0% for both analyses) (Analysis 1.4).
Four patients were reported to have died following reinfarction. One death occurred due to reinfarction as the cells were harvested; the patient died from sepsis and acute respiratory distress syndrome (ARDS) two weeks following repeat PCI and coronary artery bypass graft (CABG) (Penicka 2007). Another death occurred soon after cell infusion from ventricular fibrillation that was attributed to recurrent myocardial infarction from stent thrombosis preceding cell infusion; in this four‐armed trial it was not reported in which trial arm this patient had been randomised (Quyyumi 2011). Two other deaths due to reinfarction were reported at three‐month (Zhukova 2009) and 12‐month (Schachinger 2006) follow‐up respectively.
Arrhythmias
Twenty‐one trials reported arrhythmia as an outcome, although two trials reported summary results only (Piepoli 2010; Yao 2009), and in a further 11 trials arrhythmias were not observed during follow‐up (see Table 3). In eight trials that reported incidences of arrhythmias, arrhythmia was defined as incidences of supraventricular arrhythmia (Janssens 2006), supraventricular tachycardia (Zhukova 2009), documented ventricular arrhythmia (Schachinger 2006), ventricular fibrillation (Hirsch 2011), sustained ventricular arrhythmia (Lunde 2006), repetitive ventricular arrhythmia (Colombo 2011), malignant arrhythmia (Xiao 2012) and arrhythmia (unspecified) (Roncalli 2010).
Five trials reported incidences of arrhythmias at short‐term follow‐up (Hirsch 2011; Janssens 2006; Roncalli 2010; Schachinger 2006; Xiao 2012). There was no evidence for a difference in the risk of arrhythmias at short‐term follow‐up between patients who received cell therapy and those who did not (15/264 versus 15/261; RR 1.00, 95% CI 0.51 to 1.98; 525 participants; five studies). Similarly, in five trials that reported incidences of arrhythmia at long‐term follow‐up (Colombo 2011; Hirsch 2011; Lunde 2006; Schachinger 2006; Zhukova 2009), there was no difference in the risk of arrhythmias between treatment arms (11/231 versus 7/226; RR 1.39, 95% CI 0.58 to 3.37; 457 participants; five studies) (Analysis 1.7).
Restenosis
Fifteen trials reported incidences of restenosis during follow‐up (Cao 2009; Grajek 2010; Huikuri 2008; Janssens 2006; Lunde 2006; Meluzin 2008; Nogueira 2009; Penicka 2007; Piepoli 2010; Quyyumi 2011; Roncalli 2010; Traverse 2010; Wohrle 2010; Wollert 2004; Yao 2006). However, one trial did not report restenosis as an outcome in the control arm of the trial (Nogueira 2009), and one trial reported results descriptively (Huikuri 2008). One trial with long‐term follow‐up data did not report individual group sample sizes (Meluzin 2008). Two trials reported no incidences of restenosis during follow‐up (Jazi 2012; Suarez de Lezo 2007).
Restenosis at short‐term follow‐up was reported in eight trials (Grajek 2010; Janssens 2006; Lunde 2006; Meluzin 2008; Roncalli 2010; Wohrle 2010; Wollert 2004; Yao 2006). The rate of restenosis at short‐term follow‐up was similar in patients who received cell therapy and in the control group (42/353 versus 34/288; RR 0.95, 95% CI 0.63 to 1.43; 641 participants; eight studies). There was also no evidence for a difference in the risk of restenosis at long‐term follow‐up in five trials (Cao 2009; Penicka 2007; Piepoli 2010; Traverse 2010; Yao 2006) (10/213 versus 14/182; RR 0.58, 95% CI 0.27 to 1.25; 395 participants; six studies) (Analysis 1.8).
Target vessel revascularisation
The requirement for percutaneous coronary intervention in the infarct‐related vessel during follow‐up and after the therapy procedure was determined as target vessel revascularisation. Eleven trials reported incidences of target vessel revascularisation in one or both trial arms (Cao 2009; Grajek 2010; Hirsch 2011; Lunde 2006; Quyyumi 2011; Schachinger 2006; Tendera 2009; Traverse 2010; Traverse 2011; Traverse 2012; Wollert 2004). Four trials reported no incidences of target vessel revascularisation during follow‐up (Janssens 2006; Lee 2014; Suarez de Lezo 2007; Wohrle 2010).
At short‐term follow‐up, there was no evidence for a difference in the risk of target vessel revascularisation between patients who received cell therapy and those who did not (50/497 versus 40/292; RR 0.70, 95% CI 0.47 to 1.06; 789 participants; six studies). There was also no difference in the risk of target vessel revascularisation between treatment arms at long‐term follow‐up (62/408 versus 62/350; RR 0.96, 95% CI 0.67 to 1.37; 758 participants; eight studies) (Analysis 1.6).
Of note, the incidence of restenosis seems to be lower than the incidence of target vessel revascularisation, and this may look like a discrepancy as the latter is a consequence of the former. However, the trials included in these two meta‐analyses differ, as not all trials reported both outcomes. Three trials reported both restenosis and target vessel revascularisation (Cao 2009; Quyyumi 2011; Traverse 2010), and the numbers were the same for both outcomes.
Re‐hospitalisation for heart failure
Incidences of hospital readmission for heart failure were reported in 13 trials at short‐term follow‐up (Colombo 2011; Hirsch 2011; Huikuri 2008; Lunde 2006; Meluzin 2008; Penicka 2007; Roncalli 2010; Schachinger 2006; Sürder 2013; Traverse 2011; Traverse 2012; Wohrle 2010; Wollert 2004), and 11 trials at long‐term follow‐up (Colombo 2011; Gao 2013; Hirsch 2011; Lunde 2006; Meluzin 2008; Penicka 2007; Plewka 2009; Quyyumi 2011; Schachinger 2006; Traverse 2012; Wollert 2004). However, in one trial reporting discrepancies between publications could not be resolved with the study authors and therefore we omitted this study from the analysis at long‐term follow‐up (Colombo 2011).
At short‐term follow‐up there was no evidence for a difference in the risk of re‐hospitalisation for heart failure between patients who received cell therapy and those who did not (17/684 versus 15/510; RR 0.81, 95% CI 0.40 to 1.62; 1194 participants; 13 studies). However, at long‐term follow‐up of 12 months or longer, there was marginally significant evidence for a difference between treatment groups in favour of cell therapy (18/459 versus 27/366; RR 0.55, 95% CI 0.30 to 1.00; 825 participants; 10 studies) (Analysis 1.5).
Quality of life and performance status
Quality of life measures were reported in six trials (Jin 2008; Karpov 2005; Lunde 2006; Penicka 2007; Roncalli 2010; You 2008). Three trials used the Minnesota Living with Heart Failure Questionnaire (MLHFQ) (Jin 2008; Karpov 2005; Roncalli 2010), and two trials used the Short Form 36 Health Survey (Lunde 2006; Penicka 2007); in one trial the quality of life measure was undefined (You 2008) (see Table 6). Three trials only reported summary results and therefore could not be included in the meta‐analysis (Penicka 2007; Roncalli 2010; You 2008). At short‐term follow‐up there was no difference in quality of life score between treatment groups (standardised mean difference (SMD) 0.58, 95% CI ‐0.67 to 1.83; 154 participants; three studies). Only one trial reported quality of life at long‐term follow‐up (Jin 2008); this small trial of 26 participants found a significant difference between groups in favour of cell therapy (SMD 3.23, 95% CI 2.01 to 4.46; 26 participants; one study).
| Study ID | No. analysed participants | Quality of life (QoL) assessment | Reported data (EP/MC/SR) | Performance assessment | Summary measures of performance | Reported data (EP/MC/SR) | Mean follow‐up | |
| Cells | No cells | |||||||
| 5 | 4 | n/r | n/r | Exercise stress test | Peak HR, peak MET, peak double product (SBPxHR), peak predicted HR | EP (median) | 12 months | |
| 31 | 14 | n/r | n/r | Cardiopulmonary exercise treadmill test (modified Bruce protocol) | METs, maximum VO2 , VE/VCO2 slope, RER, peak SBP, peak HR, VO2 anaerobic threshold, HR recovery | EP | 12 months | |
| 65 | 60 | n/r | n/r | NYHA class | EP | 60 months | ||
| 27 | 27 | n/r | n/r | Symptom‐limited maximal exercise test | METs, peak HR, T‐wave alternans | EP, MC | 6 months | |
| 16 | 16 | n/r | n/r | NYHA class | EP | 6 months | ||
| 14 | 12 | MLHFQ | EP | NYHA class | EP | 12 months | ||
| 16 (a) | 28 (a) | MLHFQ | EP | Six minute walk test; functional class (undefined) | Distance (metres) | EP | 6 months | |
| 50 (b) | 50 (b) | SF‐36 | EP, MC | Electrically braked bicycle ergometer; NYHA class | Time (min), maximum VO2 , VE/VCO2 slope etc., peak HR | EP, MC | 6 months | |
| 14 | 10 | SF‐36 | SR | NYHA class | EP | 24 months | ||
| 17 | 15 | n/r | n/r | Cardiopulmonary exercise treadmill test (modified Bruce protocol) | Exercise duration (min), maximum VO2 , VE/VCO2 slope | MC | 12 months | |
| 52 | 49 | MLHFQ | SR | n/r | 12 months | |||
| 117 | 61 | n/r | n/r | NYHA class | EP | 4 months | ||
| 42 | 20 | n/r | n/r | NYHA class | EP | 12 months | ||
| 7 | 16 | QoL (no details) | NYHA class | SR | 8 weeks | |||
MLHFQ, Minnesota Living with Heart Failure Questionnaire; NYHA, New York Heart Association; SF‐36, Short‐Form 36 Quality of Life; MET, metabolic equivalent test (mL/kg/min); HR, heart rate (bpm); SBP, systolic blood pressure (mmHg); RER, respiratory exchange ratio; VE, minute ventilation; VO2, oxygen volume; VCO2, carbon dioxide volume; EP, endpoint; MC, mean change from baseline; SR, summary results; n/r, not reported.
(a)Karpov 2005: QoL was measured in 37 participants (cells: 18 cells, no cells: 19)
(b)Lunde 2006: QoL was measured in 46 BMMNC and 45 controls; exercise tolerance was measured in 49 BMMNC and 50 controls
Eight trials measured New York Heart Association (NYHA) class as a measure of performance status at follow‐up (Hirsch 2011; Jazi 2012; Jin 2008; Lunde 2006; Penicka 2007; Sürder 2013; Turan 2012; You 2008), although one trial reported summary results only (You 2008). Functional classification of heart failure was also measured in one further trial but it was unclear whether this was NYHA class (Karpov 2005). At short‐term follow‐up, in five trials there was no difference in NYHA class at the time of follow‐up between patients who received cell therapy and those who did not (mean difference (MD) ‐0.07, 95% CI ‐0.24 to 0.09; 398 participants; five studies). Similarly, at long‐term follow‐up in four trials there was no difference in NYHA class (MD ‐0.23, 95% CI ‐0.53 to 0.07; 237 participants; four studies) (Analysis 1.10), with considerable heterogeneity between studies (I2 = 80%).
The use of exercise tests to measure performance was reported in six trials (Colombo 2011; Grajek 2010; Huikuri 2008; Karpov 2005; Lunde 2006; Piepoli 2010). Exercise performance was evaluated using a treadmill test (Grajek 2010; Piepoli 2010), a six minute walk test (Karpov 2005), an electrically braked bicycle ergometer (Lunde 2006), and a symptom‐limited maximal exercise test (Huikuri 2008). The method of measuring exercise tolerance was not reported in one trial (Colombo 2011) (see Table 6); we excluded this trial from meta‐analyses of exercise tolerance as median rather than mean values were reported. Meta‐analysis of the remaining five trials showed no difference in exercise tolerance at short‐term follow‐up between patients who received cell therapy and those who did not (SMD 0.19, 95% CI ‐0.06 to 0.43; 267 participants; five studies) (Analysis 1.11). Similarly there were no differences in maximum VO2 (MD 1.15 mL/kg/min, 95% CI ‐0.77 to 3.07; 175 participants; three studies) (Analysis 1.12), VE/VCO2 slope (MD 0.28, 95% CI ‐1.02 to 1.57; 174 participants; three studies) (Analysis 1.13) or peak heart rate (MD 0.55 bpm, 95% CI ‐6.79 to 7.89; 198 participants; three studies) (Analysis 1.14). Two trials reported exercise tolerance at long‐term follow‐up (Grajek 2010; Piepoli 2010); although the latter trial did not report endpoint values. In the remaining trial there was no difference between treatment groups (SMD ‐0.05, 95% CI ‐0.68 to 0.58; 45 participants; one study) (Analysis 1.11).
Left ventricular ejection fraction (LVEF)
In order to limit possible heterogeneity, we have subgrouped trials reporting LVEF by the method of measurement. Results are shown in forest plots for the combined analyses of mean change from baseline and endpoint values as well as separately, as described in the Methods section.
Twelve trials used multiple methods to measure left ventricular function (Angeli 2012; Cao 2009; Grajek 2010; Huang 2006; Huikuri 2008; Lee 2014; Lunde 2006; Nogueira 2009; Piepoli 2010; Plewka 2009; Roncalli 2010; Schachinger 2006). Two trials measured these outcomes by three methods: MRI, echocardiography and single photon emission computed tomography (SPECT) (Lunde 2006), or MRI, echocardiography and radionuclide ventriculography (RNV) (Roncalli 2010). The 10 remaining trials each measured these outcomes using two methods: five used echocardiography and SPECT (Angeli 2012; Cao 2009; Lee 2014; Piepoli 2010; Plewka 2009), two used MRI and left ventricular angiography (Huang 2006; Schachinger 2006), two used echocardiography and RNV (Grajek 2010; Nogueira 2009), and one used left ventricular angiography and echocardiography (Huikuri 2008). Baseline LVEF values for each trial are given in Table 7 for each method of measurement.
| Study ID | No. randomised participants | No. analysed participants | Baseline LVEF | Mean follow‐up of LVEF | |||
| Cells | No cells | Cells | No cells | Cells | No cells | ||
| Measured by MRI | |||||||
| Hirsch 2011 (HEBE) | 69 | 65 | 59 | 52 | 43.7 (9.0)% | 42.4 (8.3)% | 24 months |
| 20 | 20 | 20 | 20 | 44.5 (7.1)% | 43.4 (6.7)% | 6 months | |
| 33 | 34 | 30 | 30 | 48.5 (7.2)% | 46.9 (8.2)% | 12 months | |
| Lunde 2006 (ASTAMI) | 50 | 51 | 44 | 44 | 54.8 (13.6)% | 53.6 (11.6)% | 36 months |
| Quyyumi 2011 (AMR‐1) | 16 | 15 | 11 | 10 | LD: 47.0 (13)% MD: 47.3 (11)% HD: 49.9 (7)% | 53.2(10)% | 6 months |
| Roncalli 2010 (BONAMI) | 52 | 49 | 47 | 43 | 37.0 (9.8)% | 38.7 (9.2)% | 3 months |
| Schachinger 2006 (REPAIR‐AMI) | 101 | 103 | 26 | 33 | 47.8 (6.2)% | 47.7 (6.2)% | 60 months (a) |
| Sürder 2013 (SWISS‐AMI) | 133 | 67 | 107 | 60 | E: 36.5 (9.9)% L: 36.3 (8.2)% | 40.0 (9.9)% | 4 months |
| Tendera 2009(REGENT) | 160 | 40 | 97 | 20 | S: 33.9 (8.6)% U: 35.6 (6.5)% | 38.9 (5.2)% | 6 months |
| 30 | 10 | 30 | 10 | 49 (9.5)% | 48.6 (8.5)% | 6 months | |
| Traverse 2011 (LATE‐TIME) | 59 | 29 | 55 | 26 | 48.7 (12)% | 45.3 (9.9)% | 6 months |
| Traverse 2012 (TIME) | 80 | 40 | 65 | 30 | 46.2 (9.6)% | 46.3 (8.5)% | 12 months |
| Wohrle 2010 (SCAMI) | 29 | 13 | 28 | 12 | 53.5 (9.3)% | 55.7 (9.4)% | 36 months |
| Wollert 2004 (BOOST) | 33 | 32 | 30 | 30 | 50 (10)% | 51.3 (9.3)% | 60 months |
| 30 | 15 | 27 | 11 | SD: 32.5 (3.6)% DD: 33.7 (4.7)% | 32.3 (2.0)% | 12 months | |
| 8 | 3 | 6 (b) | 1 (b) | 33.4 (3)% | 28 (4)% | 36 months (b) | |
| Measured by echocardiography | |||||||
| 11 | 11 | 11 | 11 | n/r | n/r | 12 months | |
| 41 | 45 | 41 | 45 | 41.3 (2.8)% | 40.7 (3.1)% | 48 months | |
| 5 | 5 | 5 | 4 | 44.6 (8.8)% | 43.2 (9.1)% | 12 months | |
| 21 | 22 | 19 | 20 | 50.8 (6.5)% | 51.4 (7.2)% | 24 months | |
| 10 | 10 | 10 | 10 | 53.8 (9.2)% | 58.2 (7.5)% | 6 months | |
| 31 | 14 | 27 | 12 | 50.3 (9.8)% | 50.8 (12)% | 12 months | |
| 20 | 20 | 20 | 20 | 48.5 (5.5)% | 48.2 (6.30% | 6 months | |
| Huikuri 2008 (FINCELL) | 40 | 40 | 39 | 38 | 56 (10)% | 57 (10)% | 6 months |
| 14 | 12 | 14 | 12 | 54.3 (5.5)% | 55.8 (5.9)% | 12 months | |
| 22 | 22 | 16 | 10 | 49.3 (11.1)% | 47.0 (7.5)% | 6 months | |
| Lee 2014 (SEED‐MSC) | 40 | 40 | 30 | 28 | 48.1 (8.0)% | 51.0 (9.2)% | 6 months |
| Lunde 2006 (ASTAMI) | 50 | 51 | 50 | 50 | 45.7 (9.4)% | 46.9 (8.6)% | 36 months |
| Nogueira 2009 (EMRTCC) | 24 | 6 | 22 | 6 | AG: 48.3 (10.4)% VG: 48.6 (7.1)% | 47.6 (14.3)% | 6 months |
| 17 | 10 | 14 | 10 | 39.2 (9.2)% | 39.4 (5.6)% | 24 months | |
| Piepoli 2010 (CARDIAC) | 19 | 19 | 17 | 15 | 38.4 (6.4)% | 38.9 (5.6)% | 24 months |
| 40 | 20 | 38 | 18 | 35 (6)% | 33 (7)% | 24 months | |
| Roncalli 2010 (BONAMI) | 52 | 49 | 47 | 43 | 38.1 (7.9)% | 39.8 (7.0)% | 12 months (c) |
| 9 | 11 | 9 | 11 | 53.4 (8.9)% | 53.5 (5.8)% | 6 months | |
| 17 | 21 | 17 | 21 | 35.6 (3.1)% | 35.7 (3.1)% | 3 months | |
| 7 | 16 | 7 | 16 | 37 (4.6)% | 38.6 (5.4)% | 8 weeks | |
| Measured by SPECT | |||||||
| 11 | 11 | 11 | 11 | n/r | n/r | 12 months | |
| 41 | 45 | 41 | 45 | 41.2 (3.1)% | 40.8 (3.3)% | 48 months | |
| Lee 2014 (SEED‐MSC) | 40 | 40 | 30 | 28 | 49.0 (11.7)% | 52.3 (9.3)% | 6 months |
| Lunde 2006 (ASTAMI) | 50 | 51 | 50 | 50 | 41.3 (10.4)% | 42.6 (11.7)% | 6 months |
| 44 | 22 | 40 | 20 | LD: 41 (2)% HD: 30 (2)% | 40 (2)% | 12 months | |
| Piepoli 2010 (CARDIAC) | 19 | 19 | 17 | 15 | 36.6 (8.2)% | 37.5 (8.9)% | 24 months |
| 40 | 20 | 26 | 10 | 41.2 (10.1)% | 40.0 (14.2)% | 6 months | |
| Measured by LV angiography | |||||||
| 34 | 35 | 34 | 35 | 49 (9)% | 48 (10)% | 6 months | |
| 20 | 20 | 20 | 20 | 56.7 (9.7)% | 57.3 (8.2)% | 6 months | |
| Huikuri 2008 (FINCELL) | 40 | 40 | 36 | 36 | 59 (11)% | 62 (12)% | 6 months |
| n/r | n/r | 16 | 16 | 33.37 (11.2)% | 29.0 (7.5)% | 6 months | |
| Schachinger 2006 (REPAIR‐AMI) | 101 | 103 | 95 | 92 | 48.3 (9.2)% | 46.9 (10.4)% | 4 months |
| 10 | 10 | 10 | 10 | 37 (5)% | 39 (6)% | 3 months | |
| 42 | 20 | 42 | 20 | 43 (10)% | 45 (10)% | 12 months | |
| 30 | 30 | 27 | 28 | 37.8 (6.3)% | 20.2 (2.5)% (d) | 6 months | |
| 92 | 92 | 90 | 84 | n/r | n/r | 6 months | |
| Measured by RNV | |||||||
| 31 | 14 | 27 | 12 | 45.4 (10.2)% | 42.7 (7.4)% | 12 months | |
| Nogueira 2009 (EMRTCC) | 24 | 6 | 22 | 6 | AG: 41.0 (10.3)% VG: 39.9 (7.4)% | 40.1 (12.4)% | 6 months |
| Roncalli 2010 (BONAMI) | 52 | 49 | 47 | 43 | 35.6 (7.0)% | 37.0 (6.7)% | 3 months |
| Measured by gated PET | |||||||
| 5 | 5 | 5 | 4 | 36.6 (5.4)% | 37.6 (7.0)% | 12 months | |
n/r ‐ not reported
LD ‐ low dose, MD ‐ moderate dose, HD ‐ high dose, AG ‐ arterial group, VG ‐ venous group, E ‐ early cells, L ‐ late cells, S ‐ selected cells, U ‐ unselected cells, SD ‐ single dose, DD ‐ double dose
(a)Schachinger 2006: MRI was performed at five‐year follow‐up but summary results only were reported; 24‐month data are used in meta‐analysis.
(b)Zhukova 2009: 24‐month data were used in the analysis as only one control was available at 36 months.
(c)Roncalli 2010: echocardiography was performed at 12‐month follow‐up but summary results only were reported; three‐month data are used in meta‐analysis.
(d)Wang 2014: the reported baseline LVEF value in the control group is assumed to be an error since the difference between values at baseline and endpoint (49.1%) is not significant. We have been unable to clarify the correct value with the study authors.
(i) Magnetic resonance imaging (MRI)
Five trials measured baseline LVEF by MRI after cell administration, at one to three days after cells (Tendera 2009), at three to five days after cells (Janssens 2006), between four days prior to six days after cells (Schachinger 2006), after one week (Huang 2006), and after two to three weeks (Lunde 2006); these trials have been pooled alongside the outcome data for all other trials.
Fifteen trials reported LVEF measured by MRI at short‐term follow‐up (Hirsch 2011; Huang 2006; Janssens 2006; Lunde 2006; Quyyumi 2011; Roncalli 2010; Schachinger 2006; Sürder 2013; Tendera 2009; Traverse 2010; Traverse 2011; Traverse 2012; Wohrle 2010; Wollert 2004; Yao 2009), with all but two trials, Huang 2006 and Yao 2009, reporting mean change from baseline values. In the combined analysis of mean change from baseline and endpoint values, there was no evidence for a difference in mean LVEF between treatment arms (MD 1.05, 95% CI ‐0.56 to 2.67; 1135 participants; 15 studies); we observed substantial heterogeneity across studies (I2 = 64%) (Analysis 1.15).
At long‐term follow‐up, mean change from baseline values were reported in five trials (Hirsch 2011; Janssens 2006; Sürder 2013; Wohrle 2010; Wollert 2004); a further five trials reported endpoint values only (Lunde 2006; Schachinger 2006; Traverse 2012; Yao 2009; Zhukova 2009), although in one trial LVEF was only reported for two patients (Zhukova 2009); we therefore excluded this trial from the meta‐analysis. In the five trials that reported mean change from baseline values, there was no evidence for a difference in mean change in LVEF from baseline between groups (MD 0.03, 95% CI ‐1.72 to 1.78; 438 participants; five studies). Similarly, endpoint values reported in eight trials showed no difference between patients who received cell therapy and those who did not (MD 1.40, 95% CI ‐1.54 to 4.34; 551 participants; eight studies), with no difference observed in the combined analysis of mean change from baseline and endpoint values (MD 1.27, 95% CI ‐1.14 to 3.68; 718 participants; nine studies). There was evidence of substantial heterogeneity across studies (I2 = 66%) (Analysis 1.16).
We observed substantial heterogeneity at both short‐term (I2 = 64%) and long‐term follow‐up (I2 = 66%).
We carried out exploratory subgroup analyses to investigate potential sources of heterogeneity as described in the Methods section. There was no significant evidence for subgroup differences when we stratified trials by baseline LVEF (Analysis 6.3; Analysis 6.4), cell dose (Analysis 8.3; Analysis 8.4), timing of cell administration (Analysis 9.3; Analysis 9.4) or use of heparinised cell solution (Analysis 9.3; Analysis 9.4) at either short‐term or long‐term follow‐up. There were insufficient trials using cells other than mononuclear cells to perform subgroup analysis for cell type.
(ii) Echocardiography
LVEF measured by echocardiography at short‐term follow‐up was reported in 20 trials (Angeli 2012; Cao 2009; Colombo 2011; Gao 2013; Ge 2006; Grajek 2010; Huang 2007; Huikuri 2008; Jin 2008; Karpov 2005; Lee 2014; Lunde 2006; Nogueira 2009; Penicka 2007; Piepoli 2010; Plewka 2009; Roncalli 2010; Ruan 2005; Xiao 2012; You 2008). Of these 20 trials, all reported endpoint LVEF values but only six reported mean change from baseline values (Gao 2013; Huang 2007; Huikuri 2008; Lee 2014; Lunde 2006; Plewka 2009). Meta‐analysis of these six trials showed evidence for a difference in mean change from baseline LVEF in favour of cell therapy (MD 2.72, 95% CI 1.50 to 3.95; 372 participants; six studies). This improvement in LVEF associated with cell therapy was also seen in the combined analysis of all 20 trials (MD 2.31, 95% CI 1.30 to 3.33; 862 participants; 20 studies) (Analysis 1.17). The observed difference was robust to sensitivity analysis excluding the trial that administered cells via the coronary artery (Nogueira 2009).
At long‐term follow‐up, only three trials reported mean change in LVEF from baseline (Gao 2013; Piepoli 2010; Plewka 2009). Meta‐analysis of these three trials showed no evidence for a difference in mean change from baseline values between trial arms (MD 1.35, 95% CI ‐2.25 to 4.96; 127 participants; three studies). However, in nine trials that reported LVEF values at the time of follow‐up (Angeli 2012; Cao 2009; Colombo 2011; Gao 2013; Grajek 2010; Jin 2008; Lunde 2006; Penicka 2007; Piepoli 2010), LVEF values at follow‐up were higher in patients who received cell therapy than those who did not (MD 2.87, 95% CI 1.42 to 4.31; 377 participants; nine studies). Evidence for an improvement in LVEF associated with cell therapy was also seen in the combined analysis (MD 2.09, 95% CI 0.74 to 3.44; 433 participants; 10 studies) (Analysis 1.18).
The observed heterogeneity was moderate (I2 = 37%) at short‐term follow‐up and low at long‐term follow‐up (I2 = 11%) and therefore we performed no exploratory subgroup analyses for LVEF measured by echocardiography.
(iii) SPECT
Seven trials reported LVEF measured by SPECT at short‐term follow‐up (Angeli 2012; Cao 2009; Lee 2014; Lunde 2006; Meluzin 2008; Piepoli 2010; Plewka 2009), although only five trials reported mean change from baseline values (Lee 2014; Lunde 2006; Meluzin 2008; Piepoli 2010; Plewka 2009). In one trial, endpoint values (but not mean change values) reflect an expanded cohort (Meluzin 2008). Meta‐analysis showed a greater mean change from baseline values in patients who received cell therapy compared with those who did not (MD 2.72, 95% CI 0.23 to 5.21; 286 participants; five studies). This effect was also demonstrated in six trials that reported LVEF values measured by SPECT at follow‐up (MD 2.19, 95% CI 0.58 to 3.81; 375 participants; six studies) and in the combined analysis of mean change from baseline and endpoint values (MD 2.52, 95% CI 0.59 to 4.44; 394 participants; seven studies) (Analysis 1.19).
An improvement in LVEF measured by SPECT associated with cell therapy was also found at long‐term follow‐up in four trials (Angeli 2012; Cao 2009; Meluzin 2008; Piepoli 2010) (MD 4.42, 95% CI 2.68 to 6.16; 200 participants; four studies); this improvement was observed in both trials that reported mean change from baseline (MD 5.63, 95% CI 1.77 to 9.49; 92 participants; two studies) and trials that only reported endpoint values (MD 3.46, 95% CI 0.82 to 6.11; 181 participants; three studies) (Analysis 1.20).
There was no evidence for heterogeneity at long‐term follow‐up (I2 = 2%) and there was moderate heterogeneity at short‐term follow‐up (I2 = 39%) and we therefore did not perform subgroup analyses.
(iv) Left ventricular angiography
Nine trials reported LVEF measured by left ventricular angiography at short‐term follow‐up (Chen 2004; Huang 2006; Huikuri 2008; Jazi 2012; Schachinger 2006; Suarez de Lezo 2007; Turan 2012; Wang 2014; Yao 2006). All trials reported endpoint LVEF values but only three reported mean change from baseline values (Huikuri 2008; Schachinger 2006; Suarez de Lezo 2007). Meta‐analysis of these three trials showed a evidence for a difference in mean change from baseline LVEF in favour of cell therapy (MD 6.43, 95% CI 0.60 to 12.27; 279 participants; three studies). In the combined analysis of all nine trials, this effect remained (MD 5.09, 95% CI 0.95 to 9.24; 711 participants; nine studies) with considerable heterogeneity across studies (I2 = 95%) (Analysis 1.21). Only one trial reported long‐term follow‐up of LVEF measured by left ventricular angiography (Turan 2012); this trial found a significantly higher mean LVEF at follow‐up in patients who received cell therapy compared with those who did not (MD 8.00, 95% CI 4.27 to 11.73; 62 participants; one study) (Analysis 1.22). We observed considerable heterogeneity at short‐term follow‐up (I2 = 95%). Visual inspection of the forest plot revealed two potential outliers (Chen 2004; Yao 2006), although considerable heterogeneity remained when we excluded these two studies from the analysis. Exploratory subgroup analyses revealed that when trials were subgrouped according to cell dose, meta‐analysis of two trials that used > 109 cells showed a significant difference when compared to six trials that used > 108 and ≤ 109 cells (test for subgroup differences, P value = 0.0003) (Analysis 8.5), although substantial heterogeneity remained in both subgroups. We found no subgroup differences when we subgrouped trials by either timing of cell administration (P value = 0.12) (Analysis 9.5) or use of heparinised cell solution (P value = 0.26) (Analysis 10.5). The limited number of trials within groups precluded subgroup analysis by baseline LVEF or type of cells.
(v) Radionuclide ventriculography (RNV)
Three trials reported LVEF measured by radionuclide ventriculography (Grajek 2010; Nogueira 2009; Roncalli 2010). There were no differences between treatment groups in analyses of mean change in LVEF from baseline (MD 0.91, 95% CI ‐3.11 to 4.94; 118 participants; two studies), mean LVEF at endpoint (MD 1.08, 95% CI ‐4.88 to 7.04; 157 participants; three studies), or in the combined analysis (MD 1.79, 95% CI ‐1.86 to 5.43; 157 participants; three studies) (Analysis 1.23). Only one trial reported LVEF measured by radionuclide ventriculography at long‐term follow‐up (Grajek 2010); this trial found no evidence for a difference between treatment groups in LVEF measured at long‐term follow‐up (MD 6.30, 95% CI ‐1.03 to 13.63; 39 participants; one study) (Analysis 1.24).
Discussion
Cell transplantation has been developed clinically for over 40 years in patients with haematological malignancies (e.g. haematopoietic stem cell transplantation), but its application as a treatment for other conditions, such as heart disease, has only been possible since 2002. Over the last 13 years clinical evidence from randomised controlled trials (RCTs) has become available, allowing the robust evaluation of the safety of this alternative treatment in patients who have suffered a recent acute myocardial infarction (AMI). Meta‐analyses in cell therapy can help to show the safety of the approach and generate hypotheses, but due to the extent of the heterogeneity of the biologically active product, analysis of efficacy has to be marked with a great caveat. The present study is an update of the Cochrane systematic review published by us previously (Clifford 2012).
Nature of the intervention
Forty‐one RCTs, including 2732 participants, were eligible for inclusion in this updated Cochrane review. The characteristics of the interventions are summarised in Table 2. All included studies compared cell treatment with no cells in addition to the standard primary intervention for revascularisation (primary angioplasty and/or thrombolytic therapy) and standard medical therapy. Participants recruited to these trials have had a recent AMI and received treatment (intervention) or control (or placebo) following successful revascularisation of the infarct‐related coronary artery (IRCA). The cell‐based treatment was administered by an interventional cardiologist as a single bolus, usually by infusion into the IRCA using a balloon catheter. One trial compared two intervention groups, comparing treatment delivered by intracoronary vein infusion with arterial infusion (Nogueira 2009). However, unlike traditional drugs used in cardiology, which possess much simpler chemical and pharmacological characteristics, autologous cell therapies are experimental interventions with much more complex and individualised properties. Therefore it is not surprising that there was substantial clinical heterogeneity and diversity within and between trials: the characteristics of the participants, the type and size of infarct and the baseline outcome values (e.g. left ventricular ejection fraction (LVEF)) at admission all differed. Cell type, dose and time of administration as well as the media where cells were re‐suspended and whether the participants in the comparator arm received placebo or not also differed. There is no standard definition of an 'active' cell product at present. This is because the number of administered cells cannot be equated to active dose and the number of cells retained in the target region might be affected by disease and patient‐related factors. Having said that, all trials included in this review delivered cells of bone marrow origin, with bone marrow mononuclear cells being the starting cell population. Thirty‐eight trials isolated cells from bone marrow aspirates and enriched the mononuclear cell population by gradient centrifugation. One trial infused an enriched CD34 fraction (Quyyumi 2011), and one trial infused enriched CD133‐positive cells (Colombo 2011), whilst another trial compared the effect of unfractionated mononuclear cells with CD34+/CXCR4+ cells (Tendera 2009). Five trials cultured and administered bone marrow‐derived mesenchymal stromal cells (Gao 2013; Lee 2014; Wang 2014; Xiao 2012; You 2008). The trials also differed in their design (e.g. blinded versus open‐label), the length of follow‐up (short and long‐term) and the methodology used to measure surrogate outcome data (e.g. magnetic resonance imaging (MRI), echocardiography, single photon emission computed tomography (SPECT), etc.).
Main findings
There are 11 new trials included in this update of the Cochrane review, but the individual trials are still too small. Pooling the data together, we can conclude the following.
-
There was no evidence for a difference in the risk of all‐cause mortality, cardiovascular mortality, incidence of re‐hospitalisation for heart failure, re‐infarction, arrhythmias, restenosis or target vessel revascularisation in cell‐treated patients compared to controls.
-
Accordingly, we found no evidence for a difference in the composite measure of major adverse cardiac events (MACE) defined by death, re‐infarction and re‐hospitalisation for heart failure between treated patients and the control group.
-
There were no major differences in periprocedural adverse events associated with cell treatment.
-
The treatment was associated with no improvement in LVEF measured by MRI. We observed no differences between treatment groups in mean New York Heart Association (NYHA) class, quality of life measures and exercise/performance measures at short‐term follow‐up. There were too few trials with long‐term follow‐up that measured NYHA class, quality of life or exercise/performance to draw meaningful conclusions.
-
Taken together, the results of these meta‐analyses suggest that bone marrow‐derived cell therapy has no beneficial effect for patients who have suffered AMI. The quality of the evidence presented here is moderate due to imprecision: the information size criterion has not been met, meaning that this systematic review and meta‐analysis is underpowered.
Study limitations
There are a number of limitations to the strength of any conclusion that can be drawn from the evaluation of the included trials. These include sample sizes of the individual trials, statistical power, clinical heterogeneity and risk of bias of the included trials (please see below).
Sample size and statistical power
In general, the sample sizes were small in all trials included, perhaps with the exception of three trials that included at least 200 participants (Schachinger 2006; Sürder 2013; Tendera 2009). At present, results from the first large phase III randomised trials to robustly determine the efficacy of this treatment are lacking. Therefore, systematic reviews and meta‐analysis of pooled trial data can be used to generate hypotheses and to compensate for the lack of statistical power in individual trials.
Cumulative meta‐analyses may result in type I errors due to an increased risk of random error arising from repeated testing of accumulating data (Borm 2009; Hu 2007; Lan 2003). Trial sequential analysis provides a method of adjusting the thresholds for statistical significance while maintaining the overall desired type I error rate (Wettersley 2008). We applied trial sequential analysis to the primary outcome of all‐cause mortality, assuming a long‐term mortality incidence rate of 6.1% in the control group (as observed in our control data) and a relative risk reduction of 35% (equivalent to the reduce risk of mortality associated with percutaneous coronary intervention (PCI) (Hartwell 2005). In our analysis, the cumulative Z‐curve for all‐cause mortality did not cross the conventional thresholds or trial sequential monitoring boundaries (TSMB) for significance. The required information size was 3275 participants, suggesting that even the current meta‐analysis is considerably underpowered to detect a relative risk reduction of this magnitude. The required information size to detect significant effects in cardiovascular mortality and composite MACE was 3064 and 1572 participants, respectively.
The effect of intracoronary reinfusion of bone marrow‐derived mononuclear cells (BMMNC) is being assessed in a pan‐European Phase III trial (the BAMI trial) (NCT01569178). This trial is well‐powered and is planned to recruit 3000 participants who have suffered a recent myocardial infarction and have reduced LVEF (≤ 45%) following successful revascularisation. Primary and secondary outcomes include death, cardiac death, re‐hospitalisation for myocardial infarction, target vessel revascularisation (TVR), heart failure, implantation of implantable cardioverter‐defibrillator/ cardiac resynchronisation therapy (ICD/CRT) device, stroke, syncope or arrhythmias and incidence and severity of adverse events, with an estimated completion date of May 2018.
Risk of bias and heterogeneity
This systematic review is based on a comprehensive search strategy, but despite this the possibility of publication and reporting bias cannot be ruled out completely. Risk of bias is present in the included trials, as summarised in Figure 4. All trials stated that they randomised the participants, but only 49% (n = 20) and 34% (n = 14) of the included trials documented adequate methods for the generation of randomised sequences and concealment of treatment allocation, respectively. Blinding (performance and detection bias) was reported in 22% (n = 9) of the included trials, whilst the remaining 32 trials were described either as not blinded (n = 24) or blinding was unclear (n = 8). Attrition bias was low in 76% (n = 31) of the included trials, whilst it was unclear or high in the remaining trials. Finally, selective reporting bias was low in 41% (n = 17) of the included trials. Sensitivity analyses conducted for the major outcome of all‐cause mortality showed that excluding those trials with high risk of selection, attrition or performance bias had a negligible effect on all‐cause mortality.
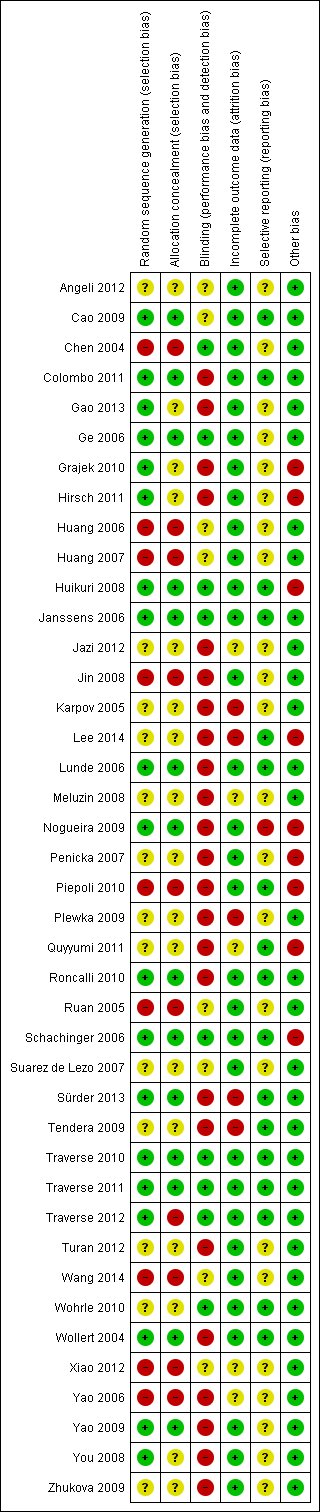
'Risk of bias' summary: review authors' judgements about each risk of bias item for each included study.
In summary, this review finds that the results from the meta‐analysis are of moderate quality for the primary outcomes (see summary of findings Table for the main comparison) due to the information size criterion not being met (imprecision). Therefore, further research may change the estimate of the treatment effect. These results may be regarded as optimistic, however the evidence from this review, from our previous Cochrane reviews and from the recent individual patient data analysis, Gyöngyösi 2015, appears to support the conclusion that bone marrow cell therapies may not reduce the risk of clinical outcomes in patients with AMI.
Our previous versions of this Cochrane review have shown a considerable degree of heterogeneity among trials, which has been extensively explored (Clifford 2012; Fisher 2012; Martin‐Rendon 2008a; Martin‐Rendon 2008b). Interestingly, heterogeneity is negligible for the primary outcomes of this review, suggesting little variation in treatment effect. However, clinical heterogeneity is still present, which justifies using a random‐effects model in all meta‐analyses conducted. We have attempted to address some of the issues of heterogeneity by conducting exploratory subgroup analyses. One example is the timing of cell delivery. It is important to make the distinction between early and late administration of cells as remodelling of the damaged tissue is very different at seven to 10 days to four weeks. We have considered carefully the option of restricting the inclusion criteria to trials which deliver cells within 10 days. However, as there are several key trials that would be excluded from this review as a subset of patients received cells after 10 days (between three and 12 days (Penicka 2007; Plewka 2009; Tendera 2009)), we have opted to conduct subgroup analyses for timing of cell delivery. Similarly, we have stratified the length of follow‐up at less than 12 months and 12 months or more. In this case, the latter category seems to be more diverse, with one trial reporting a mean follow‐up of over eight years (Karpov 2005). Interestingly, this trial provides the most negative results in a number of clinical outcomes. One possible explanation is that the risk of mortality over longer‐term follow‐up would be increased in both treated and control patients, and therefore any observed differences between the two groups would decrease as the length of follow‐up increased.
Quality of life and exercise/performance status
Since our last update of this Cochrane review (Clifford 2012), more trials have reported patient‐centred outcomes, such as quality of life and exercise or performance status. However, quality of life and performance measures during long‐term follow‐up are still underreported. In some cases only one trial has reported these outcomes, thus precluding any further analysis. Where meta‐analysis was feasible, no differences between treated patients and controls were observed.
Left ventricular ejection fraction (LVEF)
We subgrouped LVEF data according to the method of measurement. Although each method has its limitations, it is widely accepted that MRI is the gold standard method to measure surrogate outcomes such as LVEF. A limited number of studies presented LVEF data as mean change from baseline. Many studies presented both mean change from baseline and mean value at endpoint and results are broadly similar whichever measure is used (see, for example, Analysis 1.16). We present forest plots for both mean change from baseline and endpoint values for clarity and transparency. There was evidence for an improvement in LVEF measured by MRI from baseline at both short and long‐term follow‐up. There was no improvement in LVEF measured by MRI from baseline or at endpoint, both at short and long‐term follow‐up. Although there might be an indication of an improvement of LVEF when measured by echocardiography, SPECT or left ventricular angiography, the effect sizes are within the range of 2% to 5%, which is accepted not to be clinically relevant.
Subgroup analyses
Where appropriate, exploratory subgroup analysis investigated the effects of baseline cardiac function (LVEF), cell dose, type and timing of administration, as well as the use of heparin in the final cell solution. Most of the subgroup analyses found no evidence for differences between groups, with the exception of long‐term mortality subgrouped by cell dose. The results suggest that there is no evidence for a reduction in mortality associated with a cell infusion of less than 108 cells, whilst there is a reduction in long‐term mortality in favour of cell therapy with 108 to 109 cells. There were very few trials that administered more than 109 cells to draw robust conclusions. However, in view of the low number of trials included, these results should be considered with caution.
Baseline LVEF has been previously reported to be an effect modifier (Beitnes 2009; Schachinger 2009), although we found no evidence for subgroup differences according to baseline LVEF. Ideally, subgroup analyses of baseline cardiac function would include studies where all subgroup patients have a baseline LVEF of, say, ≤ 45% or > 45%, and such an analysis could be implemented with the use of individual patient data (Gyöngyösi 2015). Unfortunately, few of the included studies used an LVEF threshold as part of their inclusion criteria. Furthermore, we used LVEF baseline measures obtained by MRI as the gold standard, which is usually done after revascularisation and so any baseline LVEF values used as eligibility criteria are unlikely to have been obtained by MRI. Subgroup analysis of studies stratified by mean LVEF using the median value as the subgroup threshold (as defined in the previous version of this review) provides a crude measure of whether baseline cardiac function is associated with efficacy, which will merely have reduced power to detect subgroup effects.
Agreements and disagreements with other studies or reviews
In this update of the Cochrane review we have focused on clinical outcomes such as death, cardiovascular death, reinfarction (MI), arrhythmias, restenosis, target vessel revascularisation and re‐hospitalisation for heart failure. We have included MACE, defined as death, reinfarction (MI) and re‐hospitalisation for heart failure.
Our results suggest that cell therapy does not appear to have a beneficial effect in patients who have experienced a recent AMI. Although this is in agreement with the previous version of this review (Clifford 2012), and with recent systematic reviews and meta‐analysis on cell therapies for patients with AMI (de Jong 2014; Delewi 2014; Gyöngyösi 2015), the present update of the Cochrane review presents long‐term data that are lacking from previous meta‐analysis (de Jong 2014; Gyöngyösi 2015). de Jong 2014 reported a meta‐analysis of 22 cell‐based therapy RCTs (2037 participants) and found that cell therapy had no effect on major adverse clinical cardiac events including all‐cause mortality for a median follow‐up of six months. In the first prospective individual patient data (IPD) meta‐analysis including 12 trials (1252 participants), Gyöngyösi 2015 confirmed no significant differences in all‐cause mortality. Like the present Cochrane review, previous meta‐analyses have shown low procedural adverse events and low incidence of clinical endpoints.
The picture is somewhat more confusing when measuring surrogate outcomes such as LVEF. Mean changes scores may be less efficient for outcomes that are difficult to measure with precision (Higgins 2011), and it may be that one has to take this into consideration when describing continuous surrogate outcomes such as LVEF. The present Cochrane review and meta‐analysis shows no improvement in LVEF in favour of cell therapy when measured by MRI during either short‐term or long‐term follow‐up. Whilst de Jong 2014 observed a significant improvement in LVEF during short‐term follow‐up (in 1513 participants), Gyöngyösi 2015 observed no significant improvement (in 734 participants) when analysing individual patient data. de Jong 2014 found that the improvement in LVEF in favour of cell therapies was not sustained long‐term and explained this by a gradual increase in LV volumes during the first year after AMI in reperfused patients (Engblom 2009).
Our data are in disagreement with results obtained in systematic reviews and meta‐analysis where the cell therapies have been administered to patients with chronic ischaemic heart disease and heart failure (Afzal 2015; Fisher 2014; Fisher 2015; Wen 2012), which may indicate that heart failure patients may benefit more from cell‐based therapies than AMI patients.
Summary
The first‐generation clinical trials were designed to prove safety of the procedure but were not statistically powered to assess efficacy of the treatment and longer‐term effects on survival free of major associated cardiac events. This systematic review and meta‐analysis of pooled trials suggests that cell‐based therapies do not lead to a reduction in hard clinical outcomes such as all‐cause mortality, cardiovascular mortality, rehospitalisation for heart failure, target vessel re‐vascularisation or composite measures of MACE, or indeed an improvement in LVEF as a surrogate of heart function. Although the quality of this evidence is moderate due to imprecision (summary of findings Table for the main comparison), the findings of this review are consistent with the previous version (Clifford 2012), and with the recently published individual patient data analysis (Gyöngyösi 2015). Although these results are robust to sensitivity analyses, this systematic review is most likely underpowered. There is ultimately no substitute for adequately powered phase III RCTs, such as the BAMI trial.
The findings from this systematic review provide further support to previous statements by the National Institute of Clinical Excellence (NICE) and the European Society of Cardiology (ESC) Task Force (Bartunek 2006) that stem cell therapy remains "an experimental therapy". Evidence reported to date, although almost entirely from small trials, does not support the incorporation of stem cell therapy in the management of patients with AMI. A re‐evaluation of this systematic review is warranted on completion of the BAMI trial, expected in 2018.
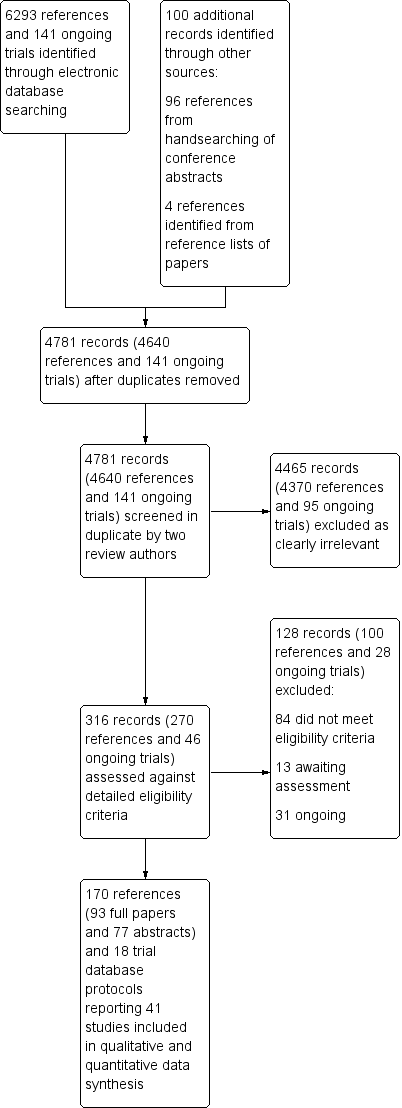
Study flow diagram.

Funnel plot of comparison: 1 Cells compared to no cells, outcome: 1.1 All‐cause mortality.

Trial sequential analysis of all‐cause mortality at long term follow‐up, assuming a long‐term mortality incidence rate of 6.1% in controls and a relative risk reduction of 35% in cell therapy patients

'Risk of bias' summary: review authors' judgements about each risk of bias item for each included study.

Comparison 1 Cells compared to no cells, Outcome 1 All‐cause mortality.

Comparison 1 Cells compared to no cells, Outcome 2 Cardiovascular mortality.

Comparison 1 Cells compared to no cells, Outcome 3 Composite measure of death, reinfarction, re‐hospitalisation for heart failure.

Comparison 1 Cells compared to no cells, Outcome 4 Incidence of reinfarction.
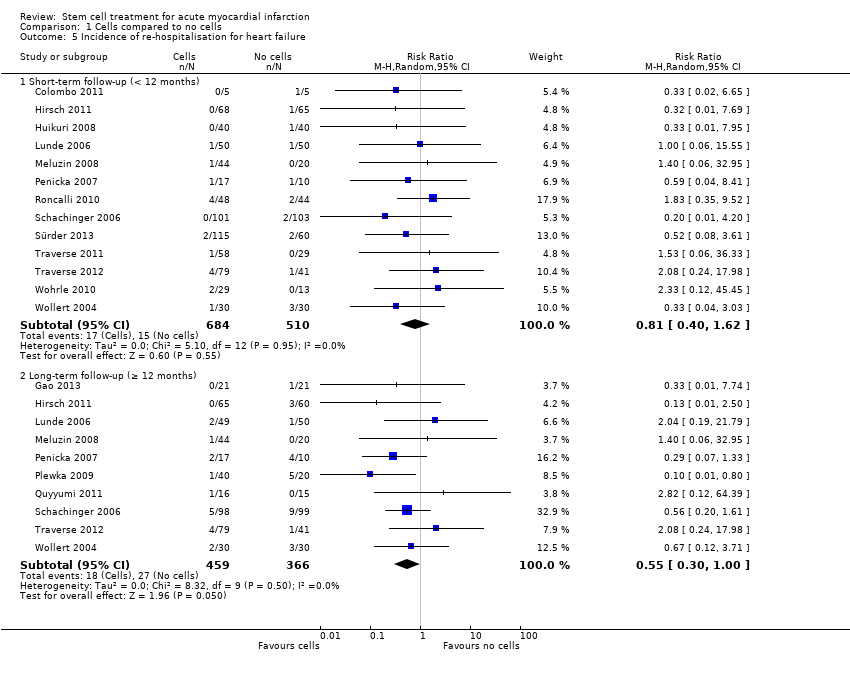
Comparison 1 Cells compared to no cells, Outcome 5 Incidence of re‐hospitalisation for heart failure.

Comparison 1 Cells compared to no cells, Outcome 6 Incidence of target vessel revascularisation.
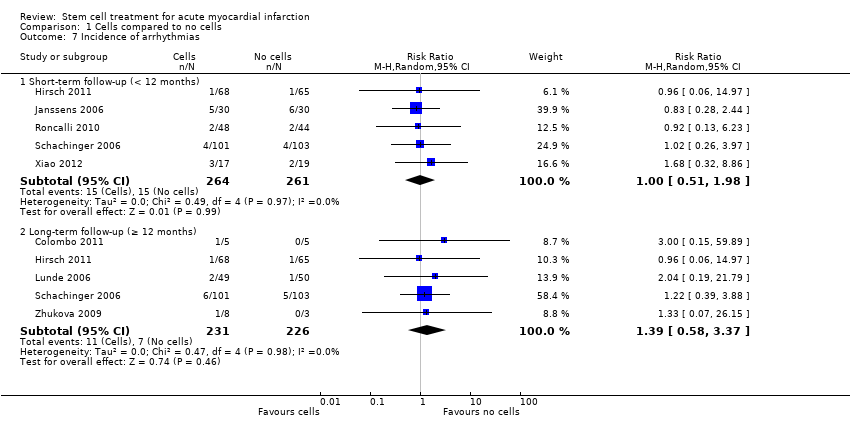
Comparison 1 Cells compared to no cells, Outcome 7 Incidence of arrhythmias.
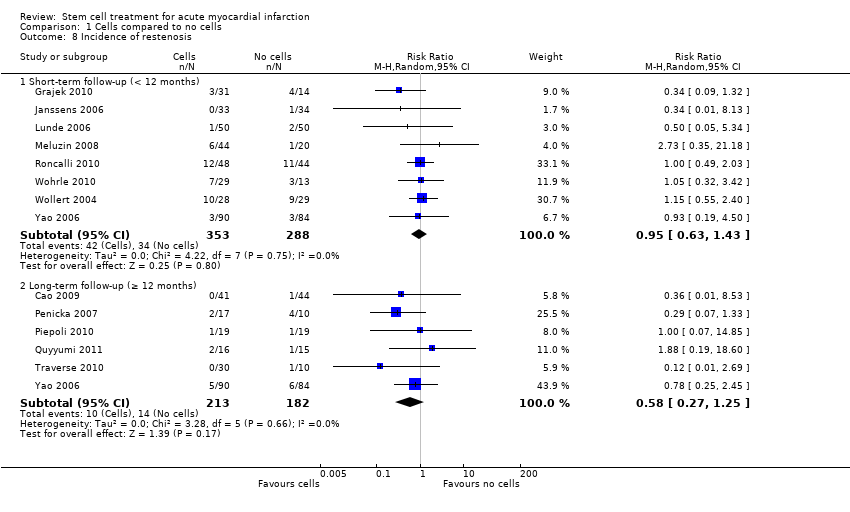
Comparison 1 Cells compared to no cells, Outcome 8 Incidence of restenosis.

Comparison 1 Cells compared to no cells, Outcome 9 Quality of life measures.
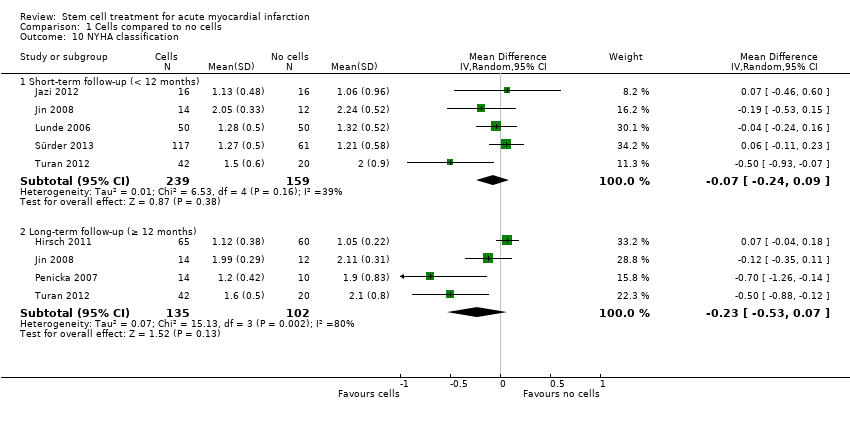
Comparison 1 Cells compared to no cells, Outcome 10 NYHA classification.

Comparison 1 Cells compared to no cells, Outcome 11 Exercise tolerance.

Comparison 1 Cells compared to no cells, Outcome 12 Maximum VO2 (mL/kg/min).
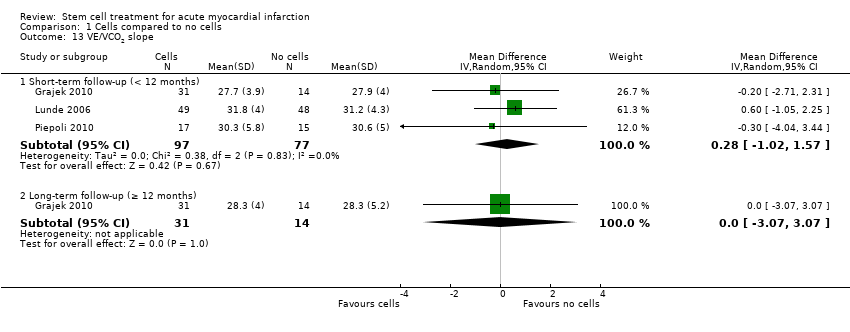
Comparison 1 Cells compared to no cells, Outcome 13 VE/VCO2 slope.

Comparison 1 Cells compared to no cells, Outcome 14 Peak heart rate (bpm).

Comparison 1 Cells compared to no cells, Outcome 15 LVEF measured by MRI (<12 months).

Comparison 1 Cells compared to no cells, Outcome 16 LVEF measured by MRI (≥ 12 months).

Comparison 1 Cells compared to no cells, Outcome 17 LVEF measured by echocardiography (< 12 months).
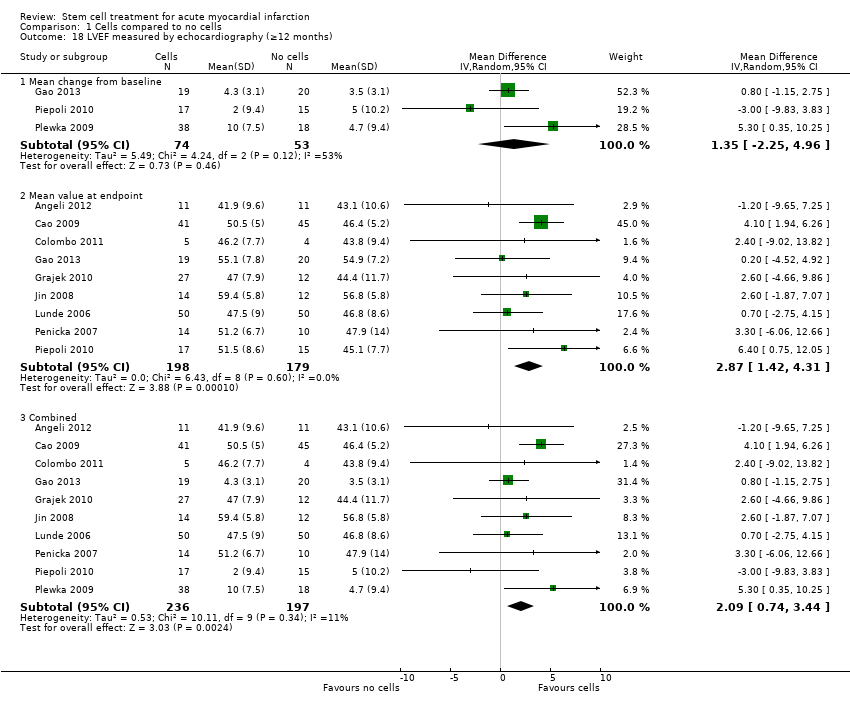
Comparison 1 Cells compared to no cells, Outcome 18 LVEF measured by echocardiography (≥12 months).
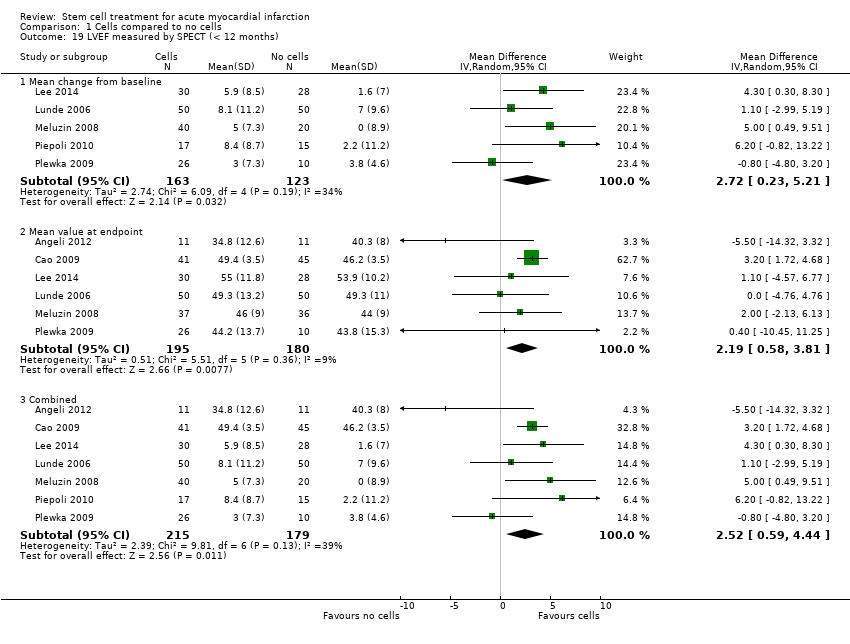
Comparison 1 Cells compared to no cells, Outcome 19 LVEF measured by SPECT (< 12 months).
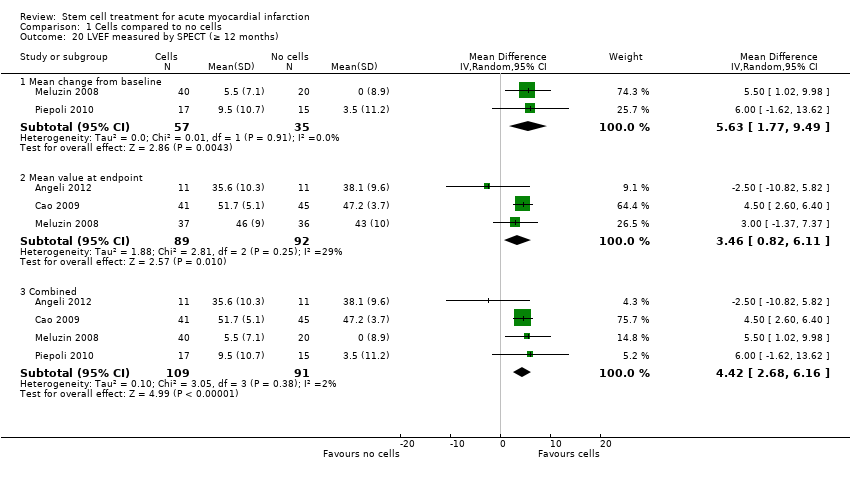
Comparison 1 Cells compared to no cells, Outcome 20 LVEF measured by SPECT (≥ 12 months).

Comparison 1 Cells compared to no cells, Outcome 21 LVEF measured by left ventricular angiography (< 12 months).

Comparison 1 Cells compared to no cells, Outcome 22 LVEF measured by left ventricular angiography (≥ 12 months).
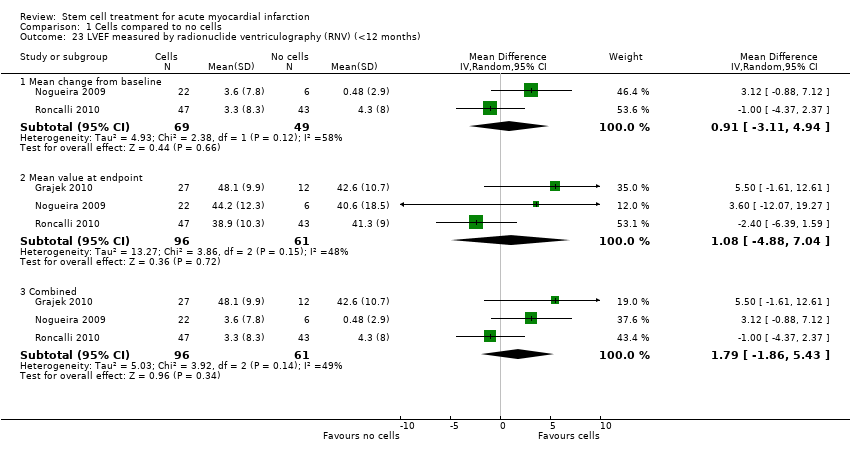
Comparison 1 Cells compared to no cells, Outcome 23 LVEF measured by radionuclide ventriculography (RNV) (<12 months).

Comparison 1 Cells compared to no cells, Outcome 24 LVEF measured by radionuclide ventriculography (≥ 12 months).

Comparison 2 Sensitivity analysis ‐ route of cell delivery, Outcome 1 All‐cause mortality (< 12 months).

Comparison 3 Sensitivity analysis ‐ selection bias, Outcome 1 All‐cause mortality (< 12 months).
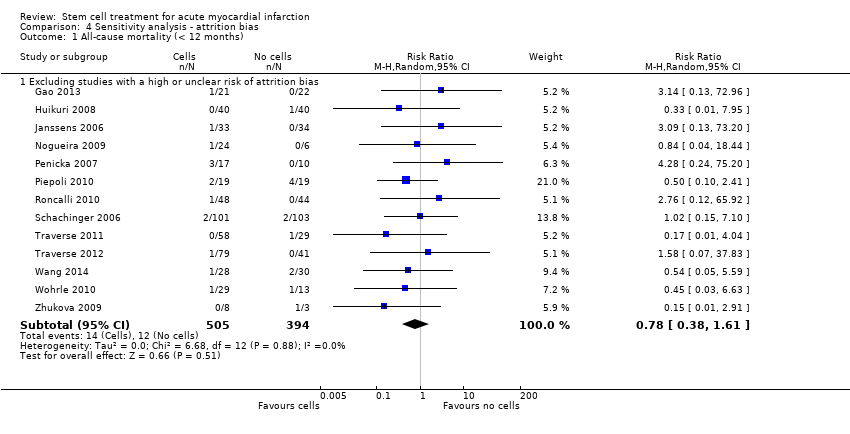
Comparison 4 Sensitivity analysis ‐ attrition bias, Outcome 1 All‐cause mortality (< 12 months).

Comparison 4 Sensitivity analysis ‐ attrition bias, Outcome 2 All‐cause mortality (≥ 12 months).

Comparison 4 Sensitivity analysis ‐ attrition bias, Outcome 3 Cardiovascular mortality (< 12 months).
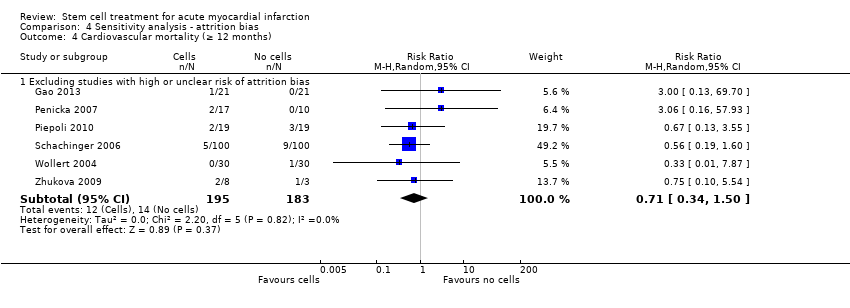
Comparison 4 Sensitivity analysis ‐ attrition bias, Outcome 4 Cardiovascular mortality (≥ 12 months).

Comparison 5 Sensitivity analysis ‐ performance bias, Outcome 1 All‐cause mortality (< 12 months).
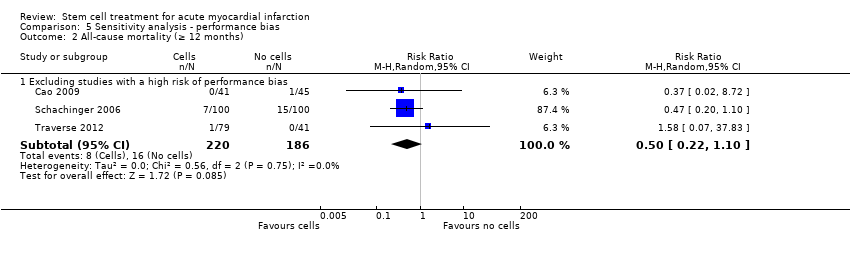
Comparison 5 Sensitivity analysis ‐ performance bias, Outcome 2 All‐cause mortality (≥ 12 months).
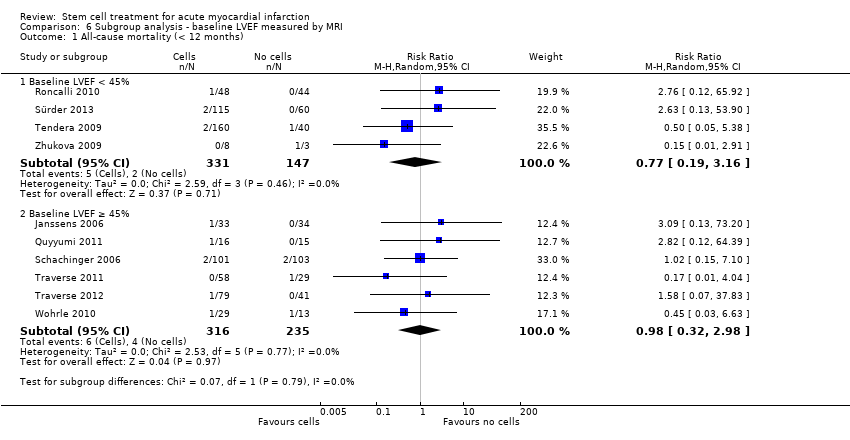
Comparison 6 Subgroup analysis ‐ baseline LVEF measured by MRI, Outcome 1 All‐cause mortality (< 12 months).

Comparison 6 Subgroup analysis ‐ baseline LVEF measured by MRI, Outcome 2 All‐cause mortality (≥ 12 months).
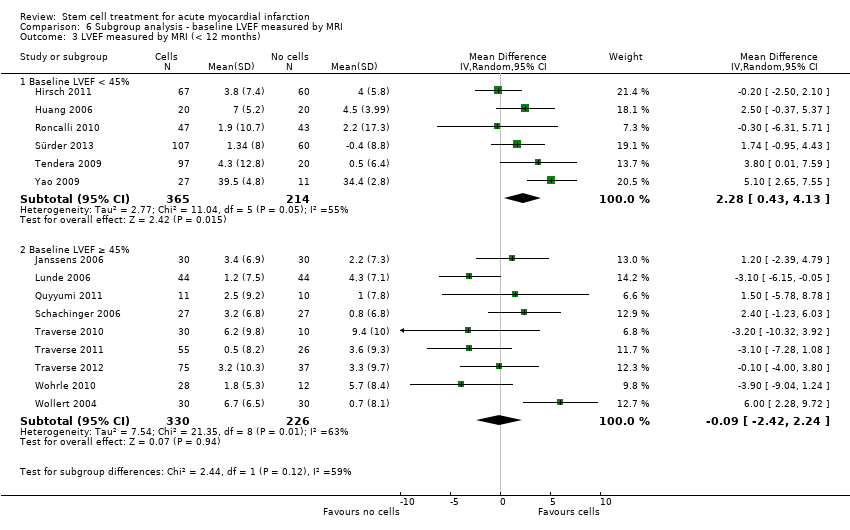
Comparison 6 Subgroup analysis ‐ baseline LVEF measured by MRI, Outcome 3 LVEF measured by MRI (< 12 months).

Comparison 6 Subgroup analysis ‐ baseline LVEF measured by MRI, Outcome 4 LVEF measured by MRI (≥ 12 months).

Comparison 7 Subgroup analysis ‐ cell type, Outcome 1 All‐cause mortality (< 12 months).

Comparison 7 Subgroup analysis ‐ cell type, Outcome 2 All‐cause mortality (≥ 12 months).

Comparison 8 Subgroup analysis ‐ dose of stem cells, Outcome 1 All‐cause mortality (< 12 months).

Comparison 8 Subgroup analysis ‐ dose of stem cells, Outcome 2 All‐cause mortality (≥ 12 months).

Comparison 8 Subgroup analysis ‐ dose of stem cells, Outcome 3 LVEF measured by MRI (< 12 months).

Comparison 8 Subgroup analysis ‐ dose of stem cells, Outcome 4 LVEF measured by MRI (≥ 12 months).

Comparison 8 Subgroup analysis ‐ dose of stem cells, Outcome 5 LVEF measured by left ventricular angiography (< 12 months).
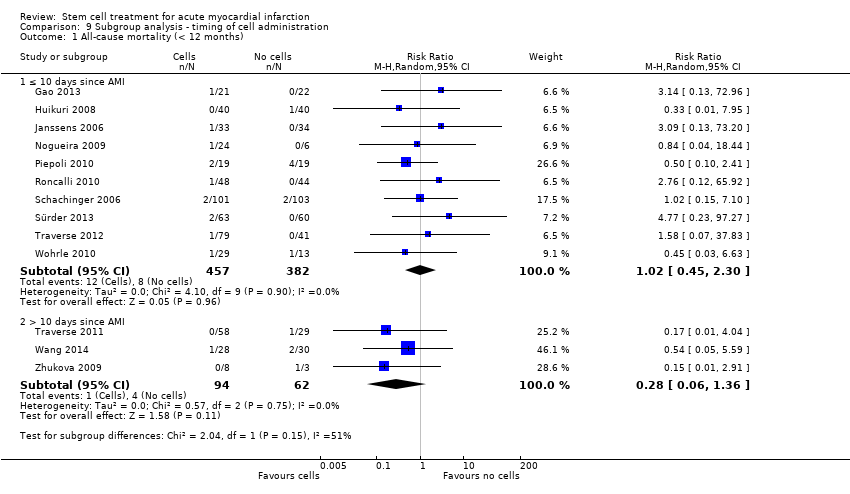
Comparison 9 Subgroup analysis ‐ timing of cell administration, Outcome 1 All‐cause mortality (< 12 months).
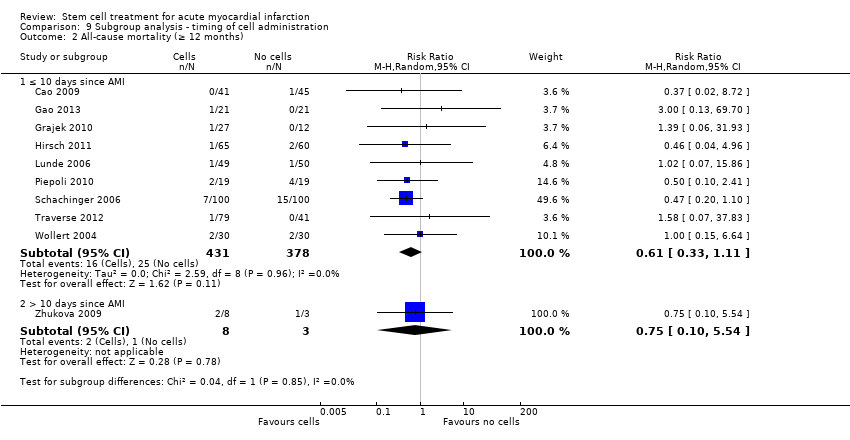
Comparison 9 Subgroup analysis ‐ timing of cell administration, Outcome 2 All‐cause mortality (≥ 12 months).
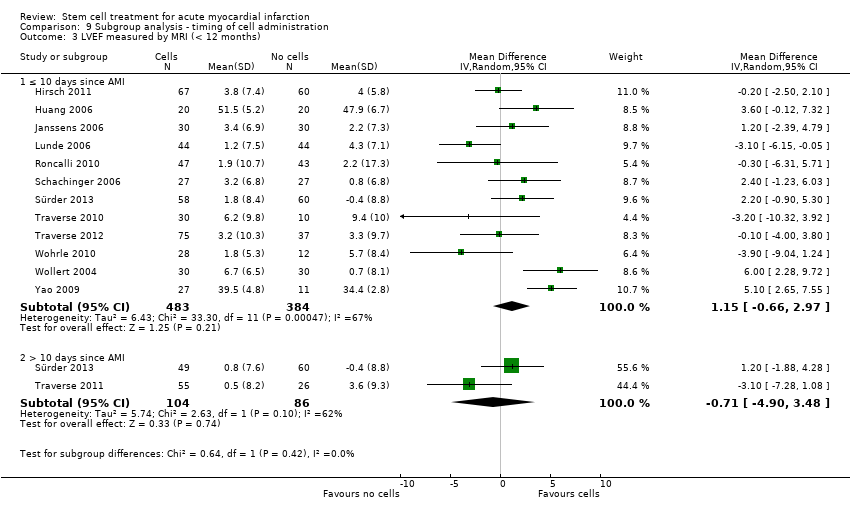
Comparison 9 Subgroup analysis ‐ timing of cell administration, Outcome 3 LVEF measured by MRI (< 12 months).
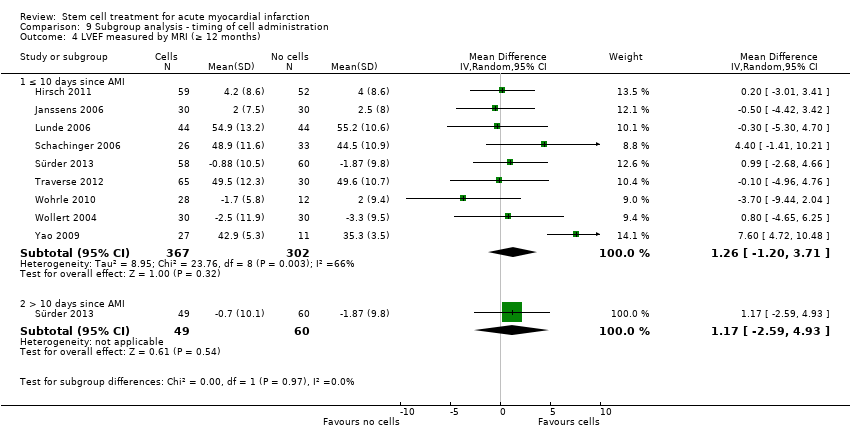
Comparison 9 Subgroup analysis ‐ timing of cell administration, Outcome 4 LVEF measured by MRI (≥ 12 months).

Comparison 9 Subgroup analysis ‐ timing of cell administration, Outcome 5 LVEF measured by left ventricular angiography (< 12 months).
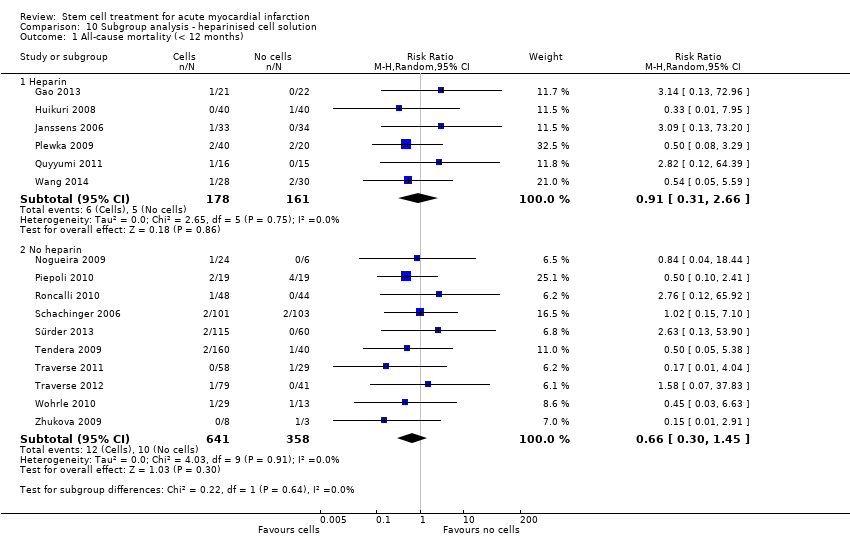
Comparison 10 Subgroup analysis ‐ heparinised cell solution, Outcome 1 All‐cause mortality (< 12 months).

Comparison 10 Subgroup analysis ‐ heparinised cell solution, Outcome 2 All‐cause mortality (≥ 12 months).

Comparison 10 Subgroup analysis ‐ heparinised cell solution, Outcome 3 LVEF measured by MRI (< 12 months).
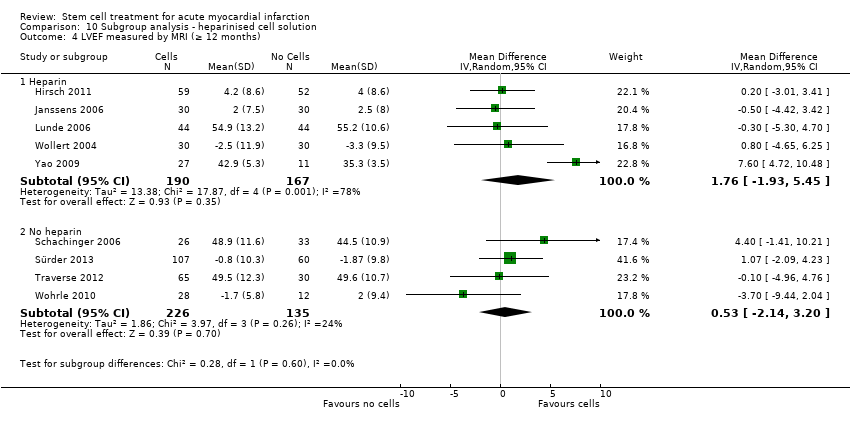
Comparison 10 Subgroup analysis ‐ heparinised cell solution, Outcome 4 LVEF measured by MRI (≥ 12 months).

Comparison 10 Subgroup analysis ‐ heparinised cell solution, Outcome 5 LVEF measured by left ventricular angiography (< 12 months).
| Cells compared to no cells for acute myocardial infarction (AMI) | ||||||
| Patient or population: patients with AMI | ||||||
| Outcomes | Illustrative comparative risks* (95% CI) | Relative effect | No of participants | Quality of the evidence | Comments | |
| Assumed risk | Corresponding risk | |||||
| No cells | Cells | |||||
| All‐cause mortality ‐ short‐term follow‐up (< 12 months) | Study population | RR 0.80 | 1365 | ⊕⊕⊕⊝ | Further research may change the estimate | |
| 28 per 1000 | 23 per 1000 | |||||
| All‐cause mortality ‐ long‐term follow‐up (≥ 12 months) | Study population | RR 0.93 | 996 | ⊕⊕⊕⊝ | Further research may change the estimate | |
| 70 per 1000 | 65 per 1000 | |||||
| Cardiovascular mortality ‐ short‐term follow‐up (< 12 months) | Study population | RR 0.72 | 290 | ⊕⊕⊕⊝ | Further research may change the estimate | |
| 54 per 1000 | 39 per 1000 | |||||
| Cardiovascular mortality ‐ long‐term follow‐up (≥ 12 months) | Study population | RR 1.04 | 527 | ⊕⊕⊕⊝ | Further research may change the estimate | |
| 72 per 1000 | 75 per 1000 | |||||
| Composite death, reinfarction and hospitalisation for heart failure ‐ short‐term follow‐up (< 12 months) | Study population | RR 0.36 | 379 | ⊕⊕⊕⊝ | Further research may change the estimate | |
| 66 per 1000 | 24 per 1000 | |||||
| Composite death, reinfarction and hospitalisation for heart failure ‐ long‐term follow‐up (≥ 12 months) | Study population | RR 0.63 | 497 | ⊕⊕⊕⊝ | Further research may change the estimate | |
| 140 per 1000 | 88 per 1000 | |||||
| *The assumed risk is based on the observed incidence across the pooled control groups. The corresponding risk (and its 95% confidence interval) is based on the assumed risk in the comparison group and the relative effect of the intervention (and its 95% CI). | ||||||
| GRADE Working Group grades of evidence | ||||||
| 1Imprecision: information size criterion not met. Small size effect. | ||||||
| Study ID | Country of study | Patient population | Mean (SD) age of participants (years) | % Male | No. randomised participants receiving intervention | No. randomised participants receiving comparator | Mean duration of follow‐up |
| Brazil | STEMI with LVEF < 45%; successful PCI | n/r | n/r | 11 | 11 | 12 months | |
| China | STEMI; PCI within 12 hours, often with drug‐eluting stent implantation | BMMNC: 50.7 (SEM 1.1) | BMMNC: 95.1% | 41 | 45 | 48 months | |
| China | AMI; PCI within 12 hours, mostly with stent implantation | BMMNC: 58 (7.0) | BMMNC: 94% | 34 | 35 | 6 months | |
| Italy | Large anterior STEMI; PCI with bare metal stent implantation within 12 hours | CD133+: median 54 (range 47 to 60) | CD133+: 100% | 5 | 5 | 12 months | |
| China | Acute STEMI; PCI with stent implantation within 12 hours | BM‐MSC: 55.0 (SEM 1.6) | BM‐MSC: 100% | 21 | 22 | 24 months | |
| China | First STEMI within 24 hours; PCI with stent implantation | BMMNC: 58 (11) | BMMNC: 80% | 10 | 10 | 6 months | |
| Poland | First anterior AMI; PCI within 12 hours with bare metal stent implantation | BMMNC: 49.9 (8.4) | BMMNC: 87% | 31 | 14 | 12 months | |
| Hirsch 2011 | The Netherlands | First STEMI; PCI with stent implantation within 12 hours | BMMNC: 56 (9) | BMMNC: 84% | 69 | 65 | 60 months |
| China | AMI; PCI within 24 hours | BMMNC: 57.3 (10.1) | BMMNC: 65% | 20 | 20 | 6 months | |
| China | AMI; PCI within 24 hours with bare metal (35%) or drug‐eluting (65%) stent implantation | BMMNC: 54.8 (5.8) | BMMNC: 85% | 20 | 20 | 6 months | |
| Huikuri 2008 | Finland | STEMI; thrombolytic drugs initiated within 12 hours | BMMNC: 60 (10) | BMMNC: 90% | 40 | 40 | 6 months |
| Belgium | STEMI; PCI with bare metal stent implantation at median 3.7 hours (IQR 2.5 to 7.6) | BMMNC: 55.8 (11) | BMMNC: 82% | 33 | 34 | 4 months | |
| Iran | Anterior MI within 1 month with a history of anterior MI and LVEF < 35%; PCI | BMMNC: 48.0 (SEM 2.5) | BMMNC: 66% | n/r | n/r | 6 months | |
| China | AMI; thrombolytic drugs and PCI | BMMNC: 62.3 (7.7) | BMMNC: 71.4% | 14 | 12 | 12 months | |
| Russia | STEMI; PCI with bare metal stent implantation within 6.6 (4.9) hours and thrombolytic drugs | BMMNC: 55.2 (8.6) | BMMNC: 90% | 28 | 34 | 8.2 (0.72) years | |
| Lee 2014 | South Korea | STEMI within 24 hours enrolled < 72 hours after revascularisation by | BM‐MSC: 53.9 (10.5) | BM‐MSC: 90.0% | 40 | 40 | 6 months |
| Lunde 2006 | Norway | Anterior STEMI; PCI within 2 to 24 hours | BMMNC: 58.1 (8.5) | BMMNC: 84% | 50 | 51 | 36 months |
| Czech Republic | First STEMI; PCI with stent implantation within 12 hours or 3 days | BMMNC: 54 (SEM 2) | BMMNC: 90% (HD), 95% (LD) | n/r (a) | n/r (a) | 12 months | |
| Nogueira 2009 | Brazil | STEMI; thrombolytic drugs and PCI with stent implantation within 24 hours | BMMNC: 59.7 (14.3) (AG), 53.6 (8.3) (VG) | BMMNC: 71% (AG), 70% (VG) | 24 (14 AG, 10 VG) | 6 | 6 months |
| Czech Republic | First anterior STEMI and LVEF ≤ 50% | BMMNC: 61 (14) | BMMNC: 71% | 17 | 10 | 24 months | |
| Piepoli 2010 | Italy | Anterior STEMI; PCI with stent implantation within 2 to 6 hours | BMMNC: 63.1 (SEM 2.7) | BMMNC: 68.4% | 19 | 19 | 24 months |
| Poland | First anterior STEMI and LVEF < 40%; PCI within 12 hours | BMMNC: 59 (9) | BMMNC: 68% | 40 | 20 | 24 months | |
| Quyyumi 2011 | USA | Acute STEMI and LVEF ≤ 50% | CD34+: median 50.5 (IQR 45 ‐ 53) (HD), 63.0 (IQR 57 ‐ 66) (MD), 52.0 (IQR 51 ‐ 52) (LD) | CD34+: 100% (HD), 80% (MD), 80% (LD) | 16 (5 LD, 5 MD, 6 HD) | 15 | 12 months |
| Roncalli 2010 | France | Acute STEMI and LVEF ≤ 45%; PCI with bare metal stent implantation within 24 hours | BMMNC: 56 (12) | BMMNC: 80.8% | 52 | 49 | 12 months |
| China | AMI admitted within mean 12.1 (12.6) hours of onset; PCI | BMMNC: 61 (8) | BMMNC: 88.9 | 9 | 11 | 6 months | |
| Schachinger 2006 | Germany; Switzerland | Acute STEMI and visual estimated LVEF ≤ 45%; PCI with stent implantation at mean 7.5 (8.0) hours | BMMNC: 55 (11) | BMMNC: 82% | 101 | 103 | 60 months |
| Spain | Anterior STEMI within 12 hours; PCI (some with stent) or thrombolytics | BMMNC: 52 (12) | BMMNC: 80% | 10 | 10 | 3 months | |
| Sürder 2013 | Switzerland | Large STEMI with LVEF < 45%; thrombolytics and PCI with stent within 24 hours | BMMNC: median 55 (IQR 15) (E), 62 (IQR 15) (L) | BMMNC: 86.2% (E), 82.5 (L) | 133 (66 E, 67 L) | 67 | 12 months |
| Tendera 2009 | Poland | Anterior AMI and LVEF ≤ 40% | CD34/CXCR4+: median 58 BMMNC: median 55 | CD34/CXCR4+: 63.7% BMMNC: 70.6% | 160 (80 CD34/CXCR4+, 80 BMMNC) | 40 | 6 months |
| USA | First anterior STEMI; PCI mostly with drug‐eluting stent implantation | BMMNC: median 52.5 (IQR 43 ‐ 64) | BMMNC: 83.3% | 30 | 10 | 15 months | |
| Traverse 2011 | USA | STEMI with LVEF ≤ 45%; PCI with stent, mostly drug‐eluting, at median 3.4 (IQR 2.3 to 14.3) hours | BMMNC: 57.6 (11) | BMMNC: 79% | 59 | 29 | 6 months |
| Traverse 2012 | USA | Anterior STEMI with LVEF < 45%; PCI with stent, mostly drug‐eluting | BMMNC: 55.6 (10.8) (day 3)/58.2 (11.3) day 7) | BMMNC: 88.4% (day 3)/86.1% (day 7) | 43 (day 3) | 24 (day 3) | 12 months |
| Germany | Acute STEMI; PCI with stent implantation | BMMNC: 61 (15) | BMMNC: 67% | 42 | 20 | 12 months | |
| China | Acute STEMI; PCI predominantly with stent implantation within 8 hours | BM‐MSC: 58 (10.2) | BM‐MSC: 67.9% | 30 | 30 | 6 months | |
| Wohrle 2010 | Germany | AMI; PCI with stent, some drug eluting, within 6 to 48 hours | BMMNC: 61.0 (8.1) | BMMNC: 90% | 29 | 13 | 36 months |
| Wollert 2004 | Germany | STEMI within 5 days; PCI with bare metal stent implantation, some with thrombolytic drugs | BMMNC: 53.4 (14.8) | BMMNC: 67% | 33 | 32 | 60 months |
| China | AMI; undergoing elective PCI within 4 weeks of AMI | BM‐MSC: 60.4 (8.9) | BM‐MSC: 58.8% | 17 | 21 | 3 months | |
| China | STEMI within 1 week; PCI | BMMNC: 58.3 (9.5) | BMMNC: 89.1% | 92 | 92 | 30 months | |
| China | First anterior STEMI; PCI within 12 hours | BMMNC: 52.1 (6.3) (SD), 51.3 (7.4) (DD) | BMMNC: 83.3& (SD), 80.0% (DD) | 30 (15 SD, 15 DD) | 15 | 12 months | |
| China | AMI within 24 hours; thombolytic reperfusion | BM‐MSC: 60.5 | BM‐MSC: 71.4% | 7 | 16 | 8 weeks | |
| Russia | MI of the front wall; thrombolytic drugs and/or PCI with stent implantation | BMMNC: 48 (7) | BMMNC: 100% | 8 | 3 | 36 months | |
| STEMI, ST‐segment elevation myocardial infarction; AMI, acute myocardial infarction; PCI, percutaneous coronary intervention; LVEF, left ventricular ejection fraction; BMMNC, bone marrow mononuclear cells; BM‐MSC, bone marrow mesenchymal stem cells; SEM, standard error of the mean; SD, standard deviation; LD, low dose; MD, moderate dose; HD, high dose; AG, arterial group; VG, venous group; E, early cells; L, late cells; S, selected cells; U, unselected cells; SD, single dose; DD, double dose (a)Meluzin 2008: 73 participants were randomised in total ‐ the number randomised to each group was not reported. | |||||||
| Study ID | Time of cell administration | Intervention given by: | Route of cell administration | Intervention cell type | How are cells obtained? (*) | What were they re‐suspended in? | Dose administered? | Comparator arm (placebo or control) |
| 5 to 9 days after AMI | Cardiologist | Infusion into IRCA | BMMNC | n/r | n/r | 260 (160) million cells | Placebo (n/r) | |
| 7 days after PCI | Cardiologist | Infusion into IRCA | BMMNC | BM aspiration (**) | Heparinised saline | 500 million cells | Placebo (heparinised saline) | |
| Mean 18.4 (0.5) days after PCI | Cardiologist | Infusion into IRCA | BMMNC | BM aspiration (**) | Heparinised saline | 48,000 (60,000) million cells | Placebo (heparinised saline) | |
| Day 9 to 16 after PCI | Cardiologist | Infusion into IRCA | CD133‐positive cells | BM aspiration (**), immunomagnetic selection to isolate CD133‐positive cells | 0.9% saline solution and 10% human serum albumin | Median (range): 5.9 (4.9 to 13.5) million cells | No additional therapy (Control) | |
| Mean 17.1 (0.6) hours after PCI | Cardiologist | Infusion into IRCA | BM‐MSC | BM aspiration (**), culture for 14 days to select MSC | Heparinised saline | 3.08 (0.52) million cells | No additional therapy (Control) | |
| Within 15 hours of AMI | Cardiologist | Infusion into IRCA | BMMNC | n/r | n/r | 40 million cells | Placebo (n/r) | |
| 5 to 6 days after PCI | Cardiologist | Infusion into IRCA | BMMNC | BM aspiration (**) | X‐vivo 15 medium and 2% autologous plasma | 410 (180) million cells | No additional therapy (Control) | |
| Hirsch 2011 | 3 to 8 days after PCI | Cardiologist | Infusion into IRCA | BMMNC | BM aspiration (**) | Heparinised saline and 4 % human serum albumin | 296 (164) million cells | No additional therapy (Control) |
| Within 2 hours of PCI | Cardiologist | Infusion into IRCA | BMMNC | BM aspiration (**) | Heparinised saline | 180 (420) million cells | Placebo (heparinised saline) | |
| Within 2 hours of PCI | Cardiologist | Infusion into IRCA | BMMNC | BM aspiration (**) | Heparinised saline | 120 (650) million cells | Placebo (heparinised saline) | |
| Huikuri 2008 | Mean 70 (36) hours after thombolysis | Cardiologist | Infusion into IRCA | BMMNC | BM aspiration (**) | Heparinised saline and 50% autologous serum | 402 (196) million cells | Placebo (heparinised saline and 50% autologous serum) |
| Within 20 hours of PCI | Cardiologist | Infusion into IRCA | BMMNC | BM aspiration (**) | Heparinised saline and 5% autologous serum solution | 172 (72) million cells | Placebo (heparinised saline and 5% autologous serum) | |
| Within 1 month of AMI | Cardiologist | Infusion into IRCA | BMMNC | BM aspiration (**) | M199 medium containing VEGF, bFGF, IGF‐1 and 10% human serum | 2460 (SEM 840) million cells | No additional therapy (Control) | |
| At least 7 to 10 days after AMI | Cardiologist | Infusion into IRCA | BMMNC | BM aspiration (**) | Heparinised saline | 62.7 (17.5) million cells | No additional therapy (Control) | |
| 7 to 21 days after AMI | Cardiologist | Infusion into IRCA | BMMNC | BM aspiration (**) | n/r | 88.5 (49.2) million cells | No additional therapy (Control) | |
| Lee 2014 | 25 (2.4) days after BM aspiration at 3.8 (1.5) days after admission | Cardiologist | Infusion into IRCA | BM‐MSC | BM aspiration (**), culture for 2 to 3 weeks to isolate MSC | n/r | 72 (9) million cells | No additional therapy (Control) |
| Lunde 2006 | 4 to 8 days after AMI | Cardiologist | Infusion into IRCA | BMMNC | BM aspiration (**) | Heparinised plasma | Median (interquartile range): 68 (54 to 130) million cells | No additional therapy (Control) |
| 5 to 9 days (mean 7 (0.3) days) after AMI | Cardiologist | Infusion into IRCA | BMMNC | BM aspiration (**) | n/r | LD: 10 million cells (range: 9 to 20 million) HD: 100 million cells (90 to 200 million cells) | No additional therapy (Control) | |
| Nogueira 2009 | AG: 3 to 6 days (mean 5.5 (1.28) days) after PCI VG: 3 to 6 days (mean 6.1 (1.37) days) after PCI | Cardiologist | Infusion into IRCA (AG) or IRCV (VG) | BMMNC | BM aspiration (**) | Saline solution and 5% human serum albumin | 100 million cells | No additional therapy (Control) |
| 4 to 11 days (median 9 days) after PCI | Cardiologist | Infusion into IRCA | BMMNC | BM aspiration (**) | n/r | 2,640 million cells | No additional therapy (Control) | |
| Piepoli 2010 | 4 to 7 days after AMI | Cardiologist | Infusion into IRCA | BMMNC | BM aspiration (**) | Phosphate buffered saline ‐ EDTA and 5% human serum albumin | 249 million cells | No additional therapy (Control) |
| 3 to 11 days (mean 7 (2) days after AMI | Cardiologist | Infusion into IRCA | BMMNC | BM aspiration (**) | Heparinised saline | 144 (49) million cells | No additional therapy (Control) | |
| Quyyumi 2011 | LD: median 191.4 (IQR 167 to 201) hours, MD: 210.0 (IQR 194 to 210) hours, HD: 207.3 (IQR 191 to 215) hours after AMI | Cardiologist | Infusion into IRCA | CD34‐positive cells | BM aspiration (**), immunomagnetic selection to isolate CD34‐positive cells | Heparinised phosphate buffered saline, 40% autologous serum and 1% human serum albumin | LD: 4.8 (0.4) million cells MD: 9.9 (0.7) million cells HD: 14.3 (1.6) million cells | No additional therapy (Control) |
| Roncalli 2010 | At 7 to 10 days (mean 9 (SD 1.7)) days | Cardiologist | Infusion into IRCA | BMMNC | BM aspiration (**) | 4% human serum albumin solution | 98.3 (8.7) million cells | No additional therapy (Control) |
| Within 2 hours of successful PTCA | Cardiologist | Infusion into IRCA | BMMNC | n/r | Diluted autologous serum | n/r | Placebo (diluted autologous serum) | |
| Schachinger 2006 | Within 5 days (mean 4.3 (1.3) days) of PCI | Cardiologist | Infusion into IRCA | BMMNC | BM aspiration (**) | X‐VIVO medium and 20% autologous serum | 236 (174) million cells | Placebo (X‐VIVO medium and 20% autologous serum) |
| 5 to 12 days (mean 7 (2) days) after AMI | Cardiologist | Infusion into IRCA | BMMNC | BM aspiration (**) | Heparinised saline | 900 (300) million | Placebo (heparinised saline) | |
| Sürder 2013 | 5 to 7 days (E) or 3 to 4 weeks (L) after PCI | Cardiologist | Infusion into IRCA | BMMNC | BM aspiration (**) | Serum‐free medium and 20% of autologous serum | E: 159.7 (125.8) million cells L: 139.5 (120.5) million cells | No additional therapy (Control) |
| Tendera 2009 | Median 7 (IQR 3 to 12) days after PCI | Cardiologist | Infusion into IRCA | Selected cells (S): CD34/CXCR4‐ positive cells Unselected cells (U): BMMNC | BM aspiration (**). Selected cells: immunomagnetic selection to isolate CD34/CXCR4‐positive cells | Phosphate‐buffered saline | S: 1.9 million cells U: 178 million cells | No additional therapy (Control) |
| 3 to 10 days (median 4.5 (IQR 4 to 7) days) after PCI | Cardiologist | Infusion into IRCA | BMMNC | BM aspiration (**) | 0.9% saline solution and 5% human serum albumin | 100 million cells | Placebo (0.9% saline solution and 5% human serum albumin) | |
| Traverse 2011 | 2 to 3 weeks (median 17.5 (IQR 15.5 to 20.0) days) after AMI | Cardiologist | Infusion into IRCA | BMMNC | BM aspiration (**) | 0.9% saline solution and 5% human serum albumin | 147 (17) million cells | Placebo (0.9% saline solution and 5% human serum albumin) |
| Traverse 2012 | 3 days or 7 days after AMI | Cardiologist | Infusion into IRCA | BMMNC | BM aspiration (**) | 0.9% saline solution and 5% human serum albumin | 150 million cells | Placebo (0.9% saline solution and 5% human serum albumin) |
| 7 days after AMI | Cardiologist | Infusion into IRCA | BMMNC | BM aspiration (**) | n/r | n/r | No additional therapy (control) | |
| 15 (1) days after PCI | Cardiologist | Infusion into IRCA | BM‐MSC | BM aspiration (**) and culture of MSC | Heparinised saline | 100 million cells | Placebo (heparinised saline) | |
| Wohrle 2010 | 5 to 7 days (median 6.1 (IQR 5.5 to 7.3) days) after AMI | Cardiologist | Infusion into IRCA | BMMNC | BM aspiration (**) | 0.9% saline solution, 2% human serum albumin and 0.1% autologous erythrocytes | 381 (130) million cells | Placebo (0.9% saline solution, 2% human serum albumin and 0.1% autologous erythrocytes) |
| Wollert 2004 | 4.7 (1.3) days after PCI | Cardiologist | Infusion into IRCA | BMMNC | BM aspiration (**) | Heparinised saline | 2460 (940) million cells | No additional therapy (Control) |
| Within 4 weeks of AMI | Cardiologist | Infusion into IRCA | BM‐MSC | BM aspiration (**) and culture of MSC | n/r | 460 (160) million cells | Placebo (heparinised saline) | |
| Within 7 days of AMI | Cardiologist | Infusion into IRCA | BMMNC | BM aspiration (**) | Lymphocyte isolation medium | 210 (370) million cells | No additional therapy (control) | |
| SD: 3 to 7 days after PCI DD 3 to 7 days after PCI; second dose at 3 months | Cardiologist | Infusion into IRCA | BMMNC | BM aspiration (**) | Heparinised plasma | SD: 410 million cells DD: 190 (SE 120) million cells | Placebo (heparinised plasma) | |
| At day 14 | Cardiologist | Infusion into IRCA | BM‐MSC | BM aspiration (**), second centrifugation and culture of MSC | n/r | 75 million cells | No additional therapy (control) | |
| 14 to 19 days after AMI | Cardiologist | Infusion into IRCA | BMMNC | BM aspiration (**) | Autologous serum | 50 million cells | No additional therapy (control) | |
| AMI ‐ acute myocardial infarction, PCI ‐ percutaneous coronary intervention, BM ‐ bone marrow, PTCA ‐ percutaneous transluminal coronary angioplasty, IRCA ‐ infarct‐related coronary artery, IRCV ‐ infarct‐related coronary vein, BMMNC ‐ bone marrow mononuclear cells, BM‐MSC ‐ mesenchymal stem cells; LD ‐ low dose, MD ‐ moderate dose, HD ‐ high dose, AG ‐ arterial group, VG ‐ venous group, E ‐ early cells, L ‐ late cells, S ‐ selected cells, U ‐ unselected cells, SD ‐ single dose, DD ‐ double dose ** BM aspiration‐ bone marrow aspiration and isolation of bone marrow mononuclear cells by gradient centrifugation | ||||||||
| Study ID | Primary Outcomes | Secondary Outcomes | ||||||||||||||||||||||
| All‐cause mortality | Cardiovascular mortality | Composite MACE (a) | Reinfarction | Hospital readmission for HF | Target vessel revascularisation | Arrhythmias | Restenosis | NYHA class | Quality of life (QoL) | Exercise tolerance | LVEF (b) | |||||||||||||
| ST | LT | ST | LT | ST | LT | ST | LT | ST | LT | ST | LT | ST | LT | ST | LT | ST | LT | ST | LT | ST | LT | ST | LT | |
| PR* | PR* | PR* | PR* | NR | NR | NR | NR | NR | NR | NR | NR | NR | NR | NR | NR | NR | NR | NR | NR | NR | NR | FR | FR | |
| PR* | FR | NR | NR | NR | NR | PR* | PR* | NR | NR | PR* | FR | NR | NR | PR* | FR | NR | NR | NR | NR | NR | NR | FR | FR | |
| PR* | NR | NR | NR | NR | NR | NR | NR | NR | NR | NR | NR | PR* | NR | NR | NR | NR | NR | NR | NR | NR | NR | FR | NR | |
| PR* | PR* | NR | PR* | NR | NR | NR | NR | FR | PR | NR | NR | NR | FR | NR | NR | NR | NR | NR | NR | NR | PR | FR | FR | |
| FR | FR | FR | FR | NR | FR | FR | FR | NR | FR | NR | NR | PR* | PR* | NR | NR | NR | NR | NR | NR | NR | NR | FR | FR | |
| PR* | NR | NR | NR | NR | NR | NR | NR | NR | NR | NR | NR | PR* | NR | NR | NR | NR | NR | NR | NR | NR | NR | FR | NR | |
| NR | FR | NR | NR | NR | NR | FR | NR | NR | NR | FR | NR | NR | NR | FR | NR | NR | NR | NR | NR | FR | FR | FR | FR | |
| PR* | FR | NR | NR | FR | FR | FR | FR | FR | FR | FR | FR | FR | FR | NR | NR | NR | FR | NR | NR | NR | NR | FR | FR | |
| PR* | NR | NR | NR | NR | NR | PR* | NR | NR | NR | NR | NR | NR | NR | NR | NR | NR | NR | NR | NR | NR | NR | FR | NR | |
| NR | NR | NR | NR | NR | NR | NR | NR | NR | NR | NR | NR | NR | NR | NR | NR | NR | NR | NR | NR | NR | NR | FR | NR | |
| FR | NR | FR | NR | NR | NR | FR | NR | FR | NR | NR | NR | PR* | NR | PR | NR | NR | NR | NR | NR | FR | NR | FR | NR | |
| FR | NR | PR* | NR | NR | NR | NR | NR | NR | NR | PR* | NR | FR | NR | FR | NR | NR | NR | NR | NR | NR | NR | FR | FR | |
| PR* | NR | PR* | NR | NR | NR | PR* | NR | NR | NR | NR | NR | PR* | NR | PR* | NR | FR | NR | NR | NR | NR | NR | FR | NR | |
| NR | NR | NR | NR | NR | NR | NR | NR | NR | NR | NR | NR | NR | NR | NR | NR | FR | FR | FR | FR | NR | NR | FR | FR | |
| PR* | FR | PR* | FR | NR | NR | FR | FR | NR | NR | NR | NR | NR | NR | NR | NR | NR | PR | FR | NR | FR | NR | FR | NR | |
| PR* | NR | PR* | NR | NR | NR | FR | NR | NR | NR | PR* | NR | PR* | NR | NR | NR | NR | NR | NR | NR | NR | NR | FR | NR | |
| NR | FR | NR | NR | NR | NR | FR | FR | FR | FR | NR | FR | NR | FR | FR | NR | FR | NR | FR | NR | FR | NR | FR | FR | |
| PR* | PR* | PR* | PR* | NR | NR | FR | FR | FR | FR | NR | NR | PR* | NR | FR | PR | NR | NR | NR | NR | NR | NR | FR | FR | |
| FR | NR | PR* | NR | NR | NR | NR | NR | NR | NR | NR | NR | NR | NR | PR | NR | NR | NR | NR | NR | NR | NR | FR | NR | |
| FR | FR | FR | FR | NR | FR | FR | FR | FR | FR | NR | NR | NR | PR* | NR | FR | NR | FR | NR | PR | NR | NR | FR | FR | |
| FR | FR | FR | FR | NR | NR | NR | NR | NR | NR | NR | NR | PR | NR | NR | FR | NR | NR | NR | NR | FR | PR | FR | FR | |
| FR | FR | FR | FR | NR | PR | FR | FR | NR | FR | NR | NR | NR | NR | NR | NR | NR | NR | NR | NR | NR | NR | FR | FR | |
| FR | FR | FR | FR | NR | NR | NR | NR | NR | FR | NR | FR | NR | PR* | NR | FR | NR | NR | NR | NR | NR | NR | FR | NR | |
| FR | PR | NR | NR | NR | NR | NR | NR | FR | NR | NR | NR | FR | NR | FR | NR | NR | NR | PR | PR | NR | NR | FR | PR | |
| NR | NR | NR | NR | NR | NR | NR | NR | NR | NR | NR | NR | NR | NR | NR | NR | NR | NR | NR | NR | NR | NR | FR | NR | |
| FR | FR | NR | FR | FR | FR | FR | FR | FR | FR | FR | FR | FR | FR | NR | NR | NR | NR | NR | NR | NR | NR | FR | FR | |
| PR* | NR | PR* | NR | NR | NR | PR* | NR | NR | NR | PR* | NR | PR* | NR | PR* | NR | NR | NR | NR | NR | NR | NR | FR | NR | |
| FR | PR | NR | NR | PR | PR | FR | NR | FR | NR | NR | NR | NR | NR | NR | NR | FR | NR | NR | NR | NR | NR | FR | FR | |
| FR | NR | NR | NR | NR | NR | FR | NR | NR | NR | FR | NR | NR | NR | NR | NR | NR | NR | NR | NR | NR | NR | FR | NR | |
| PR* | NR | PR* | NR | NR | NR | NR | FR | NR | NR | NR | FR | NR | NR | NR | FR | NR | NR | NR | NR | NR | NR | FR | NR | |
| FR | NR | NR | NR | NR | NR | FR | NR | FR | NR | FR | NR | NR | NR | NR | NR | NR | NR | NR | NR | NR | NR | FR | NR | |
| FR | FR | NR | NR | PR | PR | FR | FR | FR | FR | FR | FR | NR | NR | NR | NR | NR | NR | NR | NR | NR | NR | FR | FR | |
| PR* | NR | PR* | NR | NR | NR | NR | NR | NR | NR | NR | NR | NR | NR | NR | NR | FR | FR | NR | NR | NR | NR | FR | FR | |
| FR | NR | NR | NR | NR | NR | NR | NR | NR | NR | NR | NR | NR | NR | NR | NR | NR | NR | NR | NR | NR | NR | FR | NR | |
| FR | NR | NR | NR | FR | FR | PR* | NR | FR | NR | PR* | NR | NR | NR | FR | NR | NR | NR | NR | NR | NR | NR | FR | FR | |
| PR* | FR | NR | FR | NR | FR | FR | FR | FR | FR | PR* | FR | NR | NR | FR | NR | NR | NR | NR | NR | NR | NR | FR | FR | |
| NR | NR | NR | NR | PR | NR | NR | NR | NR | NR | NR | NR | FR | NR | NR | NR | NR | NR | NR | NR | NR | NR | FR | NR | |
| NR | PR* | NR | PR* | NR | NR | NR | FR | NR | NR | NR | NR | NR | NR | FR | FR | NR | NR | NR | NR | NR | NR | FR | NR | |
| PR* | PR* | PR* | PR* | NR | NR | FR | FR | NR | NR | NR | NR | PR | PR | NR | NR | NR | NR | NR | NR | NR | NR | FR | FR | |
| PR* | NR | PR* | NR | NR | NR | NR | NR | NR | NR | NR | NR | PR* | NR | NR | NR | PR | NR | PR | NR | NR | NR | FR | NR | |
| FR | FR | FR | FR | NR | NR | NR | FR | NR | NR | NR | NR | NR | FR | NR | NR | NR | NR | NR | NR | NR | NR | NR | FR | |
| Total (%) analysed (c) | 1365 (50.0) | 996 (36.5) | 290 (10.6) | 527 (19.3) | 379 (13.9) | 497 (18.2) | 1521 (55.7) | 1116 (40.8) | 1194 (43.7) | 825 (30.2) | 789 (28.9) | 758 (27.7) | 525 (19.2) | 457 (16.7) | 641 (23.5) | 395 (14.4) | 398 (14.6) | 237 (8.7) | 154 (5.6) | 26 (1.0) | 267 (9.8) | 45 (1.6) | 1135 (41.5)(d) | 727 (26.6)(d) |
| ST ‐ short‐term follow‐up (< 12 months) LT ‐ long‐term follow‐up (≥ 12 months) FR ‐ full reporting, outcome included in analysis PR ‐ partial reporting, insufficient information on outcome reported for inclusion in analysis * no incidence of outcome observed NR ‐ outcome not reported HF ‐ heart failure; NYHA ‐ New York Heart Association; LVEF ‐ left ventricular ejection fraction (a)Composite measure of mortality, reinfarction or rehospitalisation for heart failure. (b)LVEF measured by any method. (c)Total number of participants included in meta‐analysis of outcome (% of total number of participants from all included studies). (d)Total number analysed given for LVEF measured by magnetic resonance imaging. | ||||||||||||||||||||||||
| Study ID | Number of analysed participants | All‐cause mortality events | Cardiovascular mortality events | Reinfarction | Target vessel revascularisation | Composite MACE (death, reinfarction, rehospitalisation for HF) | |||||||||||
| Cells | No cells | Cells | No cells | Length of follow‐up | Cells | No cells | Length of follow‐up | Cells | No cells | Length of follow‐up | Cells | No cells | Length of follow‐up | Cells | No cells | Length of follow‐up | |
| 11 | 11 | 0 | 0 | 12 months | 0 | 0 | 12 months | NR | NR | ‐ | NR | NR | ‐ | NR | NR | ‐ | |
| 41 | 45 | 0 | 1 | 48 months | NR | NR | ‐ | 0 | 0 | 48 months | 0 | 1 | 48 months | NR | NR | ‐ | |
| 34 | 35 | 0 | 0 | 6 months | 0 | 0 | 6 months | NR | NR | ‐ | NR | NR | ‐ | NR | NR | ‐ | |
| 5 | 4 | 0 | 0 | 12 months | 0 | 0 | 12 months | NR | NR | ‐ | NR | NR | ‐ | NR | NR | ‐ | |
| 21 | 21 | 1 | 0 | 24 months | 1 | 0 | 24 months | 1 | 0 | 24 months | NR | NR | ‐ | 2 | 1 | 24 months | |
| 10 | 10 | 0 | 0 | 6 months | 0 | 0 | 6 months | NR | NR | ‐ | NR | NR | ‐ | NR | NR | ‐ | |
| 27 | 12 | 1 | 0 | 12 months | NR | NR | ‐ | 1 (a) | 1 (a) | 6 months | 3 (a) | 4 (a) | 6 months | NR | NR | ‐ | |
| 65 | 60 | 1 | 2 | 60 months | NR | NR | ‐ | 1 | 1 | 60 months | 20 | 14 | 60 months | 2 | 5 | 60 months | |
| 20 | 20 | 0 | 0 | 6 months | 0 | 0 | 6 months | 0 | 0 | 6 months | NR | NR | ‐ | NR | NR | ‐ | |
| 20 | 20 | NR | NR | ‐ | NR | NR | ‐ | NR | NR | ‐ | NR | NR | ‐ | NR | NR | ‐ | |
| 40 | 40 | 0 | 1 | 6 months | 0 | 1 | 6 months | 0 | 2 | 6 months | NR | NR | ‐ | NR | NR | ‐ | |
| 33 | 34 | 1 | 0 | 4 months | 0 | 0 | 4 months | NR | NR | 4 months | NR | NR | ‐ | NR | NR | ‐ | |
| 16 | 16 | 0 | 0 | 6 months | 0 | 0 | 6 months | 0 | 0 | 6 months | NR | NR | ‐ | NR | NR | ‐ | |
| 14 | 12 | NR | NR | ‐ | NR | NR | ‐ | NR | NR | ‐ | NR | NR | ‐ | NR | NR | ‐ | |
| 26 | 32 | 10 | 4 | 8.2 years | 8 | 2 | 8.2 years | 2 | 2 | 8.2 years | NR | NR | ‐ | NR | NR | ‐ | |
| 30 | 28 | 0 | 0 | 6 months | 0 | 0 | 6 months | 2 | 0 | 6 months | 0 | 0 | 6 months | NR | NR | ‐ | |
| 49 | 50 | 1 | 1 | 36 months | NR | NR | ‐ | 1 | 2 | 36 months | 12 | 9 | 36 months | NR | NR | ‐ | |
| 44 | 20 | 0 | 0 | 12 months | 0 | 0 | 12 months | 2 | 0 | 12 months | NR | NR | ‐ | NR | NR | ‐ | |
| 24 | 6 | 1 | 0 | 6 months | 0 | 0 | 6 months | NR | NR | ‐ | NR | NR | ‐ | NR | NR | ‐ | |
| 17 | 10 | 3 | 0 | 24 months | 2 | 0 | 24 months | 1 | 1 | 24 months | NR | NR | ‐ | 6 | 5 | 24 months | |
| 19 | 19 | 2 | 4 | 12 months | 2 | 3 | 12 months | NR | NR | ‐ | NR | NR | ‐ | NR | NR | ‐ | |
| 40 | 20 | 2 | 2 | 24 months | 2 | 2 | 24 months | 1 | 1 | 24 months | NR | NR | ‐ | NR (c) | NR (c) | ‐ | |
| 16 | 15 | 1 | 0 | 12 months | 1 | 0 | 12 months | NR | NR | ‐ | 2 | 1 | 12 months | NR | NR | ‐ | |
| 48 | 44 | 1 | 0 | 3 months | NR | NR | ‐ | NR | NR | ‐ | NR | NR | ‐ | NR | NR | ‐ | |
| 9 | 11 | NR | NR | ‐ | NR | NR | ‐ | NR | NR | ‐ | NR | NR | ‐ | NR | NR | ‐ | |
| 100 (b) | 100 (b) | 7 | 15 | 60 months | 5 | 9 | 60 months | 5 (b) | 7 (b) | 24 months | 18 (b) | 28 (b) | 60 months | 4 | 15 | 24 months | |
| 10 | 10 | 0 | 0 | 3 months | 0 | 0 | 3 months | 0 | 0 | 3 months | 0 | 0 | 3 months | NR | NR | ‐ | |
| 115 | 60 | 2 | 0 | 4 months | 0 | 0 | 4 months | 1 | 1 | 4 months | NR | NR | ‐ | NR (d) | NR (d) | ‐ | |
| 160 | 40 | 2 | 1 | 6 months | NR | NR | 3 | 2 | 6 months | 25 | 7 | 6 months | NR | NR | ‐ | ||
| 30 | 10 | 0 | 0 | 15 months | 0 | 0 | 15 months | 0 | 1 | 15 months | 0 | 1 | 15 months | NR | NR | ‐ | |
| 58 | 29 | 0 | 1 | 6 months | NR | NR | ‐ | 1 | 0 | 6 months | 1 | 2 | 6 months | NR | NR | ‐ | |
| 79 | 41 | 1 | 0 | 12 months | NR | NR | ‐ | 2 | 3 | 12 months | 4 | 4 | 12 months | NR (e) | NR (e) | ‐ | |
| 42 | 20 | 0 | 0 | 6 months | 0 | 0 | 6 months | NR | NR | ‐ | NR | NR | ‐ | NR | NR | ‐ | |
| 28 | 30 | 1 | 2 | 6 months | NR | NR | ‐ | NR | NR | ‐ | NR | NR | ‐ | NR | NR | ‐ | |
| 29 | 13 | 1 | 1 | 6 months | NR | NR | ‐ | 0 | 0 | 6 months | 0 | 0 | 6 months | 5 | 1 | 36 months | |
| 30 | 30 | 2 | 2 | 61 months | NR | NR | ‐ | 1 | 1 | 61 months | 6 | 4 | 61 months | 5 | 6 | 61 months | |
| 17 | 21 | NR | NR | 3 months | NR | NR | 3 months | NR | NR | 3 months | NR | NR | 3 months | NR (f) | NR (f) | 3 months | |
| 90 | 84 | 0 | 0 | 30 months | 0 | 0 | 30 months | 2 | 2 | 30 months | NR | NR | ‐ | NR | NR | ‐ | |
| 27 | 12 | 0 | 0 | 12 months | 0 | 0 | 12 months | 0 | 1 | 12 months | NR | NR | ‐ | NR | NR | ‐ | |
| 7 | 16 | 0 | 0 | 8 weeks | 0 | 0 | 8 weeks | NR | NR | ‐ | NR | NR | ‐ | NR | NR | ‐ | |
| 8 | 3 | 2 | 1 | 36 months * | 2 | 1 | 36 months * | 1 | 0 | 36 months | NR | NR | ‐ | NR | NR | ‐ | |
| (a)Grajek 2010: 31 BMMNC and 14 controls available for analysis at 6 months. (b)Schachinger 2006: 100 BMMNC and 101 controls analysed at 24 months; 3 patients (2 BMMNC and 1 control) only had mortality data at 60 months. (c)Plewka 2009: Composite death, MI, hospitalisation for HF, TVR: 9 BMMNC and 11 controls at 24 months. (d)Sürder 2013: Composite death, MI, revascularisation, hospitalisation for HF: 9 BMMNC and 8 controls at 12 months. (e)Traverse 2012: Composite death, MI, hospitalisation for HF, revascularisation, ICD, stroke: 18 BMMNC and 9 controls at 12 months. (f)Xiao 2012: Composite MACE (undefined): 3 BMMNC and 2 controls at 3 months. | |||||||||||||||||
| Study ID | Periprocedural adverse events |
| Not reported | |
| 1 x transient acute heart failure 7 days after cell transplantation | |
| Not reported | |
| No adverse events were reported until the end of hospitalisation | |
| 1 x death 3 days after cell transplantation due to suspected acute in‐stent thrombosis; 1 x serious complication of acute coronary occlusion during cell injection with subsequent recurrent MI | |
| No bleeding complications at BM puncture site and no angina aggravation, malignant diseases or substantial arrhythmias after PCI and BM transfer during hospitalisation in either treatment group | |
| Not reported | |
| No complications of cell harvesting. A CK or CK‐MB elevation between 1 and 2 times the ULN was detected in 4 patients and between 2 and 3 times the ULN in one patient. 1 x occluded infarct‐related artery (patient did not receive cell therapy as randomised). During cell catheterisation: 1 x coronary spasm, 1 x transient brachycardia and 1 x thrombus in the infarct related artery | |
| Not reported | |
| Not reported | |
| 3 x mild self terminating vasovagal reactions during BM aspiration; no other procedural complications relating to aspiration. Subacute stent thrombosis occurred in 4 patients (1 x cell therapy and 3 x placebo); 1 x cell therapy patient had 'no reflow' phenomenon after stenting of the infarcted artery | |
| 11 x treatment‐related tachycardia (supraventricular arrhythmia: 5 in the cell therapy group and 6 in the control group); 3 patients in the control group experienced non‐sustained ventricular tachycardia | |
| Not reported | |
| Not reported | |
| No complications of BM aspiration or cell infusion | |
| No serious inflammatory reactions or bleeding complications from BM aspiration. No (or mild) angina during balloon inflation. No serious procedural complications related to intracoronary administration of MSCs including ventricular arrhythmia, thrombus formation or dissection. Periprocedural MI occurred in 2 patients | |
| 2 x stent thrombosis in the acute phase in the cell therapy group (no cells administered as randomised); 1 x sustained ventricular tachycardia before cell administration; 1 x ventricular fibrillation at day 6, 24 hours after injection.1 x pulseless ventricular tachycardia in control patient ‐ converted to sinus rhythm by means of a precordial thump on day 2 | |
| 2 patients had fever and 1 patient had brachycardia, all within 20 hours prior to cells (these patients did not receive cell therapy as randomised). 3 x cell therapy‐related complications: 1 x intimal dissection during repeat balloon inflations at time of cell implantation, 1 x short‐lasting fever on day of scheduled transplantation, 1 x small thrombus in infarct‐related artery diagnosed immediately after cell transplantation. 2 x control patients had repeat MI 2 days after the hospital discharge due to in‐stent thrombosis | |
| Ck‐MB elevation (3 x normal value) in 3 patients in the arterial group and 1 patient in venous group. 1 x tortuous anterior interventricular vein (patient did not receive cell therapy as randomised). No new pericardial effusions | |
| 2 x serious complications (1 x stent thrombosis with reinfarction immediately after BM harvest, patient died 2 weeks later due to sepsis and acute respiratory distress syndrome; 1 x ventricular septal rupture before cell injection, patient died 3 months later from severe heart failure). | |
| All procedures well tolerated. No inflammatory reaction or abscess detected at the site of puncture after BM harvest. The invasive coronary catheterisation was associated with some mild angina during balloon inflations for cell infusions. No procedural complications during cardiac catheterisation related to cell injections (no ventricular arrhythmia, new thrombus formation or embolism after cell infusion or dissections due to balloon inflations) | |
| Not reported | |
| 1 high‐dose treatment group patient died soon after cell infusion from ventricular fibrillation attributed to recurrent MI from stent thrombosis preceding cell infusion. 1 x high‐dose treatment group patient with acute stent thrombosis before cell infusion (patient withdrawn from study). Cell therapy group: 1 x arrhythmia, 1 x chest pain, 3 x musculoskeletal pain, 2 x upper respiratory tract infection, 2 x rash, 3 x dyspnoea, 1 x fever. Control group: 1 x arrhythmia, 3 x musculoskeletal pain, 1 x upper respiratory tract infection, 1 x dyspnoea | |
| Cell therapy group: 1 x transient ischaemic attack and 1 x thrombopenia induced by GP2b3a inhibitor (both excluded before BM aspiration). Control group: 1 x steroids given for angioneurotic oedema; 1 x post‐MI ventricular septal defect (both withdrawn before day 7) | |
| Not reported | |
| No bleeding complications or haematoma formation at puncture site of BM aspiration. 1 x patient was excluded owing to fever and an increase in the level of C‐reactive protein. 1 x patient in placebo group had angiographic evidence of a thrombus in a non‐infarct‐related artery (placebo medium not infused). 2 x deaths, cause not reported (1 x cell therapy group and 1 x placebo) and 2 x reinfarction (cell therapy group) prior to discharge | |
| Not reported | |
| 1 death in cell therapy group prior to transplantation, cause of death not reported | |
| 1 patient developed arteriovenous fistula of the femoral artery after the procedure and required surgical treatment. No complications arising from BM cell transfer | |
| BM aspiration carried out without complications. No patient experienced a rise in troponin or procedure‐related complication following infusion | |
| No complications associated with BM aspiration. 2 x patients underwent additional stenting at time of cell infusion (1 x distal stent edge dissection related to primary PCI procedure; 1 x possible dissection related to stop‐flow procedure). 1 x postpartum spontaneous coronary dissection with diffuse thrombus throughout stented region of left anterior descending artery; 1 x presence of severe left main coronary stenosis identified before transfusion (this patient did not receive cell therapy as randomised). No patients experienced postprocedural increase in cardiac enzymes | |
| No complications associated with BM harvesting or intracoronary infusion. 1 x death in the BM cell therapy group due to subarachnoid haemorrhage prior to cell delivery | |
| No procedural or cell‐induced complications and no side effects in any patient | |
| Not reported | |
| Not reported | |
| No bleeding complications at BM harvest site. No increases in troponin T serum levels in any patients 24 hours after BM transfer | |
| Not reported | |
| 1 x temporary hypotension, 2 x brachycardia, 7 x new hyperuricaemia | |
| 1 x brachycardia with subsequent pacemaker implantation, 1 x fever (these patients did not receive cells as randomised) | |
| Not reported | |
| Not reported | |
| MI, acute myocardial infarction; PCI, percutaneous coronary intervention; BM, bone marrow; MSC, mesenchymal stem cells; ULN, upper limit of normal | |
| Study ID | No. analysed participants | Quality of life (QoL) assessment | Reported data (EP/MC/SR) | Performance assessment | Summary measures of performance | Reported data (EP/MC/SR) | Mean follow‐up | |
| Cells | No cells | |||||||
| 5 | 4 | n/r | n/r | Exercise stress test | Peak HR, peak MET, peak double product (SBPxHR), peak predicted HR | EP (median) | 12 months | |
| 31 | 14 | n/r | n/r | Cardiopulmonary exercise treadmill test (modified Bruce protocol) | METs, maximum VO2 , VE/VCO2 slope, RER, peak SBP, peak HR, VO2 anaerobic threshold, HR recovery | EP | 12 months | |
| 65 | 60 | n/r | n/r | NYHA class | EP | 60 months | ||
| 27 | 27 | n/r | n/r | Symptom‐limited maximal exercise test | METs, peak HR, T‐wave alternans | EP, MC | 6 months | |
| 16 | 16 | n/r | n/r | NYHA class | EP | 6 months | ||
| 14 | 12 | MLHFQ | EP | NYHA class | EP | 12 months | ||
| 16 (a) | 28 (a) | MLHFQ | EP | Six minute walk test; functional class (undefined) | Distance (metres) | EP | 6 months | |
| 50 (b) | 50 (b) | SF‐36 | EP, MC | Electrically braked bicycle ergometer; NYHA class | Time (min), maximum VO2 , VE/VCO2 slope etc., peak HR | EP, MC | 6 months | |
| 14 | 10 | SF‐36 | SR | NYHA class | EP | 24 months | ||
| 17 | 15 | n/r | n/r | Cardiopulmonary exercise treadmill test (modified Bruce protocol) | Exercise duration (min), maximum VO2 , VE/VCO2 slope | MC | 12 months | |
| 52 | 49 | MLHFQ | SR | n/r | 12 months | |||
| 117 | 61 | n/r | n/r | NYHA class | EP | 4 months | ||
| 42 | 20 | n/r | n/r | NYHA class | EP | 12 months | ||
| 7 | 16 | QoL (no details) | NYHA class | SR | 8 weeks | |||
| MLHFQ, Minnesota Living with Heart Failure Questionnaire; NYHA, New York Heart Association; SF‐36, Short‐Form 36 Quality of Life; MET, metabolic equivalent test (mL/kg/min); HR, heart rate (bpm); SBP, systolic blood pressure (mmHg); RER, respiratory exchange ratio; VE, minute ventilation; VO2, oxygen volume; VCO2, carbon dioxide volume; EP, endpoint; MC, mean change from baseline; SR, summary results; n/r, not reported. (a)Karpov 2005: QoL was measured in 37 participants (cells: 18 cells, no cells: 19) (b)Lunde 2006: QoL was measured in 46 BMMNC and 45 controls; exercise tolerance was measured in 49 BMMNC and 50 controls | ||||||||
| Study ID | No. randomised participants | No. analysed participants | Baseline LVEF | Mean follow‐up of LVEF | |||
| Cells | No cells | Cells | No cells | Cells | No cells | ||
| Measured by MRI | |||||||
| Hirsch 2011 (HEBE) | 69 | 65 | 59 | 52 | 43.7 (9.0)% | 42.4 (8.3)% | 24 months |
| 20 | 20 | 20 | 20 | 44.5 (7.1)% | 43.4 (6.7)% | 6 months | |
| 33 | 34 | 30 | 30 | 48.5 (7.2)% | 46.9 (8.2)% | 12 months | |
| Lunde 2006 (ASTAMI) | 50 | 51 | 44 | 44 | 54.8 (13.6)% | 53.6 (11.6)% | 36 months |
| Quyyumi 2011 (AMR‐1) | 16 | 15 | 11 | 10 | LD: 47.0 (13)% MD: 47.3 (11)% HD: 49.9 (7)% | 53.2(10)% | 6 months |
| Roncalli 2010 (BONAMI) | 52 | 49 | 47 | 43 | 37.0 (9.8)% | 38.7 (9.2)% | 3 months |
| Schachinger 2006 (REPAIR‐AMI) | 101 | 103 | 26 | 33 | 47.8 (6.2)% | 47.7 (6.2)% | 60 months (a) |
| Sürder 2013 (SWISS‐AMI) | 133 | 67 | 107 | 60 | E: 36.5 (9.9)% L: 36.3 (8.2)% | 40.0 (9.9)% | 4 months |
| Tendera 2009(REGENT) | 160 | 40 | 97 | 20 | S: 33.9 (8.6)% U: 35.6 (6.5)% | 38.9 (5.2)% | 6 months |
| 30 | 10 | 30 | 10 | 49 (9.5)% | 48.6 (8.5)% | 6 months | |
| Traverse 2011 (LATE‐TIME) | 59 | 29 | 55 | 26 | 48.7 (12)% | 45.3 (9.9)% | 6 months |
| Traverse 2012 (TIME) | 80 | 40 | 65 | 30 | 46.2 (9.6)% | 46.3 (8.5)% | 12 months |
| Wohrle 2010 (SCAMI) | 29 | 13 | 28 | 12 | 53.5 (9.3)% | 55.7 (9.4)% | 36 months |
| Wollert 2004 (BOOST) | 33 | 32 | 30 | 30 | 50 (10)% | 51.3 (9.3)% | 60 months |
| 30 | 15 | 27 | 11 | SD: 32.5 (3.6)% DD: 33.7 (4.7)% | 32.3 (2.0)% | 12 months | |
| 8 | 3 | 6 (b) | 1 (b) | 33.4 (3)% | 28 (4)% | 36 months (b) | |
| Measured by echocardiography | |||||||
| 11 | 11 | 11 | 11 | n/r | n/r | 12 months | |
| 41 | 45 | 41 | 45 | 41.3 (2.8)% | 40.7 (3.1)% | 48 months | |
| 5 | 5 | 5 | 4 | 44.6 (8.8)% | 43.2 (9.1)% | 12 months | |
| 21 | 22 | 19 | 20 | 50.8 (6.5)% | 51.4 (7.2)% | 24 months | |
| 10 | 10 | 10 | 10 | 53.8 (9.2)% | 58.2 (7.5)% | 6 months | |
| 31 | 14 | 27 | 12 | 50.3 (9.8)% | 50.8 (12)% | 12 months | |
| 20 | 20 | 20 | 20 | 48.5 (5.5)% | 48.2 (6.30% | 6 months | |
| Huikuri 2008 (FINCELL) | 40 | 40 | 39 | 38 | 56 (10)% | 57 (10)% | 6 months |
| 14 | 12 | 14 | 12 | 54.3 (5.5)% | 55.8 (5.9)% | 12 months | |
| 22 | 22 | 16 | 10 | 49.3 (11.1)% | 47.0 (7.5)% | 6 months | |
| Lee 2014 (SEED‐MSC) | 40 | 40 | 30 | 28 | 48.1 (8.0)% | 51.0 (9.2)% | 6 months |
| Lunde 2006 (ASTAMI) | 50 | 51 | 50 | 50 | 45.7 (9.4)% | 46.9 (8.6)% | 36 months |
| Nogueira 2009 (EMRTCC) | 24 | 6 | 22 | 6 | AG: 48.3 (10.4)% VG: 48.6 (7.1)% | 47.6 (14.3)% | 6 months |
| 17 | 10 | 14 | 10 | 39.2 (9.2)% | 39.4 (5.6)% | 24 months | |
| Piepoli 2010 (CARDIAC) | 19 | 19 | 17 | 15 | 38.4 (6.4)% | 38.9 (5.6)% | 24 months |
| 40 | 20 | 38 | 18 | 35 (6)% | 33 (7)% | 24 months | |
| Roncalli 2010 (BONAMI) | 52 | 49 | 47 | 43 | 38.1 (7.9)% | 39.8 (7.0)% | 12 months (c) |
| 9 | 11 | 9 | 11 | 53.4 (8.9)% | 53.5 (5.8)% | 6 months | |
| 17 | 21 | 17 | 21 | 35.6 (3.1)% | 35.7 (3.1)% | 3 months | |
| 7 | 16 | 7 | 16 | 37 (4.6)% | 38.6 (5.4)% | 8 weeks | |
| Measured by SPECT | |||||||
| 11 | 11 | 11 | 11 | n/r | n/r | 12 months | |
| 41 | 45 | 41 | 45 | 41.2 (3.1)% | 40.8 (3.3)% | 48 months | |
| Lee 2014 (SEED‐MSC) | 40 | 40 | 30 | 28 | 49.0 (11.7)% | 52.3 (9.3)% | 6 months |
| Lunde 2006 (ASTAMI) | 50 | 51 | 50 | 50 | 41.3 (10.4)% | 42.6 (11.7)% | 6 months |
| 44 | 22 | 40 | 20 | LD: 41 (2)% HD: 30 (2)% | 40 (2)% | 12 months | |
| Piepoli 2010 (CARDIAC) | 19 | 19 | 17 | 15 | 36.6 (8.2)% | 37.5 (8.9)% | 24 months |
| 40 | 20 | 26 | 10 | 41.2 (10.1)% | 40.0 (14.2)% | 6 months | |
| Measured by LV angiography | |||||||
| 34 | 35 | 34 | 35 | 49 (9)% | 48 (10)% | 6 months | |
| 20 | 20 | 20 | 20 | 56.7 (9.7)% | 57.3 (8.2)% | 6 months | |
| Huikuri 2008 (FINCELL) | 40 | 40 | 36 | 36 | 59 (11)% | 62 (12)% | 6 months |
| n/r | n/r | 16 | 16 | 33.37 (11.2)% | 29.0 (7.5)% | 6 months | |
| Schachinger 2006 (REPAIR‐AMI) | 101 | 103 | 95 | 92 | 48.3 (9.2)% | 46.9 (10.4)% | 4 months |
| 10 | 10 | 10 | 10 | 37 (5)% | 39 (6)% | 3 months | |
| 42 | 20 | 42 | 20 | 43 (10)% | 45 (10)% | 12 months | |
| 30 | 30 | 27 | 28 | 37.8 (6.3)% | 20.2 (2.5)% (d) | 6 months | |
| 92 | 92 | 90 | 84 | n/r | n/r | 6 months | |
| Measured by RNV | |||||||
| 31 | 14 | 27 | 12 | 45.4 (10.2)% | 42.7 (7.4)% | 12 months | |
| Nogueira 2009 (EMRTCC) | 24 | 6 | 22 | 6 | AG: 41.0 (10.3)% VG: 39.9 (7.4)% | 40.1 (12.4)% | 6 months |
| Roncalli 2010 (BONAMI) | 52 | 49 | 47 | 43 | 35.6 (7.0)% | 37.0 (6.7)% | 3 months |
| Measured by gated PET | |||||||
| 5 | 5 | 5 | 4 | 36.6 (5.4)% | 37.6 (7.0)% | 12 months | |
| n/r ‐ not reported LD ‐ low dose, MD ‐ moderate dose, HD ‐ high dose, AG ‐ arterial group, VG ‐ venous group, E ‐ early cells, L ‐ late cells, S ‐ selected cells, U ‐ unselected cells, SD ‐ single dose, DD ‐ double dose (a)Schachinger 2006: MRI was performed at five‐year follow‐up but summary results only were reported; 24‐month data are used in meta‐analysis. (b)Zhukova 2009: 24‐month data were used in the analysis as only one control was available at 36 months. (c)Roncalli 2010: echocardiography was performed at 12‐month follow‐up but summary results only were reported; three‐month data are used in meta‐analysis. (d)Wang 2014: the reported baseline LVEF value in the control group is assumed to be an error since the difference between values at baseline and endpoint (49.1%) is not significant. We have been unable to clarify the correct value with the study authors. | |||||||
| Outcome or subgroup title | No. of studies | No. of participants | Statistical method | Effect size |
| 1 All‐cause mortality Show forest plot | 23 | Risk Ratio (M‐H, Random, 95% CI) | Subtotals only | |
| 1.1 Short‐term follow‐up (< 12 months) | 17 | 1365 | Risk Ratio (M‐H, Random, 95% CI) | 0.80 [0.43, 1.49] |
| 1.2 Long‐term follow‐up (≥ 12 months) | 14 | 996 | Risk Ratio (M‐H, Random, 95% CI) | 0.93 [0.58, 1.50] |
| 2 Cardiovascular mortality Show forest plot | 10 | Risk Ratio (M‐H, Random, 95% CI) | Subtotals only | |
| 2.1 Short‐term follow‐up (< 12 months) | 7 | 290 | Risk Ratio (M‐H, Random, 95% CI) | 0.72 [0.28, 1.82] |
| 2.2 Long‐term follow‐up (≥ 12 months) | 9 | 527 | Risk Ratio (M‐H, Random, 95% CI) | 1.04 [0.54, 1.99] |
| 3 Composite measure of death, reinfarction, re‐hospitalisation for heart failure Show forest plot | 6 | Risk Ratio (M‐H, Random, 95% CI) | Subtotals only | |
| 3.1 Short‐term follow‐up (< 12 months) | 3 | 379 | Risk Ratio (M‐H, Random, 95% CI) | 0.36 [0.12, 1.14] |
| 3.2 Long‐term follow‐up (≥ 12 months) | 6 | 497 | Risk Ratio (M‐H, Random, 95% CI) | 0.63 [0.36, 1.10] |
| 4 Incidence of reinfarction Show forest plot | 20 | Risk Ratio (M‐H, Random, 95% CI) | Subtotals only | |
| 4.1 Short‐term follow‐up (< 12 months) | 17 | 1521 | Risk Ratio (M‐H, Random, 95% CI) | 0.66 [0.33, 1.30] |
| 4.2 Long‐term follow‐up (≥ 12 months) | 14 | 1116 | Risk Ratio (M‐H, Random, 95% CI) | 0.64 [0.36, 1.12] |
| 5 Incidence of re‐hospitalisation for heart failure Show forest plot | 16 | Risk Ratio (M‐H, Random, 95% CI) | Subtotals only | |
| 5.1 Short‐term follow‐up (< 12 months) | 13 | 1194 | Risk Ratio (M‐H, Random, 95% CI) | 0.81 [0.40, 1.62] |
| 5.2 Long‐term follow‐up (≥ 12 months) | 10 | 825 | Risk Ratio (M‐H, Random, 95% CI) | 0.55 [0.30, 1.00] |
| 6 Incidence of target vessel revascularisation Show forest plot | 11 | Risk Ratio (M‐H, Random, 95% CI) | Subtotals only | |
| 6.1 Short‐term follow‐up (< 12 months) | 6 | 789 | Risk Ratio (M‐H, Random, 95% CI) | 0.70 [0.47, 1.06] |
| 6.2 Long‐term follow‐up (≥ 12 months) | 8 | 758 | Risk Ratio (M‐H, Random, 95% CI) | 0.96 [0.67, 1.37] |
| 7 Incidence of arrhythmias Show forest plot | 8 | Risk Ratio (M‐H, Random, 95% CI) | Subtotals only | |
| 7.1 Short‐term follow‐up (< 12 months) | 5 | 525 | Risk Ratio (M‐H, Random, 95% CI) | 1.00 [0.51, 1.98] |
| 7.2 Long‐term follow‐up (≥ 12 months) | 5 | 457 | Risk Ratio (M‐H, Random, 95% CI) | 1.39 [0.58, 3.37] |
| 8 Incidence of restenosis Show forest plot | 13 | Risk Ratio (M‐H, Random, 95% CI) | Subtotals only | |
| 8.1 Short‐term follow‐up (< 12 months) | 8 | 641 | Risk Ratio (M‐H, Random, 95% CI) | 0.95 [0.63, 1.43] |
| 8.2 Long‐term follow‐up (≥ 12 months) | 6 | 395 | Risk Ratio (M‐H, Random, 95% CI) | 0.58 [0.27, 1.25] |
| 9 Quality of life measures Show forest plot | 3 | Std. Mean Difference (IV, Random, 95% CI) | Subtotals only | |
| 9.1 Short‐term follow‐up (< 12 months) | 3 | 154 | Std. Mean Difference (IV, Random, 95% CI) | 0.58 [‐0.67, 1.83] |
| 9.2 Long‐term follow‐up (≥ 12 months) | 1 | 26 | Std. Mean Difference (IV, Random, 95% CI) | 3.23 [2.01, 4.46] |
| 10 NYHA classification Show forest plot | 7 | Mean Difference (IV, Random, 95% CI) | Subtotals only | |
| 10.1 Short‐term follow‐up (< 12 months) | 5 | 398 | Mean Difference (IV, Random, 95% CI) | ‐0.07 [‐0.24, 0.09] |
| 10.2 Long‐term follow‐up (≥ 12 months) | 4 | 237 | Mean Difference (IV, Random, 95% CI) | ‐0.23 [‐0.53, 0.07] |
| 11 Exercise tolerance Show forest plot | 5 | Std. Mean Difference (IV, Random, 95% CI) | Subtotals only | |
| 11.1 Short‐term follow‐up (< 12 months) | 5 | 267 | Std. Mean Difference (IV, Random, 95% CI) | 0.19 [‐0.06, 0.43] |
| 11.2 Long‐term follow‐up (≥ 12 months) | 1 | 45 | Std. Mean Difference (IV, Random, 95% CI) | ‐0.05 [‐0.68, 0.58] |
| 12 Maximum VO2 (mL/kg/min) Show forest plot | 3 | Mean Difference (IV, Random, 95% CI) | Subtotals only | |
| 12.1 Short‐term follow‐up (< 12 months) | 3 | 175 | Mean Difference (IV, Random, 95% CI) | 1.15 [‐0.77, 3.07] |
| 12.2 Long‐term follow‐up (≥ 12 months) | 1 | 45 | Mean Difference (IV, Random, 95% CI) | 0.40 [‐3.76, 4.56] |
| 13 VE/VCO2 slope Show forest plot | 3 | Mean Difference (IV, Random, 95% CI) | Subtotals only | |
| 13.1 Short‐term follow‐up (< 12 months) | 3 | 174 | Mean Difference (IV, Random, 95% CI) | 0.28 [‐1.02, 1.57] |
| 13.2 Long‐term follow‐up (≥ 12 months) | 1 | 45 | Mean Difference (IV, Random, 95% CI) | 0.0 [‐3.07, 3.07] |
| 14 Peak heart rate (bpm) Show forest plot | 3 | Mean Difference (IV, Random, 95% CI) | Subtotals only | |
| 14.1 Short‐term follow‐up (< 12 months) | 3 | 198 | Mean Difference (IV, Random, 95% CI) | 0.55 [‐6.79, 7.89] |
| 14.2 Long‐term follow‐up (≥ 12 months) | 1 | 45 | Mean Difference (IV, Random, 95% CI) | ‐9.10 [‐20.59, 2.39] |
| 15 LVEF measured by MRI (<12 months) Show forest plot | 15 | Mean Difference (IV, Random, 95% CI) | Subtotals only | |
| 15.1 Mean change from baseline | 13 | 1057 | Mean Difference (IV, Random, 95% CI) | 0.43 [‐1.16, 2.03] |
| 15.2 Mean value at endpoint | 15 | 1125 | Mean Difference (IV, Random, 95% CI) | 0.81 [‐0.78, 2.41] |
| 15.3 Combined | 15 | 1135 | Mean Difference (IV, Random, 95% CI) | 1.05 [‐0.56, 2.67] |
| 16 LVEF measured by MRI (≥ 12 months) Show forest plot | 9 | Mean Difference (IV, Random, 95% CI) | Subtotals only | |
| 16.1 Mean change from baseline | 5 | 438 | Mean Difference (IV, Random, 95% CI) | 0.03 [‐1.72, 1.78] |
| 16.2 Mean value at endpoint | 8 | 551 | Mean Difference (IV, Random, 95% CI) | 1.40 [‐1.54, 4.34] |
| 16.3 Combined | 9 | 718 | Mean Difference (IV, Random, 95% CI) | 1.27 [‐1.14, 3.68] |
| 17 LVEF measured by echocardiography (< 12 months) Show forest plot | 20 | Mean Difference (IV, Random, 95% CI) | Subtotals only | |
| 17.1 Mean change from baseline | 6 | 372 | Mean Difference (IV, Random, 95% CI) | 2.72 [1.50, 3.95] |
| 17.2 Mean value at endpoint | 20 | 862 | Mean Difference (IV, Random, 95% CI) | 2.15 [0.89, 3.42] |
| 17.3 Combined | 20 | 862 | Mean Difference (IV, Random, 95% CI) | 2.31 [1.30, 3.33] |
| 18 LVEF measured by echocardiography (≥12 months) Show forest plot | 10 | Mean Difference (IV, Random, 95% CI) | Subtotals only | |
| 18.1 Mean change from baseline | 3 | 127 | Mean Difference (IV, Random, 95% CI) | 1.35 [‐2.25, 4.96] |
| 18.2 Mean value at endpoint | 9 | 377 | Mean Difference (IV, Random, 95% CI) | 2.87 [1.42, 4.31] |
| 18.3 Combined | 10 | 433 | Mean Difference (IV, Random, 95% CI) | 2.09 [0.74, 3.44] |
| 19 LVEF measured by SPECT (< 12 months) Show forest plot | 7 | Mean Difference (IV, Random, 95% CI) | Subtotals only | |
| 19.1 Mean change from baseline | 5 | 286 | Mean Difference (IV, Random, 95% CI) | 2.72 [0.23, 5.21] |
| 19.2 Mean value at endpoint | 6 | 375 | Mean Difference (IV, Random, 95% CI) | 2.19 [0.58, 3.81] |
| 19.3 Combined | 7 | 394 | Mean Difference (IV, Random, 95% CI) | 2.52 [0.59, 4.44] |
| 20 LVEF measured by SPECT (≥ 12 months) Show forest plot | 4 | Mean Difference (IV, Random, 95% CI) | Subtotals only | |
| 20.1 Mean change from baseline | 2 | 92 | Mean Difference (IV, Random, 95% CI) | 5.63 [1.77, 9.49] |
| 20.2 Mean value at endpoint | 3 | 181 | Mean Difference (IV, Random, 95% CI) | 3.46 [0.82, 6.11] |
| 20.3 Combined | 4 | 200 | Mean Difference (IV, Random, 95% CI) | 4.42 [2.68, 6.16] |
| 21 LVEF measured by left ventricular angiography (< 12 months) Show forest plot | 9 | Mean Difference (IV, Random, 95% CI) | Subtotals only | |
| 21.1 Mean change from baseline | 3 | 279 | Mean Difference (IV, Random, 95% CI) | 6.43 [0.60, 12.27] |
| 21.2 Mean value at endpoint | 9 | 711 | Mean Difference (IV, Random, 95% CI) | 4.94 [0.53, 9.35] |
| 21.3 Combined | 9 | 711 | Mean Difference (IV, Random, 95% CI) | 5.09 [0.95, 9.24] |
| 22 LVEF measured by left ventricular angiography (≥ 12 months) Show forest plot | 1 | Mean Difference (IV, Random, 95% CI) | Subtotals only | |
| 22.1 Mean value at endpoint | 1 | 62 | Mean Difference (IV, Random, 95% CI) | 8.0 [4.27, 11.73] |
| 23 LVEF measured by radionuclide ventriculography (RNV) (<12 months) Show forest plot | 3 | Mean Difference (IV, Random, 95% CI) | Subtotals only | |
| 23.1 Mean change from baseline | 2 | 118 | Mean Difference (IV, Random, 95% CI) | 0.91 [‐3.11, 4.94] |
| 23.2 Mean value at endpoint | 3 | 157 | Mean Difference (IV, Random, 95% CI) | 1.08 [‐4.88, 7.04] |
| 23.3 Combined | 3 | 157 | Mean Difference (IV, Random, 95% CI) | 1.79 [‐1.86, 5.43] |
| 24 LVEF measured by radionuclide ventriculography (≥ 12 months) Show forest plot | 1 | Mean Difference (IV, Random, 95% CI) | Subtotals only | |
| 24.1 Mean value at endpoint | 1 | 39 | Mean Difference (IV, Random, 95% CI) | 6.30 [‐1.03, 13.63] |
| Outcome or subgroup title | No. of studies | No. of participants | Statistical method | Effect size |
| 1 All‐cause mortality (< 12 months) Show forest plot | 16 | 1335 | Risk Ratio (M‐H, Random, 95% CI) | 0.80 [0.42, 1.51] |
| Outcome or subgroup title | No. of studies | No. of participants | Statistical method | Effect size |
| 1 All‐cause mortality (< 12 months) Show forest plot | 16 | Risk Ratio (M‐H, Random, 95% CI) | Subtotals only | |
| 1.1 Excluding studies with high risk of selection bias | 16 | 1307 | Risk Ratio (M‐H, Random, 95% CI) | 0.83 [0.43, 1.57] |
| Outcome or subgroup title | No. of studies | No. of participants | Statistical method | Effect size |
| 1 All‐cause mortality (< 12 months) Show forest plot | 13 | Risk Ratio (M‐H, Random, 95% CI) | Subtotals only | |
| 1.1 Excluding studies with a high or unclear risk of attrition bias | 13 | 899 | Risk Ratio (M‐H, Random, 95% CI) | 0.78 [0.38, 1.61] |
| 2 All‐cause mortality (≥ 12 months) Show forest plot | 11 | Risk Ratio (M‐H, Random, 95% CI) | Subtotals only | |
| 2.1 Excluding studies with a high or unclear risk of attrition bias | 11 | 847 | Risk Ratio (M‐H, Random, 95% CI) | 0.67 [0.38, 1.17] |
| 3 Cardiovascular mortality (< 12 months) Show forest plot | 5 | Risk Ratio (M‐H, Random, 95% CI) | Subtotals only | |
| 3.1 Excluding studies with high or unclear risk of attrition bias | 5 | 199 | Risk Ratio (M‐H, Random, 95% CI) | 0.69 [0.22, 2.14] |
| 4 Cardiovascular mortality (≥ 12 months) Show forest plot | 6 | Risk Ratio (M‐H, Random, 95% CI) | Subtotals only | |
| 4.1 Excluding studies with high or unclear risk of attrition bias | 6 | 378 | Risk Ratio (M‐H, Random, 95% CI) | 0.71 [0.34, 1.50] |
| Outcome or subgroup title | No. of studies | No. of participants | Statistical method | Effect size |
| 1 All‐cause mortality (< 12 months) Show forest plot | 8 | Risk Ratio (M‐H, Random, 95% CI) | Subtotals only | |
| 1.1 Excluding studies with a high risk of performance bias | 8 | 669 | Risk Ratio (M‐H, Random, 95% CI) | 0.60 [0.23, 1.56] |
| 2 All‐cause mortality (≥ 12 months) Show forest plot | 3 | Risk Ratio (M‐H, Random, 95% CI) | Subtotals only | |
| 2.1 Excluding studies with a high risk of performance bias | 3 | 406 | Risk Ratio (M‐H, Random, 95% CI) | 0.50 [0.22, 1.10] |
| Outcome or subgroup title | No. of studies | No. of participants | Statistical method | Effect size |
| 1 All‐cause mortality (< 12 months) Show forest plot | 10 | Risk Ratio (M‐H, Random, 95% CI) | Subtotals only | |
| 1.1 Baseline LVEF < 45% | 4 | 478 | Risk Ratio (M‐H, Random, 95% CI) | 0.77 [0.19, 3.16] |
| 1.2 Baseline LVEF ≥ 45% | 6 | 551 | Risk Ratio (M‐H, Random, 95% CI) | 0.98 [0.32, 2.98] |
| 2 All‐cause mortality (≥ 12 months) Show forest plot | 7 | Risk Ratio (M‐H, Random, 95% CI) | Subtotals only | |
| 2.1 Baseline LVEF < 45% | 2 | 136 | Risk Ratio (M‐H, Random, 95% CI) | 0.61 [0.13, 2.83] |
| 2.2 Baseline LVEF ≥ 45% | 5 | 510 | Risk Ratio (M‐H, Random, 95% CI) | 0.64 [0.31, 1.30] |
| 3 LVEF measured by MRI (< 12 months) Show forest plot | 15 | Mean Difference (IV, Random, 95% CI) | Subtotals only | |
| 3.1 Baseline LVEF < 45% | 6 | 579 | Mean Difference (IV, Random, 95% CI) | 2.28 [0.43, 4.13] |
| 3.2 Baseline LVEF ≥ 45% | 9 | 556 | Mean Difference (IV, Random, 95% CI) | ‐0.09 [‐2.42, 2.24] |
| 4 LVEF measured by MRI (≥ 12 months) Show forest plot | 9 | Mean Difference (IV, Random, 95% CI) | Subtotals only | |
| 4.1 Baseline LVEF < 45% | 4 | 326 | Mean Difference (IV, Random, 95% CI) | 3.93 [‐0.15, 8.02] |
| 4.2 Baseline LVEF ≥ 45% | 5 | 342 | Mean Difference (IV, Random, 95% CI) | ‐0.15 [‐2.34, 2.05] |
| Outcome or subgroup title | No. of studies | No. of participants | Statistical method | Effect size |
| 1 All‐cause mortality (< 12 months) Show forest plot | 17 | Risk Ratio (M‐H, Random, 95% CI) | Subtotals only | |
| 1.1 Mononuclear cells | 14 | 1153 | Risk Ratio (M‐H, Random, 95% CI) | 0.74 [0.38, 1.46] |
| 1.2 Mesenchymal stem cells | 2 | 101 | Risk Ratio (M‐H, Random, 95% CI) | 1.01 [0.15, 6.60] |
| 1.3 Haematopoietic progenitor cells | 2 | 151 | Risk Ratio (M‐H, Random, 95% CI) | 1.06 [0.13, 8.36] |
| 2 All‐cause mortality (≥ 12 months) Show forest plot | 14 | Risk Ratio (M‐H, Random, 95% CI) | Subtotals only | |
| 2.1 Mononuclear cells | 12 | 923 | Risk Ratio (M‐H, Random, 95% CI) | 0.88 [0.54, 1.43] |
| 2.2 Mesenchymal stem cells | 1 | 42 | Risk Ratio (M‐H, Random, 95% CI) | 3.0 [0.13, 69.70] |
| 2.3 Haematopoietic progenitor cells | 1 | 31 | Risk Ratio (M‐H, Random, 95% CI) | 2.82 [0.12, 64.39] |
| Outcome or subgroup title | No. of studies | No. of participants | Statistical method | Effect size |
| 1 All‐cause mortality (< 12 months) Show forest plot | 16 | Risk Ratio (M‐H, Random, 95% CI) | Subtotals only | |
| 1.1 ≤ 108 cells | 5 | 297 | Risk Ratio (M‐H, Random, 95% CI) | 1.03 [0.27, 3.96] |
| 1.2 > 108 and ≤ 109 cells | 12 | 1081 | Risk Ratio (M‐H, Random, 95% CI) | 0.66 [0.33, 1.34] |
| 2 All‐cause mortality (≥ 12 months) Show forest plot | 14 | Risk Ratio (M‐H, Random, 95% CI) | Subtotals only | |
| 2.1 ≤ 108 cells | 5 | 241 | Risk Ratio (M‐H, Random, 95% CI) | 2.20 [0.97, 4.95] |
| 2.2 > 108 and ≤ 109 cells | 7 | 668 | Risk Ratio (M‐H, Random, 95% CI) | 0.52 [0.28, 0.97] |
| 2.3 > 109 cells | 2 | 87 | Risk Ratio (M‐H, Random, 95% CI) | 1.56 [0.32, 7.55] |
| 3 LVEF measured by MRI (< 12 months) Show forest plot | 14 | Mean Difference (IV, Random, 95% CI) | Subtotals only | |
| 3.1 ≤ 108 cells | 4 | 270 | Mean Difference (IV, Random, 95% CI) | 0.00 [‐3.51, 3.52] |
| 3.2 > 108 and ≤ 109 cells | 11 | 825 | Mean Difference (IV, Random, 95% CI) | 1.08 [‐0.53, 2.69] |
| 4 LVEF measured by MRI (≥ 12 months) Show forest plot | 9 | Mean Difference (IV, Random, 95% CI) | Subtotals only | |
| 4.1 ≤ 108 cells | 2 | 98 | Mean Difference (IV, Random, 95% CI) | 3.60 [‐4.24, 11.44] |
| 4.2 > 108 and ≤ 109 cells | 7 | 570 | Mean Difference (IV, Random, 95% CI) | 1.48 [‐1.44, 4.40] |
| 5 LVEF measured by left ventricular angiography (< 12 months) Show forest plot | 8 | Mean Difference (IV, Random, 95% CI) | Subtotals only | |
| 5.1 > 108 and ≤ 109 cells | 6 | 548 | Mean Difference (IV, Random, 95% CI) | 2.26 [‐0.71, 5.23] |
| 5.2 > 109 cells | 2 | 101 | Mean Difference (IV, Random, 95% CI) | 11.64 [7.52, 15.75] |
| Outcome or subgroup title | No. of studies | No. of participants | Statistical method | Effect size |
| 1 All‐cause mortality (< 12 months) Show forest plot | 13 | Risk Ratio (M‐H, Random, 95% CI) | Subtotals only | |
| 1.1 ≤ 10 days since AMI | 10 | 839 | Risk Ratio (M‐H, Random, 95% CI) | 1.02 [0.45, 2.30] |
| 1.2 > 10 days since AMI | 3 | 156 | Risk Ratio (M‐H, Random, 95% CI) | 0.28 [0.06, 1.36] |
| 2 All‐cause mortality (≥ 12 months) Show forest plot | 10 | Risk Ratio (M‐H, Random, 95% CI) | Subtotals only | |
| 2.1 ≤ 10 days since AMI | 9 | 809 | Risk Ratio (M‐H, Random, 95% CI) | 0.61 [0.33, 1.11] |
| 2.2 > 10 days since AMI | 1 | 11 | Risk Ratio (M‐H, Random, 95% CI) | 0.75 [0.10, 5.54] |
| 3 LVEF measured by MRI (< 12 months) Show forest plot | 13 | Mean Difference (IV, Random, 95% CI) | Subtotals only | |
| 3.1 ≤ 10 days since AMI | 12 | 867 | Mean Difference (IV, Random, 95% CI) | 1.15 [‐0.66, 2.97] |
| 3.2 > 10 days since AMI | 2 | 190 | Mean Difference (IV, Random, 95% CI) | ‐0.71 [‐4.90, 3.48] |
| 4 LVEF measured by MRI (≥ 12 months) Show forest plot | 9 | Mean Difference (IV, Random, 95% CI) | Subtotals only | |
| 4.1 ≤ 10 days since AMI | 9 | 669 | Mean Difference (IV, Random, 95% CI) | 1.26 [‐1.20, 3.71] |
| 4.2 > 10 days since AMI | 1 | 109 | Mean Difference (IV, Random, 95% CI) | 1.17 [‐2.59, 4.93] |
| 5 LVEF measured by left ventricular angiography (< 12 months) Show forest plot | 8 | Mean Difference (IV, Random, 95% CI) | Subtotals only | |
| 5.1 ≤ 10 days since AMI | 5 | 535 | Mean Difference (IV, Random, 95% CI) | 2.20 [‐1.51, 5.91] |
| 5.2 > 10 days since AMI | 3 | 156 | Mean Difference (IV, Random, 95% CI) | 7.42 [‐1.83, 16.66] |
| Outcome or subgroup title | No. of studies | No. of participants | Statistical method | Effect size |
| 1 All‐cause mortality (< 12 months) Show forest plot | 16 | Risk Ratio (M‐H, Random, 95% CI) | Subtotals only | |
| 1.1 Heparin | 6 | 339 | Risk Ratio (M‐H, Random, 95% CI) | 0.91 [0.31, 2.66] |
| 1.2 No heparin | 10 | 999 | Risk Ratio (M‐H, Random, 95% CI) | 0.66 [0.30, 1.45] |
| 2 All‐cause mortality (≥ 12 months) Show forest plot | 12 | Risk Ratio (M‐H, Random, 95% CI) | Subtotals only | |
| 2.1 Heparin | 7 | 503 | Risk Ratio (M‐H, Random, 95% CI) | 0.83 [0.33, 2.10] |
| 2.2 No heparin | 5 | 408 | Risk Ratio (M‐H, Random, 95% CI) | 0.55 [0.28, 1.08] |
| 3 LVEF measured by MRI (< 12 months) Show forest plot | 15 | Mean Difference (IV, Random, 95% CI) | Subtotals only | |
| 3.1 Heparin | 7 | 434 | Mean Difference (IV, Random, 95% CI) | 1.99 [‐0.62, 4.59] |
| 3.2 No heparin | 8 | 701 | Mean Difference (IV, Random, 95% CI) | 0.25 [‐1.67, 2.17] |
| 4 LVEF measured by MRI (≥ 12 months) Show forest plot | 9 | Mean Difference (IV, Random, 95% CI) | Subtotals only | |
| 4.1 Heparin | 5 | 357 | Mean Difference (IV, Random, 95% CI) | 1.76 [‐1.93, 5.45] |
| 4.2 No heparin | 4 | 361 | Mean Difference (IV, Random, 95% CI) | 0.53 [‐2.14, 3.20] |
| 5 LVEF measured by left ventricular angiography (< 12 months) Show forest plot | 8 | Mean Difference (IV, Random, 95% CI) | Subtotals only | |
| 5.1 Heparin | 5 | 256 | Mean Difference (IV, Random, 95% CI) | 6.82 [0.25, 13.39] |
| 5.2 No heparin | 3 | 393 | Mean Difference (IV, Random, 95% CI) | 1.91 [‐3.46, 7.27] |