| Trial | Trial Arm | Timing Measurement | LVEF | LVESV | LVEDV | Myocardial lesion | Wall motion score |
| Huang 2006 | BMSC | Baseline: mean (SD) ‐ at 1 week | Angiography: 56.7 (7.3) %; MRI (at 1 week): 44.5 (7.1) % | not measured | MRI: 130 (5) ml | MRI: (at 1 week): 21.0 (4.5) % | not measured |
| | End: mean (SD) ‐ at 6 months | Angiography: 60.0 (6) %; MRI: 51.5 (5.2) % | | MRI: 117 (5) ml | MRI: 12.3 (2.6) % | |
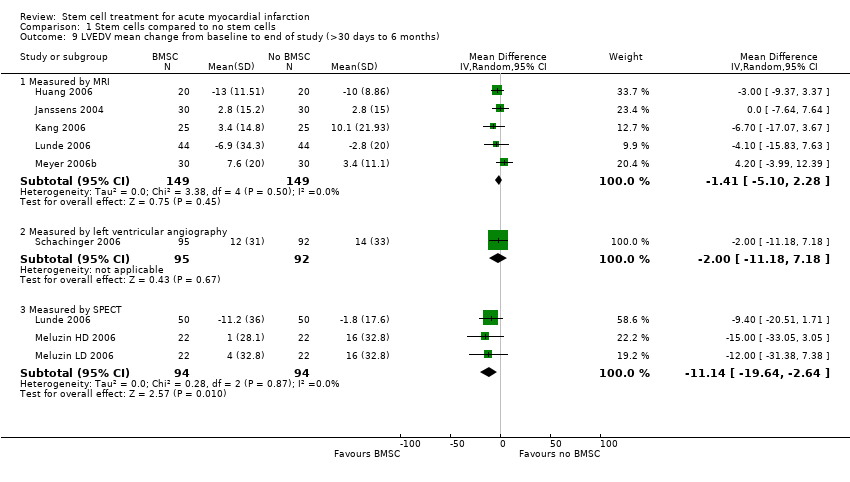
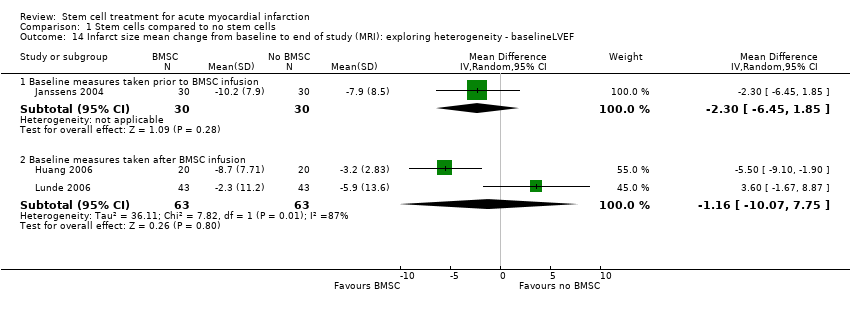
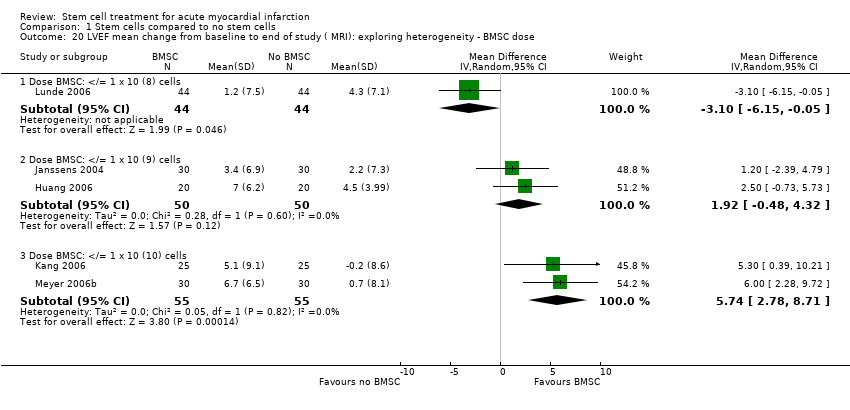
| | Mean (SD) change | Angiography: 3.3 (2.92) %; MRI: 7.0 (6.20) % | | MRI: ‐13 (11.51) ml | MRI: ‐8.7 (7.71) % | |
| Control | Baseline: mean (SD) ‐ at 1 week | Angiography: 57.3 (8.2) %; MRI (at 1 week): 43.4 (6.7) % | not measured | MRI: 130 (6) ml | MRI: 22.3 (4.6) % | not measured |
| | End: mean (SD) ‐ at 6 months | Angiography: 58.5 (6.5) %; MRI: 47.9 (6.7) % | | MRI: 120 (6) ml | MRI: 19.1 (4.5) % | |
| | Mean (SD) change from baseline | Angiography: 1.2 (2.16) %; MRI: 4.5 (3.99) % | | MRI: ‐10 (8.86) ml | MRI: ‐3.2 (2.83) % | |
| Janssens 2006 | BMSC | Baseline: mean (SD) | MRI: 48.5 (7.2) % | MRI: 42.2 (10.5) ml/m2 | MRI: 81.2 (14) ml/m2 | MRI: 20.6 (14.3) g | not measured |
| | End: mean (SD) ‐ at 4 months | MRI: 51.8 (8.8) % | MRI: 41.0 (15.5) ml/m2 | MRI: 84.1 (20.8) ml/m2 | MRI: 10.3 (8.0) g | |
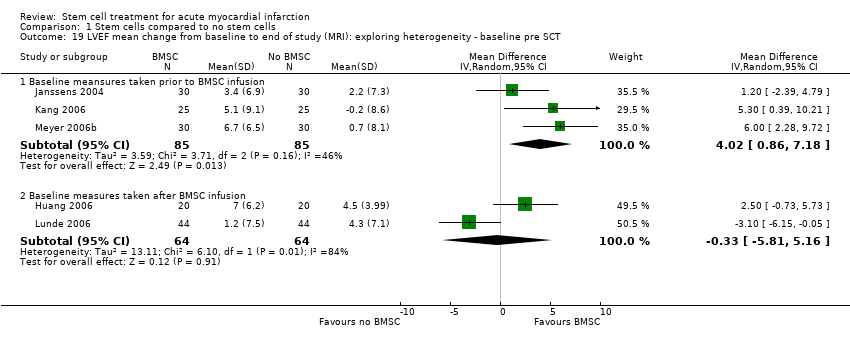
| | Mean (SD) change from baseline | MRI: 3.4 (6.9) % | MRI: ‐1.1 (11.2) ml/m2 | MRI: 2.8 (15.2) ml/m2 | MRI: ‐10.2 (7.9) g | |
| Control | Baseline: mean (SD) | MRI: 46.9 (8.2) % | MRI: 44.4 (12.3) ml/m2 | MRI: 83.1 (14.2) ml/m2 | MRI: 22.3 (16.1) g | not measured |
| | End: mean (SD) ‐ at 4 months | MRI: 49.1 (10.7) % | MRI: 45.0 (17.9) ml/m2 | MRI: 85.9 (19.5) ml/m2 | MRI: 14.7 (9.3) g | |
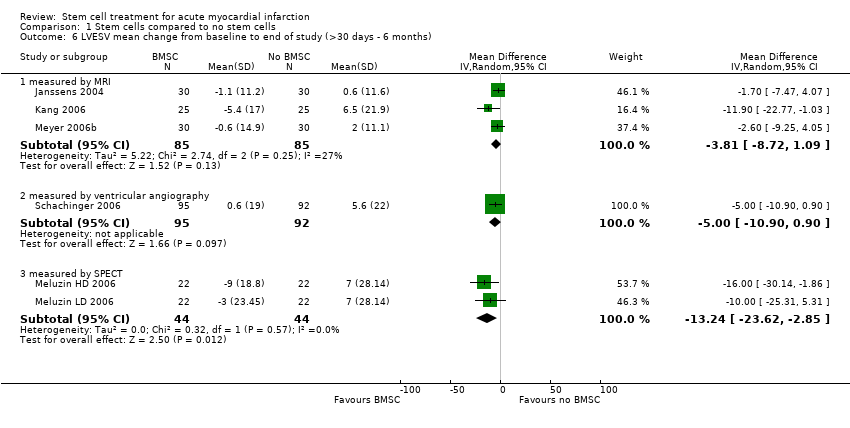
| | Mean (SD) change from baseline | MRI: 2.2 (7.3) % | +MRI: 0.6 (11.6) ml/m2 | MRI: 2.8 (15.0) ml/m2 | MRI: ‐7.9 (8.5) g | |
| Kang 2006 | BMSC | Baseline: mean (SD) | MRI: 52.0 (9.9) % | MRI: 69.0 (21.5) ml | MRI: 143.1 (27.2) ml | not measured | not measured |
| | End: mean (SD) ‐ at 6 months | MRI: 57.1 (8.7) % | MRI: 63.5 (20.3) ml | MRI: 146.5 (27.6) ml | | |
| | Mean (SD) change from baseline | MRI: 5.1 (9.1) % | MRI: ‐5.4 (17.0) ml | MRI: 3.4 (14.48) ml | | |
| Control | Baseline: mean (SD) | MRI: 53.2 (13.3) % | MRI: 62.7 (30.9) ml | MRI: 129.8 (28) ml | not measured | not measured |
| | End: mean (SD) ‐ at 6 months | MRI: 53.1 (11.5) % | MRI: 69.2 (38) ml | MRI: 139.9 (42.7) ml | | |
| | Mean (SD) change from baseline | MRI: ‐0.2 (8.6) % | MRI: 6.5 (21.9) ml | MRI: 10.1 (21.93) ml | | |
| Karpov 2005 | BMSC | Baseline: mean (SD) | not measured | not measured | not measured | not measured | not measured |
| | End: mean (SD) | | | | | |
| | Mean (SD) change from baseline | | | | | |
| Control | Baseline: mean (SD) | not measured | not measured | not measured | not measured | not measured |
| | End: mean (SD) | | | | | |
| | Mean (SD) change from baseline | | | | | |
| Li 2007 | BMSC | Baseline: mean (SD) | Echocardiography: 50.0 (8.2) % | Echocardiography: 63.8 (24.9) ml | Echocardiography: 134.2 (36.7) ml | not measured | Echocardiography: 1.219 (0.190) |
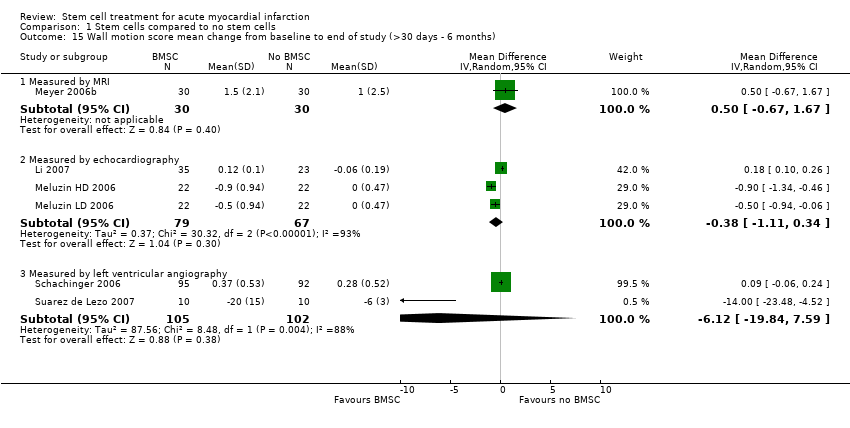
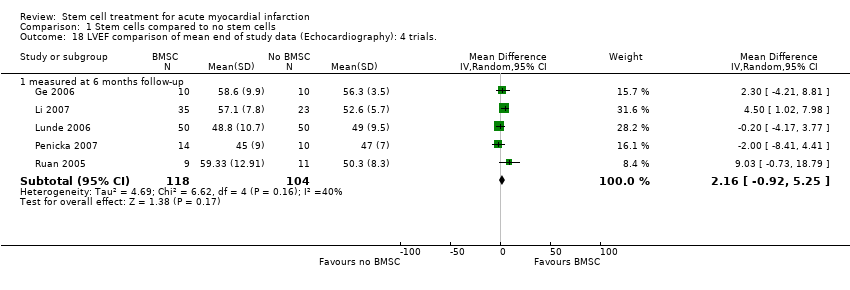
| | End: mean (SD) ‐ at 6 months | Echocardiography: 57.1 (7.8) % | Echocardiography: 52.6 (20.3) ml | Echocardiography: 119.2 (30.3) ml | | Echocardiography: 1.101 (0.118) |
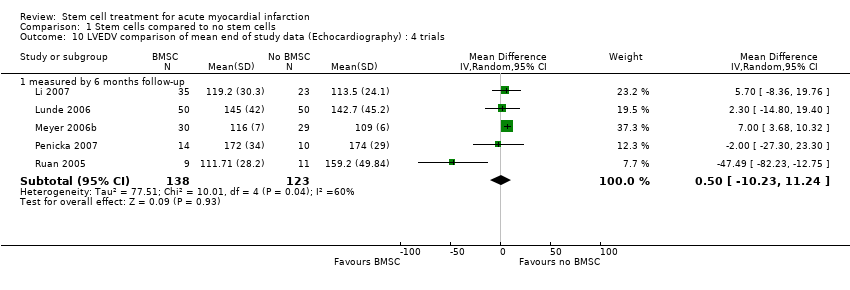
| | Mean (SD) change from baseline | Echocardiography: 7.1 (6.30) % | Echocardiography: ‐11.2 (15.61) ml | Echocardiography: ‐15 (30.21) ml | | Echocardiography: ‐0.118 (0.10) |
| Control | Baseline: mean (SD) | Echocardiography: 51.0 (8.1) % | Echocardiography: 59.4 (25.3) ml | Echocardiography: 122.1 (35.3) ml | not measured | Echocardiography: 1.243 (0.177) |
| | End: mean (SD) ‐ at 6 months | Echocardiography: 52.6 (5.7) % | Echocardiography: 52.6 (9.6) ml | Echocardiography: 113.5 (24.1) ml | | Echocardiography: 1.184 (0.138) |
| | Mean (SD) change from baseline | Echocardiography: 1.6 (8.64) % | Echocardiography: ‐6.8 (29.47) ml | Echocardiography: ‐8.6 (20.15) ml | | Echocardiography: ‐0..059 (0.19) |
| Lunde 2006 | BMSC | Baseline: mean (SD) ‐ at 2‐3 weeks following SCT | SPECT: 41.3 (10.4) %; Echocardiography: 45.7 (9.4) %; MRI (at 2‐3 weeks) 54.8 (13.6) % | not measured | SPECT: 162.3 (59.1) ml; Echocardiography: 136.1(30.5) ml; MRI (at 2‐3 weeks) 161.7 (46.3) ml | SPECT: 43.8 (17.4) %; MRI: 41.4 (27.6) ml | not measured |
| | End: mean (SD) ‐ at 6 months | SPECT: 49.3 (13.2) %; Echocardiography: 48.8 (10.7)%; MRI 56.2 (14.9) % | | SPECT: 151.1(52.9) ml; Echocardiography: 145.0 (42.0) ml; MRI 154.1 (54.1) ml | SPECT: 32.8 (20.4) %; MRI: 38.7 (26.9) ml | |
| | Mean (SD) change from baseline | SPECT: 8.1 (11.2) %; Echocardiography: 3.1 (7.9) %; MRI: 1.2 (7.5) % | | SPECT: ‐11.2 (36.0) ml; Echocardiography: 8.9 (28.5) ml; MRI ‐6.9 (34.3) ml | SPECT: ‐11.0 (12.7) %; MRI: ‐2.3 (11.2) ml | |
| Control | Baseline: mean (SD) ‐ at 2‐3 weeks following SCT | SPECT: 42.6 (11.7) %; Echocardiography: 46.9 (9.6) %; MRI (at 2‐3 weeks) 53.6 (11.6) % | not measured | SPECT: 148.0 (46.3) ml; Echocardiography: 132.0 (34.6) ml; MRI (at 2‐3 weeks) 165.3 (46.7) ml | SPECT: 38.3 (21.1) %; MRI: 39.0 (29.5) ml | not measured |
| | End: mean (SD) ‐ at 6 months | SPECT: 49.3 (11.0) %; Echocardiography: 49.0 (9.5)%; MRI 58.1 (11.4) % | | SPECT: 146.0 (50.0) ml; Echocardiography: 142.7 (45.2) ml; MRI 162.5 (45.3) ml | SPECT: 30.5 (20.9) %; MRI: 33.6 (23.7) ml | |
| | Mean (SD) change from baseline | SPECT: 7.0 (9.6) %; Echocardiography: 2.1 (9.2) %; MRI: 4.3 (7.1) % | | SPECT: ‐1.8 (17.6) ml; Echocardiography: 10.8 (29.1) ml; MRI ‐2.8 (20.0) ml | SPECT: ‐7.8 (8.7) %; MRI: ‐5.9 (13.6) ml | |
| Melzuin (LD) 2006 | BMSC | Baseline: mean (SD) | SPECT: 42 (SEM 2) % | SPECT: 92 (SEM 8) ml | SPECT: 154 (SEM 10) ml | SPECT: 43 (SEM 3) % | Echocardiography:4.5 (SEM 0.3) cm/s |
| | End: mean (SD) ‐ at 3 months | SPECT: 45 (SEM 2) % | SPECT: 89 (SEM 8) ml | SPECT: 158 (SEM 10) ml | SPECT: 35 (SEM 4) % | Echocardiography: 5.0 (SEM 0.3) cm/s |
| | Mean (SD) change from baseline | SPECT: 3 (SD 4.69) % | SPECT: ‐3 (SD 23.45) ml | SPECT: 4 (SD 32.8) ml | SPECT: ‐8 (SD 9.38) % | Echocardiography: ‐0.5 (SD 0.938) cm/s |
| Control | Baseline: mean (SD) | SPECT: 42 (SEM 2) % | SPECT: 93 (SEM 8) ml | SPECT: 156 (SEM 9) ml | SPECT: 41 (SEM 4) % | Echocardiography: 5.2 (SEM 0.3) cm/s |
| | End: mean (SD) ‐ at 3 months | SPECT: 44 (SEM 2) % | SPECT: 100 (SEM 10) ml | SPECT: 172 (SEM 12) ml | SPECT: 33 (SEM 4) % | Echocardiography:5.2 (SEM 0.3) cm/s |
| | Mean (SD) change from baseline | SPECT: 2 (SD 4.69) % | SPECT: 7 (SD 28.14) ml | SPECT: 16 (SD 32.8) ml | SPECT: ‐8 (SD 14.07) % | Echocardiography: 0.0 (SD 0.469) cm/s |
| Melzuin (HD) 2006 | BMSC | Baseline: mean (SD) | SPECT: 41 (SEM 2) % | SPECT: 98 (SEM 10) ml | SPECT: 158 (SEM 13) ml | SPECT: 43 (SEM 4) % | Echocardiography: 4.3 (SEM 0.2) cm/s |
| | End: mean (SD) ‐ at 3 months | SPECT: 46 (SEM 2) % | SPECT: 89 (SEM 9) ml | SPECT: 159 (SEM 12) ml | SPECT: 33 (SEM 4) % | Echocardiography: 5.2 (SEM 0.3) cm/s |
| | Mean (SD) change from baseline | SPECT: 5 ( SD 4.69) % | SPECT: ‐9 (SD 18.8) ml | SPECT: 1 (SD 28.1) ml | SPECT: ‐10 (SD 9.38) % | Echocardiography: ‐0.9 (SD 0.938) cm/s |
| Control | Baseline: mean (SD) | SPECT: 42 (SEM 2) % | SPECT: 93 (SEM 8) ml | SPECT: 156 (SEM 9) ml | SPECT: 41 (SEM 4) % | Echocardiography: 5.2 (SEM 0.3) cm/s |
| | End: mean (SD) ‐at 3 months | SPECT: 44 (SEM 2) % | SPECT: 100 (SEM 10) ml | SPECT: 172 (SEM 12) ml | SPECT: 33 (SEM 4) % | Echocardiography: 5.2 (SEM 0.3) cm/s |
| | Mean (SD) change from baseline | SPECT: 2 (SD 4.69) % | SPECT: 7 (SD 28.14) ml | SPECT: 16 (SD 32.8) ml | SPECT: ‐8 (SD 14.07) % | Echocardiography: 0.0 (SD 0.469) cm/s |
| Ruan 2006 | BMSC | Baseline: mean (SD) | Echocardiography: 53.37 (8.92) % | Echocardiography: 57.12 (18.66) ml | Echocardiography: 113.74 (23.24) ml | not measured | not measured |
| | End: mean (SD) ‐ 6 months | Echocardiography: 59.33 (12.91) % | Echocardiography: 52.43 (24.69) ml | Echocardiography: 111.71 (28.20) ml | | |
| | Mean (SD) change from baseline | not available | not available | not available | | |
| Control | Baseline: mean (SD) | Echocardiography: 53.31 (5.84) % | Echocardiography: 62.09 (17.68) ml | Echocardiography:129.92 (32.71) ml | not measured | not measured |
| | End: mean (SD) ‐ 6 months | Echocardiography: 50.30 (8.30) % | Echocardiography: 81.18 (32.98) ml | Echocardiography: 159.20 (49.84) ml | | |
| | Mean (SD) change from baseline | not available | not available | not available | | |
| Schachinger 2006 | BMSC | Baseline: mean (SD) | Angiogrpahy: 48.3 (9.2) % | Angiogrpahy: 67 (26) ml | Angiography: 128 (38) ml | not measured | Angiography: ‐1.54 (0.42) |
| | End: mean (SD) ‐ at 4 months | Angiogrpahy: 53.8 (10.2) % | Angiogrpahy: 67 (30) ml | Angiography: 141 (43) ml | | Angiography: ‐1.17 (0.60) |
| | Mean (SD) change from baseline | Angiogrpahy: 5.5 (7.3) % | Angiogrpahy: 0.6 (19) ml | Angiography: 12 (31) ml | | Angiography: 0.37 (0.53) |
| Control | Baseline: mean (SD) | Angiogrpahy: 46.9 (10.4) % | Angiogrpahy: 75 (32) ml | Angiography: 139 (46) ml | not measured | Angiography: ‐1.54 (0.42) |
| | End: mean (SD) ‐ at 4 months | Angiogrpahy: 49.9 (13.0) % | Angiogrpahy: 80.6 (45) ml | Angiography: 153 (57) ml | | Angiography: ‐1.27 (0.60) |
| | Mean (SD) change from baseline | Angiogrpahy: 3.0 (6.5) % | Angiogrpahy: 5.6 (22) ml | Angiography: 14 (33) ml | | Angiography: 0.28 (0.52) |
| Meyer 2006b | BMSC | Baseline: mean (SD) | MRI: 50.0 (10.0) % | MRI: 43.0 (14.7) ml/m2 BSA. | MRI: 84.2 (17.2) ml/m2 BSA. Echocardiography: 114 (8) ml | not measured | MRI: 4.4 (1.9) mm |
| | End: mean (SD) ‐ at 6 and 18 months | MRI: 6 months: 56.7 (12.5) %; 18 months: 55.9 (14.7) % | MRI: 6 months: 42.4 (23.9) ml/m2 BSA; 18 months: 42.5 (25) ml/m2 BSA. | MRI: 6 months: 91.7 (26.0) ml/m2 BSA; 18 months: 90.3 (26.5) ml/m2 BSA Echocardiography: 6 months: 116 (7) ml; 18 months: 116 (7) ml | | MRI: 6 months: 5.9 (2.5) mm; 18 months: 5.2 (2.2) mm |
| | Mean (SD) change from baseline | MRI: 6 months: 6.7 (6.5) %; 18 months: 5.9 (8.9) % | MRI: 6 months: ‐0.6 (14.9) ml/m2 BSA; 18 months: ‐0.5 (16.5) ml/m2 BSA. | MRI: 6 months: 7.6 (20.0) ml/m2 BSA; 18 months 6.1 (20.3) ml/m2 BSA. | | MRI: 6 months: 1.5 (2.1) mm; 18 months: 0.8 (2.1) mm. |
| Control | Baseline: mean (SD) | MRI: 51.3 (9.3) % | MRI: 40.6 (16.9) ml/m2 BSA. | MRI: 81.4 (16.9) ml/m2 BSA. Echocardiography: 106 (5) ml | not measured | MRI: 3.9 (1.8) mm |
| | End: mean (SD) ‐ at 6 and 18 months | MRI: 6 months: 52.0 (12.4) %; 18 months: 54.4 (13.0) % | MRI: 6 months: 42.6 (23.5) ml/m2 BSA; 18 months: 41.0 (24.7) ml/m2 BSA. | MRI: 6 months: 84.9 (21.9) ml/m2 BSA; 18 months: 85.0 (24.2) ml/m2 BSA. Echocardiography: 6 months: 106 (5) ml; 18 months: 109 (6) ml | | MRI: 6 months: 4.9 (2.9) mm; 18 months: 4.5 (2.6) mm. |
| | Mean (SD) change from baseline | MRI: 6 months: 0.7 (8.1) %; 18 months: 3.1 (9.6) % | MRI: 2.0 (11.1) ml/m2 BSA; 18 months: 0.4 (12.5) ml/m2 BSA. | MRI: 6 months: 3.4 (11.1) ml/m2 BSA; 18 months: 3.6 (15.1) ml/m2 BSA. Echocardiography: 109 (6) ml | | MRI: 6 months: 1.0 (2.5) mm; 18 months: 0.6 (2.7) mm. |
| Ge 2006 | BMSC | Baseline: mean (SD) ‐ at 1 week | Echocardiography: 53.8 (9.2)% | not measured | LVEDd: Echocardiography: 52.5 (2.8) mm | not measured | SPECT: 21 (11)% |
| | End: mean (SD) ‐ at 6 months | Echocardiography: 58.6 (9.9)% | not measured | LVEDd: Echocardiography: 52.1 (3.2) mm | | SPECT: 13 (10)% |
| | Mean (SD) change from baseline | Echocardiography: 4.8 (not reported)% | not measured | LVEDd: Echocardiography: ‐0.4 (not reported) mm | | SPECT: ‐7 (not reported)% |
| Contol | Baseline: mean (SD) ‐ at 1 week | Echocardiography: 58.2 (7.5)% | not measured | LVEDd: Echocardiography: 50.4 (6.0) mm | not measured | SPECT: 20 (14)% |
| | End: mean (SD) ‐ at 6 months | Echocardiography: 56.3 (3.5)% | not measured | LVEDd: Echocardiography: 55.2 (7.1) mm | | SPECT: 17 (15)% |
| | Mean (SD) change from baseline | Echocardiography: ‐1.9 (not reported)% | not measured | LVEDd: Echocardiography: 4.8 (not reported) mm | | SPECT: ‐2 (not reported)% |
| Penicka | BMSC | Baseline: mean (SD) | Echocardiography: 39 (6)% | Echocardiography: 98 (25) ml | Echocardiography: 163 (30) ml | SPECT: 41.4 (18.3)% | not measured |
| | End: mean (SD) ‐ at 4 months | Echocardiography: 45 (9)% | Echocardiography: 95 (28) ml | Echocardiography: 172 (34) ml | SPECT: 30.5 (16.1)% | |
| | Mean (SD) change from baseline | Echocardiography: 6 (9.6)% | 3.10% (SD not reported) | 5.50% (SD not reported) | SPECT: ‐10.9 (12.84)% | |
| Control | Baseline: mean (SD) | Echocardiography: 39 (4)% | Echocardiography: 98 (23) ml | Echocardiography: 162 (30) ml | SPECT: 47.5 (20.8)% | not measured |
| | End: mean (SD) ‐ at 4 months | Echocardiography: 47 (7)% | Echocardiography: 96 (28) ml | Echocardiography: 174 (29) ml | SPECT: 35.3 (17.2)% | |
| | Mean (SD) change from baseline | Echocardiography: 8 (12.8)% | 2.00% (SD not reported) | 7.40 % (SD not reported). | SPECT: ‐12.2 (14.36)% | |
| Saurez de Lezo 2007 | BMSC | Baseline: mean (SD) | Angiography: 37 (5)% | Angiography: 89 (27) ml/m2 | Angiography: 142 (35) ml/m2 | not measured | Angiography: 33 (12)% |
| | End: mean (SD) ‐ at 3 months | Angiography: 58 (9)% | Angiography: 61 (19) ml/m2 | Angiography: 134 (29) ml/m2 | | Angiography: 8 (10)% |
| | Mean (SD) change from baseline | Angiography: 20 (8)% | Angiography: not reported | Angiography: not reported | | Angiography: ‐20 (15)% |
| Control | Baseline: mean (SD) | Angiography: 39 (6)% | Angiography: 83 (25) ml/m2 | Angiography: 140 (30) ml/m2 | not measured | Angiography: 27 (13)% |
| | End: mean (SD) ‐ at 3 months | Angiography: 45 (8)% | Angiography: 87 (35) ml/m2 | Angiography: 159 (43) ml/m2 | | Angiography: 16 (9)% |
| | Mean (SD) change from baseline | Angiography: 6 (10)% | Angiography: not reported | Angiography: not reported | | Angiography: ‐6 (3)% |