Contenido relacionado
Revisiones y protocolos relacionados
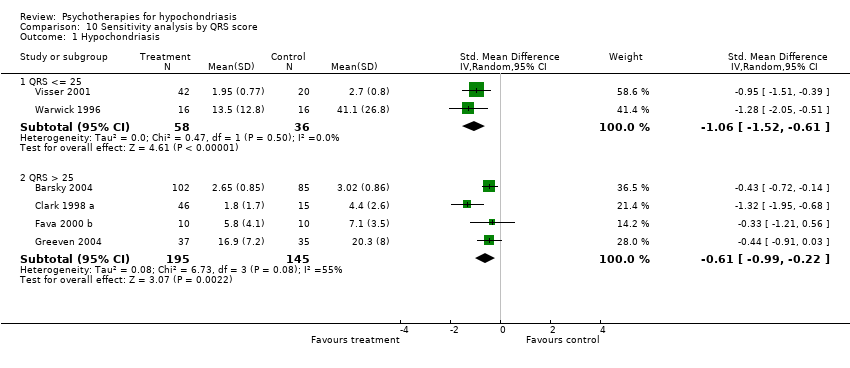
Nikki van Dessel, Madelon den Boeft, Johannes C van der Wouden, Maria Kleinstäuber, Stephanie S Leone, Berend Terluin, Mattijs E Numans, Henriëtte E van der Horst, Harm van Marwijk | 1 noviembre 2014
Neil P Roberts, Neil J Kitchiner, Justin Kenardy, Lindsay Robertson, Catrin Lewis, Jonathan I Bisson | 8 agosto 2019
Bradley E Belsher, Erin Beech, Daniel Evatt, Derek J Smolenski, M Tracie Shea, Jean Lin Otto, Craig S Rosen, Paula P Schnurr | 18 noviembre 2019
Eleonora Uphoff, David Ekers, Lindsay Robertson, Sarah Dawson, Emily Sanger, Emily South, Zainab Samaan, David Richards, Nicholas Meader, Rachel Churchill | 6 julio 2020
Tamara Melnik, Keith Hawton, Hugh McGuire | 12 diciembre 2012
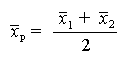
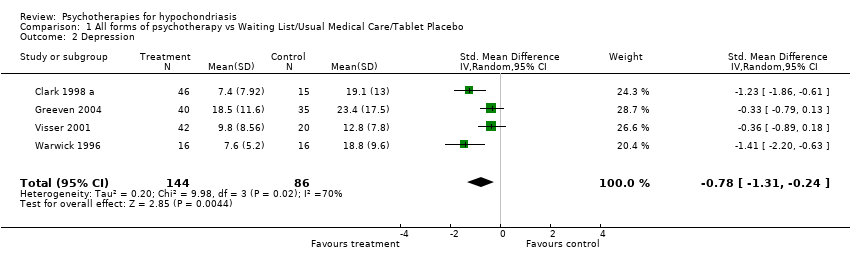
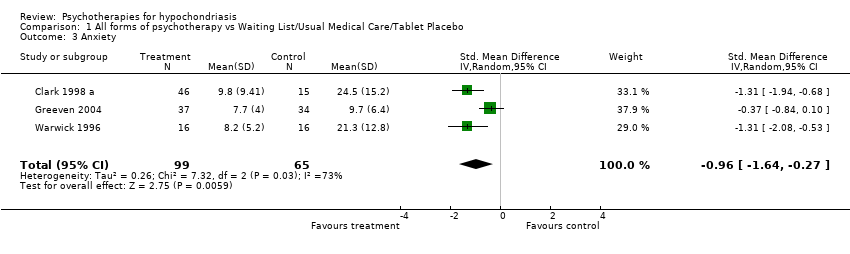
Rachel Churchill, Theresa HM Moore, Toshi A Furukawa, Deborah M Caldwell, Philippa Davies, Hannah Jones, Kiyomi Shinohara, Hissei Imai, Glyn Lewis, Vivien Hunot | 18 octubre 2013
Allan A Abbass, Steve R Kisely, Joel M Town, Falk Leichsenring, Ellen Driessen, Saskia De Maat, Andrew Gerber, Jack Dekker, Sven Rabung, Svitlana Rusalovska, Elizabeth Crowe | 1 julio 2014
Marianna Purgato, Chiara Gastaldon, Davide Papola, Mark van Ommeren, Corrado Barbui, Wietse A Tol | 5 julio 2018
Anthony C James, Tessa Reardon, Angela Soler, Georgina James, Cathy Creswell | 16 noviembre 2020
Aino Suomi, Lynette Evans, Bryan Rodgers, Stephanie Taplin, Sean Cowlishaw | 4 diciembre 2019