Растворы для пероральной регидратации на основе полимеров в лечении острой водянистой диареи
Abstract
Background
Acute diarrhoea is one of the main causes of morbidity and mortality among children in low‐income countries. Glucose‐based oral rehydration solution (ORS) helps replace fluid and prevent further dehydration from acute diarrhoea. Since 2004, the World Health Organization (WHO) has recommended the osmolarity of less than 270 mOsm/L (ORS ≤ 270) versus greater than 310 mOsm/L formulation (ORS ≥ 310). Polymer‐based ORS (for example, prepared using rice or wheat) slowly releases glucose and may be superior to glucose‐based ORS.
Objectives
To compare polymer‐based oral rehydration solution (polymer‐based ORS) with glucose‐based oral rehydration solution (glucose‐based ORS) for treating acute watery diarrhoea.
Search methods
We searched the following sources up to 5 September 2016: the Cochrane Infectious Diseases Group (CIDG) Specialized Register, the Cochrane Central Register of Controlled Trials (CENTRAL) (the Cochrane Library 2016, Issue 9), MEDLINE (1966 to 5 September 2016), EMBASE (1974 to 5 September 2016), LILACS (1982 to 5 September 2016), and mRCT (2007 to 5 September 2016). We also contacted researchers, organizations, and pharmaceutical companies, and searched reference lists.
Selection criteria
We included randomized controlled trials (RCTs) of people with acute watery diarrhoea (cholera and non‐cholera associated) that compared polymer‐based and glucose‐based ORS (with identical electrolyte contents).
Data collection and analysis
Two review authors independently assessed the search results and risk of bias, and extracted data. In multiple‐treatment arms with two or more treatment groups, we combined outcomes as appropriate and compared collectively with the control group.
Main results
Thirty‐five trials that included 4284 participants met the inclusion criteria: 28 trials exclusively included children, five included adults, and two included both adults and children.
Polymer‐based ORS versus glucose‐based ORS (osmolarity ≤ 270)
Eight trials (752 participants) evaluated this comparison, and seven trials used rice as a polymer source. Polymer‐based ORS may decrease mean stool output in the first 24 hours by 24 mL/kg (mean difference (MD) −24.60 mL/kg, 95% CI −40.69 to −8.51; one trial, 99 participants, low quality evidence). The average duration of diarrhoea may be reduced by eight hours (MD −8.24 hours, 95% CI −13.17 to −3.30; I² statistic = 86%, five trials, 364 participants, low quality evidence) with polymer ORS but results are heterogeneous. Limited trials showed no observed difference in the risk of unscheduled use of intravenous fluid (RR 0.66, 95% CI 0.43 to 1.02; I² statistic = 30%; four trials, 376 participants, very low quality evidence), vomiting (very low quality evidence), and hyponatraemia (very low quality evidence).
Polymer‐based ORS versus glucose‐based ORS (osmolarity ≥ 310)
Twenty‐seven trials (3532 participants) evaluated this comparison using a variety of polymers. On average, polymer ORS may reduce the total stool output in the first 24 hours by around 65 mL/kg (MD −65.47 mL/kg, 95% CI −83.92 to −47.03; 16 trials, 1483 participants, low quality evidence), and may reduce the duration of diarrhoea by around eight hours (MD −8.57 hours; SD −13.17 to −4.03; 16 trials, 1137 participants, low quality evidence) with substantial heterogeneity. The proportion of participants that required intravenous hydration was low in most trials with fewer in the polymer ORS group (RR 0.75, 95% CI 0.57 to 0.98; 19 trials, 1877 participant, low quality evidence) . Subgroup analysis by type of pathogen suggested an effect on unscheduled intravenous fluid in those infected with mixed pathogens (RR 0.63, 95% CI 0.41 to 0.96; 11 trials, 928 participants, low quality evidence), but not in participants positive for Vibrio cholerae (RR 0.94, 95% CI 0.66 to 1.34; 7 trials, 535 participants, low quality evidence). No difference was observed in the number of patients who developed vomiting (RR 0.91, 95% CI 0.72 to 1.14; 10 trials, 584 participants, very low quality evidence), hyponatraemia (RR 1.82, 95% CI 0.52 to 6.44; 4 trials, 385 participants, very low quality evidence), hypokalaemia (RR 1.29, 95% CI 0.74 to 2.25; 2 trials, 260 participants, low quality evidence), or persistent diarrhoea (RR 1.28, 95% CI 0.68 to 2.41; 2 trials, 885 participants, very low quality evidence).
Authors' conclusions
Polymer‐based ORS shows advantages compared to glucose‐based ORS (at ≥ 310 mOsm/L). Comparisons favoured polymer‐based ORS over ORS ≤ 270 but analysis was underpowered.
PICO
Резюме на простом языке
Растворы для пероральной регидратации на пищевой основе при острой диарее
Что такое растворы для пероральной регидратации (РПР) на основе полимеров и как они могут помочь
В развивающихся странах острая диарея является распространенной причиной смертей и заболеваний. Растворы для пероральной регидратации (РПР) помогли значительно снизить смертность от диареи во всем мире.
Изначально РПР готовились на основе глюкозы и обладали осмолярностью ≥ 310 мОсм/л (РПР ≥ 310). Позже для повышения эффективности были введены РПР на основе глюкозы с более низкой осмолярностью, что должно было привести к снижению объема и продолжительности диареи. Большинство РПР представляют собой сахарно‐солевые растворы, однако c течением времени люди пытались добавить туда множество компонентов (полимеров глюкозы), таких как рис, пшеница, сорго и кукуруза. Целью было замедление высвобождения глюкозы в кишечнике и улучшение всасывания воды и солей, содержащихся в растворе.
Этот обзор является обновлением Кокрейновского обзора, опубликованного в 2009 году, и посвящен оценке имеющихся доказательств относительно применения РПР на основе полимеров (риса и не только) в сравнении с применением РПР на основе глюкозы.
О чем говорят исследования
Исследователи Кокрейн рассмотрели все доказательства, доступные на 5 сентября 2016 года. Критериям отбора соответствовали 35 испытаний с 4284 участниками: в 28 участвовали дети, в 5 – взрослые и в 2 – и те, и другие. В большинстве испытаний сравнивали РПР на основе полимеров и сахарно‐солевые РПР (РПР ≥ 310), несколько более соленые, чем предполагает оптимальная на данный момент формула (≤ 270 мОсм/л). Методологическое качество испытаний варьировало.
Для определения, какой из растворов лучше у участников, получавших РПР на основе полимеров и сахарно‐солевые РПР (≤ 270 мОсм/л), доказательств было недостаточно (низкое и очень низкое качество доказательств).
У участников, получавших РПР на основе полимеров, в отличие от участников, получавших сахарно‐солевые РПР (≥ 310 мОсм/л), отмечалось снижение объема и продолжительности диареи. Различий между двумя группами относительно числа участников, нуждавшихся в капельной регидратации, не было. Неблагоприятные события были схожими (низкое и очень низкое качество доказательств).
Authors' conclusions
Summary of findings
| Polymer‐based ORS compared to glucose‐based ORS ≤ 270 mOsm/L for treating acute watery diarrhoea | |||||
| Patient or population: adults and children with acute watery diarrhoea | |||||
| Outcomes | Illustrative comparative risks* (95% CI) | Relative effect | Number of participants | Quality of the evidence | |
| Assumed risk | Corresponding risk | ||||
| Glucose‐based ORS | Polymer‐based ORS | ||||
| Total stool output during first 24 hours | The mean stool output in the control group was 102 mL/kg | The mean stool output in the intervention group was | — | 99 | ⊕⊕⊝⊝ |
| Duration of diarrhoea | The mean duration in the control groups ranged from | The mean duration of diarrhoea in the intervention groups was | — | 364 | ⊕⊕⊝⊝ |
| Unscheduled use of intravenous fluid | 9 per 100 | 6 per 100 | RR 0.66 | 376 | ⊕⊝⊝⊝ |
| Vomiting | 35 per 100 | 20 per 100 (8 to 47) | RR 0.56 (0.24 to 1.34) | 63 (1 trial) | ⊕⊝⊝⊝8,9,10 very low |
| Hyponatraemia | 23 per 100 | 18 per 100 (8 to 40) | RR 0.88 (0.43 to 1.82) | 145 (3 trials) | ⊕⊝⊝⊝1,7,11 very low |
| The assumed risk is the mean control group risk across studies. The corresponding risk (and its 95% CI) is based on the assumed risk in the comparison group and the relative effect of the intervention (and its 95% CI). | |||||
| GRADE Working Group grades of evidence | |||||
| 1Downgraded by 1 for serious risk of bias: the method of allocation concealment was unclear, and there was no blinding. | |||||
| Polymer‐based ORS compared to glucose‐based ORS ≥ 310 mOsm/L for treating acute watery diarrhoea | |||||
| Patient or population: adults and children with acute watery diarrhoea | |||||
| Outcomes | Illustrative comparative risks* (95% CI) | Relative effect | Number of participants | Quality of the evidence | |
| Assumed risk | Corresponding risk | ||||
| Glucose‐based ORS | Polymer‐based ORS | ||||
| Total stool output during first 24 hours | The mean stool output in the control groups ranged from 81 to 366 mL/kg | The mean stool output in the intervention groups was | — | 1483 | ⊕⊕⊝⊝ |
| Duration of diarrhoea | The mean duration in the control groups ranged from | The mean duration of diarrhoea in the intervention groups was | — | 1187 | ⊕⊕⊝⊝ |
| Unscheduled use of intravenous fluid | 102 per 1000 | 79 per 1000 | RR 0.75 | 1877 | ⊕⊕⊝⊝ |
| Unscheduled use of intravenous fluid in those with mixed pathogen | 101 per 1000 | 63 per 1000 (31 to 60) | RR 0.63 (0.49 to 0.96) | 928 (11 trials) | ⊕⊕⊝⊝ low1,3,4,5 |
| Unscheduled use of intravenous fluid in those with Cholera | 159 per 1000 | 150 per 1000 (105 to 213) | RR 0.94 (0.66 to 1.34) | 535 (7 trials) | ⊕⊕⊝⊝ low1,3,4,5 |
| Vomiting | 313 per 1000 | 250 per 1000 (197 to 313) | RR 0.91 (0.72 to 1.14) | 584 (10 trials) | ⊕⊝⊝⊝ |
| Hyponatraemia | 16 per 1000 | 30 per 1000 (9 to 104) | RR 1.82 (0.52 to 6.44) | 385 (4 trials) | ⊕⊝⊝⊝ |
| Hypokalaemia | 148 per 1000 | 191 per 1000 (110 to 333) | RR 1.29 (0.74 to 2.25) | 260 (2 trials) | ⊕⊕⊝⊝ low1,6,8,9 |
| Development of persistent diarrhoea | 17 per 1000 | 21 per 1000 (6 to 78) | RR 1.28 (0.68 to 2.41) | 885 (2 trials) | ⊕⊝⊝⊝6,10,11 |
| The assumed risk is the mean control group risk across studies. The corresponding risk (and its 95% CI) is based on the assumed risk in the comparison group and the relative effect of the intervention (and its 95% CI). | |||||
| GRADE Working Group grades of evidence | |||||
| 1Downgraded by 1 for serious risk of bias: most trials were at high risk of selection bias due to a lack of allocation concealment, and most were at high risk of detection or reporting bias due to a lack of blinding. | |||||
Background
Description of the condition
Acute diarrhoea is defined as three or more loose bowel movements in a 24‐hour period (WHO/icddr,b 1995), and is one of the principal causes of morbidity and mortality among children in low‐income countries. Kosek 2003, a review of 27 prospective studies from 20 countries published from 1990 to 2000, estimated the incidence of diarrhoea as 3.8 episodes per child per year for children under 11 months of age and 2.1 episodes per child per year for children aged one to four years. It has a negative impact on quality of life and can result in considerable healthcare costs. Most of these diarrhoeal illnesses occur in low‐income countries and are mainly caused by infection. The cause is mainly viral in children aged under five years, while both bacterial and viral pathogens are implicated in adults (Casburn‐Jones 2004). Other causes of acute diarrhoea are disordered motility, such as irritable bowel syndrome, intake of certain drugs, or ileal bile acid malabsorption.
Description of the intervention
Since the 1980s, efforts to reduce the number of deaths from diarrhoea have been based on several interventions, including the improvement of water quality and sanitation, promotion of breastfeeding, and the introduction of treatment programmes that include oral rehydration therapy (Claeson 1990). The World Health Organization (WHO) introduced the oral rehydration solution (ORS) in 1979, and it rapidly became the cornerstone of programmes for the control of diarrhoeal diseases (Claeson 1990). The osmolarity of the original formulation is 310 mOsm/L (referred to as ORS ≥ 310) and consists of glucose (111 mmol/L), sodium (90 mmol/L), potassium (20 mmol/L), chloride (80 mmol/L), and citrate (10 mmol/L) or bicarbonate (30 mmol/L). The ORS was shown to improve signs of dehydration, including thirst, sunken eyeballs, sunken fontanelles, poor skin turgor, or a decreased or absence of urine output (WHO/icddr,b 1995). It was considered to be both safe and effective (Santosham 1991), and mainly responsible for the decrease in case‐fatality rates from acute dehydrating diarrhoea (Victora 2000). In 2004, the WHO recommended a different formulation in which the glucose and sodium content were each reduced to 75 mmol/L to give a total osmolarity of 245 mOsm/L (referred to as ORS ≤ 270) (WHO 2004). The ORS ≤ 270 reduces stool volume, shortens the duration of diarrhoea, and decreases the need for unscheduled intravenous therapy compared with ORS ≥ 310 (Hahn 2002).
How the intervention might work
The physiological basis for the use of ORS ≥ 310 was the co‐transport of glucose and sodium across the intestinal membrane (Santosham 1991). While this glucose‐based ORS is effective in replacing the fluid from acute diarrhoea and thus prevents further dehydration, it neither reduces stool loss nor shortens the duration of illness (Santosham 1991). Increasing the glucose concentration to greater than 111 mmol/L increases the osmotic load of the solution, which may further aggravate the fluid loss and induce hypernatraemia (Hunt 1992). In recent years, the WHO has recommended an ORS with 75 mmol/L of sodium, 75 mmol/L of glucose, and a total osmolarity of 245 mmol/L (ORS ≤ 270).
The biochemical basis for the use of a polymer‐based ORS is the presence of starch in rice, wheat, sorghum, and some fruits and vegetables (Carpenter 1988; Pizarro 1991). Even during diarrhoea, the digesting enzyme (amylase) is present in large amounts in the small intestine, so this starch is slowly broken down into glucose molecules. This glucose in turn provides the carrier molecules for co‐transport of sodium and water across the intestinal epithelium, without the corresponding osmotic penalty that results if the quantity of glucose is further increased by the use of ORS ≥ 310.
Why it is important to do this review
New ORS formulations have been evaluated in attempts to improve the efficacy of ORS ≥ 310 (Molla 1985; Fontaine 1998; Hoekstra 2004). Glucose polymer‐based ORS (referred to as polymer‐based ORS) may contain whole rice (amylopectins), as in rice‐based ORS or rice syrups (maltodextrins). The difference is that the latter contains only a small amount of amino acids and protein. Other sources of polymers are wheat, sorghum, and maize (high amylase‐resistant starch). In these polymer‐based solutions, the glucose is slowly released after digestion and is absorbed in the small bowel, which enhances the reabsorption of water and electrolyte secreted into the bowel lumen during diarrhoea (Carpenter 1988; Pizarro 1991). Although ORS ≥ 310 is no longer recommended, it remains unknown whether a polymer‐based ORS is indeed more effective than a glucose‐based ORS (that is, ORS ≥ 310 or ORS ≤ 270).
A Cochrane Review of rice‐based ORS for treating diarrhoea concluded that it significantly reduced the mean 24‐hour stool output in adults and children with cholera or cholera‐like diarrhoea, but results were inconclusive for infants and children with non‐cholera diarrhoea (Fontaine 1998). In this Cochrane Review, we have updated the evidence on the use of polymer‐based ORS (both rice‐based ORS and non‐rice based ORS) and expanded the primary outcome measures to include the number of participants who required unscheduled use of intravenous fluid therapy. Other primary outcome measures focus on the duration of diarrhoea and the stool output in the first 24 hours since these are considered crucial in the management of these patients and the first 24 hours is the time period of greatest stool loss. Our Cochrane Review also aims to provide more insights into whether polymer‐based ORS is more effective than glucose‐based ORS, and to inform future research.
Patients are dehydrated during the first six to eight hours, but once rehydrated, feeding is initiated and stool losses are replaced volume per volume with the ORS. The effect of feeding a rice‐based or starch‐based food as soon as the participants are rehydrated could confound the effects of glucose polymer‐based ORS (Alam 1992).
Objectives
To compare polymer‐based oral rehydration solution (polymer‐based ORS) with glucose‐based oral rehydration solution (glucose‐based ORS) for treating acute watery diarrhoea.
Methods
Criteria for considering studies for this review
Types of studies
Randomized controlled trials (RCTs).
Types of participants
Infants, children, and adults with acute watery diarrhoea (cholera and non‐cholera associated) and mild, moderate, or severe dehydration, as defined by the trial authors.
We excluded trials that included participants who were unable to drink or take in oral fluids, those in shock, and those with bloody diarrhoea or dysentery.
Types of interventions
Intervention
Polymer‐based oral rehydration solution (polymer‐based ORS): ORS in which glucose was replaced by a commercial or a local preparation of a polymer (for example, rice, wheat, maltodextrins, maize, sorghum, or corn), the electrolyte composition remaining unchanged between the two solutions.
Control
Glucose‐based ORS: ORS that contains glucose as a carbohydrate source with either 90 or 60 to 75 mmol/L of sodium.
Types of outcome measures
Primary outcomes
-
Total stool output (g/kg) during the first 24 hours after randomization.
-
Total stool output (g/kg) from randomization to cessation of diarrhoea.
-
Duration of diarrhoea (hours) from randomization until cessation of diarrhoea.
Secondary outcomes
-
Unscheduled intravenous fluid therapy.
-
Cases of vomiting.
Adverse events
-
All adverse events including hyponatraemia (serum sodium level ≤ 130 mmol/L) (low sodium), hypokalaemia (≤ 3 mol/L) (low potassium), and development of persistent diarrhoea.
Search methods for identification of studies
We included all relevant trials regardless of language or publication status (published, unpublished, in press, and ongoing).
Electronic searches
We searched the following databases using the search terms and strategy described in Appendix 1: the Cochrane Infectious Diseases Group Specialized Register (up to 5 September 2016); the Cochrane Central Register of Controlled Trials (CENTRAL), published in the Cochrane Library (2016, Issue 9); MEDLINE (1966 to 5 September 2016); EMBASE (1974 to 5 September 2016); and LILACS (1982 to 5 September 2016). We also searched themetaRegister of Controlled Trials (mRCT) using 'diarrhoea' and 'oral rehydration solution' as search terms (2007 to 5 September 2016).
Searching other resources
Researchers, organizations, and pharmaceutical companies
To help identify unpublished and ongoing trials, we conducted a communications or website search (1 May 2006 to 5 September 2016) with individual researchers working in the field of general paediatrics and gastroenterology, and the following organizations who may be funding a similar study: the World Health Organization (WHO) through Dr. Shin Young Soo, Regional D, Waterborne and Parasitic Diseases, WHO Regional Office for the Western Pacific, Manila, Philippines; INCLEN (www.inclen.org); USAID (www.usaid.gov); the Asian Development Bank (www.adb.org); and the World Bank (www.worldbank.org). We also searched United Laboratories Philippines (www.unilab.com.ph) and Abbott International (www.abbott.com.ph) (pharmaceutical companies who manufacture ORS) for any unpublished or ongoing trials.
Reference lists
We checked the reference lists of all studies identified by the above methods.
Data collection and analysis
Selection of studies
Two review authors (GVG and LFD) independently screened the literature search results by title or abstract. We retrieved the full‐text reports of studies that either one or both review authors considered potentially relevant and trials with unclear treatment allocation. We independently assessed the inclusion criteria of these trials using a standard eligibility form. We resolved any disagreements through discussion, or if necessary, we consulted a third review author (MLM Gonzales). We scrutinized trial reports to ensure we detected that the result has not been previously published. We listed the excluded studies and the reasons for exclusion in the 'Characteristics of excluded studies' section. We constructed a PRISMA diagram to illustrate the study selection process (Figure 1).

Study flow diagram.
Data extraction and management
Two review authors (GV Gregorio and EG Martinez or MLM Gonzales) independently extracted data from the included trials using pretested data extraction forms. We extracted the number of participants who were randomized and the number of participants analysed for all outcomes for each treatment arm in each trial to determine loss to follow‐up, whether loss was comparable across treatments, and to determine the type of analysis used. Since the primary outcome measures were continuous, we extracted arithmetic means and standard deviations (SDs) for each treatment group and noted the number of participants in each group. In trials with multiple interventions (two or more different polymer‐based ORS that were used as treatment groups), we pooled the means and SDs of the different polymer‐based ORS across the treatment arms.
For dichotomous outcome measures, we recorded the number(s) of participants that experienced the event and the number of participants analysed in each treatment group. In the meta‐analysis, for multiple treatment arms, we combined the number of participants that experienced the outcome in two or more experimental interventions as appropriate and compared collectively with the control group.
We resolved any disagreements about data extracted by referring to the trial report and through discussion, or, if necessary, we consulted a third review author. Where data were insufficient or missing, we attempted to contact the trial authors for clarification. GV Gregorio entered the data into Review Manager 5 (RevMan 5) (RevMan 2014).
Assessment of risk of bias in included studies
Two review authors (GV Gregorio and LF Dans or MLM Gonzales) independently assessed the risk of bias (methodological quality) of each trial using a prepared 'Risk of bias' assessment form. We assessed the generation of allocation sequence and allocation concealment as either 'high', 'low', or 'unclear'. We also noted who was blinded, such as the trial participants, care providers, or outcome assessors, and classified the inclusion of randomized participants in the analysis as either adequate if greater than 90% or inadequate if 90% or less. We used the results of the assessment to perform a sensitivity analysis. In the case of unclear or missing information, we attempted to contact the trial authors. We resolved disagreements by discussion between the review authors (Figure 2).
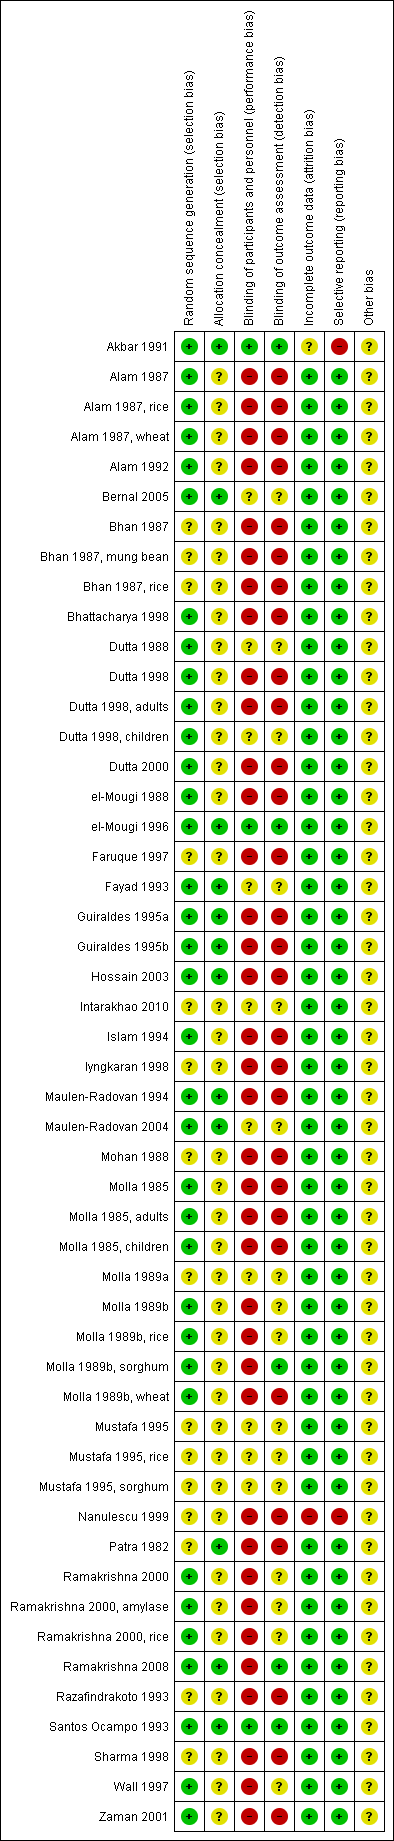
'Risk of bias' summary: review authors' judgements about each 'Risk of bias' item for each included study.
Measures of treatment effect
The primary outcome measures included: (1) total stool output in the first 24 hours from randomization (g/kg), (2) total stool output from randomization to cessation of diarrhoea (g/kg); and (3) duration of diarrhoea during the study period (hours). We extracted the arithmetic mean and standard deviation (or medians and ranges) values and the number of participants analysed in each treatment group.
The dichotomous outcomes included: (1) unscheduled use of intravenous fluid; (2) vomiting; (3) hyponatraemia; (4) hypokalaemia (low potassium levels); and (5) development of persistent diarrhoea (diarrhoea of more than 10 days' duration from onset). We recorded the number of participants who experienced the episode and the total number of participants in each group.
Unit of analysis issues
We used the weighted mean difference to combine continuous data that were summarized by arithmetic means and standard deviations data. If the included trials reported data using geometric means, this may have indicated that the data was skewed. Thus, we extracted the standard deviation on the log scale using the generic inverse variance method and reported it on the natural scale. We reported the medians and ranges in a table.
Dealing with missing data
We attempted to contact the trial authors for any insufficient or missing data. If there was discrepancy in the number of participants randomized and the number of participants analysed in each treatment group, we reported the percentage loss to follow‐up in each group. We performed an intention‐to‐treat analysis.
Assessment of heterogeneity
We evaluated the presence of statistical heterogeneity among the interventions by inspecting the forest plot and by performing a Chi² test for heterogeneity using a P value of 0.10 to determine statistical significance. Also, we used an I² statistic value of 50% as an indication of moderate heterogeneity. If there was statistically significant heterogeneity, we used the random‐effects or DerSimonian and Laird method to combine data (DerSimonian 1986); otherwise we applied a fixed‐effect model.
Assessment of reporting biases
We assessed the presence of publication bias by looking for asymmetry in the funnel plots. We also assessed asymmetry of the funnel plots using the StatsDirect computer programme (StatsDirect 2008), and considered a P value of less than 0.05 on Egger's bias test as significant.
Data synthesis
GV Gregorio analysed the data using RevMan (RevMan 2014), and presented the results with 95% confidence intervals (CI). We determined and reported the percentage of participants lost to follow‐up for all trials based on the number randomized and the number analysed in each treatment group. We based analyses on a complete‐case approach. For the participants who did not adhere to the study protocol, we based their outcome on what the trial author(s) reported (if they performed an intention‐to‐treat (ITT) analysis) or on data we sought from the trial authors (if there was no ITT analysis).
We presented risk ratios (RR) for dichotomous outcomes. We determined continuous outcomes summarized as arithmetic means and SDs data using the mean difference (MD).
We checked the normality of the data by calculating the ratio of the mean over the SD. If the ratio (mean/SD) was less than two, then it was likely that the data were skewed and therefore we did not combine the data in the meta‐analysis.
Subgroup analysis and investigation of heterogeneity
We investigated heterogeneity using subgroup analyses. We subgrouped trials according to the osmolarity of glucose ORS (ORS ≥ 310 or ORS ≤ 270) and type of polymer (rice, wheat, maltodextrins, and sorghum). We also evaluated the effect of the participant age (< 19 years (paediatric) and ≥ 19 years (adult) and of cholera as a pathogen. When there was substantial statistical heterogeneity (that is, I² statistic = 100%), we did not combine the trials in the meta‐analysis.
Sensitivity analysis
We performed sensitivity analyses to assess the robustness of the meta‐analysis by excluding trials of a low methodological quality, that is, those that used an inadequate method of randomization, unconcealed treatment allocation, and inadequate inclusion of randomized participants in the analysis.
Quality of the evidence
We assessed the quality of the evidence using the GRADE approach. We used the GRADEpro Guideline Development Tool (GDT) to prepare the 'Summary of findings' tables (GRADEpro GDT 2014). We considered generation of allocation sequence adequate if the study authors stated that they used a method with unpredictable sequence such as random number table or computer generated random numbers; unclear if trial authors stated that the trial was randomized but gave no further information; or inadequate when allocation was predictable and therefore introduced selection bias.
Allocation concealment was adequate if the investigator or the participant could not predict assignment to the group, such as by using central randomization, identical drug containers, or sealed opaque envelopes; unclear if the trial authors did not describe the method of concealment; or inadequate if the allocation of participant could be predicted.
We considered blinding adequate when the investigator or participant (double blind) did not know whether recruitment was to the intervention or control arms; unclear if the trial authors did not describe the method of blinding; and inadequate if the trial did not use blinding.
We considered follow‐up to be adequate when study authors presented study end points for 90% or more of the participants enrolled at the beginning; inadequate when follow‐up was less than 90%; and unclear when either the number of participants recruited at the beginning of the study or the number of participants who completed the study were unclear.
Results
Description of studies
Results of the search
In the first version of this review, Gregorio 2009, 34 trials met the inclusion criteria. For this review update, we identified 82 original records after we searched the literature up to 5 September 2016. We did not identify any further information regarding unpublished or ongoing clinical trials on polymer‐based oral rehydration solution (ORS) following communication with researchers, an organization, and pharmaceutical companies. After screening the literature search results by title and abstract, we excluded 81 records and assessed one full‐text article for eligibility. Only one new trial met the inclusion criteria of this review, Intarakhao 2010, and thus we included 35 trials in total in this review update. We have presented a PRISMA study flow diagram in Figure 1.
Included studies
Setting
Most trials were conducted in India (10 trials) and Bangladesh (nine trials). Other study centres were in Egypt (three trials) (el‐Mougi 1988; Fayad 1993; el‐Mougi 1996); Chile (two trials) (Guiraldes 1995a; Guiraldes 1995b); Mexico (two trials) (Maulen‐Radovan 1994; Maulen‐Radovan 2004); and one trial each was done in Australia (Wall 1997), Colombia (Bernal 2005), Madagascar (Razafindrakoto 1993), Malaysia (Iyngkaran 1998), Pakistan (Islam 1994), the Philippines (Santos Ocampo 1993), Romania (Nanulescu 1999), Sudan (Mustafa 1995), and Thailand (Intarakhao 2010). All but two trials were conducted in hospital settings. One trial was conducted in a paediatric clinic (Nanulescu 1999), and one in a rural treatment centre (Zaman 2007).
Participants
The 35 eligible trials included 4284 participants: 2304 used polymer‐based ORS and 1980 used glucose‐based ORS. In the individual trials, there was no statistically significant difference in the baseline characteristics between the two groups. Eight trials were on polymer‐based ORS versus ORS ≤ 270 while 27 trials used ORS ≥ 310.
Age
Twenty‐eight trials included children only: 25 trials in children less than five years old; one in children aged one to eight years old (Alam 1987); one in children aged two to ten years old (Dutta 2000); and one trial in children aged five to 15 years old (Zaman 2007). Five trials included adults only (Alam 1992; Bhattacharya 1998; Ramakrishna 2000; Hossain 2003; Ramakrishna 2008), and two trials included both adults and children (Molla 1985; Dutta 1998). The two trials that included both adults and children randomized and reported the outcomes separately for each group (Dutta 1998; Molla 1985).
Pathogen
In terms of the aetiology of diarrhoea, only eight trials randomized exclusively Vibrio cholerae‐positive participants (Molla 1989a; Alam 1992; Bhattacharya 1998; Dutta 1998; Dutta 2000; Ramakrishna 2000; Zaman 2001; Hossain 2003), while 22 trials included participants with mixed pathogens (both cholera and non‐cholera), and five trials did not report the pathogen (el‐Mougi 1988; Molla 1989b; Fayad 1993; Mustafa 1995; Sharma 1998).
Interventions
There were eight trials that compared polymer‐based ORS with ORS ≤ 270. Seven used rice as polymer source (Wall 1997; Bhattacharya 1998; Iyngkaran 1998; Nanulescu 1999; Dutta 2000; Maulen‐Radovan 2004; Intarakhao 2010), and one trial used amylase‐resistant starch (Ramakrishna 2008).
Twenty‐seven trials compared polymer‐based ORS with glucose‐based ORS ≥ 310 mOsm/L. Eighteen trials used varieties of rice (precooked, uncooked and pop rice), three trials evaluated maltodextrins (Akbar 1991; Santos Ocampo 1993; el‐Mougi 1996), one trial used amylase‐resistant starch (Ramakrishna 2000) and another used plantain flour (Bernal 2005). One trial each had rice‐based ORS in one trial arm and at least another polymer group: wheat (Alam 1987; Alam 1987, wheat); mung beans (Bhan 1987; Bhan 1987, mung bean); sorghum (Mustafa 1995, sorghum) ;and wheat, millet, maize, sorghum, and potatoes (Molla 1989b). In trials with more than one polymer group, they were reported separately. Overall, 22 trials used rice as a polymer source.
Feeding was started immediately after hydration in 26 trials, while in seven trials the onset of refeeding was unclear (Patra 1982; Molla 1985; Bhattacharya 1998; Dutta 1998; Iyngkaran 1998; Dutta 2000; Ramakrishna 2000). Only one trial withheld feeding in the first 24 hours (Molla 1989b). In another trial, Alam 1992, the participants were randomized into the rice‐ and glucose‐based ORS and further stratified as with and without food intake. In Alam 1992, we only used the data on participants with food intake in this review.
Outcomes reported
Most of the 35 trials reported the total stool output in the first 24 hours (25 trials), total stool output from randomization to discharge (18 trials), duration of diarrhoea (27 trials), and unscheduled use of intravenous fluid (19 trials). However, some of these outcomes were measured and reported in different units by the different studies and therefore we could not use all the data in the meta‐analyses (Table 1; Table 2). Furthermore, we did not include the data in the meta‐analyses if they were skewed: data for total stool output in 24 hours (Molla 1989a; Santos Ocampo 1993; Maulen‐Radovan 2004; Bernal 2005); on duration of diarrhoea (Santos Ocampo 1993; Mustafa 1995; Wall 1997); and total stool output from randomization to discharge (Santos Ocampo 1993).
| Trial | Unit of reporting total stool output during the first 24 hours |
| ORS ≤ 270 | |
| Mean (SD) L | |
| Median (range) | |
| Mean (SD) L | |
| Geometric mean (95% CI) but during maintenance phase | |
| ORS ≥ 310 | |
| Median (range) | |
| Geometric mean (95% CI) | |
| Geometric mean (95% CI) but during maintenance phase | |
| Median (range) | |
| Mean (SD) but reported only in g | |
| Mean (SD) in g | |
Abbreviations: SD: standard deviation; CI: confidence interval; ORS: oral rehydration solution.
| Trial | Unit of reporting duration of diarrhoea |
| ORS ≤270 | |
| Reported only as shorter for rice ORS | |
| Median (range) | |
| ORS ≥310 | |
| Median (hours) | |
| Geometric mean (95% CI) | |
| Mean (SD) but during maintenance phase | |
| Median (range) | |
| Not reported as patients were observed only for 24 hours | |
Abbreviations: CI: confidence interval; SD: standard deviation; ORS: oral rehydration solution.
A few trials reported the number of participants with vomiting (11 trials) (Patra 1982; Bhan 1987; el‐Mougi 1988; Mohan 1988; Alam 1992; Islam 1994; Mustafa 1995, rice; Mustafa 1995, sorghum; Dutta 1998, adults; Dutta 1998, children; Iyngkaran 1998); hyponatraemia (six trials) (Dutta 1988; Guiraldes 1995a; Bhattacharya 1998; Dutta 2000; Zaman 2001; Ramakrishna 2008); hypokalaemia (two trials) (Bhan 1987; Zaman 2007); and development of persistent diarrhoea (two trials) (Fayad 1993; Faruque 1997).
Excluded studies
We excluded 35 trials from the previous version of this review, Gregorio 2009, for the following reasons (see the 'Characteristics of excluded studies' section): the electrolyte composition of the intervention and the control group were not identical or unknown (11 studies); the composition of the treatment group was either unknown or not a polymer (eight studies); the study was not a clinical trial on ORS but on the use of drugs in acute diarrhoea (four trials); the control group used an oral saline solution (one study) or an ORS that did not contain either 90 or 60 to 75 mmol/L sodium (three studies); not a randomized controlled trial (RCT) (one study); no control group (one study); not an efficacy but an effectiveness study (two studies); participants with persistent and not acute diarrhoea (two studies); and two clinical trials did not report the primary or secondary outcome of interest of this review. For this review update we only assessed one full‐text article for eligibility, which met the inclusion criteria of this review (Intarakhao 2010). We did not exclude any other full‐text articles.
Risk of bias in included studies
See Appendix 2 and Figure 2 for a summary of the 'Risk of bias' assessments and the 'Characteristics of included studies' for details of each trial's methods.
Allocation
Of the 35 trials, 24 trials used adequate methods to generate the allocation sequence (computer‐generated or random‐numbers table) and 11 trials used methods that were unclear (Patra 1982; Bhan 1987; Mohan 1988; Molla 1989a; Mustafa 1995; Razafindrakoto 1993; Faruque 1997; Iyngkaran 1998; Sharma 1998; Nanulescu 1999; Intarakhao 2010).
Only 12 trials used an adequate method to conceal allocation (Patra 1982; Bhan 1987; Fayad 1993; Santos Ocampo 1993; Maulen‐Radovan 1994; Guiraldes 1995a; Guiraldes 1995b; el‐Mougi 1996; Hossain 2003; Maulen‐Radovan 2004; Bernal 2005; Zaman 2007). The method was unclear in the other 23 included trials.
Blinding
Three trials performed blinding of the participants, providers, and assessors (Akbar 1991; Santos Ocampo 1993; el‐Mougi 1996). Blinding was difficult or impossible in most trials because of the difference in the appearance of the ORS formulation after reconstitution.
Incomplete outcome data
All but two trials included an adequate (over 90%) number of randomized participants in the analysis. We assessed the number of participants as inadequate in two trials (Akbar 1991; Nanulescu 1999).
Selective reporting
Two trials selectively reported data (Akbar 1991; Nanulescu 1999).
Other potential sources of bias
It was unclear if there were any other potential sources of bias in the included trials.
Effects of interventions
See: Summary of findings for the main comparison 'Summary of findings' table 1; Summary of findings 2 'Summary of findings' table 2
Comparison 1: Polymer‐based ORS versus glucose‐based ORS (≤ 270 mOsm/L)
Eight trials (752 participants) compared polymer‐based ORS with glucose‐based ORS with osmolarity ≤ 270 mOsm/L (see Table 3). Seven trials used rice as a source of polymer. Two trials were conducted in adults (Bhattacharya 1998; Ramakrishna 2008), and the remaining trials were conducted in children (Wall 1997; Iyngkaran 1998; Nanulescu 1999; Dutta 2000; Maulen‐Radovan 2004; Intarakhao 2010). Two studies only included participants with V. cholerae (Bhattacharya 1998; Dutta 2000), while the other six studies included participants with mixed infections.
| Trial | Type of polymer ORS | Age of participants | Cause of diarrhoea | Level of dehydration | Malnutrition | Country | Year of study |
| Rice ORS | 1 month to 5 years | Rotavirus | Mild and moderate | Not stated | Australia | Not stated | |
| Rice ORS | Adult males | Vibrio cholerae | Severe | Not stated | India | 1993 to 1996 | |
| Rice ORS | < 6 months | Mixed pathogen | Mild and moderate | Not stated | Malaysia | Not stated | |
| Rice ORS | 1 to 12 months | Mixed pathogens | Mild and moderate | Included those with weight for age > 80% of 50th percentile | Northern Romania | 1995 to 1996 | |
| Cooked rice | 2 to 10 years | V. cholerae | Severe | Not stated | India | 1995 to 1998 | |
| Premixed rice | 3 to 24 months | Rotavirus (43%) | Mild, moderate, and severe | Excluded those with severe malnutrition | Mexico | 1994 to 1995 | |
| Amylase‐resistant starch | 12 to 65 years | Mixed pathogens | Moderate and severe | Not stated | India | 2003 to 2005 | |
| Rice ORS | 9 months to 5 years old | Rotavirus (60%) | Mild and Moderate | Not stated | Thailand | 2007 to 2008 |
Abbreviation: ORS: oral rehydration solution.
Stool output
Mean stool volume in the first 24 hours was lower with polymer‐based ORS in the only study (Nanulescu 1999) that assessed this (MD −24.60 mL/kg, 95% CI −40.69 to −8.51; 1 trial, 99 participants, Analysis 1.1).
Duration of diarrhoea
On average across five trials, the mean duration of diarrhoea was around eight hours shorter with polymer‐based ORS (MD −8.24 hours, 95% CI −13.17 to −3.30; 5 trials, 364 participants, Analysis 1.2). There was substantial statistical heterogeneity between trials in the size of the effect which ranged from three hours shorter to 13 hours shorter (Chi² test P < 0.00001, I² statistic = 86%).
Unscheduled use of intravenous fluid
The number of participants that needed intravenous rehydration was lower with polymer‐based ORS but the 95% CI includes the possibility of both important effects and no effect (RR 0.62, 95% CI 0.36 to 1.08; I² statistic = 30%; 3 trials, 326 participants, Analysis 1.3).
Adverse events
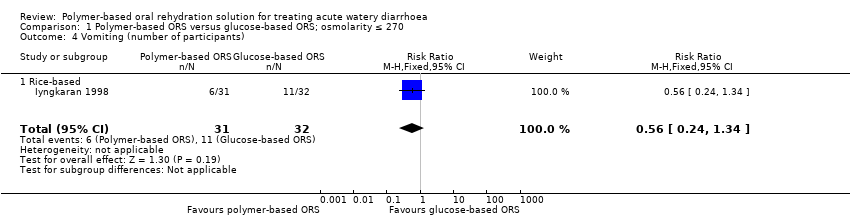
One small trial reported the number of participants with vomiting in each group (Iyngkaran 1998), but was too small to detect or exclude important differences (RR 0.56, 95% CI 0.24 to 1.34; 1 trial, 63 participants, Analysis 1.4). Three trials reported on the incidence of hyponatraemia (Bhattacharya 1998; Dutta 2000; Ramakrishna 2008), and again they were too small to reliably prove or exclude important differences (RR 0.88, 95% CI 0.43 to 1.82; 3 trials, 145 participants, Analysis 1.5). No trials reported hypokalaemia or the development of persistent diarrhoea.
Comparison 2: Polymer‐based ORS versus glucose‐based ORS (≥ 310 mOsm/L)
Twenty‐seven trials (3532 participants) compared polymer‐based ORS with glucose‐based ORS ≥ 310 mOsm/L (see Table 4). Eighteen trials evaluated varieties of rice (precooked, uncooked, and pop rice), three evaluated maltodextrins (Akbar 1991; Santos Ocampo 1993; el‐Mougi 1996), one used amylase‐resistant starch (Ramakrishna 2000), and one trial each had a rice based in one arm and at least another polymer group: wheat (Alam 1987); mung beans (Bhan 1987); sorghum (Mustafa 1995); plantain flour (Bernal 2005); and wheat, millet, maize, sorghum, and potatoes (Molla 1989b). Overall, 23 trials used rice as a polymer source.
| Trial | Type of polymer ORS | Age of participants | Cause of diarrhoea | Level of dehydration | Malnutrition | Country | Year of study |
| Maltodextrin | 4 to 36 months | Rotavirus and ETEC | Mild and moderate | Excluded severe | Bangladesh | 1987 to 1988 | |
| Wheat and rice | 1 to 8 years | Not stated | Moderate and severe | Excluded severe malnutrition (< 60% weight for age of 50th centile National Center for Health Statistics (NCHS) | Bangladesh | 1984 | |
| Rice | 15 to 60 years | Cholera (positive for Vibrio cholerae) | Not stated | Not stated | Bangladesh | 1988 | |
| Plantain flour | 1 to 48 months | Mixed pathogens | "Presence", but without shock | Not stated | Colombia | Not stated | |
| Pop Rice and mung bean | 3 months to 5 years | Mixed pathogens | "Presence", level not stated | Included those with weight for height (wt/ht) > 70% of 50th centile of reference standard | India | Not stated | |
| Rice and pop rice | 4 months to 4 years | Not stated | Severe | Not stated | India | Not stated | |
| Rice | 3 to 12 years; 18 to 55 years | Cholera (positive for V. cholerae) | Severe | Not stated | India | 1995 to 1996 | |
| Rice | 4 months to 4 years | Not stated | Moderate and severe | Not stated. Excluded marasmic‐kwashiorkor | Egypt | Not stated | |
| Maltodextrin | 3 to 24 months | Not stated | Moderate | Not stated. Excluded severe malnutrition | Egypt | Not stated | |
| Rice | 3 to 35 months | Mixed pathogens | Mild and Moderate | Excluded severe malnutrition | Bangladesh | 1990 to 1991 | |
| Rice | 3 to 18 months | Not stated | "Presence", level not stated | Excluded severe malnutrition | Egypt | 1990 to 1992 | |
| Rice | 3 to 18 months | Mixed pathogens | Moderate | Excluded moderate to severe malnutrition | Chile | Not stated | |
| Rice | 3 to 24 months | Mixed pathogens | Moderate | Excluded moderate to severe malnutrition | Chile | Not stated | |
| Rice | 18 to 60 years | V. cholerae | Severe | Not stated | Bangladesh | 1995 | |
| Rice | < 6 months | Not stated | Mild and moderate | Included those with wt/age > 75% of 50th centile | Pakistan | 1990 | |
| Precooked rice | 1 to 6 months | Mixed pathogens | Mild and moderate | Excluded severe malnutrition | Mexico | Not stated | |
| Rice | 3 to 36 months | Not stated | "Presence", level not stated | Not stated | India | Not stated | |
| Rice | "adults" | Not stated | Moderate and severe | Not stated | Bangladesh | 1983 | |
| Rice | < 10 years | Not stated | Moderate and severe | Not stated | Bangladesh | 1983 | |
| Rice | < 5 years | V. cholerae | Moderate and severe | Not stated | Bangladesh | Not stated | |
| Rice, maize, sorghum, millet, wheat, potatoes | 1 to 5 years | Not stated | Moderate and severe | Not stated | Bangladesh | Not stated | |
| Rice, sorghum | 6 to 40 months | Not stated | Moderate and severe | Included normal and underweight children | Sudan | 1990 | |
| Rice | 3 months to 5 years | Not stated | Moderate and severe | Not stated | India | Not stated | |
| Rice flour, amylase resistant starch | 14 to 58 years | V. cholerae | Not stated | Not stated | India | 1994 to 1996 | |
| Rice | 6 to 36 months | Not stated | Mild and moderate | Excluded severe malnutrition, < 70% of reference standard | Madagascar | 1990 | |
| Maltodextrin | 3 to 36 months | Mixed pathogens | Mild and moderate | Excluded severe malnutrition | Philippines | Not stated | |
| Rice | 7 to 36 months | Non‐cholerae | Some (mild and moderate) | Included children > 80% as per Indian Academy of Pediatrics (IAP) classification | India | Not stated | |
| Rice | 5 to 15 years | Not stated | Moderate to severe | Not stated. Exclusion criteria: malnutrition < 65% weight for age | Bangladesh | 1997 |
Abbreviations: ORS: oral rehydration solution.NCHS: National Center for Health Statistics; IAP: Indian Academy of Pediatrics; wt/ht: weight for height.
Stool output
On average, the stool volume during the first 24 hours was around 65 mL/kg lower in the polymer‐based ORS group (MD −65.47, 95% CI −83.92 to −47.03; 16 trials, 1483 participants, Analysis 2.1). There was substantial statistical heterogeneity between trials (Chi² test P < 0.00001, I² statistic = 100%), which was not well explained by subgroup analyses based on age (Analysis 2.2), or pathogen (Analysis 2.3). The heterogeneity is mainly in the size of the effect which ranged from 181 mL/kg lower to 27 mL/kg higher.
Duration of diarrhoea
On average, the duration of diarrhoea was around eight hours shorter in the polymer‐based ORS group compared to glucose‐based ORS (MD −8.47 hrs, 95% CI −12.86 to −4.08; 16 trials, 1187 participants, Analysis 2.4; Chi² test P < 0.00001, I² statistic = 100%). Substantial statistical heterogeneity between trials was not explained by subgroup analyses based on age (Analysis 2.5), and type of pathogen (Analysis 2.6). The heterogeneity is mainly in the size of the effect which ranged from 0.5 hours shorter to 27 hours shorter.
Unscheduled use of intravenous fluid
The proportion of participants that required intravenous hydration was low in most trials and without statistically significant differences between groups (RR 0.75, 95% CI 0.57 to 0.98; I² statistic = 0%; 19 trials, 1877 participants, Analysis 2.7). A subgroup analysis by type of pathogen found a statistically significant decrease on unscheduled intravenous fluid those infected with mixed pathogens (RR 0.63, 95% CI 0.41 to 0.96; I² statistic = 0%; 11 trials, 928 participants, Analysis 2.8), but not in participants positive for V. cholerae (RR 0.94, 95% CI 0.66 to 1.34; I² statistic = 0%; 7 trials, 535 participants, Analysis 2.8).
Adverse effects
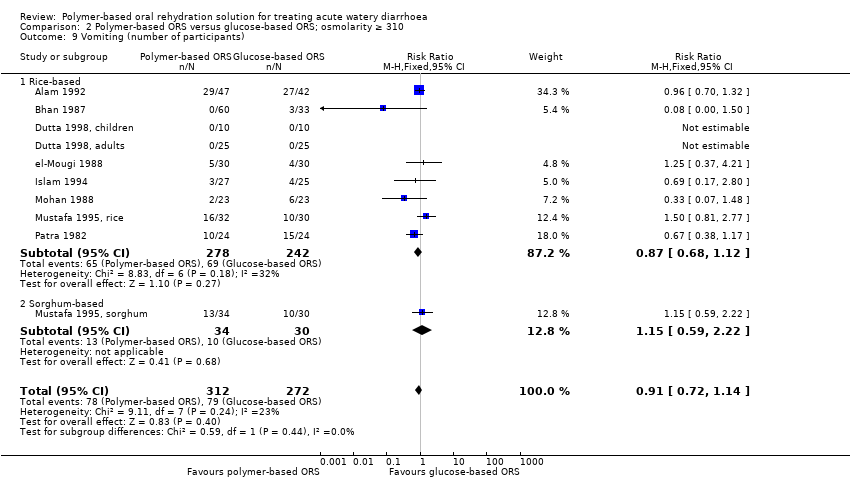
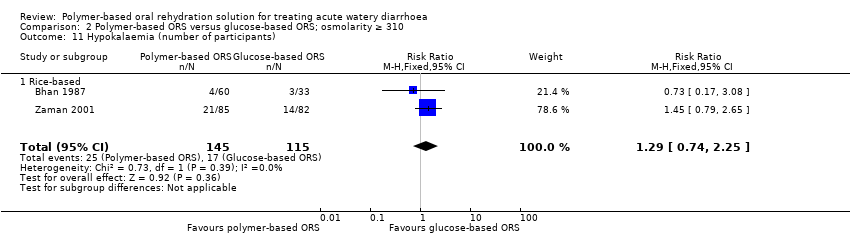
There was no statistically significant difference between the polymer‐based and glucose‐based ORS groups in the number of participants who developed vomiting (10 trials, 584 participants, Analysis 2.9), hyponatraemia (4 trials, 385 participants, Analysis 2.10), hypokalaemia (2 trials, 260 participants, Analysis 2.11), or persistent diarrhoea (2 trials, 885 participants, Analysis 2.12).
Publication bias
We observed substantial, significant heterogeneity in the primary outcomes and therefore we decided to use a funnel plot for the secondary outcome, where the data were homogenous. We constructed a funnel plot of 19 trials that compared polymer‐based and ORS ≥ 310 and measured the outcome of unscheduled use of intravenous fluid (Figure 3). The funnel plot is asymmetric due to the absence of smaller trials at the base and to the right of the pooled estimate. Asymmetry in the funnel plot could result from possible selection bias where smaller studies reporting greater treatment benefit for the experimental group were published (publication bias). The gap in the bottom corner of the graph suggests that smaller studies without statistically significant effects remain unpublished. Differences in inclusion criteria (for example, cholera positive versus mixed pathogens) and method of assessment of unscheduled use of intravenous fluid may also account for the asymmetry.

Funnel plot of comparison: 2 Polymer‐based ORS versus glucose‐based ORS, osmolarity ≥ 310, outcome: 2.7 Unscheduled use of intravenous fluid.
Discussion
Summary of main results
Polymer‐based ORS versus glucose‐based ORS (osmolarity ≤ 270)
Eight trials (752 participants) evaluated this comparison, and seven trials used rice as a polymer source. Polymer‐based oral rehydration solution (ORS) reduces mean stool output in the first 24 hours by 24 mLl/kg (mean difference (low quality evidence). The average duration of diarrhoea may be reduced by eight hours (low quality evidence) with polymer ORS but results are heterogeneous. Limited trials showed no observed difference in the risk of unscheduled use of intravenous fluid (very low quality evidence), vomiting (very low quality evidence), and hyponatraemia (very low quality evidence).
Polymer‐based ORS versus glucose‐based ORS (osmolarity ≥ 310)
Twenty‐seven trials (3532 participants) evaluated this comparison using a variety of polymers. On average, polymer ORS may reduce the total stool output in the first 24 hours by around 65 mLl/kg (low quality evidence) and may reduce the duration of diarrhoea by around eight hours (low quality evidence) with substantial heterogeneity. The proportion of participants that required intravenous hydration was low (low quality evidence) and without statistically significant difference between groups. Subgroup analysis by type of pathogen found a statistically significant decrease on unscheduled intravenous fluid in those infected with mixed pathogens (low quality evidence) but not in participants positive for Vibrio cholerae (low quality evidence). No difference was observed in the proportion of patients who developed vomiting (very low quality evidence), hyponatraemia (very low quality evidence), hypokalaemia (low quality evidence), or persistent diarrhoea (very low quality evidence).
Overall completeness and applicability of evidence
We retrieved all relevant trials regardless of language or publication status (published, unpublished, in press, and ongoing) and we included those that met the inclusion criteria. Most clinical trials included infants and children with acute diarrhoea and were conducted in developing countries, which are the age group and the setting with a high incidence of diarrhoea. However, most of the clinical trials (77%) used ORS ≥ 310. Since 2004, the World Health Organization (WHO) has recommended the use of reduced osmolarity ORS ≤ 270. There were only eight clinical trials that used ORS ≤ 270, thus, data from this review could not adequately compare the two formulations.
Quality of the evidence
Polymer‐based versus ORS ≤ 270
We assessed the quality of the evidence as low to very low. There was serious risk of bias. Of the eight trials, only five had adequate allocation sequence and only one had adequate allocation concealment (Maulen‐Radovan 2004). No study was blinded and there was one with inadequate follow‐up (Nanulescu 1999). There is serious risk of indirectness as most (88%) trials were conducted in a hospital setting. There is also risk of imprecision due to the limited sample size and wide confidence interval (CI) of the results.
Polymer‐based versus ORS ≥ 310
The quality of the evidence was from low to very low. Of the 27 trials, most trials (18 trials, 67%) had adequate allocation sequence but only 11 trials (41%) had adequate allocation concealment; the rest were unclear. Only three trials had complete blinding, the rest had partial, unclear, or no blinding. There is risk of indirectness as all but one trial was conducted in a hospital setting. There was no serious imprecision as the sample size was sufficient to detect any difference in the outcomes.
Overall, there is substantial heterogeneity in the clinical trials, despite statistically significant results in the primary outcomes. Different authors assessed the outcomes differently and this may explain the heterogeneity in the treatment effect (methodological diversity). Ideally, measurement of stool output should be made by taking the difference in the weight of the diaper before and after use. In some studies that included both males and females (especially in the paediatric group), the urine output may have been inadvertently mixed with the stool, giving an erroneously higher stool output. In adults, three trials used a cholera cot to measure stool output (Bhattacharya 1998; Dutta 2000; Ramakrishna 2000), while one trial did not state the measurement method used (Alam 1992). The cholera cot has a bucket underneath to measure the stool output more accurately. It was also unclear in most trials whether the duration of diarrhoea was measured from the initial onset of the disease, before admission to the study, or only from admission up to the time of discharge. Different trials may also have used different criteria to define patients who warrant an unscheduled use of intravenous fluid.
Polymer‐based ORS may have several advantages that are independent of glucose. The protein and amino acid component found in certain polymer‐based ORS, such as in rice‐based ORS, may stimulate sodium absorption and the slow breakdown of starch into glucose molecules may promote reabsorption of intestinal secretions and reduce the volume and duration of diarrhoea. The new reduced osmolarity ORS formulation (ORS ≤ 270) with reduced osmotic load is the currently recommended ORS (WHO 2004). This Cochrane Review failed to show with certainty that polymer‐based ORS is as effective as, or is more effective than, the reduced osmolarity ORS.
Potential biases in the review process
We searched different databases for clinical trials on ORS and acute diarrhoea. Also we checked the web sites of organizations and pharmaceutical companies who may be funding a similar study for unpublished or ongoing clinical trials. However, we still observed publication bias as evidenced by an asymmetric funnel plot due to the absence of smaller trials at the base and to the right of the pooled estimate. This suggests that clinical trials with small numbers of participants or with negative results remain unpublished. Most trials were done in the hospital setting under ideal conditions with highly selected participants that had evidence of moderate to severe dehydration. This limits the review's ability to be generalized as most acute diarrhoea cases start at home and the severity of dehydration may be minimized by immediately initiating ORS.
Agreements and disagreements with other studies or reviews
The efficacy of rice‐based ORS has previously been reported to decrease the stool output in the first 24 hours among V. cholerae‐positive patients, in both adults and children (Fontaine 1998). We observed that polymer‐based ORS as compared with glucose ORS ≥ 310 decreased the total stool output and duration of diarrhoea, regardless of whether the diarrhoea was secondary to V. cholerae infection or due to either bacterial or viral cause (mixed pathogens). This review considered all clinical trials that used rice and non‐rice sources of polymers, such as wheat, maize, or sorghum, that are used as staple foods in other parts of the world.
On the other hand, polymer‐based ORS ≥ 310 decreased the need for intravenous fluid only among those infected with mixed pathogens but not in V. cholerae‐positive patients. The difference in effect may be attributed to the difference in the diarrhoeal mechanism between these pathogens. Cholera is an enterotoxin‐mediated diarrhoea and intestinal secretory processes are activated by the bacteria, which leads to massive fluid and electrolyte losses, without any macro‐ or micro‐damage to the intestinal mucosa. Thus, there is a need for rapid fluid replacement which may not be possible with oral rehydration alone. On the other hand, commonly‐encountered enteric pathogens in childhood diarrhoea, such as rotavirus, Salmonella spp, and Shigella spp, cause injury to the intestinal mucosae which leads to a decrease in intestinal absorption of fluid, electrolytes, and nutrients.
In a large multicentre trial, the use of a reduced osmolarity ORS (ORS ≤ 270) compared to a glucose‐based ORS (ORS ≥ 310) decreased the need for unscheduled use of intravenous fluid by 33% (CHOICE 2001). In this review, most of the included clinical trials used ORS ≥ 310 and only a few trials used the newer ORS ≤ 270, which has a lower osmolarity. We were unable to make any definite conclusion on the efficacy of polymer‐based ORS compared with ORS ≤ 270.

Study flow diagram.

'Risk of bias' summary: review authors' judgements about each 'Risk of bias' item for each included study.

Funnel plot of comparison: 2 Polymer‐based ORS versus glucose‐based ORS, osmolarity ≥ 310, outcome: 2.7 Unscheduled use of intravenous fluid.

Comparison 1 Polymer‐based ORS versus glucose‐based ORS; osmolarity ≤ 270, Outcome 1 Total stool output during first 24 hours.

Comparison 1 Polymer‐based ORS versus glucose‐based ORS; osmolarity ≤ 270, Outcome 2 Duration of diarrhoea.

Comparison 1 Polymer‐based ORS versus glucose‐based ORS; osmolarity ≤ 270, Outcome 3 Unscheduled use of intravenous fluid.
Comparison 1 Polymer‐based ORS versus glucose‐based ORS; osmolarity ≤ 270, Outcome 4 Vomiting (number of participants).

Comparison 1 Polymer‐based ORS versus glucose‐based ORS; osmolarity ≤ 270, Outcome 5 Hyponatraemia (number of participants).

Comparison 2 Polymer‐based ORS versus glucose‐based ORS; osmolarity ≥ 310, Outcome 1 Total stool output during first 24 hours.

Comparison 2 Polymer‐based ORS versus glucose‐based ORS; osmolarity ≥ 310, Outcome 2 Total stool output during the first 24 hours; rice‐based ORS subgrouped by age group.

Comparison 2 Polymer‐based ORS versus glucose‐based ORS; osmolarity ≥ 310, Outcome 3 Total stool output during the first 24 hours; rice‐based ORS subgrouped by pathogen.

Comparison 2 Polymer‐based ORS versus glucose‐based ORS; osmolarity ≥ 310, Outcome 4 Duration of diarrhoea.

Comparison 2 Polymer‐based ORS versus glucose‐based ORS; osmolarity ≥ 310, Outcome 5 Duration of diarrhoea; rice‐based ORS subgrouped by age group.

Comparison 2 Polymer‐based ORS versus glucose‐based ORS; osmolarity ≥ 310, Outcome 6 Duration of diarrhoea; rice‐based ORS subgrouped by type of pathogen.

Comparison 2 Polymer‐based ORS versus glucose‐based ORS; osmolarity ≥ 310, Outcome 7 Unscheduled use of intravenous fluid.

Comparison 2 Polymer‐based ORS versus glucose‐based ORS; osmolarity ≥ 310, Outcome 8 Unscheduled use of intravenous fluid, subgrouped by type of pathogen.
Comparison 2 Polymer‐based ORS versus glucose‐based ORS; osmolarity ≥ 310, Outcome 9 Vomiting (number of participants).

Comparison 2 Polymer‐based ORS versus glucose‐based ORS; osmolarity ≥ 310, Outcome 10 Hyponatraemia (number of participants).
Comparison 2 Polymer‐based ORS versus glucose‐based ORS; osmolarity ≥ 310, Outcome 11 Hypokalaemia (number of participants).

Comparison 2 Polymer‐based ORS versus glucose‐based ORS; osmolarity ≥ 310, Outcome 12 Developed persistent diarrhoea (number of participants).
| Polymer‐based ORS compared to glucose‐based ORS ≤ 270 mOsm/L for treating acute watery diarrhoea | |||||
| Patient or population: adults and children with acute watery diarrhoea | |||||
| Outcomes | Illustrative comparative risks* (95% CI) | Relative effect | Number of participants | Quality of the evidence | |
| Assumed risk | Corresponding risk | ||||
| Glucose‐based ORS | Polymer‐based ORS | ||||
| Total stool output during first 24 hours | The mean stool output in the control group was 102 mL/kg | The mean stool output in the intervention group was | — | 99 | ⊕⊕⊝⊝ |
| Duration of diarrhoea | The mean duration in the control groups ranged from | The mean duration of diarrhoea in the intervention groups was | — | 364 | ⊕⊕⊝⊝ |
| Unscheduled use of intravenous fluid | 9 per 100 | 6 per 100 | RR 0.66 | 376 | ⊕⊝⊝⊝ |
| Vomiting | 35 per 100 | 20 per 100 (8 to 47) | RR 0.56 (0.24 to 1.34) | 63 (1 trial) | ⊕⊝⊝⊝8,9,10 very low |
| Hyponatraemia | 23 per 100 | 18 per 100 (8 to 40) | RR 0.88 (0.43 to 1.82) | 145 (3 trials) | ⊕⊝⊝⊝1,7,11 very low |
| The assumed risk is the mean control group risk across studies. The corresponding risk (and its 95% CI) is based on the assumed risk in the comparison group and the relative effect of the intervention (and its 95% CI). | |||||
| GRADE Working Group grades of evidence | |||||
| 1Downgraded by 1 for serious risk of bias: the method of allocation concealment was unclear, and there was no blinding. | |||||
| Polymer‐based ORS compared to glucose‐based ORS ≥ 310 mOsm/L for treating acute watery diarrhoea | |||||
| Patient or population: adults and children with acute watery diarrhoea | |||||
| Outcomes | Illustrative comparative risks* (95% CI) | Relative effect | Number of participants | Quality of the evidence | |
| Assumed risk | Corresponding risk | ||||
| Glucose‐based ORS | Polymer‐based ORS | ||||
| Total stool output during first 24 hours | The mean stool output in the control groups ranged from 81 to 366 mL/kg | The mean stool output in the intervention groups was | — | 1483 | ⊕⊕⊝⊝ |
| Duration of diarrhoea | The mean duration in the control groups ranged from | The mean duration of diarrhoea in the intervention groups was | — | 1187 | ⊕⊕⊝⊝ |
| Unscheduled use of intravenous fluid | 102 per 1000 | 79 per 1000 | RR 0.75 | 1877 | ⊕⊕⊝⊝ |
| Unscheduled use of intravenous fluid in those with mixed pathogen | 101 per 1000 | 63 per 1000 (31 to 60) | RR 0.63 (0.49 to 0.96) | 928 (11 trials) | ⊕⊕⊝⊝ low1,3,4,5 |
| Unscheduled use of intravenous fluid in those with Cholera | 159 per 1000 | 150 per 1000 (105 to 213) | RR 0.94 (0.66 to 1.34) | 535 (7 trials) | ⊕⊕⊝⊝ low1,3,4,5 |
| Vomiting | 313 per 1000 | 250 per 1000 (197 to 313) | RR 0.91 (0.72 to 1.14) | 584 (10 trials) | ⊕⊝⊝⊝ |
| Hyponatraemia | 16 per 1000 | 30 per 1000 (9 to 104) | RR 1.82 (0.52 to 6.44) | 385 (4 trials) | ⊕⊝⊝⊝ |
| Hypokalaemia | 148 per 1000 | 191 per 1000 (110 to 333) | RR 1.29 (0.74 to 2.25) | 260 (2 trials) | ⊕⊕⊝⊝ low1,6,8,9 |
| Development of persistent diarrhoea | 17 per 1000 | 21 per 1000 (6 to 78) | RR 1.28 (0.68 to 2.41) | 885 (2 trials) | ⊕⊝⊝⊝6,10,11 |
| The assumed risk is the mean control group risk across studies. The corresponding risk (and its 95% CI) is based on the assumed risk in the comparison group and the relative effect of the intervention (and its 95% CI). | |||||
| GRADE Working Group grades of evidence | |||||
| 1Downgraded by 1 for serious risk of bias: most trials were at high risk of selection bias due to a lack of allocation concealment, and most were at high risk of detection or reporting bias due to a lack of blinding. | |||||
| Trial | Unit of reporting total stool output during the first 24 hours |
| ORS ≤ 270 | |
| Mean (SD) L | |
| Median (range) | |
| Mean (SD) L | |
| Geometric mean (95% CI) but during maintenance phase | |
| ORS ≥ 310 | |
| Median (range) | |
| Geometric mean (95% CI) | |
| Geometric mean (95% CI) but during maintenance phase | |
| Median (range) | |
| Mean (SD) but reported only in g | |
| Mean (SD) in g | |
| Abbreviations: SD: standard deviation; CI: confidence interval; ORS: oral rehydration solution. | |
| Trial | Unit of reporting duration of diarrhoea |
| ORS ≤270 | |
| Reported only as shorter for rice ORS | |
| Median (range) | |
| ORS ≥310 | |
| Median (hours) | |
| Geometric mean (95% CI) | |
| Mean (SD) but during maintenance phase | |
| Median (range) | |
| Not reported as patients were observed only for 24 hours | |
| Abbreviations: CI: confidence interval; SD: standard deviation; ORS: oral rehydration solution. | |
| Trial | Type of polymer ORS | Age of participants | Cause of diarrhoea | Level of dehydration | Malnutrition | Country | Year of study |
| Rice ORS | 1 month to 5 years | Rotavirus | Mild and moderate | Not stated | Australia | Not stated | |
| Rice ORS | Adult males | Vibrio cholerae | Severe | Not stated | India | 1993 to 1996 | |
| Rice ORS | < 6 months | Mixed pathogen | Mild and moderate | Not stated | Malaysia | Not stated | |
| Rice ORS | 1 to 12 months | Mixed pathogens | Mild and moderate | Included those with weight for age > 80% of 50th percentile | Northern Romania | 1995 to 1996 | |
| Cooked rice | 2 to 10 years | V. cholerae | Severe | Not stated | India | 1995 to 1998 | |
| Premixed rice | 3 to 24 months | Rotavirus (43%) | Mild, moderate, and severe | Excluded those with severe malnutrition | Mexico | 1994 to 1995 | |
| Amylase‐resistant starch | 12 to 65 years | Mixed pathogens | Moderate and severe | Not stated | India | 2003 to 2005 | |
| Rice ORS | 9 months to 5 years old | Rotavirus (60%) | Mild and Moderate | Not stated | Thailand | 2007 to 2008 | |
| Abbreviation: ORS: oral rehydration solution. | |||||||
| Trial | Type of polymer ORS | Age of participants | Cause of diarrhoea | Level of dehydration | Malnutrition | Country | Year of study |
| Maltodextrin | 4 to 36 months | Rotavirus and ETEC | Mild and moderate | Excluded severe | Bangladesh | 1987 to 1988 | |
| Wheat and rice | 1 to 8 years | Not stated | Moderate and severe | Excluded severe malnutrition (< 60% weight for age of 50th centile National Center for Health Statistics (NCHS) | Bangladesh | 1984 | |
| Rice | 15 to 60 years | Cholera (positive for Vibrio cholerae) | Not stated | Not stated | Bangladesh | 1988 | |
| Plantain flour | 1 to 48 months | Mixed pathogens | "Presence", but without shock | Not stated | Colombia | Not stated | |
| Pop Rice and mung bean | 3 months to 5 years | Mixed pathogens | "Presence", level not stated | Included those with weight for height (wt/ht) > 70% of 50th centile of reference standard | India | Not stated | |
| Rice and pop rice | 4 months to 4 years | Not stated | Severe | Not stated | India | Not stated | |
| Rice | 3 to 12 years; 18 to 55 years | Cholera (positive for V. cholerae) | Severe | Not stated | India | 1995 to 1996 | |
| Rice | 4 months to 4 years | Not stated | Moderate and severe | Not stated. Excluded marasmic‐kwashiorkor | Egypt | Not stated | |
| Maltodextrin | 3 to 24 months | Not stated | Moderate | Not stated. Excluded severe malnutrition | Egypt | Not stated | |
| Rice | 3 to 35 months | Mixed pathogens | Mild and Moderate | Excluded severe malnutrition | Bangladesh | 1990 to 1991 | |
| Rice | 3 to 18 months | Not stated | "Presence", level not stated | Excluded severe malnutrition | Egypt | 1990 to 1992 | |
| Rice | 3 to 18 months | Mixed pathogens | Moderate | Excluded moderate to severe malnutrition | Chile | Not stated | |
| Rice | 3 to 24 months | Mixed pathogens | Moderate | Excluded moderate to severe malnutrition | Chile | Not stated | |
| Rice | 18 to 60 years | V. cholerae | Severe | Not stated | Bangladesh | 1995 | |
| Rice | < 6 months | Not stated | Mild and moderate | Included those with wt/age > 75% of 50th centile | Pakistan | 1990 | |
| Precooked rice | 1 to 6 months | Mixed pathogens | Mild and moderate | Excluded severe malnutrition | Mexico | Not stated | |
| Rice | 3 to 36 months | Not stated | "Presence", level not stated | Not stated | India | Not stated | |
| Rice | "adults" | Not stated | Moderate and severe | Not stated | Bangladesh | 1983 | |
| Rice | < 10 years | Not stated | Moderate and severe | Not stated | Bangladesh | 1983 | |
| Rice | < 5 years | V. cholerae | Moderate and severe | Not stated | Bangladesh | Not stated | |
| Rice, maize, sorghum, millet, wheat, potatoes | 1 to 5 years | Not stated | Moderate and severe | Not stated | Bangladesh | Not stated | |
| Rice, sorghum | 6 to 40 months | Not stated | Moderate and severe | Included normal and underweight children | Sudan | 1990 | |
| Rice | 3 months to 5 years | Not stated | Moderate and severe | Not stated | India | Not stated | |
| Rice flour, amylase resistant starch | 14 to 58 years | V. cholerae | Not stated | Not stated | India | 1994 to 1996 | |
| Rice | 6 to 36 months | Not stated | Mild and moderate | Excluded severe malnutrition, < 70% of reference standard | Madagascar | 1990 | |
| Maltodextrin | 3 to 36 months | Mixed pathogens | Mild and moderate | Excluded severe malnutrition | Philippines | Not stated | |
| Rice | 7 to 36 months | Non‐cholerae | Some (mild and moderate) | Included children > 80% as per Indian Academy of Pediatrics (IAP) classification | India | Not stated | |
| Rice | 5 to 15 years | Not stated | Moderate to severe | Not stated. Exclusion criteria: malnutrition < 65% weight for age | Bangladesh | 1997 | |
| Abbreviations: ORS: oral rehydration solution.NCHS: National Center for Health Statistics; IAP: Indian Academy of Pediatrics; wt/ht: weight for height. | |||||||
| Outcome or subgroup title | No. of studies | No. of participants | Statistical method | Effect size |
| 1 Total stool output during first 24 hours Show forest plot | 1 | 99 | Mean Difference (IV, Random, 95% CI) | ‐24.60 [‐40.69, ‐8.51] |
| 1.1 Rice‐based | 1 | 99 | Mean Difference (IV, Random, 95% CI) | ‐24.60 [‐40.69, ‐8.51] |
| 2 Duration of diarrhoea Show forest plot | 5 | 364 | Mean Difference (IV, Random, 95% CI) | ‐8.24 [‐13.17, ‐3.30] |
| 2.1 Rice‐based | 5 | 364 | Mean Difference (IV, Random, 95% CI) | ‐8.24 [‐13.17, ‐3.30] |
| 3 Unscheduled use of intravenous fluid Show forest plot | 3 | 376 | Risk Ratio (M‐H, Fixed, 95% CI) | 0.66 [0.43, 1.02] |
| 3.1 Rice‐based | 3 | 326 | Risk Ratio (M‐H, Fixed, 95% CI) | 0.62 [0.36, 1.08] |
| 3.2 Amylase‐resistant starch | 1 | 50 | Risk Ratio (M‐H, Fixed, 95% CI) | 0.75 [0.39, 1.46] |
| 4 Vomiting (number of participants) Show forest plot | 1 | 63 | Risk Ratio (M‐H, Fixed, 95% CI) | 0.56 [0.24, 1.34] |
| 4.1 Rice‐based | 1 | 63 | Risk Ratio (M‐H, Fixed, 95% CI) | 0.56 [0.24, 1.34] |
| 5 Hyponatraemia (number of participants) Show forest plot | 3 | 145 | Risk Ratio (M‐H, Fixed, 95% CI) | 0.88 [0.43, 1.82] |
| 5.1 Rice‐based | 2 | 95 | Risk Ratio (M‐H, Fixed, 95% CI) | 0.76 [0.34, 1.72] |
| 5.2 Amylase‐resistant starch | 1 | 50 | Risk Ratio (M‐H, Fixed, 95% CI) | 1.5 [0.27, 8.22] |
| Outcome or subgroup title | No. of studies | No. of participants | Statistical method | Effect size |
| 1 Total stool output during first 24 hours Show forest plot | 16 | 1483 | Mean Difference (IV, Random, 95% CI) | ‐65.47 [‐83.92, ‐47.03] |
| 1.1 Rice‐based | 12 | 1160 | Mean Difference (IV, Random, 95% CI) | ‐61.36 [‐80.61, ‐42.11] |
| 1.2 Wheat‐based | 2 | 129 | Mean Difference (IV, Random, 95% CI) | ‐119.85 [‐124.97, ‐114.73] |
| 1.3 Sorghum‐based | 1 | 77 | Mean Difference (IV, Random, 95% CI) | ‐128.0 [‐207.66, ‐48.34] |
| 1.4 Maltodextrin‐based | 1 | 117 | Mean Difference (IV, Random, 95% CI) | 27.40 [‐17.58, 72.38] |
| 2 Total stool output during the first 24 hours; rice‐based ORS subgrouped by age group Show forest plot | 12 | 1160 | Mean Difference (IV, Random, 95% CI) | ‐61.36 [‐80.61, ‐42.11] |
| 2.1 Paediatric | 10 | 914 | Mean Difference (IV, Random, 95% CI) | ‐59.19 [‐80.87, ‐37.51] |
| 2.2 Adults | 2 | 246 | Mean Difference (IV, Random, 95% CI) | ‐87.98 [‐184.72, 8.76] |
| 3 Total stool output during the first 24 hours; rice‐based ORS subgrouped by pathogen Show forest plot | 11 | 1092 | Mean Difference (IV, Random, 95% CI) | ‐46.03 [‐68.36, ‐23.70] |
| 3.1 Cholera | 3 | 304 | Mean Difference (IV, Random, 95% CI) | ‐110.49 [‐214.58, ‐6.40] |
| 3.2 Mixed pathogens | 8 | 728 | Mean Difference (IV, Random, 95% CI) | ‐21.88 [‐53.80, 10.04] |
| 3.3 Pathogen not reported | 1 | 60 | Mean Difference (IV, Random, 95% CI) | ‐81.80 [‐93.75, ‐69.85] |
| 4 Duration of diarrhoea Show forest plot | 16 | 1187 | Mean Difference (IV, Random, 95% CI) | ‐8.47 [‐12.86, ‐4.08] |
| 4.1 Rice‐based | 13 | 957 | Mean Difference (IV, Random, 95% CI) | ‐8.25 [‐13.19, ‐3.30] |
| 4.2 Wheat‐based | 1 | 48 | Mean Difference (IV, Random, 95% CI) | ‐10.0 [‐10.86, ‐9.14] |
| 4.3 Sorghum‐based | 1 | 66 | Mean Difference (IV, Random, 95% CI) | ‐16.4 [‐33.57, 0.77] |
| 4.4 Maltodextrin‐based | 1 | 116 | Mean Difference (IV, Random, 95% CI) | ‐4.60 [‐17.28, 8.08] |
| 5 Duration of diarrhoea; rice‐based ORS subgrouped by age group Show forest plot | 13 | 904 | Mean Difference (IV, Random, 95% CI) | ‐7.38 [‐12.34, ‐2.43] |
| 5.1 Paediatrics | 10 | 733 | Mean Difference (IV, Random, 95% CI) | ‐7.31 [‐12.84, ‐1.77] |
| 5.2 Adults | 3 | 171 | Mean Difference (IV, Random, 95% CI) | ‐5.77 [‐11.47, ‐0.07] |
| 6 Duration of diarrhoea; rice‐based ORS subgrouped by type of pathogen Show forest plot | 13 | 888 | Mean Difference (IV, Random, 95% CI) | ‐7.31 [‐12.47, ‐2.15] |
| 6.1 Cholera | 7 | 453 | Mean Difference (IV, Random, 95% CI) | ‐4.79 [‐7.99, ‐1.59] |
| 6.2 Mixed pathogens | 6 | 435 | Mean Difference (IV, Random, 95% CI) | ‐8.88 [‐14.97, ‐2.78] |
| 7 Unscheduled use of intravenous fluid Show forest plot | 19 | 1877 | Risk Ratio (M‐H, Fixed, 95% CI) | 0.75 [0.57, 0.98] |
| 7.1 Rice‐based | 16 | 1698 | Risk Ratio (M‐H, Fixed, 95% CI) | 0.79 [0.60, 1.03] |
| 7.2 Wheat‐based | 1 | 48 | Risk Ratio (M‐H, Fixed, 95% CI) | 1.0 [0.15, 6.53] |
| 7.3 Sorghum‐based | 0 | 0 | Risk Ratio (M‐H, Fixed, 95% CI) | 0.0 [0.0, 0.0] |
| 7.4 Maltodextrin‐based | 1 | 69 | Risk Ratio (M‐H, Fixed, 95% CI) | 0.27 [0.03, 2.32] |
| 7.5 Mung beans | 1 | 62 | Risk Ratio (M‐H, Fixed, 95% CI) | 0.16 [0.01, 3.01] |
| 8 Unscheduled use of intravenous fluid, subgrouped by type of pathogen Show forest plot | 19 | 1877 | Risk Ratio (M‐H, Fixed, 95% CI) | 0.75 [0.57, 0.98] |
| 8.1 Cholera | 7 | 535 | Risk Ratio (M‐H, Fixed, 95% CI) | 0.94 [0.66, 1.34] |
| 8.2 Mixed pathogens | 11 | 928 | Risk Ratio (M‐H, Fixed, 95% CI) | 0.63 [0.41, 0.96] |
| 8.3 Pathogen not reported | 1 | 414 | Risk Ratio (M‐H, Fixed, 95% CI) | 0.32 [0.07, 1.59] |
| 9 Vomiting (number of participants) Show forest plot | 10 | 584 | Risk Ratio (M‐H, Fixed, 95% CI) | 0.91 [0.72, 1.14] |
| 9.1 Rice‐based | 9 | 520 | Risk Ratio (M‐H, Fixed, 95% CI) | 0.87 [0.68, 1.12] |
| 9.2 Sorghum‐based | 1 | 64 | Risk Ratio (M‐H, Fixed, 95% CI) | 1.15 [0.59, 2.22] |
| 10 Hyponatraemia (number of participants) Show forest plot | 4 | 385 | Risk Ratio (M‐H, Fixed, 95% CI) | 1.82 [0.52, 6.44] |
| 10.1 Rice‐based | 3 | 335 | Risk Ratio (M‐H, Fixed, 95% CI) | 2.25 [0.34, 14.92] |
| 10.2 Maize‐based | 1 | 50 | Risk Ratio (M‐H, Fixed, 95% CI) | 1.5 [0.27, 8.22] |
| 11 Hypokalaemia (number of participants) Show forest plot | 2 | 260 | Risk Ratio (M‐H, Fixed, 95% CI) | 1.29 [0.74, 2.25] |
| 11.1 Rice‐based | 2 | 260 | Risk Ratio (M‐H, Fixed, 95% CI) | 1.29 [0.74, 2.25] |
| 12 Developed persistent diarrhoea (number of participants) Show forest plot | 2 | 885 | Risk Ratio (M‐H, Fixed, 95% CI) | 1.28 [0.68, 2.41] |
| 12.1 Rice‐based | 2 | 885 | Risk Ratio (M‐H, Fixed, 95% CI) | 1.28 [0.68, 2.41] |