Scolaris Content Display Scolaris Content Display

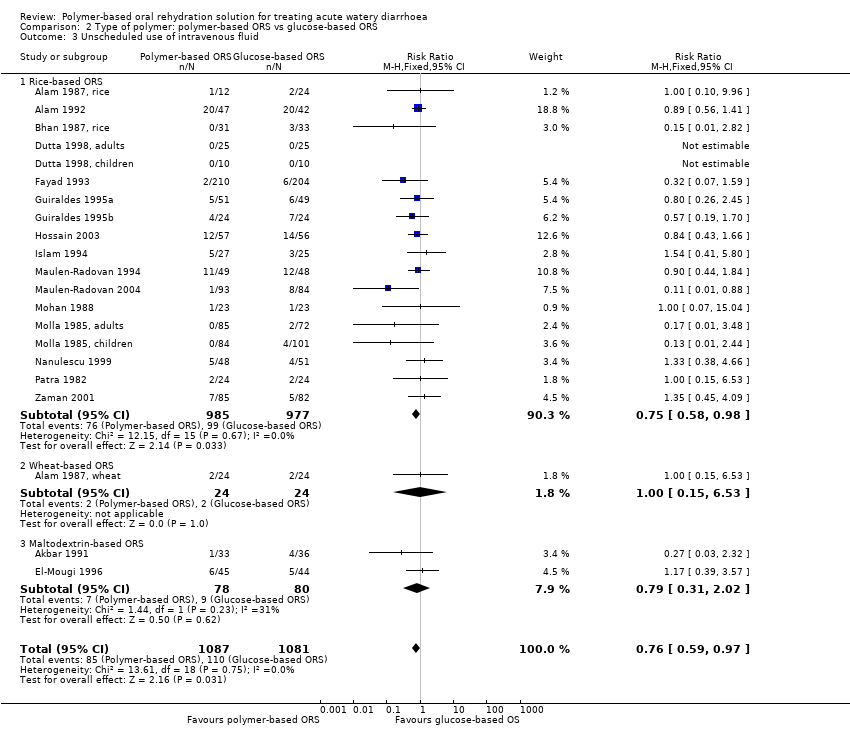
Any polymer‐based ORS vs glucose‐based ORS: unscheduled use of intravenous fluid.
Figuras y tablas -
Figure 1

Any polymer‐based ORS vs glucose‐based ORS: unscheduled use of intravenous fluid.

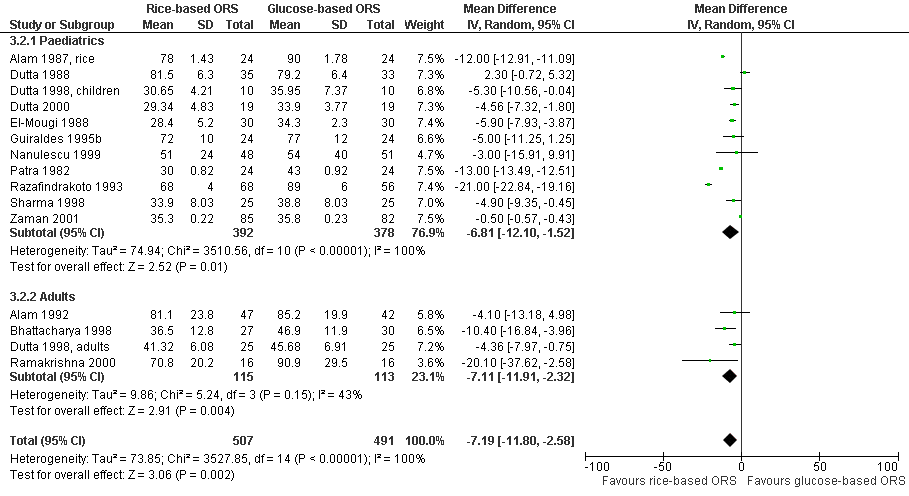
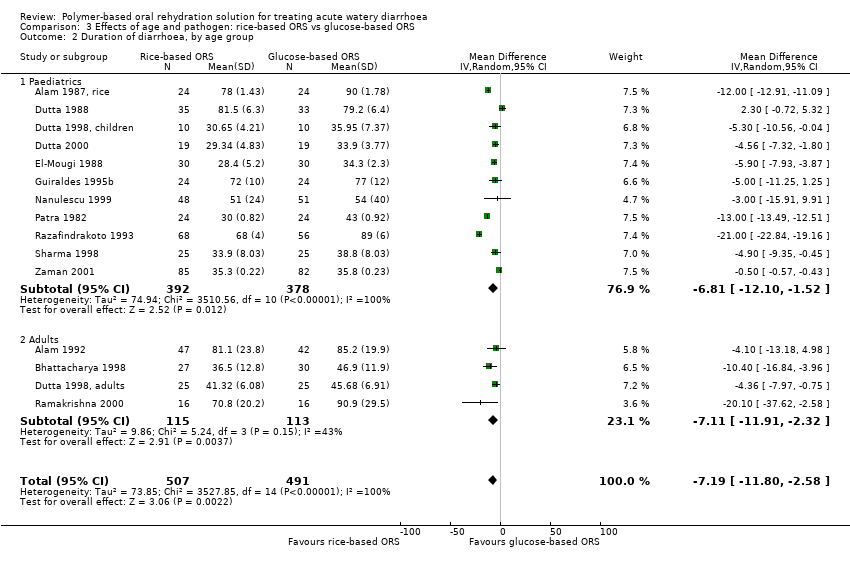
Rice‐based ORS vs glucose‐based ORS: duration of diarrhoea, by age group.
Figuras y tablas -
Figure 2

Rice‐based ORS vs glucose‐based ORS: duration of diarrhoea, by age group.

Funnel plot on the trials of polymer‐based ORS vs glucose‐based ORS, measuring the outcome of unscheduled use of intravenous fluid.
Figuras y tablas -
Figure 3

Funnel plot on the trials of polymer‐based ORS vs glucose‐based ORS, measuring the outcome of unscheduled use of intravenous fluid.

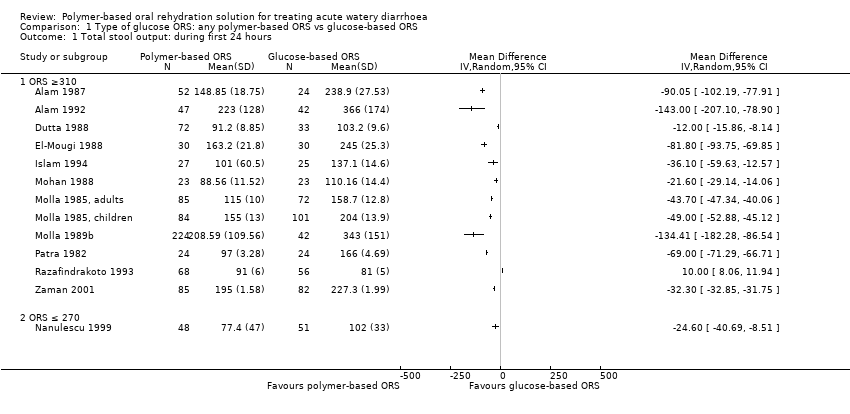
Comparison 1 Type of glucose ORS: any polymer‐based ORS vs glucose‐based ORS, Outcome 1 Total stool output: during first 24 hours.
Figuras y tablas -
Analysis 1.1

Comparison 1 Type of glucose ORS: any polymer‐based ORS vs glucose‐based ORS, Outcome 1 Total stool output: during first 24 hours.

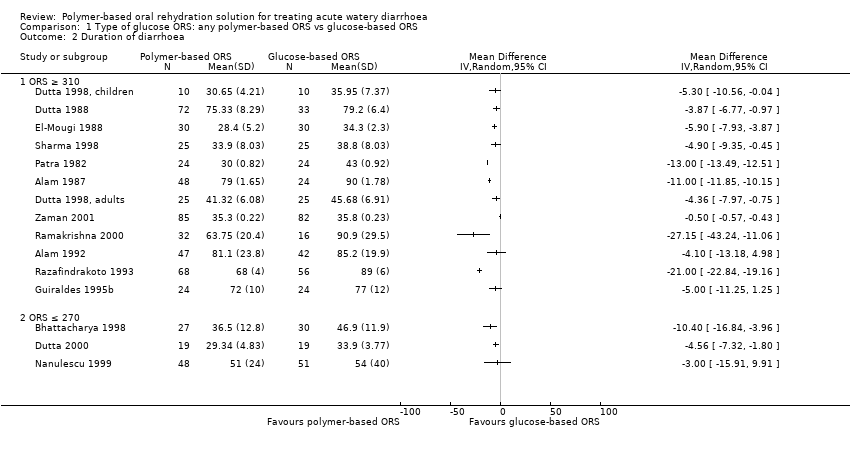
Comparison 1 Type of glucose ORS: any polymer‐based ORS vs glucose‐based ORS, Outcome 2 Duration of diarrhoea.
Figuras y tablas -
Analysis 1.2

Comparison 1 Type of glucose ORS: any polymer‐based ORS vs glucose‐based ORS, Outcome 2 Duration of diarrhoea.

Comparison 1 Type of glucose ORS: any polymer‐based ORS vs glucose‐based ORS, Outcome 3 Unscheduled use of intravenous fluid.
Figuras y tablas -
Analysis 1.3

Comparison 1 Type of glucose ORS: any polymer‐based ORS vs glucose‐based ORS, Outcome 3 Unscheduled use of intravenous fluid.

Comparison 1 Type of glucose ORS: any polymer‐based ORS vs glucose‐based ORS, Outcome 4 Vomiting (no. participants).
Figuras y tablas -
Analysis 1.4

Comparison 1 Type of glucose ORS: any polymer‐based ORS vs glucose‐based ORS, Outcome 4 Vomiting (no. participants).

Comparison 1 Type of glucose ORS: any polymer‐based ORS vs glucose‐based ORS, Outcome 5 Hyponatraemia (no. participants).
Figuras y tablas -
Analysis 1.5

Comparison 1 Type of glucose ORS: any polymer‐based ORS vs glucose‐based ORS, Outcome 5 Hyponatraemia (no. participants).

Comparison 1 Type of glucose ORS: any polymer‐based ORS vs glucose‐based ORS, Outcome 6 Hypokalaemia (no. participants).
Figuras y tablas -
Analysis 1.6

Comparison 1 Type of glucose ORS: any polymer‐based ORS vs glucose‐based ORS, Outcome 6 Hypokalaemia (no. participants).

Comparison 1 Type of glucose ORS: any polymer‐based ORS vs glucose‐based ORS, Outcome 7 Developed persistent diarrhoea (no. participants).
Figuras y tablas -
Analysis 1.7

Comparison 1 Type of glucose ORS: any polymer‐based ORS vs glucose‐based ORS, Outcome 7 Developed persistent diarrhoea (no. participants).

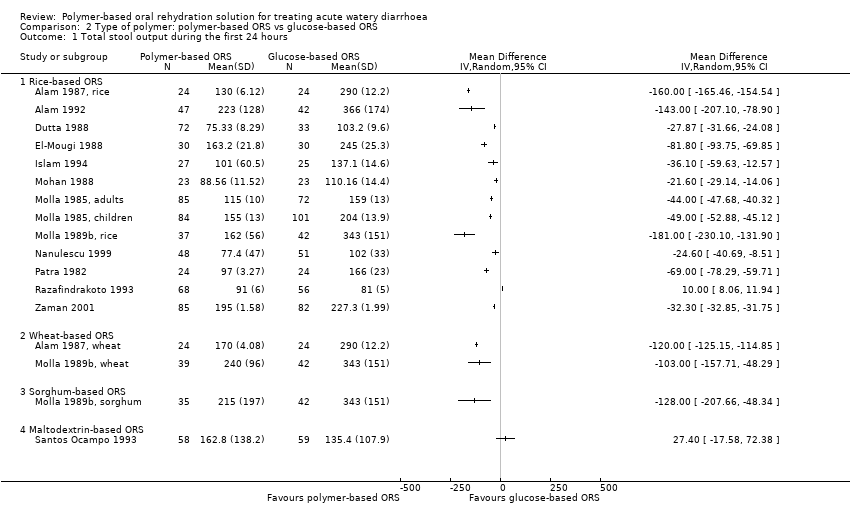
Comparison 2 Type of polymer: polymer‐based ORS vs glucose‐based ORS, Outcome 1 Total stool output during the first 24 hours.
Figuras y tablas -
Analysis 2.1

Comparison 2 Type of polymer: polymer‐based ORS vs glucose‐based ORS, Outcome 1 Total stool output during the first 24 hours.

Comparison 2 Type of polymer: polymer‐based ORS vs glucose‐based ORS, Outcome 2 Duration of diarrhoea.
Figuras y tablas -
Analysis 2.2

Comparison 2 Type of polymer: polymer‐based ORS vs glucose‐based ORS, Outcome 2 Duration of diarrhoea.

Comparison 2 Type of polymer: polymer‐based ORS vs glucose‐based ORS, Outcome 3 Unscheduled use of intravenous fluid.
Figuras y tablas -
Analysis 2.3

Comparison 2 Type of polymer: polymer‐based ORS vs glucose‐based ORS, Outcome 3 Unscheduled use of intravenous fluid.

Comparison 3 Effects of age and pathogen: rice‐based ORS vs glucose‐based ORS, Outcome 1 Total stool output during the first 24 hours, by age group.
Figuras y tablas -
Analysis 3.1

Comparison 3 Effects of age and pathogen: rice‐based ORS vs glucose‐based ORS, Outcome 1 Total stool output during the first 24 hours, by age group.

Comparison 3 Effects of age and pathogen: rice‐based ORS vs glucose‐based ORS, Outcome 2 Duration of diarrhoea, by age group.
Figuras y tablas -
Analysis 3.2

Comparison 3 Effects of age and pathogen: rice‐based ORS vs glucose‐based ORS, Outcome 2 Duration of diarrhoea, by age group.

Comparison 3 Effects of age and pathogen: rice‐based ORS vs glucose‐based ORS, Outcome 3 Total stool output during the first 24 hours, by pathogen.
Figuras y tablas -
Analysis 3.3

Comparison 3 Effects of age and pathogen: rice‐based ORS vs glucose‐based ORS, Outcome 3 Total stool output during the first 24 hours, by pathogen.

Comparison 3 Effects of age and pathogen: rice‐based ORS vs glucose‐based ORS, Outcome 4 Duration of diarrhoea, by type of pathogen.
Figuras y tablas -
Analysis 3.4

Comparison 3 Effects of age and pathogen: rice‐based ORS vs glucose‐based ORS, Outcome 4 Duration of diarrhoea, by type of pathogen.

Comparison 1. Type of glucose ORS: any polymer‐based ORS vs glucose‐based ORS

Outcome or subgroup title

No. of studies

No. of participants

Statistical method

Effect size

1 Total stool output: during first 24 hours Show forest plot

13

Mean Difference (IV, Random, 95% CI)

Totals not selected

1.1 ORS ≥310

12

Mean Difference (IV, Random, 95% CI)

0.0 [0.0, 0.0]

1.2 ORS ≤ 270

1

Mean Difference (IV, Random, 95% CI)

0.0 [0.0, 0.0]

2 Duration of diarrhoea Show forest plot

15

Mean Difference (IV, Random, 95% CI)

Totals not selected

2.1 ORS ≥ 310

12

Mean Difference (IV, Random, 95% CI)

0.0 [0.0, 0.0]

2.2 ORS ≤ 270

3

Mean Difference (IV, Random, 95% CI)

0.0 [0.0, 0.0]

3 Unscheduled use of intravenous fluid Show forest plot

21

2235

Risk Ratio (M‐H, Fixed, 95% CI)

0.75 [0.59, 0.95]

3.1 ORS ≥ 310

18

1909

Risk Ratio (M‐H, Fixed, 95% CI)

0.78 [0.60, 1.01]

3.2 ORS ≤ 270

3

326

Risk Ratio (M‐H, Fixed, 95% CI)

0.62 [0.36, 1.08]

4 Vomiting (no. participants) Show forest plot

10

617

Risk Ratio (M‐H, Fixed, 95% CI)

0.83 [0.65, 1.05]

4.1 ORS ≥ 310

9

554

Risk Ratio (M‐H, Fixed, 95% CI)

0.87 [0.68, 1.11]

4.2 ORS ≤ 270

1

63

Risk Ratio (M‐H, Fixed, 95% CI)

0.56 [0.24, 1.34]

5 Hyponatraemia (no. participants) Show forest plot

6

480

Risk Ratio (M‐H, Fixed, 95% CI)

1.03 [0.52, 2.01]

5.1 ORS ≥ 310

3

335

Risk Ratio (M‐H, Fixed, 95% CI)

2.25 [0.34, 14.92]

5.2 ORS ≤ 270

3

145

Risk Ratio (M‐H, Fixed, 95% CI)

0.88 [0.43, 1.82]

6 Hypokalaemia (no. participants) Show forest plot

2

Risk Ratio (M‐H, Fixed, 95% CI)

Subtotals only

6.1 ORS ≥ 310

2

260

Risk Ratio (M‐H, Fixed, 95% CI)

1.29 [0.74, 2.25]

7 Developed persistent diarrhoea (no. participants) Show forest plot

2

Risk Ratio (M‐H, Fixed, 95% CI)

Subtotals only

7.1 ORS ≥ 310

2

885

Risk Ratio (M‐H, Fixed, 95% CI)

1.28 [0.68, 2.41]

Figuras y tablas -
Comparison 1. Type of glucose ORS: any polymer‐based ORS vs glucose‐based ORS
Comparison 2. Type of polymer: polymer‐based ORS vs glucose‐based ORS

Outcome or subgroup title

No. of studies

No. of participants

Statistical method

Effect size

1 Total stool output during the first 24 hours Show forest plot

17

Mean Difference (IV, Random, 95% CI)

Totals not selected

1.1 Rice‐based ORS

13

Mean Difference (IV, Random, 95% CI)

0.0 [0.0, 0.0]

1.2 Wheat‐based ORS

2

Mean Difference (IV, Random, 95% CI)

0.0 [0.0, 0.0]

1.3 Sorghum‐based ORS

1

Mean Difference (IV, Random, 95% CI)

0.0 [0.0, 0.0]

1.4 Maltodextrin‐based ORS

1

Mean Difference (IV, Random, 95% CI)

0.0 [0.0, 0.0]

2 Duration of diarrhoea Show forest plot

18

Mean Difference (IV, Random, 95% CI)

Totals not selected

2.1 Rice‐based ORS

15

Mean Difference (IV, Random, 95% CI)

0.0 [0.0, 0.0]

2.2 Wheat‐based ORS

1

Mean Difference (IV, Random, 95% CI)

0.0 [0.0, 0.0]

2.3 Sorghum‐based ORS

1

Mean Difference (IV, Random, 95% CI)

0.0 [0.0, 0.0]

2.4 Maltodextrin‐based ORS

1

Mean Difference (IV, Random, 95% CI)

0.0 [0.0, 0.0]

3 Unscheduled use of intravenous fluid Show forest plot

21

2168

Risk Ratio (M‐H, Fixed, 95% CI)

0.76 [0.59, 0.97]

3.1 Rice‐based ORS

18

1962

Risk Ratio (M‐H, Fixed, 95% CI)

0.75 [0.58, 0.98]

3.2 Wheat‐based ORS

1

48

Risk Ratio (M‐H, Fixed, 95% CI)

1.0 [0.15, 6.53]

3.3 Maltodextrin‐based ORS

2

158

Risk Ratio (M‐H, Fixed, 95% CI)

0.79 [0.31, 2.02]

Figuras y tablas -
Comparison 2. Type of polymer: polymer‐based ORS vs glucose‐based ORS
Comparison 3. Effects of age and pathogen: rice‐based ORS vs glucose‐based ORS

Outcome or subgroup title

No. of studies

No. of participants

Statistical method

Effect size

1 Total stool output during the first 24 hours, by age group Show forest plot

13

Mean Difference (IV, Random, 95% CI)

Totals not selected

1.1 Paediatric

11

Mean Difference (IV, Random, 95% CI)

0.0 [0.0, 0.0]

1.2 Adults

2

Mean Difference (IV, Random, 95% CI)

0.0 [0.0, 0.0]

2 Duration of diarrhoea, by age group Show forest plot

15

998

Mean Difference (IV, Random, 95% CI)

‐7.19 [‐11.80, ‐2.58]

2.1 Paediatrics

11

770

Mean Difference (IV, Random, 95% CI)

‐6.81 [‐12.10, ‐1.52]

2.2 Adults

4

228

Mean Difference (IV, Random, 95% CI)

‐7.11 [‐11.91, ‐2.32]

3 Total stool output during the first 24 hours, by pathogen Show forest plot

11

Mean Difference (IV, Random, 95% CI)

Totals not selected

3.1 Cholera

3

Mean Difference (IV, Random, 95% CI)

0.0 [0.0, 0.0]

3.2 Non‐cholera

4

Mean Difference (IV, Random, 95% CI)

0.0 [0.0, 0.0]

3.3 Mixed pathogens

5

Mean Difference (IV, Random, 95% CI)

0.0 [0.0, 0.0]

4 Duration of diarrhoea, by type of pathogen Show forest plot

12

Mean Difference (IV, Random, 95% CI)

Totals not selected

4.1 Cholera

7

Mean Difference (IV, Random, 95% CI)

0.0 [0.0, 0.0]

4.2 Non‐cholera

3

Mean Difference (IV, Random, 95% CI)

0.0 [0.0, 0.0]

4.3 Mixed pathogens

2

Mean Difference (IV, Random, 95% CI)

0.0 [0.0, 0.0]

Figuras y tablas -
Comparison 3. Effects of age and pathogen: rice‐based ORS vs glucose‐based ORS