Profilaxis con inmunoglobulinas para las neoplasias hematológicas y el trasplante de células madre hematopoyéticas
Referencias
Referencias de los estudios incluidos en esta revisión
Referencias de los estudios excluidos de esta revisión
Referencias adicionales
Characteristics of studies
Characteristics of included studies [ordered by study ID]
Ir a:
| Study characteristics | ||
| Methods | Randomization generation: not specified; | |
| Participants | 350 patients with acute leukemia or CML who had allogeneic stem cell transplantation from sibling donors; | |
| Interventions | IV polyvalent Immunoglobulin in 2 doses. The trial included 2 arms: (50 mg/kg; 250 mg/kg; 500 mg/kg ) Schedule: weekly from day ‐8 to day +111 posttransplant (18 doses) | |
| Outcomes | All cause mortality; CDI; CMV infections; relapse; | |
| Notes | ||
| Risk of bias | ||
| Bias | Authors' judgement | Support for judgement |
| Allocation concealment? | Unclear risk | B ‐ Unclear |
| Study characteristics | ||
| Methods | Randomization generation: computer generated; | |
| Participants | 179 patients who had myeloablative allogeneic stem cell transplantation from sibling donors and unrelated donors; | |
| Interventions | IV anti CMV specific monoclonal ab (MSL‐109) in 2 doses. The trial included 2 arms: 60 mg/kg and 15 mg/kg. | |
| Outcomes | All cause mortality; MDI; bacterial infections; fungal infections; bacteremia; CMV disease; hospitalization; IRM; acute GVHD; engraftment; relapse; adverse events | |
| Notes | ||
| Risk of bias | ||
| Bias | Authors' judgement | Support for judgement |
| Allocation concealment? | Low risk | A ‐ Adequate |
| Study characteristics | ||
| Methods | Randomization generation: random numbers; | |
| Participants | 60 patients who had myeloablative allogeneic and autologous bone marrow transplantation; | |
| Interventions | IV anti CMV IgG (Nancy) enriched plasma 4 ml/kg | |
| Outcomes | All cause mortality; CMV infection; IRM; IP; engraftment | |
| Notes | ||
| Risk of bias | ||
| Bias | Authors' judgement | Support for judgement |
| Allocation concealment? | Low risk | A ‐ Adequate |
| Study characteristics | ||
| Methods | Randomization generation: not specified; | |
| Participants | 42 patients with CLL; Multi‐center ‐ 20 centers in UK, Europe; | |
| Interventions | IV polyvalent Immunoglobulin (Sandoglobulin) vs placebo. The trial included 2 arms: IVIG 18 and placebo | |
| Outcomes | All cause mortality; CDI; MDI; bacterial infections; viral infections; bacteremia; immunoglobulin levels; adverse effects | |
| Notes | ||
| Risk of bias | ||
| Bias | Authors' judgement | Support for judgement |
| Allocation concealment? | Low risk | A ‐ Adequate |
| Study characteristics | ||
| Methods | Randomization generation: protocol registrar using a table of random permutations; | |
| Participants | 99 patients who had myeloablative allogeneic bone marrow transplantation, all recipients CMV negative; | |
| Interventions | CMV immune globulin vs. control. The trial included 4 arms: CMV immune globulin (150 mg/kg) + seronegative blood products vs. seronegative blood products alone vs. CMV immune globulin alone (150 mg/kg) vs. control; Schedule: days ‐5, ‐1 , +6,+20, +34 ‐ dose of 150 mg/kg; days +48; +62 ‐ dose of 100 mg/kg posttransplant | |
| Outcomes | All cause mortality; CMV infection; CMV disease; | |
| Notes | ||
| Risk of bias | ||
| Bias | Authors' judgement | Support for judgement |
| Allocation concealment? | Low risk | A ‐ Adequate |
| Study characteristics | ||
| Methods | Randomization generation: adequate‐protocol registrar using assignment from a table of random permutations; | |
| Participants | 123 patients who had myeloablative allogeneic bone marrow transplantation for ALL, AML, CML, aplastic anemia, lymphoma and other; Single center: USA; Setting: hospitalization in isolation precautions and then outpatients | |
| Interventions | CMV IVIG vs placebo. The trial included 2 arms: CMV IVIG (Cutter Biological) 200 mg/kg vs. placebo; Schedule: days ‐8; ‐6 pretransplant; +1; +7; +14; +21; +28; +42; +56; +70 posttransplant (10 doses) | |
| Outcomes | All cause mortality; CMV infection; CMV disease; hospitalization; IRM; acute GVHD; IP | |
| Notes | ||
| Risk of bias | ||
| Bias | Authors' judgement | Support for judgement |
| Allocation concealment? | Unclear risk | B ‐ Unclear |
| Study characteristics | ||
| Methods | Randomization generation: randomization table for each study site; | |
| Participants | 83 multiple myeloma plateau phase patients; | |
| Interventions | IVIG polyvalent Immunoglobulin (Gammagard) vs placebo. The trial included 2 arms: IVIG 0.4 g/kg vs. placebo | |
| Outcomes | All cause mortality; CDI; MDI; bacterial infections; bacteremia; | |
| Notes | ||
| Risk of bias | ||
| Bias | Authors' judgement | Support for judgement |
| Allocation concealment? | Low risk | A ‐ Adequate |
| Study characteristics | ||
| Methods | Randomization generation: table of random numbers; | |
| Participants | 34 B‐CLL patients; | |
| Interventions | IVIG polyvalent Immunoglobulin (Gammagard) in 2 doses. The trial included 2 arms: (250 mg/kg; 500 mg/kg ) Schedule: every 4 weeks for 1 year | |
| Outcomes | All cause mortality; CDI; MDI; bacterial infections; fungal infections; viral infection; immunoglobulin levels; adverse events | |
| Notes | ||
| Risk of bias | ||
| Bias | Authors' judgement | Support for judgement |
| Allocation concealment? | Low risk | A ‐ Adequate |
| Study characteristics | ||
| Methods | Randomization generation: not specified; | |
| Participants | 55 patients who had myeloablative allogeneic myeloablative bone marrow transplantation for acute leukemia (AML + ALL) ; | |
| Interventions | Hyperimmune CMV IVIG vs. | |
| Outcomes | All cause mortality; CMV infection; CMV disease; acute GVHD; IP | |
| Notes | ||
| Risk of bias | ||
| Bias | Authors' judgement | Support for judgement |
| Allocation concealment? | Unclear risk | B ‐ Unclear |
| Study characteristics | ||
| Methods | Randomization generation: table of random numbers; | |
| Participants | 84 CLL patients; | |
| Interventions | IVIG polyvalent Immunoglobulin (Gammagard) vs placebo. The trial included 2 arms: IVIG 0.4 g/kg vs. placebo; | |
| Outcomes | All cause mortality; CDI; MDI; bacterial infections; IRM; adverse events bacteremia; | |
| Notes | ||
| Risk of bias | ||
| Bias | Authors' judgement | Support for judgement |
| Allocation concealment? | Low risk | A ‐ Adequate |
| Study characteristics | ||
| Methods | Randomization generation: computer generated; | |
| Participants | 200 patients who had myeloablative allogeneic stem cell transplantation from HLA identical sibling donors; | |
| Interventions | IV polyvalent Immunoglobulin vs placebo. The trial included 4 arms: IVIG in 3 different doses (50 mg/kg; 250 mg/kg; 500 mg/kg ) and placebo | |
| Outcomes | All cause mortality; CDI; MDI; bacterial infections; fungal infections; viral infections; CMV infections; CMV disease; | |
| Notes | ||
| Risk of bias | ||
| Bias | Authors' judgement | Support for judgement |
| Allocation concealment? | Low risk | A ‐ Adequate |
| Study characteristics | ||
| Methods | Randomization generation: not specified; | |
| Participants | 92 patients who had myeloablative allogeneic bone marrow transplantation | |
| Interventions | IV polyvalent Immunoglobulin (Gammagard) vs control. The trial included 2 arms: IVIG 500 mg/kg then 250 mg/kg and control; Schedule: 500 mg/kg every 2 weeks from day ‐7 to day +100 then 250 mg/kg from day +100 to day +180 | |
| Outcomes | All cause mortality; MDI; bacterial infections; CMV infections; CMV disease; IP; engraftment | |
| Notes | ||
| Risk of bias | ||
| Bias | Authors' judgement | Support for judgement |
| Allocation concealment? | Unclear risk | B ‐ Unclear |
| Study characteristics | ||
| Methods | Randomization generation: not specified; | |
| Participants | 260 patients who had myeloablative allogeneic bone marrow transplantation from HLA identical sibling donors; | |
| Interventions | IV polyvalent Immunoglobulin (Gamimmune) vs control. The trial included 2 arms: IVIG 500 mg/kg and control; Schedule: daily from days ‐6 to ‐1 then every 3rd day posttransplant from day +3 to day +90 | |
| Outcomes | All cause mortality; CDI; MDI; bacterial infections; fungal infections; viral infections; CMV infections; hospitalization; acute GVHD; engraftment; immunoglobulin levels; adverse events | |
| Notes | ||
| Risk of bias | ||
| Bias | Authors' judgement | Support for judgement |
| Allocation concealment? | Unclear risk | B ‐ Unclear |
| Study characteristics | ||
| Methods | Randomization generation: not specified; | |
| Participants | 42 patients who had autoBMT and alloBMT for acute leukemia, CML, other malignancy or non‐malignant disease; Single center, USA; | |
| Interventions | IVIG polyvalent immunoglobulin products at a dose of 500 mg/kg. The trial included 4 arms: Gamimmune, Gammagard, Sandoglobulin, immune Globulin Intravenous; Schedule: every other week for 3 doses (week ‐1 to week +3); | |
| Outcomes | CMV infections; immunoglobulin levels | |
| Notes | ||
| Risk of bias | ||
| Bias | Authors' judgement | Support for judgement |
| Allocation concealment? | Low risk | A ‐ Adequate |
| Study characteristics | ||
| Methods | Randomization generation: not specific; | |
| Participants | Unknown number of patients with multiple myeloma and low risk non‐Hodgkin lymphoma; single center, Europe, Germany; Setting: outpatients | |
| Interventions | IV polyvalent Immunoglobulin vs placebo. The trial included 2 arms: IVIG (IVIG 0.5 ‐0.7 g/kg) and placebo | |
| Outcomes | Descriptive results on outcomes and not the exact numbers of patients who developed infections in each arm | |
| Notes | ||
| Risk of bias | ||
| Bias | Authors' judgement | Support for judgement |
| Allocation concealment? | Unclear risk | B ‐ Unclear |
| Study characteristics | ||
| Methods | Randomization generation: not specified; | |
| Participants | 150 patients who had alloBMT from HLA matched and mismatched donors; | |
| Interventions | IV polyvalent Immunoglobulin in 2 doses. The trial included 2 arms: 2 different doses (250 mg/kg; 500 mg/kg); | |
| Outcomes | Authors reported on the total number of deaths in the study but not separately on the numbers in the 2 arms | |
| Notes | ||
| Risk of bias | ||
| Bias | Authors' judgement | Support for judgement |
| Allocation concealment? | Unclear risk | B ‐ Unclear |
| Study characteristics | ||
| Methods | Randomization generation: table of random numbers; | |
| Participants | 39 patients with multiple myeloma patients; single center, UK, Europe; Setting: outpatients | |
| Interventions | IVIG polyvalent immunoglobulin (Gammagard) vs. placebo. The trial included 2 arms: IVIG and placebo | |
| Outcomes | Authors reported on the total rate of infections in both the treatment and the placebo arms | |
| Notes | ||
| Risk of bias | ||
| Bias | Authors' judgement | Support for judgement |
| Allocation concealment? | Low risk | A ‐ Adequate |
| Study characteristics | ||
| Methods | Randomization generation: not specified; Allocation concealment: unclear; Blinding: none; Excluded: none | |
| Participants | 49 patients who had myeloablative allogeneic bone marrow transplantation for ALL, AML, AUL, CML, lymphoma, SAA; | |
| Interventions | Hyperimmune CMV IVIG vs. control IG. The trial included 2 arms: Hyperimmune CMV IVIG 0.1 G protein/kg vs. control IG 0.1 G protein/kg; Schedule: day ‐7; day +13; day +33; day +53 ; day +79; day + 93 | |
| Outcomes | All cause mortality; CMV disease; IRM; acute GVHD; IP | |
| Notes | ||
| Risk of bias | ||
| Bias | Authors' judgement | Support for judgement |
| Allocation concealment? | Unclear risk | B ‐ Unclear |
| Study characteristics | ||
| Methods | Randomization generation: not specified; Allocation concealment: unclear; | |
| Participants | 54 patients who had myeloablative allogeneic bone marrow transplantation; | |
| Interventions | IVIG polyvalent immunoglobulin vs. control. The trial included 2 arms: IVIG 400 mg/kg vs. control;Schedule: 10 weekly infusions from day +14 to day +79 | |
| Outcomes | All cause mortality; IRM; acute GVHD; chronic GVHD | |
| Notes | ||
| Risk of bias | ||
| Bias | Authors' judgement | Support for judgement |
| Allocation concealment? | Unclear risk | B ‐ Unclear |
| Study characteristics | ||
| Methods | Randomization generation: not specified; Allocation concealment: unclear; | |
| Participants | 68 patients with myeloablative allogeneitic BMT for acute leukemia and CML; Sincle‐center USA; Setting: hospitalization in isolation precautions and then outpatients | |
| Interventions | IM anti‐CMV hyperimmune globulin vs. control. The trial included 2 arms: anti‐CMV hyperimmune globulin and control; Schedule: on days ‐4 and ‐2 before BMT, then weekly to day +77 posttransplant | |
| Outcomes | CMV infections; IRM; immunoglobulin levels | |
| Notes | ||
| Risk of bias | ||
| Bias | Authors' judgement | Support for judgement |
| Allocation concealment? | Unclear risk | B ‐ Unclear |
| Study characteristics | ||
| Methods | Randomization generation:not specified; Allocation concealment: unclear; Blinding: none; Excluded: none | |
| Participants | 42 CLL patients; | |
| Interventions | IV polyvalent Immunoglobulin (Vena‐N) vs. control. The trial included 4 arms: Patients were randomly allocated to receive an | |
| Outcomes | All cause mortality; CDI; MDI; IRM | |
| Notes | ||
| Risk of bias | ||
| Bias | Authors' judgement | Support for judgement |
| Allocation concealment? | Unclear risk | B ‐ Unclear |
| Study characteristics | ||
| Methods | Randomization generation:not specified; Allocation concealment: unclear; blinding: none; Excluded: none | |
| Participants | 25 Multiple myeloma patients | |
| Interventions | IV polyvalent Immunoglobulin (Vena‐N) vs. control. The trial included 8 arms: IVIG then no therapy then IVIG; IVIG then no therapy then no therapy; IVIG then IVIG then IVIG; IVIG then IVIG then no therapy; No therapy then no therapy then IVIG; | |
| Outcomes | All cause mortality; CDI; IRM | |
| Notes | ||
| Risk of bias | ||
| Bias | Authors' judgement | Support for judgement |
| Allocation concealment? | Unclear risk | B ‐ Unclear |
| Study characteristics | ||
| Methods | Randomization generation:not specified; | |
| Participants | 53 CMV ‐ seronegative patients who had undergone AutoBMT and AlloBMT for acute leukemia, CML, other malignancy or non‐malignant disease; | |
| Interventions | IVIG polyvalent immunoglobulin products at a dose of 500 mg/kg. The trial included 3 arms: Gammagard, Sandoglobulin, Gamimmune; Schedule: weekly starting the week before BMT, total 6 doses | |
| Outcomes | No relevant outcomes (immunoglobulin levels) | |
| Notes | ||
| Risk of bias | ||
| Bias | Authors' judgement | Support for judgement |
| Allocation concealment? | Unclear risk | B ‐ Unclear |
| Study characteristics | ||
| Methods | Randomization generation: not specified; Allocation concealment: unclear; | |
| Participants | 72 patients who had autologous or allogeneic bone marrow transplantation; | |
| Interventions | IgM and IgA enriched IVIG Immunoglobulin vs control. The trial included 2 arms: IgM and IgA enriched IVIG and control; | |
| Outcomes | All cause mortality; CDI; MDI; bacterial infections; fungal infections; bacteremia; CMV disease; hospitalization; antibiotics; IRM; VOD; engraftment; relapse; immunoglobulin levels; | |
| Notes | ||
| Risk of bias | ||
| Bias | Authors' judgement | Support for judgement |
| Allocation concealment? | Unclear risk | B ‐ Unclear |
| Study characteristics | ||
| Methods | Randomization generation:not specified; | |
| Participants | 89 patients who had allogenetic alternative donor bone marrow transplantation Single center ‐ Italy, Europe; Setting: hospitalization in isolation precautions and then outpatients | |
| Interventions | IVIG polyvalent immunoglobulin (Pentaglobulin) in 2 doses. The trial included 2 arms: IVIG 200 mg/kg and 400 mg/kg; Schedule: every 2 weeks from day ‐7 to day +100 | |
| Outcomes | All cause mortality; IRM; GVHD; relapse | |
| Notes | ||
| Risk of bias | ||
| Bias | Authors' judgement | Support for judgement |
| Allocation concealment? | Unclear risk | B ‐ Unclear |
| Study characteristics | ||
| Methods | Randomization generation: not specified; | |
| Participants | 54 patients who had allogenetic myeloablative bone marrow transplantation; Multi center; 5 centers Scandinavia Europe; Setting: hospitalization in isolation precautions and then outpatients | |
| Interventions | CMV hyperimmune plasma vs control. The trial included 2 arms: CMV hyperimmune plasma 30 ml/kg and control; Schedule: 4 times 2 days period (each period total 30 ml/kg): days 3 & 4; days 25 & 26; days 50 & 51; days 75 & 76 | |
| Outcomes | All cause mortality; CMV infection; CMV disease; IRM; acute GVHD; chronic GVHD; IP; immunoglobulin levels; adverse events | |
| Notes | ||
| Risk of bias | ||
| Bias | Authors' judgement | Support for judgement |
| Allocation concealment? | Unclear risk | B ‐ Unclear |
| Study characteristics | ||
| Methods | Randomization generation: not specified; | |
| Participants | 28 patients who had myeloablative allogeneic bone marrow transplantation from HLA identical sibling or unrelated donors; | |
| Interventions | Anti‐CMV hyperimmune globulin | |
| Outcomes | All cause mortality; CMV infections; CMV disease; acute GVHD; chronic GVHD; IP | |
| Notes | ||
| Risk of bias | ||
| Bias | Authors' judgement | Support for judgement |
| Allocation concealment? | Unclear risk | B ‐ Unclear |
| Study characteristics | ||
| Methods | Randomization generation: adequate‐randomized card selection; | |
| Participants | 48 patients with active multiple myeloma; multi‐center‐ 5 centers; USA (ECOG); Setting: outpatients | |
| Interventions | Cohn fraction II gamma globulin IM vs placebo. The trial included 2 arms: 20 ml of Cohn fraction II gamma globulin 16.5% and 10 ml of Human serum albumin 5% | |
| Outcomes | All cause mortality; CDI; bacterial infections; IRM; adverse events | |
| Notes | ||
| Risk of bias | ||
| Bias | Authors' judgement | Support for judgement |
| Allocation concealment? | Unclear risk | B ‐ Unclear |
| Study characteristics | ||
| Methods | Randomization generation: not specified; | |
| Participants | 92 patients who had myeloablative allogeneic bone marrow transplantation from HLA identical sibling donors; single center, Spain, Europe; | |
| Interventions | Hyperimmune CMV IVIG vs control. The trial included 2 arms: Hyperimmune CMV IVIG at a dose of 150 mg/kg and control. | |
| Outcomes | All cause mortality; CDI; bacterial infections; fungal infections; bacteremia; CMV infection; CMV disease; IRM; acute GVHD; chronic GVHD; IP; engraftment; relapse; immunoglobulin levels | |
| Notes | ||
| Risk of bias | ||
| Bias | Authors' judgement | Support for judgement |
| Allocation concealment? | Unclear risk | B ‐ Unclear |
| Study characteristics | ||
| Methods | Randomization generation: not specified; | |
| Participants | 62 CLL and multiple myeloma patients; | |
| Interventions | IV polyvalent Immunoglobulin in 3 doses. The trial included 3 arms: (100 mg/kg; 400 mg/kg; 800 mg/kg ) Schedule: every 3 weeks total 6 doses (week 0, 3, 6, 9, 12, 15) | |
| Outcomes | All cause mortality; immunoglobulin levels; adverse events | |
| Notes | ||
| Risk of bias | ||
| Bias | Authors' judgement | Support for judgement |
| Allocation concealment? | Unclear risk | B ‐ Unclear |
| Study characteristics | ||
| Methods | Randomization generation: not specified; | |
| Participants | 383 patients who had myeloablative allogeneic BMT or autologous BMT or syngeneic BMT for SAA or acute leukemia or CML or lymphoma; | |
| Interventions | IV polyvalent Immunoglobulin (Gamimune N) vs control. The trial included 2 arms: IVIG 500 mg/kg and control; | |
| Outcomes | All cause mortality; CDI; MDI; bacterial infections; fungal infections; viral infections; bacteremia; acute GVHD; IP; relapse; immunoglobulin levels; adverse events | |
| Notes | ||
| Risk of bias | ||
| Bias | Authors' judgement | Support for judgement |
| Allocation concealment? | Unclear risk | B ‐ Unclear |
| Study characteristics | ||
| Methods | Randomization generation: not specified; | |
| Participants | 497 patients who had myeloablative allogeneic BMT from unrelated donor; Multi‐center‐ USA and Europe; Setting: hospitalization in isolation precautions and then outpatients | |
| Interventions | IV polyvalent immunoglobulin (Gammagard) vs. placebo. The trial included 2 arms: IVIG 500 mg/kg and placebo; Schedule: day ‐7 and ‐1 and then weekly from day +6 to day +90 | |
| Outcomes | All cause mortality; TRM; relapse | |
| Notes | ||
| Risk of bias | ||
| Bias | Authors' judgement | Support for judgement |
| Allocation concealment? | Unclear risk | B ‐ Unclear |
| Study characteristics | ||
| Methods | Randomization generation: not specified; | |
| Participants | 14 patients who had alloSCT from HLA identical siblings for acute leukemia, CML, MDS; single center‐ Turkey, Europe; Setting: not mentioned | |
| Interventions | IV polyvalent Immunoglobulin | |
| Outcomes | All cause mortality; CDI; acute GVHD; VOD; engraftment; | |
| Notes | ||
| Risk of bias | ||
| Bias | Authors' judgement | Support for judgement |
| Allocation concealment? | Unclear risk | B ‐ Unclear |
| Study characteristics | ||
| Methods | Randomization generation:not specified; | |
| Participants | 54 patients who had myeloablative allogeneic bone marrow transplantation from HLA identical sibling donors; single center; USA | |
| Interventions | Anti‐CMV hyperimmune plasma at a dose of 10 ml/kg vs. control; Schedule: before conditioning, then on day +3; +30; +45; +60; +75; +90; +120 | |
| Outcomes | All cause mortality; CMV infection; CMV disease; IRM; TRM; acute GVHD; IP; relapse; adverse events | |
| Notes | Excluded patients died (ITT) | |
| Risk of bias | ||
| Bias | Authors' judgement | Support for judgement |
| Allocation concealment? | Unclear risk | B ‐ Unclear |
| Study characteristics | ||
| Methods | Randomization generation: not specified; Allocation concealment: unclear; | |
| Participants | 41 patients who had myeloablative allogeneic BMT for acute leukemia in remission or relapse and aplastic anemia from HLA identical sibling donors; | |
| Interventions | IV polyvalent Immunoglobulin 5% in 10% maltose vs control. The trial included 2 arms: IVIG 5% in 10% maltose 20 cc/kg | |
| Outcomes | All cause mortality; viral infections; CMV infections; CMV disease; acute GVHD; IP; adverse events | |
| Notes | Results from an ongoing study | |
| Risk of bias | ||
| Bias | Authors' judgement | Support for judgement |
| Allocation concealment? | Unclear risk | B ‐ Unclear |
| Study characteristics | ||
| Methods | Randomization generation: not specified; allocation concealment: unclear; | |
| Participants | 89 patients who had alloBMT T‐ cell depleted from sibling for acute leukemia in remission or relapse and for aplastic anemia; Single‐center, USA; setting: hospitalization in isolation precautions and then outpatients | |
| Interventions | IV polyvalent Immunoglobulinvs control. The trial included 2 arms: IVIG 20 cc/kg and control; Schedule: before initiation of conditioning and then every week until day +120 | |
| Outcomes | all cause mortality; CMV infection; CMV disease; acute GVHD; IP; adverse events | |
| Notes | ||
| Risk of bias | ||
| Bias | Authors' judgement | Support for judgement |
| Allocation concealment? | Unclear risk | B ‐ Unclear |
| Study characteristics | ||
| Methods | Randomization generation: not specified; allocation concealment: unclear; | |
| Participants | 51 patients who had myeloablative allogeneic BMT for acute leukemia nd aplastic anemia and CML and MDS from HLA sibling or unrelated donors; | |
| Interventions | IV polyvalent ImmunoglobulinI(Sandoglobulin) | |
| Outcomes | all cause mortality ; bacterial infections; fungal infections; viral infections; bacteremia; CMV infections; CMV disease; IRM; acute GVHD; IP; relapse; adverse events | |
| Notes | in both arms seronegative blood products were administered | |
| Risk of bias | ||
| Bias | Authors' judgement | Support for judgement |
| Allocation concealment? | Unclear risk | B ‐ Unclear |
| Study characteristics | ||
| Methods | Randomization generation: not specified; allocation concealment: unclear; | |
| Participants | 627 patients with acute leukemia, CML, lymphoma, aplastic anemia | |
| Interventions | IV polyvalent Immunoglobulin in 3 doses. The trial included 3 arms: 100 mg/kg; 250 mg/kg; 500 mg/kg Schedule: day ‐2, then weekly from day 0 to day +90, then monthly from day +90 to day +360 | |
| Outcomes | all cause mortality; CDI; MDI; bacterial infections; fungal infections; viral infections; | |
| Notes | ||
| Risk of bias | ||
| Bias | Authors' judgement | Support for judgement |
| Allocation concealment? | Unclear risk | B ‐ Unclear |
| Study characteristics | ||
| Methods | Randomization generation:computer generated; | |
| Participants | 170 patients who had myeloablative autologous BMT or myelosuppressive Rx. for acute leukemia or other disease; | |
| Interventions | IV polyvalent immunoglobulin (Sandoglobulin) vs. control. The trial included 2 arms: IIVIG Sandoglobulin 500 mg/kg and control; | |
| Outcomes | all cause mortality; CDI; fungal infections; bacteremia; IRM; TRM; VOD; IP; adverse event | |
| Notes | ||
| Risk of bias | ||
| Bias | Authors' judgement | Support for judgement |
| Allocation concealment? | Unclear risk | B ‐ Unclear |
| Study characteristics | ||
| Methods | Randomization generation: not specified; allocation concealment: unclear; | |
| Participants | 128 patients who had myeloablative allogeneic BMT + peripheral stem cell transplant from from HLA identical sibling donor for acute leukemia or CML or SAA and others; single ‐ center ‐ Italy, Europe | |
| Interventions | anti‐CMV hyperimmune globulin ( CMV IgG) vs. polyvalent Immunoglobulin. The trial included arms: anti‐CMV hyperimmune globulin 100mg/kg (CMV IgG) and polyvalent Immunoglobulin (IVIG) 400 mg/kg | |
| Outcomes | all cause mortality; CDI; fungal infections; CMV infections; CMV disease; IRM; TRM; acute GVHD; chronic GVHD; IP; | |
| Notes | ||
| Risk of bias | ||
| Bias | Authors' judgement | Support for judgement |
| Allocation concealment? | Unclear risk | B ‐ Unclear |
CDI=clinically documented infections; MDI=microbiologically documented infections (all pathogens included, ie bacterial, fungal, viral, other); IRM=infection related mortality; TRM=transplant related mortality; GVHD=graft versus host disease; VOD=veno‐occlusive disease; IP=interstitial pneumonia
Characteristics of excluded studies [ordered by study ID]
Ir a:
| Study | Reason for exclusion |
| Phase I study. The safety and pharmacokinetics of two neutralizing human IgG1 monoclonal antibodies to CMV in BMT recipients was assessed in an open phase I trial. | |
| Children with leukemia (ALL) and solid tumors reported together as a single cohort (not CLL or MM or BMT) | |
| Reports the study by the cooperative CLL group | |
| Not an RCT. The study describes the kinetics of immunoglobulin levels in 15 patients given IVIG in a different RCT included in this review (see reference Co‐operative group for the study of CLL) | |
| Review | |
| Reports a study of immunoglobulin prophylaxis in patients with acute leukemia (not CLL or MM or BMT) | |
| Oral and not parenteral immunoglobulins. This is a controlled trial of orally administered immunoglobulin following bone marrow transplantation where 72 patients were randomized to oral Ig vs. placebo | |
| Not an RCT. Also the intervention was the administration of RSV (respiratory syncitial virus) immunoglobulins and not polyvalent IG or anti CMV IG | |
| This is a crossover study dealing with 43 patients with primary hypogammaglobulinemia who received standard‐dose immunoglobulin therapy for 9 months, followed by a 3‐month washout period, and high‐dose intravenous immunoglobulin therapy for 9 months, or vice versa. | |
| Not an RCT | |
| This is a subcategory of Cordonnier 2003 dealing with costs only | |
| Not RCT. This is a publication reporting on Immune globulin (GAMMAGARD) prophylaxis of CMV infections in patients undergoing organ transplantation and allogeneic bone marrow transplantation | |
| The study itself is not an RCT and quotes the RCT by Chapel 1994 (which is already included in the review) | |
| All pts. received first hyperimmune CMVIG and only those who became negative were randomized | |
| Reports a study of immunoglobulin prophylaxis in children with acute lymphoblastic leukemia (not CLL or MM or BMT) | |
| Not an RCT | |
| No RCT. 15 patients with CLL and hypogammaglobulinaemia and a history of recurrent infections received a fixed dose of 10 grams of gammaglobulin intravenously every 3 weeks. | |
| Not RCT. Forty‐five recipients of bone marrow from HLA‐identical siblings were given intravenous immune globulin once a week during the first 3 months after transplantation. Fifty‐three consecutive previously transplanted HLA‐identical siblings were included as controls. | |
| Not RCT, meta‐analysis. This is an analysis of the RCT's published on the effectiveness of hyperimmune immunoglobulins for prevention of CMV infection or disease in CMV‐seronegative recipients of allogeneic bone marrow transplantation (BMT). The clinical trials were identified by searching a number of computerized literature databases, by reviewing bibliographies of the paper examined and by consulting experts. | |
| Retrospective study. Sera obtained from 13 IVIG‐treated and 31 non‐IVIG‐treated patients before and at different time points after BMT, ranging from 3 days to 3 years, and from 18 healthy controls, were analyzed using a quantitative immunoblot system. | |
| Not an RCT | |
| This report represents a retrospective analysis of bacterial and fungal bacteremia of the same patients from another RCT (see reference Meyers in included studies) | |
| No RCT. The pharmacokinetics of an IVIG, Gammagard were measured in 31 CMV antibody negative BMT patients as part of a multicenter efficacy trial of 2 weekly dose regimens. | |
| Not an RCT. Historical controls. Continuous infusion intravenous immunoglobulin was compared to intermittent infusion following bone marrow transplantation | |
| includes 383 pts. from Sullivan 1990 & 94 pts. from Bowden 1986. Outcomes reported only for 100 pts | |
| Retrospective analysis. A retrospective analysis of two randomized clinical trials conducted Iin one center to determine the effect of IVIg infusions on the development and severity of VOD. Patients were randomized to receive or not to receive IVIG prophylaxis after allogeneic BMT. To determine the relationship of IVIG to the development and severity of VOD, a single observer reviewed data displays created for each patient for grading VOD without knowledge of patient IVIG use. | |
| Not an RCT | |
| Not an RCT, a description of 2 pilot studies compared to a historical control |
Data and analyses
| Outcome or subgroup title | No. of studies | No. of participants | Statistical method | Effect size |
| 1.1 All‐cause Mortality Show forest plot | 8 | 1418 | Risk Ratio (M‐H, Fixed, 95% CI) | 0.99 [0.88, 1.12] |
| Analysis 1.1  Comparison 1: Polyvalent immunoglobulins vs. placebo / no intervention ‐ HSCT, Outcome 1: All‐cause Mortality | ||||
| 1.1.1 2 years and more | 3 | 474 | Risk Ratio (M‐H, Fixed, 95% CI) | 1.00 [0.87, 1.15] |
| 1.1.2 100‐200 days | 5 | 944 | Risk Ratio (M‐H, Fixed, 95% CI) | 0.99 [0.81, 1.20] |
| 1.2 All cause mortality 100 days Show forest plot | 4 | 881 | Risk Ratio (M‐H, Fixed, 95% CI) | 1.03 [0.83, 1.26] |
| Analysis 1.2  Comparison 1: Polyvalent immunoglobulins vs. placebo / no intervention ‐ HSCT, Outcome 2: All cause mortality 100 days | ||||
| 1.3 All‐cause Mortality at 1‐2years and more Show forest plot | 5 | 737 | Risk Ratio (M‐H, Fixed, 95% CI) | 1.07 [0.94, 1.21] |
| Analysis 1.3  Comparison 1: Polyvalent immunoglobulins vs. placebo / no intervention ‐ HSCT, Outcome 3: All‐cause Mortality at 1‐2years and more | ||||
| 1.4 All‐cause Mortality ‐ by type of HSCT Show forest plot | 6 | 907 | Risk Ratio (M‐H, Fixed, 95% CI) | 1.03 [0.89, 1.18] |
| Analysis 1.4  Comparison 1: Polyvalent immunoglobulins vs. placebo / no intervention ‐ HSCT, Outcome 4: All‐cause Mortality ‐ by type of HSCT | ||||
| 1.4.1 allogeneic transplant | 3 | 305 | Risk Ratio (M‐H, Fixed, 95% CI) | 1.07 [0.79, 1.44] |
| 1.4.2 autologous and allo transplant | 2 | 432 | Risk Ratio (M‐H, Fixed, 95% CI) | 0.95 [0.81, 1.10] |
| 1.4.3 autologous alone | 1 | 170 | Risk Ratio (M‐H, Fixed, 95% CI) | 3.93 [1.14, 13.61] |
| 1.5 All cause mortality ‐by use of antifungal prophylaxis Show forest plot | 5 | 758 | Risk Ratio (M‐H, Fixed, 95% CI) | 0.91 [0.79, 1.04] |
| Analysis 1.5  Comparison 1: Polyvalent immunoglobulins vs. placebo / no intervention ‐ HSCT, Outcome 5: All cause mortality ‐by use of antifungal prophylaxis | ||||
| 1.5.1 Use of oral polyene | 2 | 251 | Risk Ratio (M‐H, Fixed, 95% CI) | 1.07 [0.74, 1.53] |
| 1.5.2 no antifungal prophylaxis | 3 | 507 | Risk Ratio (M‐H, Fixed, 95% CI) | 0.88 [0.76, 1.02] |
| 1.6 All‐cause Mortality ‐ high dose IVIG Show forest plot | 3 | 590 | Risk Ratio (M‐H, Fixed, 95% CI) | 1.06 [0.91, 1.23] |
| Analysis 1.6  Comparison 1: Polyvalent immunoglobulins vs. placebo / no intervention ‐ HSCT, Outcome 6: All‐cause Mortality ‐ high dose IVIG | ||||
| 1.7 All‐cause Mortality ‐sensitivity analysis by randomization generation Show forest plot | 8 | 1445 | Risk Ratio (M‐H, Fixed, 95% CI) | 0.97 [0.86, 1.09] |
| Analysis 1.7  Comparison 1: Polyvalent immunoglobulins vs. placebo / no intervention ‐ HSCT, Outcome 7: All‐cause Mortality ‐sensitivity analysis by randomization generation | ||||
| 1.7.1 randomization generation A | 2 | 370 | Risk Ratio (M‐H, Fixed, 95% CI) | 1.40 [0.88, 2.22] |
| 1.7.2 randomization generation B | 6 | 1075 | Risk Ratio (M‐H, Fixed, 95% CI) | 0.93 [0.83, 1.05] |
| 1.8 All‐cause Mortality ‐sensitivity analysis by double blinding Show forest plot | 8 | 1445 | Risk Ratio (M‐H, Fixed, 95% CI) | 0.97 [0.86, 1.09] |
| Analysis 1.8  Comparison 1: Polyvalent immunoglobulins vs. placebo / no intervention ‐ HSCT, Outcome 8: All‐cause Mortality ‐sensitivity analysis by double blinding | ||||
| 1.8.1 double blinding | 2 | 697 | Risk Ratio (M‐H, Fixed, 95% CI) | 0.94 [0.76, 1.17] |
| 1.8.2 no blinding | 6 | 748 | Risk Ratio (M‐H, Fixed, 95% CI) | 0.99 [0.86, 1.14] |
| 1.9 Clinically documented infections Show forest plot | 5 | 688 | Risk Ratio (M‐H, Fixed, 95% CI) | 1.00 [0.90, 1.10] |
| Analysis 1.9  Comparison 1: Polyvalent immunoglobulins vs. placebo / no intervention ‐ HSCT, Outcome 9: Clinically documented infections | ||||
| 1.10 Microbiologically documented infections ‐ bacterial Show forest plot | 7 | 1186 | Risk Ratio (M‐H, Fixed, 95% CI) | 1.00 [0.88, 1.15] |
| Analysis 1.10  Comparison 1: Polyvalent immunoglobulins vs. placebo / no intervention ‐ HSCT, Outcome 10: Microbiologically documented infections ‐ bacterial | ||||
| 1.11 Microbiologically documented infections ‐ patient months Show forest plot | 6 | 3542 | Risk Ratio (M‐H, Fixed, 95% CI) | 0.97 [0.82, 1.16] |
| Analysis 1.11  Comparison 1: Polyvalent immunoglobulins vs. placebo / no intervention ‐ HSCT, Outcome 11: Microbiologically documented infections ‐ patient months | ||||
| 1.12 CMV infections Show forest plot | 6 | 986 | Risk Ratio (M‐H, Fixed, 95% CI) | 0.84 [0.66, 1.07] |
| Analysis 1.12  Comparison 1: Polyvalent immunoglobulins vs. placebo / no intervention ‐ HSCT, Outcome 12: CMV infections | ||||
| 1.13 CMV infections ‐ patient months Show forest plot | 4 | 2082 | Risk Ratio (M‐H, Fixed, 95% CI) | 0.70 [0.49, 1.02] |
| Analysis 1.13  Comparison 1: Polyvalent immunoglobulins vs. placebo / no intervention ‐ HSCT, Outcome 13: CMV infections ‐ patient months | ||||
| 1.14 Interstitial Pneumonitis Show forest plot | 7 | 990 | Risk Ratio (M‐H, Fixed, 95% CI) | 0.64 [0.45, 0.89] |
| Analysis 1.14  Comparison 1: Polyvalent immunoglobulins vs. placebo / no intervention ‐ HSCT, Outcome 14: Interstitial Pneumonitis | ||||
| 1.15 Infection‐related Mortality Show forest plot | 3 | 275 | Risk Ratio (M‐H, Fixed, 95% CI) | 0.64 [0.28, 1.49] |
| Analysis 1.15  Comparison 1: Polyvalent immunoglobulins vs. placebo / no intervention ‐ HSCT, Outcome 15: Infection‐related Mortality | ||||
| 1.16 Acute GVHD Show forest plot | 7 | 989 | Risk Ratio (M‐H, Fixed, 95% CI) | 0.93 [0.83, 1.04] |
| Analysis 1.16  Comparison 1: Polyvalent immunoglobulins vs. placebo / no intervention ‐ HSCT, Outcome 16: Acute GVHD | ||||
| 1.17 VOD Show forest plot | 4 | 447 | Risk Ratio (M‐H, Fixed, 95% CI) | 2.73 [1.11, 6.71] |
| Analysis 1.17  Comparison 1: Polyvalent immunoglobulins vs. placebo / no intervention ‐ HSCT, Outcome 17: VOD | ||||
| 1.18 Adverse Events Show forest plot | 5 | 728 | Risk Ratio (M‐H, Fixed, 95% CI) | 8.12 [3.15, 20.97] |
| Analysis 1.18  Comparison 1: Polyvalent immunoglobulins vs. placebo / no intervention ‐ HSCT, Outcome 18: Adverse Events | ||||
| 1.19 VOD according to type of transplant Show forest plot | 4 | 447 | Risk Ratio (M‐H, Fixed, 95% CI) | 2.73 [1.11, 6.71] |
| Analysis 1.19  Comparison 1: Polyvalent immunoglobulins vs. placebo / no intervention ‐ HSCT, Outcome 19: VOD according to type of transplant | ||||
| 1.19.1 allo | 3 | 277 | Risk Ratio (M‐H, Fixed, 95% CI) | 2.04 [0.76, 5.49] |
| 1.19.2 auto | 1 | 170 | Risk Ratio (M‐H, Fixed, 95% CI) | 11.80 [0.66, 210.03] |
| 1.20 CMV Infections and Interstitial pneumonitis Show forest plot | 8 | Risk Ratio (M‐H, Fixed, 95% CI) | Subtotals only | |
| Analysis 1.20  Comparison 1: Polyvalent immunoglobulins vs. placebo / no intervention ‐ HSCT, Outcome 20: CMV Infections and Interstitial pneumonitis | ||||
| 1.20.1 CMV infections | 6 | 986 | Risk Ratio (M‐H, Fixed, 95% CI) | 0.84 [0.66, 1.07] |
| 1.20.2 Interstitial pneumonitis | 7 | 990 | Risk Ratio (M‐H, Fixed, 95% CI) | 0.64 [0.45, 0.89] |
| 1.21 acute GVHD and VOD Show forest plot | 9 | Risk Ratio (M‐H, Fixed, 95% CI) | Subtotals only | |
| Analysis 1.21  Comparison 1: Polyvalent immunoglobulins vs. placebo / no intervention ‐ HSCT, Outcome 21: acute GVHD and VOD | ||||
| 1.21.1 Acute GVHD | 7 | 989 | Risk Ratio (M‐H, Fixed, 95% CI) | 0.93 [0.83, 1.04] |
| 1.21.2 VOD | 4 | 447 | Risk Ratio (M‐H, Fixed, 95% CI) | 2.73 [1.11, 6.71] |
| 1.22 All‐cause Mortality ‐sensitivity analysis by ITT Show forest plot | 9 | Risk Ratio (M‐H, Fixed, 95% CI) | Subtotals only | |
| Analysis 1.22  Comparison 1: Polyvalent immunoglobulins vs. placebo / no intervention ‐ HSCT, Outcome 22: All‐cause Mortality ‐sensitivity analysis by ITT | ||||
| 1.22.1 ITT | 6 | 986 | Risk Ratio (M‐H, Fixed, 95% CI) | 1.04 [0.87, 1.24] |
| 1.22.2 PER PROTOCOL | 3 | 473 | Risk Ratio (M‐H, Fixed, 95% CI) | 0.91 [0.79, 1.06] |
| 1.23 CMV Infections, Interstitial pneumonitis and VOD Show forest plot | 10 | Risk Ratio (M‐H, Fixed, 95% CI) | Subtotals only | |
| Analysis 1.23  Comparison 1: Polyvalent immunoglobulins vs. placebo / no intervention ‐ HSCT, Outcome 23: CMV Infections, Interstitial pneumonitis and VOD | ||||
| 1.23.1 CMV infections | 6 | 986 | Risk Ratio (M‐H, Fixed, 95% CI) | 0.84 [0.66, 1.07] |
| 1.23.2 Interstitial pneumonitis | 7 | 990 | Risk Ratio (M‐H, Fixed, 95% CI) | 0.64 [0.45, 0.89] |
| 1.23.3 VOD | 4 | 447 | Risk Ratio (M‐H, Fixed, 95% CI) | 2.73 [1.11, 6.71] |
| 1.24 Clinically Documented Infections‐ sensitivity analysis by randomization generation Show forest plot | 5 | Risk Ratio (M‐H, Fixed, 95% CI) | Subtotals only | |
| Analysis 1.24  Comparison 1: Polyvalent immunoglobulins vs. placebo / no intervention ‐ HSCT, Outcome 24: Clinically Documented Infections‐ sensitivity analysis by randomization generation | ||||
| 1.24.1 randomization generation A | 2 | 370 | Risk Ratio (M‐H, Fixed, 95% CI) | 0.99 [0.86, 1.14] |
| 1.24.2 Randomization Generation B | 3 | 318 | Risk Ratio (M‐H, Fixed, 95% CI) | 1.00 [0.86, 1.17] |
| 1.25 Clinically documented infections ‐ sensitivity analysis by blinding Show forest plot | 5 | Risk Ratio (M‐H, Fixed, 95% CI) | Subtotals only | |
| Analysis 1.25  Comparison 1: Polyvalent immunoglobulins vs. placebo / no intervention ‐ HSCT, Outcome 25: Clinically documented infections ‐ sensitivity analysis by blinding | ||||
| 1.25.1 Double blind | 1 | 200 | Risk Ratio (M‐H, Fixed, 95% CI) | 1.01 [0.91, 1.12] |
| 1.25.2 no blinding | 4 | 488 | Risk Ratio (M‐H, Fixed, 95% CI) | 0.99 [0.86, 1.15] |
| 1.26 VOD ‐ sensitivity analysis according to randomization generation Show forest plot | 4 | 447 | Risk Ratio (M‐H, Fixed, 95% CI) | 2.73 [1.11, 6.71] |
| Analysis 1.26  Comparison 1: Polyvalent immunoglobulins vs. placebo / no intervention ‐ HSCT, Outcome 26: VOD ‐ sensitivity analysis according to randomization generation | ||||
| 1.26.1 Randomization A | 2 | 370 | Risk Ratio (M‐H, Fixed, 95% CI) | 3.35 [1.19, 9.47] |
| 1.26.2 Randomization B | 2 | 77 | Risk Ratio (M‐H, Fixed, 95% CI) | 1.08 [0.16, 7.51] |
| 1.27 VOD ‐ sensitivity analysis by blinding Show forest plot | 4 | 447 | Risk Ratio (M‐H, Fixed, 95% CI) | 2.73 [1.11, 6.71] |
| Analysis 1.27  Comparison 1: Polyvalent immunoglobulins vs. placebo / no intervention ‐ HSCT, Outcome 27: VOD ‐ sensitivity analysis by blinding | ||||
| 1.27.1 double blind | 1 | 200 | Risk Ratio (M‐H, Fixed, 95% CI) | 2.44 [0.76, 7.82] |
| 1.27.2 no blinding | 3 | 247 | Risk Ratio (M‐H, Fixed, 95% CI) | 3.27 [0.78, 13.59] |
| 1.28 IP ‐ sensitivity analysis by randomization generation Show forest plot | 6 | 898 | Risk Ratio (M‐H, Fixed, 95% CI) | 0.61 [0.43, 0.87] |
| Analysis 1.28  Comparison 1: Polyvalent immunoglobulins vs. placebo / no intervention ‐ HSCT, Outcome 28: IP ‐ sensitivity analysis by randomization generation | ||||
| 1.28.1 Randomization generation A | 2 | 370 | Risk Ratio (M‐H, Fixed, 95% CI) | 1.66 [0.57, 4.85] |
| 1.28.2 Randomization generation B | 4 | 528 | Risk Ratio (M‐H, Fixed, 95% CI) | 0.52 [0.36, 0.76] |
| 1.29 IP ‐ sensitivity analysis by blinding Show forest plot | 7 | 990 | Risk Ratio (M‐H, Fixed, 95% CI) | 0.64 [0.45, 0.89] |
| Analysis 1.29  Comparison 1: Polyvalent immunoglobulins vs. placebo / no intervention ‐ HSCT, Outcome 29: IP ‐ sensitivity analysis by blinding | ||||
| 1.29.1 double blind | 1 | 200 | Risk Ratio (M‐H, Fixed, 95% CI) | 1.56 [0.47, 5.19] |
| 1.29.2 no blinding | 6 | 790 | Risk Ratio (M‐H, Fixed, 95% CI) | 0.58 [0.41, 0.82] |
| 1.30 Fungal Infections Show forest plot | 5 | 1031 | Risk Ratio (M‐H, Fixed, 95% CI) | 0.95 [0.72, 1.25] |
| Analysis 1.30  Comparison 1: Polyvalent immunoglobulins vs. placebo / no intervention ‐ HSCT, Outcome 30: Fungal Infections | ||||
| 1.31 Bacteremia Show forest plot | 4 | 653 | Risk Ratio (M‐H, Fixed, 95% CI) | 1.03 [0.93, 1.13] |
| Analysis 1.31  Comparison 1: Polyvalent immunoglobulins vs. placebo / no intervention ‐ HSCT, Outcome 31: Bacteremia | ||||
| Outcome or subgroup title | No. of studies | No. of participants | Statistical method | Effect size |
| 2.1 All‐cause Mortality Show forest plot | 4 | 288 | Risk Ratio (M‐H, Fixed, 95% CI) | 0.86 [0.63, 1.16] |
| Analysis 2.1  Comparison 2: Hyperimmune CMV‐IVIG vs. placebo / no intervention ‐ HSCT, Outcome 1: All‐cause Mortality | ||||
| 2.2 All‐cause Mortality ‐ 100d (3‐4mo) Show forest plot | 3 | 234 | Risk Ratio (M‐H, Fixed, 95% CI) | 0.89 [0.64, 1.24] |
| Analysis 2.2  Comparison 2: Hyperimmune CMV‐IVIG vs. placebo / no intervention ‐ HSCT, Outcome 2: All‐cause Mortality ‐ 100d (3‐4mo) | ||||
| 2.3 CMV infection Show forest plot | 8 | 553 | Risk Ratio (M‐H, Fixed, 95% CI) | 1.02 [0.82, 1.26] |
| Analysis 2.3  Comparison 2: Hyperimmune CMV‐IVIG vs. placebo / no intervention ‐ HSCT, Outcome 3: CMV infection | ||||
| 2.4 Interstitial Pneumonitis Show forest plot | 5 | 345 | Risk Ratio (M‐H, Fixed, 95% CI) | 0.95 [0.58, 1.56] |
| Analysis 2.4  Comparison 2: Hyperimmune CMV‐IVIG vs. placebo / no intervention ‐ HSCT, Outcome 4: Interstitial Pneumonitis | ||||
| 2.5 Infection‐related Mortality Show forest plot | 3 | 234 | Risk Ratio (M‐H, Fixed, 95% CI) | 0.67 [0.34, 1.32] |
| Analysis 2.5  Comparison 2: Hyperimmune CMV‐IVIG vs. placebo / no intervention ‐ HSCT, Outcome 5: Infection‐related Mortality | ||||
| 2.6 Acute GVHD Show forest plot | 5 | 342 | Risk Ratio (M‐H, Fixed, 95% CI) | 1.02 [0.72, 1.44] |
| Analysis 2.6  Comparison 2: Hyperimmune CMV‐IVIG vs. placebo / no intervention ‐ HSCT, Outcome 6: Acute GVHD | ||||
| 2.7 Adverse Events Show forest plot | 1 | 54 | Risk Ratio (M‐H, Fixed, 95% CI) | 7.00 [0.38, 129.34] |
| Analysis 2.7  Comparison 2: Hyperimmune CMV‐IVIG vs. placebo / no intervention ‐ HSCT, Outcome 7: Adverse Events | ||||
| 2.8 Fungal Infections Show forest plot | 2 | 271 | Risk Ratio (M‐H, Fixed, 95% CI) | 1.02 [0.54, 1.93] |
| Analysis 2.8  Comparison 2: Hyperimmune CMV‐IVIG vs. placebo / no intervention ‐ HSCT, Outcome 8: Fungal Infections | ||||
| 2.9 Bacteremia Show forest plot | 1 | 179 | Risk Ratio (M‐H, Fixed, 95% CI) | 1.76 [1.23, 2.52] |
| Analysis 2.9  Comparison 2: Hyperimmune CMV‐IVIG vs. placebo / no intervention ‐ HSCT, Outcome 9: Bacteremia | ||||
| Outcome or subgroup title | No. of studies | No. of participants | Statistical method | Effect size |
| 3.1 All‐cause Mortality Show forest plot | 12 | 1706 | Risk Ratio (M‐H, Fixed, 95% CI) | 0.97 [0.87, 1.09] |
| Analysis 3.1  Comparison 3: Polyvalent immunoglobulins or hyperimmune CMV‐IVIG vs. placebo / no intervention ‐ HSCT, Outcome 1: All‐cause Mortality | ||||
| 3.1.1 Polyvalent IVIG | 8 | 1418 | Risk Ratio (M‐H, Fixed, 95% CI) | 0.99 [0.88, 1.12] |
| 3.1.2 CMV‐IVIG | 4 | 288 | Risk Ratio (M‐H, Fixed, 95% CI) | 0.86 [0.63, 1.16] |
| 3.2 All‐cause Mortality ‐ 100d (3‐4 mo) Show forest plot | 8 | 1178 | Risk Ratio (M‐H, Fixed, 95% CI) | 0.96 [0.82, 1.14] |
| Analysis 3.2  Comparison 3: Polyvalent immunoglobulins or hyperimmune CMV‐IVIG vs. placebo / no intervention ‐ HSCT, Outcome 2: All‐cause Mortality ‐ 100d (3‐4 mo) | ||||
| 3.2.1 Polyvalent IVIG | 5 | 944 | Risk Ratio (M‐H, Fixed, 95% CI) | 0.99 [0.81, 1.20] |
| 3.2.2 CMV‐IVIG | 3 | 234 | Risk Ratio (M‐H, Fixed, 95% CI) | 0.89 [0.64, 1.24] |
| 3.3 CMV infection Show forest plot | 13 | 1511 | Risk Ratio (M‐H, Fixed, 95% CI) | 0.90 [0.76, 1.06] |
| Analysis 3.3  Comparison 3: Polyvalent immunoglobulins or hyperimmune CMV‐IVIG vs. placebo / no intervention ‐ HSCT, Outcome 3: CMV infection | ||||
| 3.3.1 Polyvalent IVIG | 6 | 986 | Risk Ratio (M‐H, Fixed, 95% CI) | 0.84 [0.66, 1.07] |
| 3.3.2 CMV‐IVIG | 7 | 525 | Risk Ratio (M‐H, Fixed, 95% CI) | 0.97 [0.78, 1.21] |
| 3.4 Interstitial Pneumonitis Show forest plot | 12 | 1335 | Risk Ratio (M‐H, Fixed, 95% CI) | 0.72 [0.55, 0.95] |
| Analysis 3.4  Comparison 3: Polyvalent immunoglobulins or hyperimmune CMV‐IVIG vs. placebo / no intervention ‐ HSCT, Outcome 4: Interstitial Pneumonitis | ||||
| 3.4.1 Polyvalent IVIG | 7 | 990 | Risk Ratio (M‐H, Fixed, 95% CI) | 0.64 [0.45, 0.89] |
| 3.4.2 CMV‐IVIG | 5 | 345 | Risk Ratio (M‐H, Fixed, 95% CI) | 0.95 [0.58, 1.56] |
| 3.5 Infection‐related Mortality Show forest plot | 6 | 509 | Risk Ratio (M‐H, Fixed, 95% CI) | 0.66 [0.39, 1.12] |
| Analysis 3.5  Comparison 3: Polyvalent immunoglobulins or hyperimmune CMV‐IVIG vs. placebo / no intervention ‐ HSCT, Outcome 5: Infection‐related Mortality | ||||
| 3.5.1 Polyvalent IVIG | 3 | 275 | Risk Ratio (M‐H, Fixed, 95% CI) | 0.64 [0.28, 1.49] |
| 3.5.2 CMV‐IVIG | 3 | 234 | Risk Ratio (M‐H, Fixed, 95% CI) | 0.67 [0.34, 1.32] |
| 3.6 Acute GVHD Show forest plot | 12 | 1331 | Risk Ratio (M‐H, Fixed, 95% CI) | 0.94 [0.84, 1.05] |
| Analysis 3.6  Comparison 3: Polyvalent immunoglobulins or hyperimmune CMV‐IVIG vs. placebo / no intervention ‐ HSCT, Outcome 6: Acute GVHD | ||||
| 3.6.1 Polyvalent IVIG | 7 | 989 | Risk Ratio (M‐H, Fixed, 95% CI) | 0.93 [0.83, 1.04] |
| 3.6.2 CMV‐IVIG | 5 | 342 | Risk Ratio (M‐H, Fixed, 95% CI) | 1.02 [0.72, 1.44] |
| 3.7 Adverse Events Show forest plot | 6 | 782 | Risk Ratio (M‐H, Fixed, 95% CI) | 8.02 [3.25, 19.78] |
| Analysis 3.7  Comparison 3: Polyvalent immunoglobulins or hyperimmune CMV‐IVIG vs. placebo / no intervention ‐ HSCT, Outcome 7: Adverse Events | ||||
| 3.7.1 Polyvalent IVIG | 5 | 728 | Risk Ratio (M‐H, Fixed, 95% CI) | 8.12 [3.15, 20.97] |
| 3.7.2 CMV‐IVIG | 1 | 54 | Risk Ratio (M‐H, Fixed, 95% CI) | 7.00 [0.38, 129.34] |
| Outcome or subgroup title | No. of studies | No. of participants | Statistical method | Effect size |
| 4.1 All‐cause Mortality Show forest plot | 3 | 212 | Risk Ratio (M‐H, Fixed, 95% CI) | 1.46 [0.92, 2.32] |
| Analysis 4.1  Comparison 4: Polyvalent immunoglobulins vs. hyperimmune CMV‐IVIG ‐ HSCT, Outcome 1: All‐cause Mortality | ||||
| 4.2 Clinically documented Infection Show forest plot | 1 | 128 | Risk Ratio (M‐H, Fixed, 95% CI) | 1.57 [0.89, 2.79] |
| Analysis 4.2  Comparison 4: Polyvalent immunoglobulins vs. hyperimmune CMV‐IVIG ‐ HSCT, Outcome 2: Clinically documented Infection | ||||
| 4.3 CMV Infection Show forest plot | 3 | 212 | Risk Ratio (M‐H, Fixed, 95% CI) | 1.42 [1.07, 1.89] |
| Analysis 4.3  Comparison 4: Polyvalent immunoglobulins vs. hyperimmune CMV‐IVIG ‐ HSCT, Outcome 3: CMV Infection | ||||
| 4.4 Interstitial Pneumonitis Show forest plot | 2 | 163 | Risk Ratio (M‐H, Fixed, 95% CI) | 0.83 [0.40, 1.75] |
| Analysis 4.4  Comparison 4: Polyvalent immunoglobulins vs. hyperimmune CMV‐IVIG ‐ HSCT, Outcome 4: Interstitial Pneumonitis | ||||
| 4.5 Infection‐related Mortality Show forest plot | 2 | 177 | Risk Ratio (M‐H, Fixed, 95% CI) | 3.28 [0.95, 11.26] |
| Analysis 4.5  Comparison 4: Polyvalent immunoglobulins vs. hyperimmune CMV‐IVIG ‐ HSCT, Outcome 5: Infection‐related Mortality | ||||
| 4.6 Acute GVHD Show forest plot | 2 | 163 | Risk Ratio (M‐H, Fixed, 95% CI) | 1.23 [0.87, 1.75] |
| Analysis 4.6  Comparison 4: Polyvalent immunoglobulins vs. hyperimmune CMV‐IVIG ‐ HSCT, Outcome 6: Acute GVHD | ||||
| Outcome or subgroup title | No. of studies | No. of participants | Statistical method | Effect size |
| 5.1 All‐cause Mortality Show forest plot | 1 | 412 | Risk Ratio (M‐H, Fixed, 95% CI) | 1.02 [0.84, 1.25] |
| Analysis 5.1  Comparison 5: Polyvalent immunoglobulins 250mg/kg vs. Polyvalent immunoglobulins or hyperimmune CMV‐IVIG 500mg/kg ‐ HSCT, Outcome 1: All‐cause Mortality | ||||
| 5.2 Clinically documented Infection Show forest plot | 2 | 509 | Risk Ratio (M‐H, Fixed, 95% CI) | 0.89 [0.81, 0.97] |
| Analysis 5.2  Comparison 5: Polyvalent immunoglobulins 250mg/kg vs. Polyvalent immunoglobulins or hyperimmune CMV‐IVIG 500mg/kg ‐ HSCT, Outcome 2: Clinically documented Infection | ||||
| 5.3 Microbiologically documented Infection Show forest plot | 2 | 509 | Risk Ratio (M‐H, Fixed, 95% CI) | 1.28 [1.04, 1.57] |
| Analysis 5.3  Comparison 5: Polyvalent immunoglobulins 250mg/kg vs. Polyvalent immunoglobulins or hyperimmune CMV‐IVIG 500mg/kg ‐ HSCT, Outcome 3: Microbiologically documented Infection | ||||
| 5.4 CMV Infection Show forest plot | 1 | 412 | Risk Ratio (M‐H, Fixed, 95% CI) | 0.69 [0.34, 1.41] |
| Analysis 5.4  Comparison 5: Polyvalent immunoglobulins 250mg/kg vs. Polyvalent immunoglobulins or hyperimmune CMV‐IVIG 500mg/kg ‐ HSCT, Outcome 4: CMV Infection | ||||
| 5.5 Interstitial Pneumonitis Show forest plot | 2 | 509 | Risk Ratio (M‐H, Fixed, 95% CI) | 0.98 [0.33, 2.92] |
| Analysis 5.5  Comparison 5: Polyvalent immunoglobulins 250mg/kg vs. Polyvalent immunoglobulins or hyperimmune CMV‐IVIG 500mg/kg ‐ HSCT, Outcome 5: Interstitial Pneumonitis | ||||
| 5.6 Infection related Mortality Show forest plot | 1 | 412 | Risk Ratio (M‐H, Fixed, 95% CI) | 0.82 [0.47, 1.43] |
| Analysis 5.6  Comparison 5: Polyvalent immunoglobulins 250mg/kg vs. Polyvalent immunoglobulins or hyperimmune CMV‐IVIG 500mg/kg ‐ HSCT, Outcome 6: Infection related Mortality | ||||
| 5.7 Acute GVHD Show forest plot | 3 | 841 | Risk Ratio (M‐H, Fixed, 95% CI) | 1.32 [1.13, 1.55] |
| Analysis 5.7  Comparison 5: Polyvalent immunoglobulins 250mg/kg vs. Polyvalent immunoglobulins or hyperimmune CMV‐IVIG 500mg/kg ‐ HSCT, Outcome 7: Acute GVHD | ||||
| Outcome or subgroup title | No. of studies | No. of participants | Statistical method | Effect size |
| 6.1 All‐cause Mortality Show forest plot | 2 | 163 | Risk Ratio (M‐H, Fixed, 95% CI) | 1.36 [0.58, 3.19] |
| Analysis 6.1  Comparison 6: Polyvalent immunoglobulins vs. placebo / no intervention ‐ MM/CLL, Outcome 1: All‐cause Mortality | ||||
| 6.2 Clinically‐documented infections Show forest plot | 3 | 205 | Risk Ratio (M‐H, Fixed, 95% CI) | 0.49 [0.39, 0.61] |
| Analysis 6.2  Comparison 6: Polyvalent immunoglobulins vs. placebo / no intervention ‐ MM/CLL, Outcome 2: Clinically‐documented infections | ||||
| 6.3 Microbiologically‐documented infections Show forest plot | 3 | 205 | Risk Ratio (M‐H, Fixed, 95% CI) | 0.71 [0.53, 0.95] |
| Analysis 6.3  Comparison 6: Polyvalent immunoglobulins vs. placebo / no intervention ‐ MM/CLL, Outcome 3: Microbiologically‐documented infections | ||||
| 6.4 Bacteremia Show forest plot | 2 | 124 | Risk Ratio (M‐H, Fixed, 95% CI) | 0.65 [0.14, 3.07] |
| Analysis 6.4  Comparison 6: Polyvalent immunoglobulins vs. placebo / no intervention ‐ MM/CLL, Outcome 4: Bacteremia | ||||
| 6.5 Infection‐related Mortality Show forest plot | 1 | 82 | Risk Ratio (M‐H, Fixed, 95% CI) | 0.33 [0.01, 7.95] |
| Analysis 6.5  Comparison 6: Polyvalent immunoglobulins vs. placebo / no intervention ‐ MM/CLL, Outcome 5: Infection‐related Mortality | ||||
| 6.6 Adverse Events Show forest plot | 3 | 205 | Risk Ratio (M‐H, Fixed, 95% CI) | 2.37 [1.74, 3.24] |
| Analysis 6.6  Comparison 6: Polyvalent immunoglobulins vs. placebo / no intervention ‐ MM/CLL, Outcome 6: Adverse Events | ||||
| 6.7 Adverse Events requiring discontinuation Show forest plot | 3 | 205 | Risk Ratio (M‐H, Fixed, 95% CI) | 5.43 [0.70, 42.24] |
| Analysis 6.7  Comparison 6: Polyvalent immunoglobulins vs. placebo / no intervention ‐ MM/CLL, Outcome 7: Adverse Events requiring discontinuation | ||||
| 6.8 Clinically and microbiologically documented infections Show forest plot | 3 | 410 | Risk Ratio (M‐H, Fixed, 95% CI) | 0.57 [0.48, 0.69] |
| Analysis 6.8  Comparison 6: Polyvalent immunoglobulins vs. placebo / no intervention ‐ MM/CLL, Outcome 8: Clinically and microbiologically documented infections | ||||
| 6.8.1 Clinically‐documented infections | 3 | 205 | Risk Ratio (M‐H, Fixed, 95% CI) | 0.49 [0.39, 0.61] |
| 6.8.2 Microbiologically‐documented infections | 3 | 205 | Risk Ratio (M‐H, Fixed, 95% CI) | 0.71 [0.53, 0.95] |
| 6.9 Fungal infections Show forest plot | 1 | 81 | Risk Ratio (M‐H, Fixed, 95% CI) | 1.46 [0.26, 8.30] |
| Analysis 6.9  Comparison 6: Polyvalent immunoglobulins vs. placebo / no intervention ‐ MM/CLL, Outcome 9: Fungal infections | ||||
| 6.10 Bacteremia Show forest plot | 1 | 82 | Risk Ratio (M‐H, Fixed, 95% CI) | 0.14 [0.01, 2.68] |
| Analysis 6.10  Comparison 6: Polyvalent immunoglobulins vs. placebo / no intervention ‐ MM/CLL, Outcome 10: Bacteremia | ||||


Forest plot of comparison: 1 Polyvalent immunoglobulins vs. placebo / no intervention ‐ HSCT, outcome: 1.1 All‐cause Mortality.

Forest plot of comparison: 1 Polyvalent immunoglobulins vs. placebo / no intervention ‐ HSCT, outcome: 1.2 All cause mortality 100 days.

Forest plot of comparison: 1 Polyvalent immunoglobulins vs. placebo / no intervention ‐ HSCT, outcome: 1.3 All‐cause Mortality at 1‐2years and more.

Forest plot of comparison: 1 Polyvalent immunoglobulins vs. placebo / no intervention ‐ HSCT, outcome: 1.4 All‐cause Mortality ‐ by type of HSCT.

Forest plot of comparison: 1 Polyvalent immunoglobulins vs. placebo / no intervention ‐ HSCT, outcome: 1.5 All cause mortality ‐by use of antifungal prophylaxis.

Forest plot of comparison: 1 Polyvalent immunoglobulins vs. placebo / no intervention ‐ HSCT, outcome: 1.6 All‐cause Mortality ‐ high dose IVIG.

Forest plot of comparison: 1 Polyvalent immunoglobulins vs. placebo / no intervention ‐ HSCT, outcome: 1.7 All‐cause Mortality ‐sensitivity analysis by randomization generation.

Forest plot of comparison: 1 Polyvalent immunoglobulins vs. placebo / no intervention ‐ HSCT, outcome: 1.8 All‐cause Mortality ‐sensitivity analysis by double blinding.

Forest plot of comparison: 1 Polyvalent immunoglobulins vs. placebo / no intervention ‐ HSCT, outcome: 1.22 All‐cause Mortality ‐sensitivity analysis by ITT.
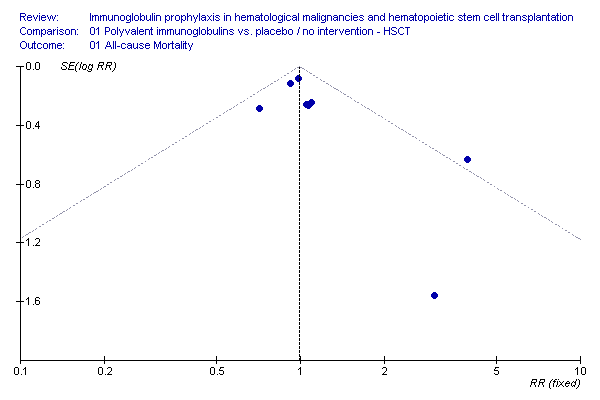
Funnel plot: all cause mortality, IVIG vs. no treatment, HSCT

Forest plot of comparison: 1 Polyvalent immunoglobulins vs. placebo / no intervention ‐ HSCT, outcome: 1.9 Clinically documented infections.

Forest plot of comparison: 1 Polyvalent immunoglobulins vs. placebo / no intervention ‐ HSCT, outcome: 1.24 Clinically Documented Infections‐ sensitivity analysis by randomization generation.

Forest plot of comparison: 1 Polyvalent immunoglobulins vs. placebo / no intervention ‐ HSCT, outcome: 1.25 Clinically documented infections ‐ sensitivity analysis by blinding.

Forest plot of comparison: 1 Polyvalent immunoglobulins vs. placebo / no intervention ‐ HSCT, outcome: 1.10 Microbiologically documented infections ‐ bacterial.

Forest plot of comparison: 1 Polyvalent immunoglobulins vs. placebo / no intervention ‐ HSCT, outcome: 1.11 Microbiologically documented infections ‐ patient months.

Forest plot of comparison: 1 Polyvalent immunoglobulins vs. placebo / no intervention ‐ HSCT, outcome: 1.12 CMV infections.

Forest plot of comparison: 1 Polyvalent immunoglobulins vs. placebo / no intervention ‐ HSCT, outcome: 1.20 CMV Infections and Interstitial pneumonitis.

Forest plot of comparison: 1 Polyvalent immunoglobulins vs. placebo / no intervention ‐ HSCT, outcome: 1.23 CMV Infections, Interstitial pneumonitis and VOD.

Forest plot of comparison: 1 Polyvalent immunoglobulins vs. placebo / no intervention ‐ HSCT, outcome: 1.13 CMV infections ‐ patient months.

Forest plot of comparison: 1 Polyvalent immunoglobulins vs. placebo / no intervention ‐ HSCT, outcome: 1.14 Interstitial Pneumonitis.

Forest plot of comparison: 1 Polyvalent immunoglobulins vs. placebo / no intervention ‐ HSCT, outcome: 1.28 IP ‐ sensitivity analysis by randomization generation.

Forest plot of comparison: 1 Polyvalent immunoglobulins vs. placebo / no intervention ‐ HSCT, outcome: 1.29 IP ‐ sensitivity analysis by blinding.

Forest plot of comparison: 1 Polyvalent immunoglobulins vs. placebo / no intervention ‐ HSCT, outcome: 1.15 Infection‐related Mortality.

Forest plot of comparison: 1 Polyvalent immunoglobulins vs. placebo / no intervention ‐ HSCT, outcome: 1.16 Acute GVHD.

Forest plot of comparison: 1 Polyvalent immunoglobulins vs. placebo / no intervention ‐ HSCT, outcome: 1.17 VOD.

Forest plot of comparison: 1 Polyvalent immunoglobulins vs. placebo / no intervention ‐ HSCT, outcome: 1.19 VOD according to type of transplant.

Forest plot of comparison: 1 Polyvalent immunoglobulins vs. placebo / no intervention ‐ HSCT, outcome: 1.26 VOD ‐ sensitivity analysis according to randomization generation.

Forest plot of comparison: 1 Polyvalent immunoglobulins vs. placebo / no intervention ‐ HSCT, outcome: 1.27 VOD ‐ sensitivity analysis by blinding.

Forest plot of comparison: 1 Polyvalent immunoglobulins vs. placebo / no intervention ‐ HSCT, outcome: 1.18 Adverse Events.

Forest plot of comparison: 1 Polyvalent immunoglobulins vs. placebo / no intervention ‐ HSCT, outcome: 1.30 Fungal Infections.

Forest plot of comparison: 1 Polyvalent immunoglobulins vs. placebo / no intervention ‐ HSCT, outcome: 1.31 Bacteremia.

Forest plot of comparison: 2 Hyperimmune CMV‐IVIG vs. placebo / no intervention ‐ HSCT, outcome: 2.1 All‐cause Mortality.

Forest plot of comparison: 2 Hyperimmune CMV‐IVIG vs. placebo / no intervention ‐ HSCT, outcome: 2.2 All‐cause Mortality ‐ 100d (3‐4mo).

Forest plot of comparison: 2 Hyperimmune CMV‐IVIG vs. placebo / no intervention ‐ HSCT, outcome: 2.3 CMV infection.

Forest plot of comparison: 2 Hyperimmune CMV‐IVIG vs. placebo / no intervention ‐ HSCT, outcome: 2.4 Interstitial Pneumonitis.

Forest plot of comparison: 2 Hyperimmune CMV‐IVIG vs. placebo / no intervention ‐ HSCT, outcome: 2.5 Infection‐related Mortality.

Forest plot of comparison: 2 Hyperimmune CMV‐IVIG vs. placebo / no intervention ‐ HSCT, outcome: 2.6 Acute GVHD.

Forest plot of comparison: 2 Hyperimmune CMV‐IVIG vs. placebo / no intervention ‐ HSCT, outcome: 2.8 Fungal Infections.

Forest plot of comparison: 3 Polyvalent immunoglobulins or hyperimmune CMV‐IVIG vs. placebo / no intervention ‐ HSCT, outcome: 3.1 All‐cause Mortality.

Forest plot of comparison: 3 Polyvalent immunoglobulins or hyperimmune CMV‐IVIG vs. placebo / no intervention ‐ HSCT, outcome: 3.2 All‐cause Mortality ‐ 100d (3‐4 mo).

Forest plot of comparison: 3 Polyvalent immunoglobulins or hyperimmune CMV‐IVIG vs. placebo / no intervention ‐ HSCT, outcome: 3.3 CMV infection.

Forest plot of comparison: 3 Polyvalent immunoglobulins or hyperimmune CMV‐IVIG vs. placebo / no intervention ‐ HSCT, outcome: 3.4 Interstitial Pneumonitis.

Forest plot of comparison: 3 Polyvalent immunoglobulins or hyperimmune CMV‐IVIG vs. placebo / no intervention ‐ HSCT, outcome: 3.5 Infection‐related Mortality.

Forest plot of comparison: 3 Polyvalent immunoglobulins or hyperimmune CMV‐IVIG vs. placebo / no intervention ‐ HSCT, outcome: 3.6 Acute GVHD.

Forest plot of comparison: 3 Polyvalent immunoglobulins or hyperimmune CMV‐IVIG vs. placebo / no intervention ‐ HSCT, outcome: 3.7 Adverse Events.

Forest plot of comparison: 4 Polyvalent immunoglobulins vs. hyperimmune CMV‐IVIG ‐ HSCT, outcome: 4.1 All‐cause Mortality.

Forest plot of comparison: 4 Polyvalent immunoglobulins vs. hyperimmune CMV‐IVIG ‐ HSCT, outcome: 4.3 CMV Infection.

Forest plot of comparison: 4 Polyvalent immunoglobulins vs. hyperimmune CMV‐IVIG ‐ HSCT, outcome: 4.4 Interstitial Pneumonitis.

Forest plot of comparison: 4 Polyvalent immunoglobulins vs. hyperimmune CMV‐IVIG ‐ HSCT, outcome: 4.5 Infection‐related Mortality.

Forest plot of comparison: 4 Polyvalent immunoglobulins vs. hyperimmune CMV‐IVIG ‐ HSCT, outcome: 4.6 Acute GVHD.

Forest plot of comparison: 5 Polyvalent immunoglobulins 250mg/kg vs. Polyvalent immunoglobulins or hyperimmune CMV‐IVIG 500mg/kg ‐ HSCT, outcome: 5.2 Clinically documented Infection.

Forest plot of comparison: 5 Polyvalent immunoglobulins 250mg/kg vs. Polyvalent immunoglobulins or hyperimmune CMV‐IVIG 500mg/kg ‐ HSCT, outcome: 5.3 Microbiologically documented Infection.

Forest plot of comparison: 5 Polyvalent immunoglobulins 250mg/kg vs. Polyvalent immunoglobulins or hyperimmune CMV‐IVIG 500mg/kg ‐ HSCT, outcome: 5.5 Interstitial Pneumonitis.

Forest plot of comparison: 5 Polyvalent immunoglobulins 250mg/kg vs. Polyvalent immunoglobulins or hyperimmune CMV‐IVIG 500mg/kg ‐ HSCT, outcome: 5.8 Acute GVHD.

Forest plot of comparison: 6 Polyvalent immunoglobulins vs. placebo / no intervention ‐ MM/CLL, outcome: 6.1 All‐cause Mortality.

Forest plot of comparison: 6 Polyvalent immunoglobulins vs. placebo / no intervention ‐ MM/CLL, outcome: 6.2 Clinically‐documented infections.

Forest plot of comparison: 6 Polyvalent immunoglobulins vs. placebo / no intervention ‐ MM/CLL, outcome: 6.3 Microbiologically‐documented infections.

Forest plot of comparison: 6 Polyvalent immunoglobulins vs. placebo / no intervention ‐ MM/CLL, outcome: 6.4 Bacteremia.

Forest plot of comparison: 6 Polyvalent immunoglobulins vs. placebo / no intervention ‐ MM/CLL, outcome: 6.6 Adverse Events.

Forest plot of comparison: 6 Polyvalent immunoglobulins vs. placebo / no intervention ‐ MM/CLL, outcome: 6.7 Adverse Events requiring discontinuation.

Comparison 1: Polyvalent immunoglobulins vs. placebo / no intervention ‐ HSCT, Outcome 1: All‐cause Mortality

Comparison 1: Polyvalent immunoglobulins vs. placebo / no intervention ‐ HSCT, Outcome 2: All cause mortality 100 days

Comparison 1: Polyvalent immunoglobulins vs. placebo / no intervention ‐ HSCT, Outcome 3: All‐cause Mortality at 1‐2years and more

Comparison 1: Polyvalent immunoglobulins vs. placebo / no intervention ‐ HSCT, Outcome 4: All‐cause Mortality ‐ by type of HSCT

Comparison 1: Polyvalent immunoglobulins vs. placebo / no intervention ‐ HSCT, Outcome 5: All cause mortality ‐by use of antifungal prophylaxis

Comparison 1: Polyvalent immunoglobulins vs. placebo / no intervention ‐ HSCT, Outcome 6: All‐cause Mortality ‐ high dose IVIG

Comparison 1: Polyvalent immunoglobulins vs. placebo / no intervention ‐ HSCT, Outcome 7: All‐cause Mortality ‐sensitivity analysis by randomization generation

Comparison 1: Polyvalent immunoglobulins vs. placebo / no intervention ‐ HSCT, Outcome 8: All‐cause Mortality ‐sensitivity analysis by double blinding

Comparison 1: Polyvalent immunoglobulins vs. placebo / no intervention ‐ HSCT, Outcome 9: Clinically documented infections

Comparison 1: Polyvalent immunoglobulins vs. placebo / no intervention ‐ HSCT, Outcome 10: Microbiologically documented infections ‐ bacterial

Comparison 1: Polyvalent immunoglobulins vs. placebo / no intervention ‐ HSCT, Outcome 11: Microbiologically documented infections ‐ patient months

Comparison 1: Polyvalent immunoglobulins vs. placebo / no intervention ‐ HSCT, Outcome 12: CMV infections

Comparison 1: Polyvalent immunoglobulins vs. placebo / no intervention ‐ HSCT, Outcome 13: CMV infections ‐ patient months

Comparison 1: Polyvalent immunoglobulins vs. placebo / no intervention ‐ HSCT, Outcome 14: Interstitial Pneumonitis

Comparison 1: Polyvalent immunoglobulins vs. placebo / no intervention ‐ HSCT, Outcome 15: Infection‐related Mortality

Comparison 1: Polyvalent immunoglobulins vs. placebo / no intervention ‐ HSCT, Outcome 16: Acute GVHD

Comparison 1: Polyvalent immunoglobulins vs. placebo / no intervention ‐ HSCT, Outcome 17: VOD

Comparison 1: Polyvalent immunoglobulins vs. placebo / no intervention ‐ HSCT, Outcome 18: Adverse Events

Comparison 1: Polyvalent immunoglobulins vs. placebo / no intervention ‐ HSCT, Outcome 19: VOD according to type of transplant

Comparison 1: Polyvalent immunoglobulins vs. placebo / no intervention ‐ HSCT, Outcome 20: CMV Infections and Interstitial pneumonitis

Comparison 1: Polyvalent immunoglobulins vs. placebo / no intervention ‐ HSCT, Outcome 21: acute GVHD and VOD

Comparison 1: Polyvalent immunoglobulins vs. placebo / no intervention ‐ HSCT, Outcome 22: All‐cause Mortality ‐sensitivity analysis by ITT

Comparison 1: Polyvalent immunoglobulins vs. placebo / no intervention ‐ HSCT, Outcome 23: CMV Infections, Interstitial pneumonitis and VOD

Comparison 1: Polyvalent immunoglobulins vs. placebo / no intervention ‐ HSCT, Outcome 24: Clinically Documented Infections‐ sensitivity analysis by randomization generation

Comparison 1: Polyvalent immunoglobulins vs. placebo / no intervention ‐ HSCT, Outcome 25: Clinically documented infections ‐ sensitivity analysis by blinding

Comparison 1: Polyvalent immunoglobulins vs. placebo / no intervention ‐ HSCT, Outcome 26: VOD ‐ sensitivity analysis according to randomization generation

Comparison 1: Polyvalent immunoglobulins vs. placebo / no intervention ‐ HSCT, Outcome 27: VOD ‐ sensitivity analysis by blinding

Comparison 1: Polyvalent immunoglobulins vs. placebo / no intervention ‐ HSCT, Outcome 28: IP ‐ sensitivity analysis by randomization generation

Comparison 1: Polyvalent immunoglobulins vs. placebo / no intervention ‐ HSCT, Outcome 29: IP ‐ sensitivity analysis by blinding

Comparison 1: Polyvalent immunoglobulins vs. placebo / no intervention ‐ HSCT, Outcome 30: Fungal Infections

Comparison 1: Polyvalent immunoglobulins vs. placebo / no intervention ‐ HSCT, Outcome 31: Bacteremia

Comparison 2: Hyperimmune CMV‐IVIG vs. placebo / no intervention ‐ HSCT, Outcome 1: All‐cause Mortality

Comparison 2: Hyperimmune CMV‐IVIG vs. placebo / no intervention ‐ HSCT, Outcome 2: All‐cause Mortality ‐ 100d (3‐4mo)

Comparison 2: Hyperimmune CMV‐IVIG vs. placebo / no intervention ‐ HSCT, Outcome 3: CMV infection

Comparison 2: Hyperimmune CMV‐IVIG vs. placebo / no intervention ‐ HSCT, Outcome 4: Interstitial Pneumonitis

Comparison 2: Hyperimmune CMV‐IVIG vs. placebo / no intervention ‐ HSCT, Outcome 5: Infection‐related Mortality

Comparison 2: Hyperimmune CMV‐IVIG vs. placebo / no intervention ‐ HSCT, Outcome 6: Acute GVHD

Comparison 2: Hyperimmune CMV‐IVIG vs. placebo / no intervention ‐ HSCT, Outcome 7: Adverse Events

Comparison 2: Hyperimmune CMV‐IVIG vs. placebo / no intervention ‐ HSCT, Outcome 8: Fungal Infections

Comparison 2: Hyperimmune CMV‐IVIG vs. placebo / no intervention ‐ HSCT, Outcome 9: Bacteremia

Comparison 3: Polyvalent immunoglobulins or hyperimmune CMV‐IVIG vs. placebo / no intervention ‐ HSCT, Outcome 1: All‐cause Mortality

Comparison 3: Polyvalent immunoglobulins or hyperimmune CMV‐IVIG vs. placebo / no intervention ‐ HSCT, Outcome 2: All‐cause Mortality ‐ 100d (3‐4 mo)

Comparison 3: Polyvalent immunoglobulins or hyperimmune CMV‐IVIG vs. placebo / no intervention ‐ HSCT, Outcome 3: CMV infection

Comparison 3: Polyvalent immunoglobulins or hyperimmune CMV‐IVIG vs. placebo / no intervention ‐ HSCT, Outcome 4: Interstitial Pneumonitis

Comparison 3: Polyvalent immunoglobulins or hyperimmune CMV‐IVIG vs. placebo / no intervention ‐ HSCT, Outcome 5: Infection‐related Mortality

Comparison 3: Polyvalent immunoglobulins or hyperimmune CMV‐IVIG vs. placebo / no intervention ‐ HSCT, Outcome 6: Acute GVHD

Comparison 3: Polyvalent immunoglobulins or hyperimmune CMV‐IVIG vs. placebo / no intervention ‐ HSCT, Outcome 7: Adverse Events

Comparison 4: Polyvalent immunoglobulins vs. hyperimmune CMV‐IVIG ‐ HSCT, Outcome 1: All‐cause Mortality

Comparison 4: Polyvalent immunoglobulins vs. hyperimmune CMV‐IVIG ‐ HSCT, Outcome 2: Clinically documented Infection

Comparison 4: Polyvalent immunoglobulins vs. hyperimmune CMV‐IVIG ‐ HSCT, Outcome 3: CMV Infection

Comparison 4: Polyvalent immunoglobulins vs. hyperimmune CMV‐IVIG ‐ HSCT, Outcome 4: Interstitial Pneumonitis

Comparison 4: Polyvalent immunoglobulins vs. hyperimmune CMV‐IVIG ‐ HSCT, Outcome 5: Infection‐related Mortality

Comparison 4: Polyvalent immunoglobulins vs. hyperimmune CMV‐IVIG ‐ HSCT, Outcome 6: Acute GVHD

Comparison 5: Polyvalent immunoglobulins 250mg/kg vs. Polyvalent immunoglobulins or hyperimmune CMV‐IVIG 500mg/kg ‐ HSCT, Outcome 1: All‐cause Mortality

Comparison 5: Polyvalent immunoglobulins 250mg/kg vs. Polyvalent immunoglobulins or hyperimmune CMV‐IVIG 500mg/kg ‐ HSCT, Outcome 2: Clinically documented Infection

Comparison 5: Polyvalent immunoglobulins 250mg/kg vs. Polyvalent immunoglobulins or hyperimmune CMV‐IVIG 500mg/kg ‐ HSCT, Outcome 3: Microbiologically documented Infection

Comparison 5: Polyvalent immunoglobulins 250mg/kg vs. Polyvalent immunoglobulins or hyperimmune CMV‐IVIG 500mg/kg ‐ HSCT, Outcome 4: CMV Infection

Comparison 5: Polyvalent immunoglobulins 250mg/kg vs. Polyvalent immunoglobulins or hyperimmune CMV‐IVIG 500mg/kg ‐ HSCT, Outcome 5: Interstitial Pneumonitis

Comparison 5: Polyvalent immunoglobulins 250mg/kg vs. Polyvalent immunoglobulins or hyperimmune CMV‐IVIG 500mg/kg ‐ HSCT, Outcome 6: Infection related Mortality

Comparison 5: Polyvalent immunoglobulins 250mg/kg vs. Polyvalent immunoglobulins or hyperimmune CMV‐IVIG 500mg/kg ‐ HSCT, Outcome 7: Acute GVHD

Comparison 6: Polyvalent immunoglobulins vs. placebo / no intervention ‐ MM/CLL, Outcome 1: All‐cause Mortality

Comparison 6: Polyvalent immunoglobulins vs. placebo / no intervention ‐ MM/CLL, Outcome 2: Clinically‐documented infections

Comparison 6: Polyvalent immunoglobulins vs. placebo / no intervention ‐ MM/CLL, Outcome 3: Microbiologically‐documented infections

Comparison 6: Polyvalent immunoglobulins vs. placebo / no intervention ‐ MM/CLL, Outcome 4: Bacteremia

Comparison 6: Polyvalent immunoglobulins vs. placebo / no intervention ‐ MM/CLL, Outcome 5: Infection‐related Mortality

Comparison 6: Polyvalent immunoglobulins vs. placebo / no intervention ‐ MM/CLL, Outcome 6: Adverse Events

Comparison 6: Polyvalent immunoglobulins vs. placebo / no intervention ‐ MM/CLL, Outcome 7: Adverse Events requiring discontinuation

Comparison 6: Polyvalent immunoglobulins vs. placebo / no intervention ‐ MM/CLL, Outcome 8: Clinically and microbiologically documented infections

Comparison 6: Polyvalent immunoglobulins vs. placebo / no intervention ‐ MM/CLL, Outcome 9: Fungal infections

Comparison 6: Polyvalent immunoglobulins vs. placebo / no intervention ‐ MM/CLL, Outcome 10: Bacteremia
| Outcome or subgroup title | No. of studies | No. of participants | Statistical method | Effect size |
| 1.1 All‐cause Mortality Show forest plot | 8 | 1418 | Risk Ratio (M‐H, Fixed, 95% CI) | 0.99 [0.88, 1.12] |
| 1.1.1 2 years and more | 3 | 474 | Risk Ratio (M‐H, Fixed, 95% CI) | 1.00 [0.87, 1.15] |
| 1.1.2 100‐200 days | 5 | 944 | Risk Ratio (M‐H, Fixed, 95% CI) | 0.99 [0.81, 1.20] |
| 1.2 All cause mortality 100 days Show forest plot | 4 | 881 | Risk Ratio (M‐H, Fixed, 95% CI) | 1.03 [0.83, 1.26] |
| 1.3 All‐cause Mortality at 1‐2years and more Show forest plot | 5 | 737 | Risk Ratio (M‐H, Fixed, 95% CI) | 1.07 [0.94, 1.21] |
| 1.4 All‐cause Mortality ‐ by type of HSCT Show forest plot | 6 | 907 | Risk Ratio (M‐H, Fixed, 95% CI) | 1.03 [0.89, 1.18] |
| 1.4.1 allogeneic transplant | 3 | 305 | Risk Ratio (M‐H, Fixed, 95% CI) | 1.07 [0.79, 1.44] |
| 1.4.2 autologous and allo transplant | 2 | 432 | Risk Ratio (M‐H, Fixed, 95% CI) | 0.95 [0.81, 1.10] |
| 1.4.3 autologous alone | 1 | 170 | Risk Ratio (M‐H, Fixed, 95% CI) | 3.93 [1.14, 13.61] |
| 1.5 All cause mortality ‐by use of antifungal prophylaxis Show forest plot | 5 | 758 | Risk Ratio (M‐H, Fixed, 95% CI) | 0.91 [0.79, 1.04] |
| 1.5.1 Use of oral polyene | 2 | 251 | Risk Ratio (M‐H, Fixed, 95% CI) | 1.07 [0.74, 1.53] |
| 1.5.2 no antifungal prophylaxis | 3 | 507 | Risk Ratio (M‐H, Fixed, 95% CI) | 0.88 [0.76, 1.02] |
| 1.6 All‐cause Mortality ‐ high dose IVIG Show forest plot | 3 | 590 | Risk Ratio (M‐H, Fixed, 95% CI) | 1.06 [0.91, 1.23] |
| 1.7 All‐cause Mortality ‐sensitivity analysis by randomization generation Show forest plot | 8 | 1445 | Risk Ratio (M‐H, Fixed, 95% CI) | 0.97 [0.86, 1.09] |
| 1.7.1 randomization generation A | 2 | 370 | Risk Ratio (M‐H, Fixed, 95% CI) | 1.40 [0.88, 2.22] |
| 1.7.2 randomization generation B | 6 | 1075 | Risk Ratio (M‐H, Fixed, 95% CI) | 0.93 [0.83, 1.05] |
| 1.8 All‐cause Mortality ‐sensitivity analysis by double blinding Show forest plot | 8 | 1445 | Risk Ratio (M‐H, Fixed, 95% CI) | 0.97 [0.86, 1.09] |
| 1.8.1 double blinding | 2 | 697 | Risk Ratio (M‐H, Fixed, 95% CI) | 0.94 [0.76, 1.17] |
| 1.8.2 no blinding | 6 | 748 | Risk Ratio (M‐H, Fixed, 95% CI) | 0.99 [0.86, 1.14] |
| 1.9 Clinically documented infections Show forest plot | 5 | 688 | Risk Ratio (M‐H, Fixed, 95% CI) | 1.00 [0.90, 1.10] |
| 1.10 Microbiologically documented infections ‐ bacterial Show forest plot | 7 | 1186 | Risk Ratio (M‐H, Fixed, 95% CI) | 1.00 [0.88, 1.15] |
| 1.11 Microbiologically documented infections ‐ patient months Show forest plot | 6 | 3542 | Risk Ratio (M‐H, Fixed, 95% CI) | 0.97 [0.82, 1.16] |
| 1.12 CMV infections Show forest plot | 6 | 986 | Risk Ratio (M‐H, Fixed, 95% CI) | 0.84 [0.66, 1.07] |
| 1.13 CMV infections ‐ patient months Show forest plot | 4 | 2082 | Risk Ratio (M‐H, Fixed, 95% CI) | 0.70 [0.49, 1.02] |
| 1.14 Interstitial Pneumonitis Show forest plot | 7 | 990 | Risk Ratio (M‐H, Fixed, 95% CI) | 0.64 [0.45, 0.89] |
| 1.15 Infection‐related Mortality Show forest plot | 3 | 275 | Risk Ratio (M‐H, Fixed, 95% CI) | 0.64 [0.28, 1.49] |
| 1.16 Acute GVHD Show forest plot | 7 | 989 | Risk Ratio (M‐H, Fixed, 95% CI) | 0.93 [0.83, 1.04] |
| 1.17 VOD Show forest plot | 4 | 447 | Risk Ratio (M‐H, Fixed, 95% CI) | 2.73 [1.11, 6.71] |
| 1.18 Adverse Events Show forest plot | 5 | 728 | Risk Ratio (M‐H, Fixed, 95% CI) | 8.12 [3.15, 20.97] |
| 1.19 VOD according to type of transplant Show forest plot | 4 | 447 | Risk Ratio (M‐H, Fixed, 95% CI) | 2.73 [1.11, 6.71] |
| 1.19.1 allo | 3 | 277 | Risk Ratio (M‐H, Fixed, 95% CI) | 2.04 [0.76, 5.49] |
| 1.19.2 auto | 1 | 170 | Risk Ratio (M‐H, Fixed, 95% CI) | 11.80 [0.66, 210.03] |
| 1.20 CMV Infections and Interstitial pneumonitis Show forest plot | 8 | Risk Ratio (M‐H, Fixed, 95% CI) | Subtotals only | |
| 1.20.1 CMV infections | 6 | 986 | Risk Ratio (M‐H, Fixed, 95% CI) | 0.84 [0.66, 1.07] |
| 1.20.2 Interstitial pneumonitis | 7 | 990 | Risk Ratio (M‐H, Fixed, 95% CI) | 0.64 [0.45, 0.89] |
| 1.21 acute GVHD and VOD Show forest plot | 9 | Risk Ratio (M‐H, Fixed, 95% CI) | Subtotals only | |
| 1.21.1 Acute GVHD | 7 | 989 | Risk Ratio (M‐H, Fixed, 95% CI) | 0.93 [0.83, 1.04] |
| 1.21.2 VOD | 4 | 447 | Risk Ratio (M‐H, Fixed, 95% CI) | 2.73 [1.11, 6.71] |
| 1.22 All‐cause Mortality ‐sensitivity analysis by ITT Show forest plot | 9 | Risk Ratio (M‐H, Fixed, 95% CI) | Subtotals only | |
| 1.22.1 ITT | 6 | 986 | Risk Ratio (M‐H, Fixed, 95% CI) | 1.04 [0.87, 1.24] |
| 1.22.2 PER PROTOCOL | 3 | 473 | Risk Ratio (M‐H, Fixed, 95% CI) | 0.91 [0.79, 1.06] |
| 1.23 CMV Infections, Interstitial pneumonitis and VOD Show forest plot | 10 | Risk Ratio (M‐H, Fixed, 95% CI) | Subtotals only | |
| 1.23.1 CMV infections | 6 | 986 | Risk Ratio (M‐H, Fixed, 95% CI) | 0.84 [0.66, 1.07] |
| 1.23.2 Interstitial pneumonitis | 7 | 990 | Risk Ratio (M‐H, Fixed, 95% CI) | 0.64 [0.45, 0.89] |
| 1.23.3 VOD | 4 | 447 | Risk Ratio (M‐H, Fixed, 95% CI) | 2.73 [1.11, 6.71] |
| 1.24 Clinically Documented Infections‐ sensitivity analysis by randomization generation Show forest plot | 5 | Risk Ratio (M‐H, Fixed, 95% CI) | Subtotals only | |
| 1.24.1 randomization generation A | 2 | 370 | Risk Ratio (M‐H, Fixed, 95% CI) | 0.99 [0.86, 1.14] |
| 1.24.2 Randomization Generation B | 3 | 318 | Risk Ratio (M‐H, Fixed, 95% CI) | 1.00 [0.86, 1.17] |
| 1.25 Clinically documented infections ‐ sensitivity analysis by blinding Show forest plot | 5 | Risk Ratio (M‐H, Fixed, 95% CI) | Subtotals only | |
| 1.25.1 Double blind | 1 | 200 | Risk Ratio (M‐H, Fixed, 95% CI) | 1.01 [0.91, 1.12] |
| 1.25.2 no blinding | 4 | 488 | Risk Ratio (M‐H, Fixed, 95% CI) | 0.99 [0.86, 1.15] |
| 1.26 VOD ‐ sensitivity analysis according to randomization generation Show forest plot | 4 | 447 | Risk Ratio (M‐H, Fixed, 95% CI) | 2.73 [1.11, 6.71] |
| 1.26.1 Randomization A | 2 | 370 | Risk Ratio (M‐H, Fixed, 95% CI) | 3.35 [1.19, 9.47] |
| 1.26.2 Randomization B | 2 | 77 | Risk Ratio (M‐H, Fixed, 95% CI) | 1.08 [0.16, 7.51] |
| 1.27 VOD ‐ sensitivity analysis by blinding Show forest plot | 4 | 447 | Risk Ratio (M‐H, Fixed, 95% CI) | 2.73 [1.11, 6.71] |
| 1.27.1 double blind | 1 | 200 | Risk Ratio (M‐H, Fixed, 95% CI) | 2.44 [0.76, 7.82] |
| 1.27.2 no blinding | 3 | 247 | Risk Ratio (M‐H, Fixed, 95% CI) | 3.27 [0.78, 13.59] |
| 1.28 IP ‐ sensitivity analysis by randomization generation Show forest plot | 6 | 898 | Risk Ratio (M‐H, Fixed, 95% CI) | 0.61 [0.43, 0.87] |
| 1.28.1 Randomization generation A | 2 | 370 | Risk Ratio (M‐H, Fixed, 95% CI) | 1.66 [0.57, 4.85] |
| 1.28.2 Randomization generation B | 4 | 528 | Risk Ratio (M‐H, Fixed, 95% CI) | 0.52 [0.36, 0.76] |
| 1.29 IP ‐ sensitivity analysis by blinding Show forest plot | 7 | 990 | Risk Ratio (M‐H, Fixed, 95% CI) | 0.64 [0.45, 0.89] |
| 1.29.1 double blind | 1 | 200 | Risk Ratio (M‐H, Fixed, 95% CI) | 1.56 [0.47, 5.19] |
| 1.29.2 no blinding | 6 | 790 | Risk Ratio (M‐H, Fixed, 95% CI) | 0.58 [0.41, 0.82] |
| 1.30 Fungal Infections Show forest plot | 5 | 1031 | Risk Ratio (M‐H, Fixed, 95% CI) | 0.95 [0.72, 1.25] |
| 1.31 Bacteremia Show forest plot | 4 | 653 | Risk Ratio (M‐H, Fixed, 95% CI) | 1.03 [0.93, 1.13] |
| Outcome or subgroup title | No. of studies | No. of participants | Statistical method | Effect size |
| 2.1 All‐cause Mortality Show forest plot | 4 | 288 | Risk Ratio (M‐H, Fixed, 95% CI) | 0.86 [0.63, 1.16] |
| 2.2 All‐cause Mortality ‐ 100d (3‐4mo) Show forest plot | 3 | 234 | Risk Ratio (M‐H, Fixed, 95% CI) | 0.89 [0.64, 1.24] |
| 2.3 CMV infection Show forest plot | 8 | 553 | Risk Ratio (M‐H, Fixed, 95% CI) | 1.02 [0.82, 1.26] |
| 2.4 Interstitial Pneumonitis Show forest plot | 5 | 345 | Risk Ratio (M‐H, Fixed, 95% CI) | 0.95 [0.58, 1.56] |
| 2.5 Infection‐related Mortality Show forest plot | 3 | 234 | Risk Ratio (M‐H, Fixed, 95% CI) | 0.67 [0.34, 1.32] |
| 2.6 Acute GVHD Show forest plot | 5 | 342 | Risk Ratio (M‐H, Fixed, 95% CI) | 1.02 [0.72, 1.44] |
| 2.7 Adverse Events Show forest plot | 1 | 54 | Risk Ratio (M‐H, Fixed, 95% CI) | 7.00 [0.38, 129.34] |
| 2.8 Fungal Infections Show forest plot | 2 | 271 | Risk Ratio (M‐H, Fixed, 95% CI) | 1.02 [0.54, 1.93] |
| 2.9 Bacteremia Show forest plot | 1 | 179 | Risk Ratio (M‐H, Fixed, 95% CI) | 1.76 [1.23, 2.52] |
| Outcome or subgroup title | No. of studies | No. of participants | Statistical method | Effect size |
| 3.1 All‐cause Mortality Show forest plot | 12 | 1706 | Risk Ratio (M‐H, Fixed, 95% CI) | 0.97 [0.87, 1.09] |
| 3.1.1 Polyvalent IVIG | 8 | 1418 | Risk Ratio (M‐H, Fixed, 95% CI) | 0.99 [0.88, 1.12] |
| 3.1.2 CMV‐IVIG | 4 | 288 | Risk Ratio (M‐H, Fixed, 95% CI) | 0.86 [0.63, 1.16] |
| 3.2 All‐cause Mortality ‐ 100d (3‐4 mo) Show forest plot | 8 | 1178 | Risk Ratio (M‐H, Fixed, 95% CI) | 0.96 [0.82, 1.14] |
| 3.2.1 Polyvalent IVIG | 5 | 944 | Risk Ratio (M‐H, Fixed, 95% CI) | 0.99 [0.81, 1.20] |
| 3.2.2 CMV‐IVIG | 3 | 234 | Risk Ratio (M‐H, Fixed, 95% CI) | 0.89 [0.64, 1.24] |
| 3.3 CMV infection Show forest plot | 13 | 1511 | Risk Ratio (M‐H, Fixed, 95% CI) | 0.90 [0.76, 1.06] |
| 3.3.1 Polyvalent IVIG | 6 | 986 | Risk Ratio (M‐H, Fixed, 95% CI) | 0.84 [0.66, 1.07] |
| 3.3.2 CMV‐IVIG | 7 | 525 | Risk Ratio (M‐H, Fixed, 95% CI) | 0.97 [0.78, 1.21] |
| 3.4 Interstitial Pneumonitis Show forest plot | 12 | 1335 | Risk Ratio (M‐H, Fixed, 95% CI) | 0.72 [0.55, 0.95] |
| 3.4.1 Polyvalent IVIG | 7 | 990 | Risk Ratio (M‐H, Fixed, 95% CI) | 0.64 [0.45, 0.89] |
| 3.4.2 CMV‐IVIG | 5 | 345 | Risk Ratio (M‐H, Fixed, 95% CI) | 0.95 [0.58, 1.56] |
| 3.5 Infection‐related Mortality Show forest plot | 6 | 509 | Risk Ratio (M‐H, Fixed, 95% CI) | 0.66 [0.39, 1.12] |
| 3.5.1 Polyvalent IVIG | 3 | 275 | Risk Ratio (M‐H, Fixed, 95% CI) | 0.64 [0.28, 1.49] |
| 3.5.2 CMV‐IVIG | 3 | 234 | Risk Ratio (M‐H, Fixed, 95% CI) | 0.67 [0.34, 1.32] |
| 3.6 Acute GVHD Show forest plot | 12 | 1331 | Risk Ratio (M‐H, Fixed, 95% CI) | 0.94 [0.84, 1.05] |
| 3.6.1 Polyvalent IVIG | 7 | 989 | Risk Ratio (M‐H, Fixed, 95% CI) | 0.93 [0.83, 1.04] |
| 3.6.2 CMV‐IVIG | 5 | 342 | Risk Ratio (M‐H, Fixed, 95% CI) | 1.02 [0.72, 1.44] |
| 3.7 Adverse Events Show forest plot | 6 | 782 | Risk Ratio (M‐H, Fixed, 95% CI) | 8.02 [3.25, 19.78] |
| 3.7.1 Polyvalent IVIG | 5 | 728 | Risk Ratio (M‐H, Fixed, 95% CI) | 8.12 [3.15, 20.97] |
| 3.7.2 CMV‐IVIG | 1 | 54 | Risk Ratio (M‐H, Fixed, 95% CI) | 7.00 [0.38, 129.34] |
| Outcome or subgroup title | No. of studies | No. of participants | Statistical method | Effect size |
| 4.1 All‐cause Mortality Show forest plot | 3 | 212 | Risk Ratio (M‐H, Fixed, 95% CI) | 1.46 [0.92, 2.32] |
| 4.2 Clinically documented Infection Show forest plot | 1 | 128 | Risk Ratio (M‐H, Fixed, 95% CI) | 1.57 [0.89, 2.79] |
| 4.3 CMV Infection Show forest plot | 3 | 212 | Risk Ratio (M‐H, Fixed, 95% CI) | 1.42 [1.07, 1.89] |
| 4.4 Interstitial Pneumonitis Show forest plot | 2 | 163 | Risk Ratio (M‐H, Fixed, 95% CI) | 0.83 [0.40, 1.75] |
| 4.5 Infection‐related Mortality Show forest plot | 2 | 177 | Risk Ratio (M‐H, Fixed, 95% CI) | 3.28 [0.95, 11.26] |
| 4.6 Acute GVHD Show forest plot | 2 | 163 | Risk Ratio (M‐H, Fixed, 95% CI) | 1.23 [0.87, 1.75] |
| Outcome or subgroup title | No. of studies | No. of participants | Statistical method | Effect size |
| 5.1 All‐cause Mortality Show forest plot | 1 | 412 | Risk Ratio (M‐H, Fixed, 95% CI) | 1.02 [0.84, 1.25] |
| 5.2 Clinically documented Infection Show forest plot | 2 | 509 | Risk Ratio (M‐H, Fixed, 95% CI) | 0.89 [0.81, 0.97] |
| 5.3 Microbiologically documented Infection Show forest plot | 2 | 509 | Risk Ratio (M‐H, Fixed, 95% CI) | 1.28 [1.04, 1.57] |
| 5.4 CMV Infection Show forest plot | 1 | 412 | Risk Ratio (M‐H, Fixed, 95% CI) | 0.69 [0.34, 1.41] |
| 5.5 Interstitial Pneumonitis Show forest plot | 2 | 509 | Risk Ratio (M‐H, Fixed, 95% CI) | 0.98 [0.33, 2.92] |
| 5.6 Infection related Mortality Show forest plot | 1 | 412 | Risk Ratio (M‐H, Fixed, 95% CI) | 0.82 [0.47, 1.43] |
| 5.7 Acute GVHD Show forest plot | 3 | 841 | Risk Ratio (M‐H, Fixed, 95% CI) | 1.32 [1.13, 1.55] |
| Outcome or subgroup title | No. of studies | No. of participants | Statistical method | Effect size |
| 6.1 All‐cause Mortality Show forest plot | 2 | 163 | Risk Ratio (M‐H, Fixed, 95% CI) | 1.36 [0.58, 3.19] |
| 6.2 Clinically‐documented infections Show forest plot | 3 | 205 | Risk Ratio (M‐H, Fixed, 95% CI) | 0.49 [0.39, 0.61] |
| 6.3 Microbiologically‐documented infections Show forest plot | 3 | 205 | Risk Ratio (M‐H, Fixed, 95% CI) | 0.71 [0.53, 0.95] |
| 6.4 Bacteremia Show forest plot | 2 | 124 | Risk Ratio (M‐H, Fixed, 95% CI) | 0.65 [0.14, 3.07] |
| 6.5 Infection‐related Mortality Show forest plot | 1 | 82 | Risk Ratio (M‐H, Fixed, 95% CI) | 0.33 [0.01, 7.95] |
| 6.6 Adverse Events Show forest plot | 3 | 205 | Risk Ratio (M‐H, Fixed, 95% CI) | 2.37 [1.74, 3.24] |
| 6.7 Adverse Events requiring discontinuation Show forest plot | 3 | 205 | Risk Ratio (M‐H, Fixed, 95% CI) | 5.43 [0.70, 42.24] |
| 6.8 Clinically and microbiologically documented infections Show forest plot | 3 | 410 | Risk Ratio (M‐H, Fixed, 95% CI) | 0.57 [0.48, 0.69] |
| 6.8.1 Clinically‐documented infections | 3 | 205 | Risk Ratio (M‐H, Fixed, 95% CI) | 0.49 [0.39, 0.61] |
| 6.8.2 Microbiologically‐documented infections | 3 | 205 | Risk Ratio (M‐H, Fixed, 95% CI) | 0.71 [0.53, 0.95] |
| 6.9 Fungal infections Show forest plot | 1 | 81 | Risk Ratio (M‐H, Fixed, 95% CI) | 1.46 [0.26, 8.30] |
| 6.10 Bacteremia Show forest plot | 1 | 82 | Risk Ratio (M‐H, Fixed, 95% CI) | 0.14 [0.01, 2.68] |