Scolaris Content Display Scolaris Content Display

Methodological quality graph: review authors' judgements about each methodological quality item presented as percentages across all included studies.
Figuras y tablas -
Figure 1

Methodological quality graph: review authors' judgements about each methodological quality item presented as percentages across all included studies.

Methodological quality summary: review authors' judgements about each methodological quality item for each included study.
Figuras y tablas -
Figure 2

Methodological quality summary: review authors' judgements about each methodological quality item for each included study.

Forest plot of comparison: 1 Current diagnosis asthma ITT, outcome: 1.1 Multifaceted intervention.
Figuras y tablas -
Figure 3

Forest plot of comparison: 1 Current diagnosis asthma ITT, outcome: 1.1 Multifaceted intervention.

Forest plot of comparison: 1 Current diagnosis asthma ITT, outcome: 1.2 monofaceted intervention.
Figuras y tablas -
Figure 4

Forest plot of comparison: 1 Current diagnosis asthma ITT, outcome: 1.2 monofaceted intervention.

Forest plot of comparison: 2 Current wheezing parental reported ITT, outcome: 2.1 Multifaceted.
Figuras y tablas -
Figure 5

Forest plot of comparison: 2 Current wheezing parental reported ITT, outcome: 2.1 Multifaceted.

Forest plot of comparison: 2 Current wheezing parental reported ITT, outcome: 2.2 monofaceted.
Figuras y tablas -
Figure 6

Forest plot of comparison: 2 Current wheezing parental reported ITT, outcome: 2.2 monofaceted.

Forest plot of comparison: 3 Current nocturnal cough parental reported ITT, outcome: 3.1 Multifaceted.
Figuras y tablas -
Figure 7

Forest plot of comparison: 3 Current nocturnal cough parental reported ITT, outcome: 3.1 Multifaceted.

Forest plot of comparison: 3 Current nocturnal cough parental reported ITT, outcome: 3.2 monofaceted.
Figuras y tablas -
Figure 8

Forest plot of comparison: 3 Current nocturnal cough parental reported ITT, outcome: 3.2 monofaceted.

Comparison 1 Current diagnosis asthma ITT, Outcome 1 Multifaceted intervention.
Figuras y tablas -
Analysis 1.1

Comparison 1 Current diagnosis asthma ITT, Outcome 1 Multifaceted intervention.

Comparison 1 Current diagnosis asthma ITT, Outcome 2 Mono‐faceted intervention.
Figuras y tablas -
Analysis 1.2

Comparison 1 Current diagnosis asthma ITT, Outcome 2 Mono‐faceted intervention.

Comparison 2 Current wheezing parental reported ITT, Outcome 1 Multifaceted.
Figuras y tablas -
Analysis 2.1

Comparison 2 Current wheezing parental reported ITT, Outcome 1 Multifaceted.

Comparison 2 Current wheezing parental reported ITT, Outcome 2 Mono‐faceted.
Figuras y tablas -
Analysis 2.2

Comparison 2 Current wheezing parental reported ITT, Outcome 2 Mono‐faceted.

Comparison 3 Current nocturnal cough parental reported ITT, Outcome 1 Multifaceted.
Figuras y tablas -
Analysis 3.1

Comparison 3 Current nocturnal cough parental reported ITT, Outcome 1 Multifaceted.

Comparison 3 Current nocturnal cough parental reported ITT, Outcome 2 Mono‐faceted.
Figuras y tablas -
Analysis 3.2

Comparison 3 Current nocturnal cough parental reported ITT, Outcome 2 Mono‐faceted.

Comparison 4 Current dyspnoea parental reported ITT, Outcome 1 Multifaceted.
Figuras y tablas -
Analysis 4.1

Comparison 4 Current dyspnoea parental reported ITT, Outcome 1 Multifaceted.

Comparison 5 Sensitivity analyses current asthma on treatment, Outcome 1 Multifaceted interventions.
Figuras y tablas -
Analysis 5.1

Comparison 5 Sensitivity analyses current asthma on treatment, Outcome 1 Multifaceted interventions.

Comparison 5 Sensitivity analyses current asthma on treatment, Outcome 2 Mono‐faceted interventions.
Figuras y tablas -
Analysis 5.2

Comparison 5 Sensitivity analyses current asthma on treatment, Outcome 2 Mono‐faceted interventions.

Comparison 6 Sensitivity analyses current dyspnoea on treatment, Outcome 1 Multifaceted interventions.
Figuras y tablas -
Analysis 6.1

Comparison 6 Sensitivity analyses current dyspnoea on treatment, Outcome 1 Multifaceted interventions.

Comparison 7 Sensitivity analyses current nocturnal cough on treatment, Outcome 1 Multifaceted interventions.
Figuras y tablas -
Analysis 7.1

Comparison 7 Sensitivity analyses current nocturnal cough on treatment, Outcome 1 Multifaceted interventions.

Comparison 7 Sensitivity analyses current nocturnal cough on treatment, Outcome 2 Mono‐faceted interventions.
Figuras y tablas -
Analysis 7.2

Comparison 7 Sensitivity analyses current nocturnal cough on treatment, Outcome 2 Mono‐faceted interventions.

Comparison 8 Sensitivity analyses current wheezing on treatment, Outcome 1 Multifaceted interventions.
Figuras y tablas -
Analysis 8.1

Comparison 8 Sensitivity analyses current wheezing on treatment, Outcome 1 Multifaceted interventions.

Comparison 8 Sensitivity analyses current wheezing on treatment, Outcome 2 Mono‐interventions.
Figuras y tablas -
Analysis 8.2

Comparison 8 Sensitivity analyses current wheezing on treatment, Outcome 2 Mono‐interventions.

Comparison 1. Current diagnosis asthma ITT

Outcome or subgroup title

No. of studies

No. of participants

Statistical method

Effect size

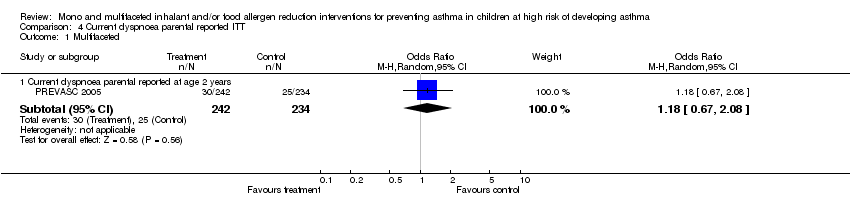
1 Multifaceted intervention Show forest plot

6

Odds Ratio (M‐H, Random, 95% CI)

Subtotals only

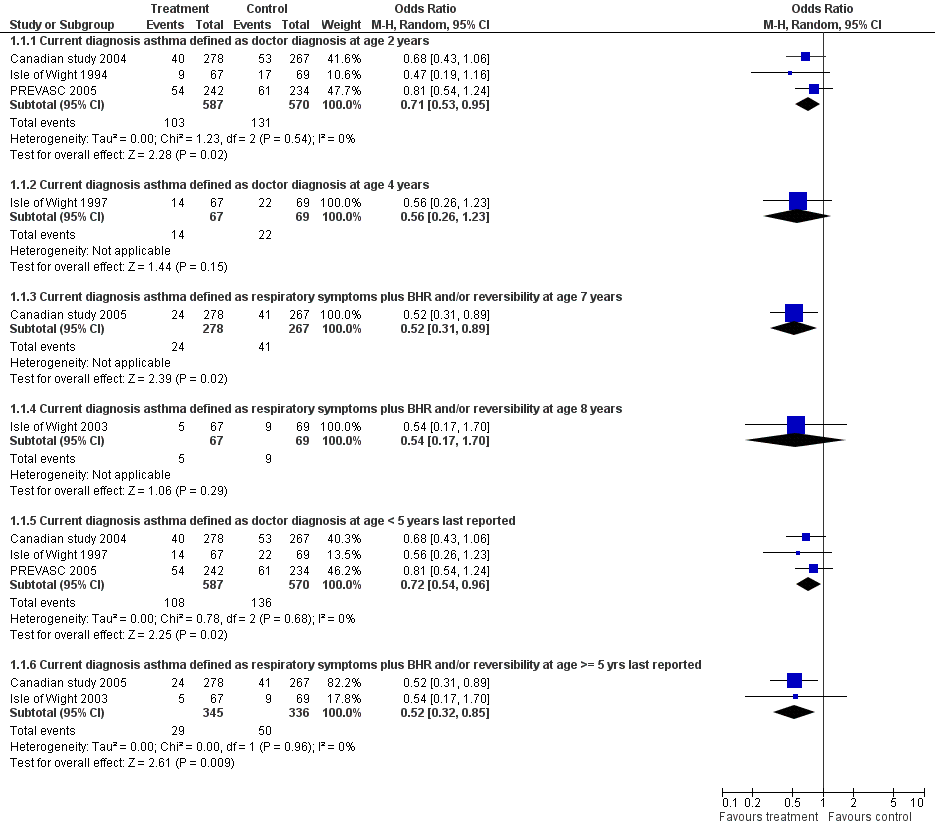
1.1 Current diagnosis asthma defined as doctor diagnosis at age 2 years

3

1157

Odds Ratio (M‐H, Random, 95% CI)

0.71 [0.53, 0.95]

1.2 Current diagnosis asthma defined as doctor diagnosis at age 4 years

1

136

Odds Ratio (M‐H, Random, 95% CI)

0.56 [0.26, 1.23]

1.3 Current diagnosis asthma defined as respiratory symptoms plus BHR and/or reversibility at age 7 years

1

545

Odds Ratio (M‐H, Random, 95% CI)

0.52 [0.31, 0.89]

1.4 Current diagnosis asthma defined as respiratory symptoms plus BHR and/or reversibility at age 8 years

1

136

Odds Ratio (M‐H, Random, 95% CI)

0.54 [0.17, 1.70]

1.5 Current diagnosis asthma defined as doctor diagnosis at age < 5 years last reported

3

1157

Odds Ratio (M‐H, Random, 95% CI)

0.72 [0.54, 0.96]

1.6 Current diagnosis asthma defined as respiratory symptoms plus BHR and/or reversibility at age >= 5 yrs last reported

2

681

Odds Ratio (M‐H, Random, 95% CI)

0.52 [0.32, 0.85]

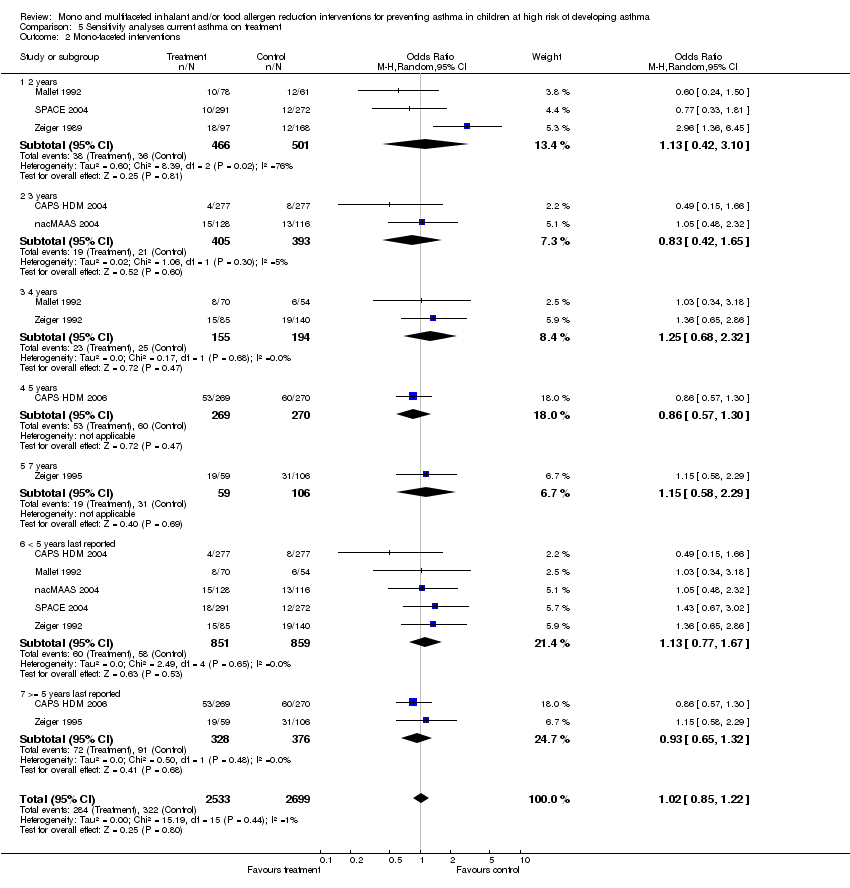
2 Mono‐faceted intervention Show forest plot

8

Odds Ratio (M‐H, Random, 95% CI)

Subtotals only

2.1 Current diagnosis asthma defined as doctor diagnosis at age 2 years

3

1224

Odds Ratio (M‐H, Random, 95% CI)

0.88 [0.48, 1.64]

2.2 Current diagnosis asthma defined as doctor diagnosis at age 3 years

2

872

Odds Ratio (M‐H, Random, 95% CI)

0.84 [0.41, 1.71]

2.3 Current diagnosis asthma defined as doctor diagnosis at age 4 years

2

528

Odds Ratio (M‐H, Random, 95% CI)

1.09 [0.60, 1.98]

2.4 Current diagnosis asthma defined as doctor diagnosis at age 5 years

1

616

Odds Ratio (M‐H, Random, 95% CI)

0.86 [0.57, 1.29]

2.5 Current diagnosis asthma defined as respiratory symptoms plus BHR and/or reversibility at age 7 years

1

357

Odds Ratio (M‐H, Random, 95% CI)

0.73 [0.40, 1.35]

2.6 Current diagnosis asthma defined as doctor diagnosis at age < 5 years last reported

5

2131

Odds Ratio (M‐H, Random, 95% CI)

1.12 [0.76, 1.64]

2.7 Current diagnosis asthma defined as respiratory symptoms plus BHR and/or reversibility at age >= 5 yrs last reported

2

967

Odds Ratio (M‐H, Random, 95% CI)

0.83 [0.59, 1.16]

Figuras y tablas -
Comparison 1. Current diagnosis asthma ITT
Comparison 2. Current wheezing parental reported ITT

Outcome or subgroup title

No. of studies

No. of participants

Statistical method

Effect size

1 Multifaceted Show forest plot

4

Odds Ratio (M‐H, Random, 95% CI)

Subtotals only

1.1 Current wheezing parental reported at age 2 years

2

1021

Odds Ratio (M‐H, Random, 95% CI)

0.81 [0.34, 1.90]

1.2 Current wheezing parental reported at age 7 & 8 years

2

681

Odds Ratio (M‐H, Random, 95% CI)

0.52 [0.30, 0.88]

1.3 Current wheezing parental reported data last reported

3

1157

Odds Ratio (M‐H, Random, 95% CI)

0.53 [0.35, 0.81]

2 Mono‐faceted Show forest plot

4

Odds Ratio (M‐H, Random, 95% CI)

Subtotals only

2.1 Current wheezing parental reported at age 3 years

2

907

Odds Ratio (M‐H, Random, 95% CI)

0.93 [0.65, 1.35]

2.2 Current wheezing parental reported at age 4 years

1

810

Odds Ratio (M‐H, Random, 95% CI)

1.01 [0.50, 2.02]

2.3 Current wheezing parental reported at age 5 years

1

616

Odds Ratio (M‐H, Random, 95% CI)

0.88 [0.60, 1.28]

2.4 Current wheezing parental reported data last reported

3

1717

Odds Ratio (M‐H, Random, 95% CI)

0.90 [0.67, 1.22]

Figuras y tablas -
Comparison 2. Current wheezing parental reported ITT
Comparison 3. Current nocturnal cough parental reported ITT

Outcome or subgroup title

No. of studies

No. of participants

Statistical method

Effect size

1 Multifaceted Show forest plot

3

Odds Ratio (M‐H, Random, 95% CI)

Subtotals only

1.1 Current nocturnal cough parental reported at age 2 years

1

443

Odds Ratio (M‐H, Random, 95% CI)

0.71 [0.47, 1.08]

1.2 Current nocturnal cough parental reported at age 7 & 8 years

2

681

Odds Ratio (M‐H, Random, 95% CI)

0.63 [0.21, 1.92]

1.3 Current nocturnal cough parental reported data last reported

3

1157

Odds Ratio (M‐H, Random, 95% CI)

0.70 [0.42, 1.16]

2 Mono‐faceted Show forest plot

3

Odds Ratio (M‐H, Random, 95% CI)

Subtotals only

2.1 Current nocturnal cough parental reported data last reported

3

1800

Odds Ratio (M‐H, Random, 95% CI)

1.03 [0.77, 1.38]

Figuras y tablas -
Comparison 3. Current nocturnal cough parental reported ITT
Comparison 4. Current dyspnoea parental reported ITT

Outcome or subgroup title

No. of studies

No. of participants

Statistical method

Effect size

1 Multifaceted Show forest plot

1

Odds Ratio (M‐H, Random, 95% CI)

Subtotals only

1.1 Current dyspnoea parental reported at age 2 years

1

476

Odds Ratio (M‐H, Random, 95% CI)

1.18 [0.67, 2.08]

Figuras y tablas -
Comparison 4. Current dyspnoea parental reported ITT
Comparison 5. Sensitivity analyses current asthma on treatment

Outcome or subgroup title

No. of studies

No. of participants

Statistical method

Effect size

1 Multifaceted interventions Show forest plot

5

1624

Odds Ratio (M‐H, Random, 95% CI)

0.67 [0.52, 0.86]

1.1 < 5 years last reported

3

1039

Odds Ratio (M‐H, Random, 95% CI)

0.73 [0.55, 0.98]

1.2 >= 5 years last reported

2

585

Odds Ratio (M‐H, Random, 95% CI)

0.52 [0.32, 0.85]

2 Mono‐faceted interventions Show forest plot

8

5232

Odds Ratio (M‐H, Random, 95% CI)

1.02 [0.85, 1.22]

2.1 2 years

3

967

Odds Ratio (M‐H, Random, 95% CI)

1.13 [0.42, 3.10]

2.2 3 years

2

798

Odds Ratio (M‐H, Random, 95% CI)

0.83 [0.42, 1.65]

2.3 4 years

2

349

Odds Ratio (M‐H, Random, 95% CI)

1.25 [0.68, 2.32]

2.4 5 years

1

539

Odds Ratio (M‐H, Random, 95% CI)

0.86 [0.57, 1.30]

2.5 7 years

1

165

Odds Ratio (M‐H, Random, 95% CI)

1.15 [0.58, 2.29]

2.6 < 5 years last reported

5

1710

Odds Ratio (M‐H, Random, 95% CI)

1.13 [0.77, 1.67]

2.7 >= 5 years last reported

2

704

Odds Ratio (M‐H, Random, 95% CI)

0.93 [0.65, 1.32]

Figuras y tablas -
Comparison 5. Sensitivity analyses current asthma on treatment
Comparison 6. Sensitivity analyses current dyspnoea on treatment

Outcome or subgroup title

No. of studies

No. of participants

Statistical method

Effect size

1 Multifaceted interventions Show forest plot

1

443

Odds Ratio (M‐H, Random, 95% CI)

0.65 [0.39, 1.08]

1.1 last reported

1

443

Odds Ratio (M‐H, Random, 95% CI)

0.65 [0.39, 1.08]

Figuras y tablas -
Comparison 6. Sensitivity analyses current dyspnoea on treatment
Comparison 7. Sensitivity analyses current nocturnal cough on treatment

Outcome or subgroup title

No. of studies

No. of participants

Statistical method

Effect size

1 Multifaceted interventions Show forest plot

3

1028

Odds Ratio (M‐H, Random, 95% CI)

0.73 [0.46, 1.16]

1.1 Last reported

3

1028

Odds Ratio (M‐H, Random, 95% CI)

0.73 [0.46, 1.16]

2 Mono‐faceted interventions Show forest plot

3

1405

Odds Ratio (M‐H, Random, 95% CI)

0.91 [0.67, 1.22]

2.1 Last reported

3

1405

Odds Ratio (M‐H, Random, 95% CI)

0.91 [0.67, 1.22]

Figuras y tablas -
Comparison 7. Sensitivity analyses current nocturnal cough on treatment
Comparison 8. Sensitivity analyses current wheezing on treatment

Outcome or subgroup title

No. of studies

No. of participants

Statistical method

Effect size

1 Multifaceted interventions Show forest plot

4

2560

Odds Ratio (M‐H, Random, 95% CI)

0.60 [0.45, 0.80]

1.1 2 years

2

947

Odds Ratio (M‐H, Random, 95% CI)

0.89 [0.33, 2.40]

1.2 7 & 8 years

2

585

Odds Ratio (M‐H, Random, 95% CI)

0.53 [0.31, 0.91]

1.3 Last reported

3

1028

Odds Ratio (M‐H, Random, 95% CI)

0.54 [0.36, 0.83]

2 Mono‐interventions Show forest plot

4

3316

Odds Ratio (M‐H, Random, 95% CI)

0.87 [0.72, 1.06]

2.1 3 & 4 years

3

1396

Odds Ratio (M‐H, Random, 95% CI)

0.89 [0.64, 1.23]

2.2 5 years

1

539

Odds Ratio (M‐H, Random, 95% CI)

0.88 [0.59, 1.29]

2.3 Last reported

3

1381

Odds Ratio (M‐H, Random, 95% CI)

0.85 [0.63, 1.15]

Figuras y tablas -
Comparison 8. Sensitivity analyses current wheezing on treatment