Cromoscopia versus endoscopia convencional para la detección de pólipos en el colon y el recto
Appendices
Appendix 1. Cochrane Central Register of Controlled Trials search strategy
Cochrane Central Register of Controlled Trials (CENTRAL) (the Cochrane Library), issue 10 2015.
#1 MeSH descriptor: [Colon] explode all trees
#2 MeSH descriptor: [Rectum] explode all trees
#3 MeSH descriptor: [Anal Canal] explode all trees
#4 MeSH descriptor: [Colorectal Neoplasms] explode all trees
#5 MeSH descriptor: [Colonic Polyps] explode all trees
#6 ((colorect* or colon* or large bowel or rect* or anal or anus or gastric*) and (polyp* or neoplas* or tumour* or tumor or adenom* or lesion* or carcinom* adenocarcinom* or cancer*)):ti,ab,kw
#7 (#1 or #2 or #3 or #4 or #5 or #6)
#8 MeSH descriptor: [Endoscopy, Gastrointestinal] explode all trees
#9 (endoscop* or colonoscop* or proctoscop* or gastroscop*):ti,ab,kw
#10 (#8 or #9)
#11 MeSH descriptor: [Indigo Carmine] explode all trees
#12 MeSH descriptor: [Coloring Agents] explode all trees
#13 (chromoscop* or chromo‐endoscop* or chromoendoscop* or magnifying endoscop* or high resolution endoscop* or high resolution colonoscop* or dye spray* or dye‐spray* or indigo* or indigo‐carmine or acetic acid):ti,ab,kw
#14 #11 or #12 or #13)
#15 (#7 and #10 and #14)
Appendix 2. MEDLINE search strategy
MEDLINE (Ovid) 1950 to 26.10.2015
1. exp Colon/
2. exp Rectum/
3. exp Anal Canal/
4. exp Colorectal Neoplasms/
5. exp Colonic Polyps/
6. ((colorect* or colon* or large bowel or rect* or anal or anus or gastric*) and (polyp* or neoplas* or tumour* or tumor or adenom* or lesion* or carcinom* adenocarcinom* or cancer*)).mp.
7. 1 or 2 or 3 or 4 or 5 or 6
8. exp Endoscopy, Gastrointestinal/
9. (endoscop* or colonoscop* or proctoscop* or gastroscop*).mp.
10. 8 or 9
11. exp Indigo Carmine/
12. exp Coloring Agents/
13. (chromoscop* or chromo‐endoscop* or chromoendoscop* or magnifying endoscop* or high resolution endoscop* or high resolution colonoscop* or dye spray* or dye‐spray* or indigo* or indigo‐carmine or acetic acid).mp.
14. 11 or 12 or 13
15. 7 and 10 and 14
16. randomized controlled trial.pt.
17. controlled clinical trial.pt.
18. randomized.ab.
19. placebo.ab.
20. clinical trial.sh.
21. randomly.ab.
22. trial.ti.
23. 16 or 17 or 18 or 19 or 20 or 21 or 22
24. humans.sh.
25. 23 and 24
26. 15 and 25
Appendix 3. EMBASE search strategy
EMBASE (Ovid) 1974 to 26.10.2015
1. exp colon/
2. exp rectum/
3. exp colon tumor/
4. exp rectum tumor/
5. exp intestine polyp/
6. ((colorect* or colon* or large bowel or rect* or anal or anus) and (polyp* or neoplas* or tumour* or tumor or adenom* or lesion* or carcinom* adenocarcinom* or cancer*)).m_titl.
7. 1 or 2 or 3 or 4 or 5 or 6
8. exp gastrointestinal endoscopy/
9. exp gastroscope/
10. exp proctoscope/
11. exp colonoscope/
12. (endoscop* or colonoscop* or proctoscop* or gastroscop*).mp.
13. 8 or 9 or 10 or 11 or 12
14. exp coloring agent/
15. exp chromo‐endoscopy/
16. exp dye/
17. exp high resolution endoscopy/
18. exp magnifying endoscopy/
19. (chromoscop* or chromo‐endoscop* or chromoendoscop* or magnifying endoscop* or high resolution endoscop* or high resolution colonoscop* or dye spray* or dye‐spray* or indigo* or indigo‐carmine or acetic acid).mp.
20. 14 or 15 or 16 or 17 or 18 or 19
21. 7 and 13 and 20
22. CROSSOVER PROCEDURE.sh.
23. DOUBLE‐BLIND PROCEDURE.sh.
24. SINGLE‐BLIND PROCEDURE.sh.
25. (crossover* or cross over*).ti,ab.
26. placebo*.ti,ab.
27. (doubl* adj blind*).ti,ab.
28. allocat*.ti,ab.
29. trial.ti.
30. RANDOMIZED CONTROLLED TRIAL.sh.
31. random*.ti,ab.
32. 22 or 23 or 24 or 25 or 26 or 27 or 28 or 29 or 30 or 31
33. (exp animal/ or exp invertebrate/ or animal.hw. or nonhuman/) not (exp human/ or human cell/ or (human or humans or man or men or woman).ti.)
34. 32 not 33
35. 21 and 34
Appendix 4. Criteria for judging risk of bias in the 'Risk of bias' assessment tool
| RANDOM SEQUENCE GENERATION Selection bias (biased allocation to interventions) due to inadequate generation of a randomised sequence | |
| Criteria for a judgement of ‘Low risk’ of bias | The investigators describe a random component in the sequence generation process such as:
*Minimisation may be implemented without a random element, and this is considered to be equivalent to being random |
| Criteria for a judgement of ‘High risk’ of bias | The investigators describe a non‐random component in the sequence generation process. Usually, the description would involve some systematic, non‐random approach, for example:
|
| Criteria for a judgement of ‘Unclear risk’ of bias | Insufficient information about the sequence generation process to permit judgement of ‘Low risk’ or ‘High risk’ |
| ALLOCATION CONCEALMENT Selection bias (biased allocation to interventions) due to inadequate concealment of allocations prior to assignment | |
| Criteria for a judgement of ‘Low risk’ of bias | Participants and investigators enrolling participants could not foresee assignment because one of the following, or an equivalent method, was used to conceal allocation:
|
| Criteria for a judgement of ‘High risk’ of bias | Participants or investigators enrolling participants could possibly foresee assignments and thus introduce selection bias, such as allocation based on:
|
| Criteria for a judgement of ‘Unclear risk’ of bias | Insufficient information to permit judgement of ‘Low risk’ or ‘High risk’. This is usually the case if the method of concealment is not described or not described in sufficient detail to allow a definite judgement – for example if the use of assignment envelopes is described, but it remains unclear whether envelopes were sequentially numbered, opaque, and sealed |
| BLINDING OF PARTICIPANTS AND PERSONNEL Performance bias due to knowledge of the allocated interventions by participants and personnel during the study | |
| Criteria for a judgement of ‘Low risk’ of bias | Any one of the following:
|
| Criteria for a judgement of ‘High risk’ of bias | Any one of the following:
|
| Criteria for a judgement of ‘Unclear risk’ of bias | Any one of the following:
|
| BLINDING OF OUTCOME ASSESSMENT Detection bias due to knowledge of the allocated interventions by outcome assessors | |
| Criteria for a judgement of ‘Low risk’ of bias | Any one of the following:
|
| Criteria for a judgement of ‘High risk’ of bias | Any one of the following:
|
| Criteria for a judgement of ‘Unclear risk’ of bias | Any one of the following:
|
| INCOMPLETE OUTCOME DATA Attrition bias due to amount, nature, or handling of incomplete outcome data | |
| Criteria for a judgement of ‘Low risk’ of bias | Any one of the following:
|
| Criteria for a judgement of ‘High risk’ of bias | Any one of the following:
|
| Criteria for a judgement of ‘Unclear risk’ of bias | Any one of the following:
|
| SELECTIVE REPORTING Reporting bias due to selective outcome reporting | |
| Criteria for a judgement of ‘Low risk’ of bias | Any of the following:
|
| Criteria for a judgement of ‘High risk’ of bias | Any one of the following:
|
| Criteria for a judgement of ‘Unclear risk’ of bias | Insufficient information to permit judgement of ‘Low risk’ or ‘High risk’. It is likely that the majority of studies will fall into this category. |
| OTHER BIAS Bias due to problems not covered elsewhere in the table | |
| Criteria for a judgement of ‘Low risk’ of bias | The study appears to be free of other sources of bias. |
| Criteria for a judgement of ‘High risk’ of bias | There is at least one important risk of bias. For example, the study:
|
| Criteria for a judgement of ‘Unclear risk’ of bias | There may be a risk of bias, but there is either:
|
Appendix 5. Overall risk of bias
The design of chromoscopy studies has one inherent and unavoidable risk of bias, which is that the participant and investigator cannot be blinded because it is not possible to be unaware that you are using chromoscopy. In some trials one aspect of blinding, that of an increased time taken to carry out the procedure, is controlled for, so that although the risk of bias due to blinding is universal, it has been reduced. Blinding aside, three generic markers of internal validity (random sequence generation, allocation concealment, and selective reporting) are generally good in almost all trials. One generic marker essentially related to intention to treat is unclear from the trial reports of six studies and remains unclear after attempts to contact the authors. Although the lack of blinding is known to influence the overall results, we would suggest that given the general low risk or unclear risk of bias in the other domains, the overall risk of bias is neither high nor low, which justifies our overall grading as unclear.

Methodological quality graph: review authors' judgements about each methodological quality item presented as percentages across all included studies.

Methodological quality summary: review authors' judgements about each methodological quality item for each included study.

Study flow diagram.
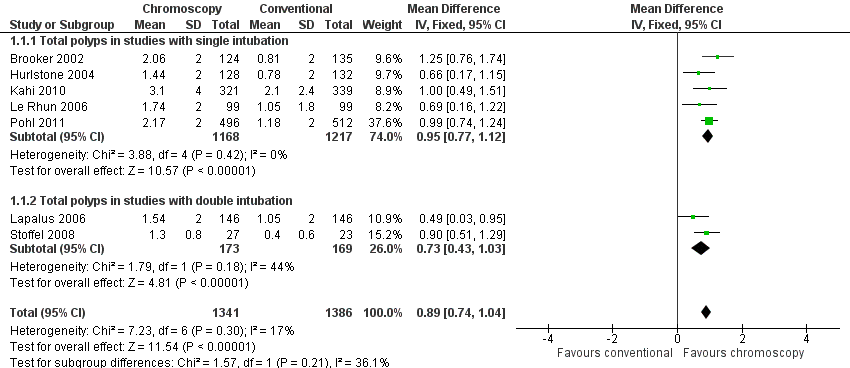
Forest plot of comparison: 1 Total number polyps (neoplastic and non‐neoplastic) detected, outcome: 1.1 Total polyps (neoplastic and non‐neoplastic) detected.

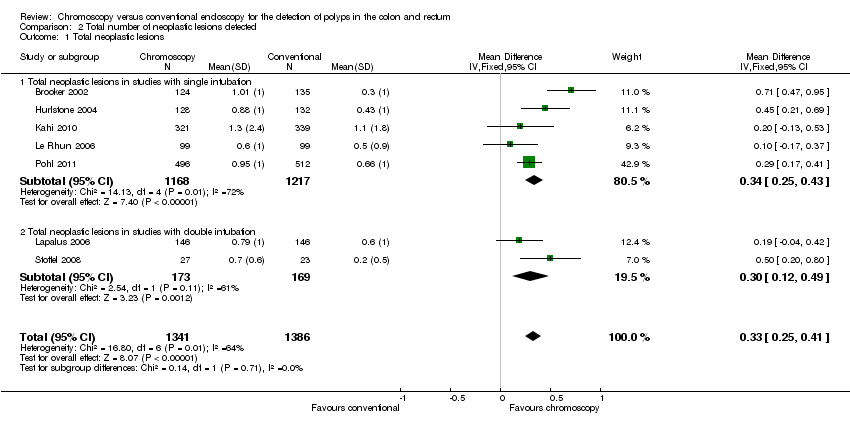
Forest plot of comparison: 2 Total number of neoplastic lesions detected, outcome: 2.1 Total neoplastic lesions.

Forest plot of comparison: 3 Total number of participants with at least one polyp (neoplastic or non‐neoplastic) detected, outcome: 3.1 Number of participants with at least one polyp (neoplastic or non‐neoplastic) detected.
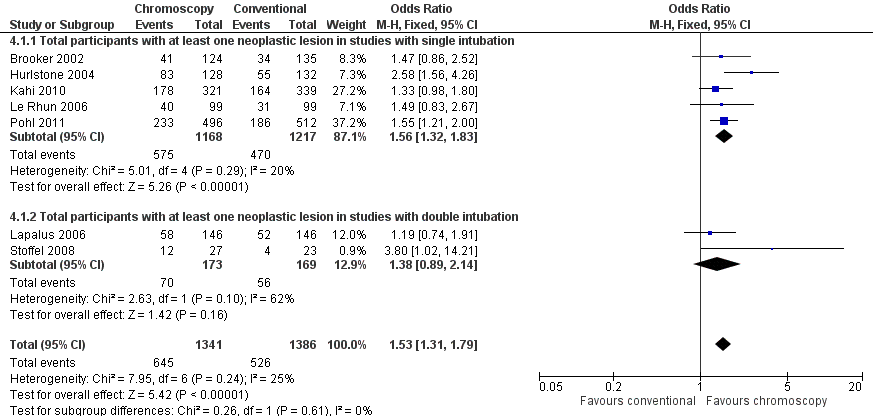
Forest plot of comparison: 4 Total number of participants with at least one neoplastic lesion detected, outcome: 4.1 Total participants with at least one neoplastic lesion.

Comparison 1 Total number polyps (neoplastic and non‐neoplastic) detected, Outcome 1 Total polyps (neoplastic and non‐neoplastic) detected.

Comparison 1 Total number polyps (neoplastic and non‐neoplastic) detected, Outcome 2 Total polyps (neoplastic and non‐neoplastic) in proximal colon.

Comparison 1 Total number polyps (neoplastic and non‐neoplastic) detected, Outcome 3 Total polyps (neoplastic and non‐neoplastic) in distal colon.
Comparison 2 Total number of neoplastic lesions detected, Outcome 1 Total neoplastic lesions.

Comparison 2 Total number of neoplastic lesions detected, Outcome 2 Total neoplastic lesions in proximal colon.
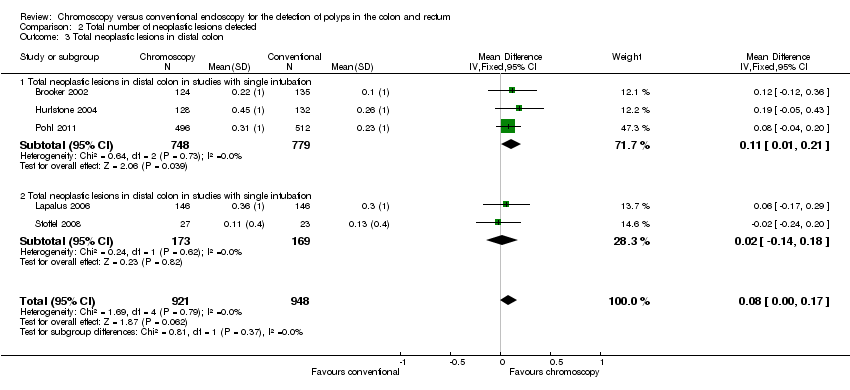
Comparison 2 Total number of neoplastic lesions detected, Outcome 3 Total neoplastic lesions in distal colon.
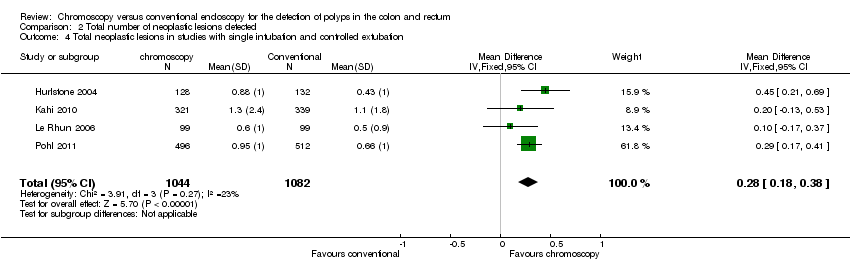
Comparison 2 Total number of neoplastic lesions detected, Outcome 4 Total neoplastic lesions in studies with single intubation and controlled extubation.

Comparison 3 Total number of participants with at least one polyp (neoplastic or non‐neoplastic) detected, Outcome 1 Number of participants with at least one polyp (neoplastic or non‐neoplastic) detected.
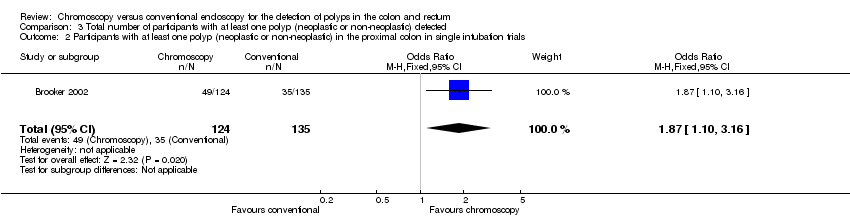
Comparison 3 Total number of participants with at least one polyp (neoplastic or non‐neoplastic) detected, Outcome 2 Participants with at least one polyp (neoplastic or non‐neoplastic) in the proximal colon in single intubation trials.

Comparison 3 Total number of participants with at least one polyp (neoplastic or non‐neoplastic) detected, Outcome 3 Participants with at least one polyp (neoplastic or non‐neoplastic) in the distal colon in single intubation trials.
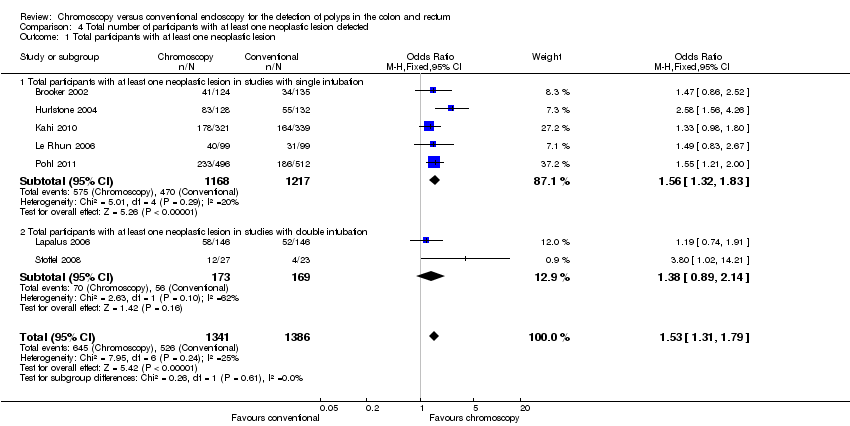
Comparison 4 Total number of participants with at least one neoplastic lesion detected, Outcome 1 Total participants with at least one neoplastic lesion.

Comparison 4 Total number of participants with at least one neoplastic lesion detected, Outcome 2 Participants with at least one neoplastic lesion in proximal colon.

Comparison 4 Total number of participants with at least one neoplastic lesion detected, Outcome 3 Participants with at least one neoplastic lesion in the distal colon.
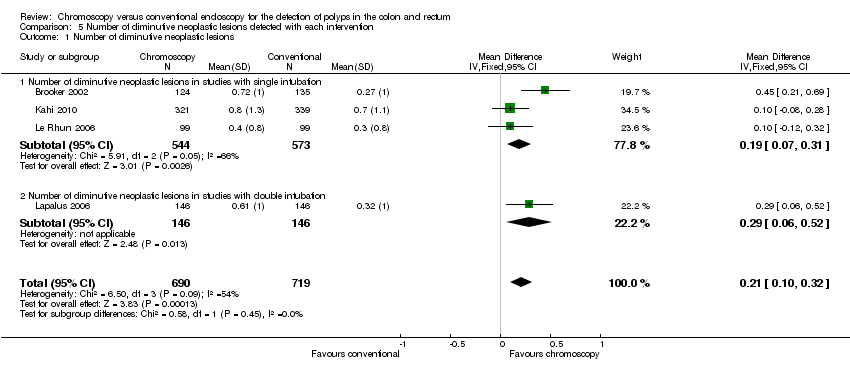
Comparison 5 Number of diminutive neoplastic lesions detected with each intervention, Outcome 1 Number of diminutive neoplastic lesions.

Comparison 5 Number of diminutive neoplastic lesions detected with each intervention, Outcome 2 Number of diminutive neoplastic lesions in the proximal colon.

Comparison 5 Number of diminutive neoplastic lesions detected with each intervention, Outcome 3 Number of diminutive neoplastic lesions in the distal colon.

Comparison 6 Number of participants with at least one diminutive neoplastic lesion detected with each intervention, Outcome 1 Participants with diminutive neoplastic lesions.
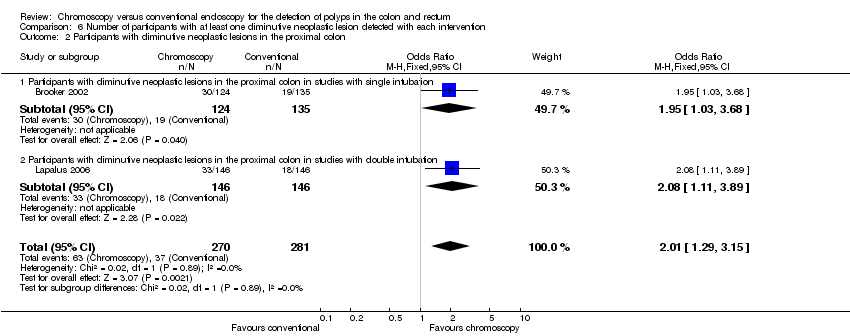
Comparison 6 Number of participants with at least one diminutive neoplastic lesion detected with each intervention, Outcome 2 Participants with diminutive neoplastic lesions in the proximal colon.

Comparison 6 Number of participants with at least one diminutive neoplastic lesion detected with each intervention, Outcome 3 Participants with diminutive neoplastic lesions in the distal colon.

Comparison 7 Number of participants with three or more neoplastic lesions detected with each intervention, Outcome 1 Number of participants with 3 or more adenomas.
| Chromoscopy compared to conventional colonoscopy for the detection of polyps | |||||
| Patient or population: people undergoing colonoscopy for the detection of polyps Settings: those patients undergoing endoscopy for investigation of gastrointestinal symptoms, as part of a screening programme or surveillance for colorectal neoplasia due to a family history of colorectal cancer, previous polyp detection, or a previous colorectal cancer resection Intervention: pan‐chromoscopy Comparison: conventional colonoscopy | |||||
| Outcomes | Illustrative comparative risks* (95% CI) | Relative effect | No of Participants | Quality of the evidence | |
| Assumed risk | Corresponding risk | ||||
| Conventional colonoscopy | Pan‐chromoscopy | ||||
| Total polyps (neoplastic and non‐neoplastic) detected | The mean total polyps ranged across control groups from | The mean total polyps in the intervention group was | MD 0.89 (0.74 to 1.04) | 2727 (7) | ⊕⊕⊝⊝ |
| Total neoplastic lesions | The mean total neoplastic lesions ranged across control groups from | The mean total neoplastic lesions in the intervention groups was | MD 0.33 (0.25 to 0.41) | 2727 (7) | ⊕⊕⊝⊝ |
| Number of participants with at least 1 polyp (neoplastic or non‐neoplastic) | 529 per 1000 | 676 per 1000 | OR 1.87 (1.51 to 2.30) | 1515 (4) | ⊕⊕⊝⊝ |
| Total participants with at least 1 neoplastic lesion | 380 per 1000 | 481 per 1000 | OR 1.53 (1.31 to 1.79) | 2727 (7) | ⊕⊕⊝⊝ |
| Number of diminutive neoplastic lesions | The mean number of diminutive polyps ranged across control groups from | The mean number of diminutive polyps in the intervention groups was | MD 0.21 (0.10 to 0.32) | 1409 (4) | ⊕⊕⊝⊝ |
| Participants with diminutive neoplastic lesions | 170 per 1000 | 236 per 1000 | OR 1.51 (1.19 to 1.92) | 1757 (4) | ⊕⊕⊝⊝ |
| Number of participants with 3 or more adenomas (in studies with single intubation) | 26 per 1000 | 111 per 1000 | OR 4.63 (1.99 to 10.80) | 519 (2) | ⊕⊕⊝⊝ |
| Adverse events | Unestimable as no data supplied | Unestimable as no data supplied | ‐ | ‐ | ‐ |
| *The basis for the assumed risk (e.g. the median control group risk across studies) is provided in footnotes. The corresponding risk (and its 95% confidence interval) is based on the assumed risk in the comparison group and the relative effect of the intervention (and its 95% CI). | |||||
| GRADE Working Group grades of evidence | |||||
| The nature of diminutive polyp detection means that it is likely that some of the included studies are underpowered. Furthermore, significant heterogeneity is introduced by the variability of the colonoscopes used in the studies as well as the differences in dye‐spraying technique. There are also subtle but clear differences in the study inclusion criteria that affect the quality of the pooled evidence. | |||||
| Outcome or subgroup title | No. of studies | No. of participants | Statistical method | Effect size |
| 1 Total polyps (neoplastic and non‐neoplastic) detected Show forest plot | 7 | 2727 | Mean Difference (IV, Fixed, 95% CI) | 0.89 [0.74, 1.04] |
| 1.1 Total polyps in studies with single intubation | 5 | 2385 | Mean Difference (IV, Fixed, 95% CI) | 0.95 [0.77, 1.12] |
| 1.2 Total polyps in studies with double intubation | 2 | 342 | Mean Difference (IV, Fixed, 95% CI) | 0.73 [0.43, 1.03] |
| 2 Total polyps (neoplastic and non‐neoplastic) in proximal colon Show forest plot | 5 | 1521 | Mean Difference (IV, Fixed, 95% CI) | 0.34 [0.24, 0.44] |
| 2.1 Total polyps in proximal colon in studies with single intubation | 3 | 1179 | Mean Difference (IV, Fixed, 95% CI) | 0.31 [0.20, 0.43] |
| 2.2 Total polyps in proximal colon in studies with double intubation | 2 | 342 | Mean Difference (IV, Fixed, 95% CI) | 0.40 [0.22, 0.59] |
| 3 Total polyps (neoplastic and non‐neoplastic) in distal colon Show forest plot | 5 | 1521 | Mean Difference (IV, Fixed, 95% CI) | 0.51 [0.41, 0.60] |
| 3.1 Total polyps in distal colon in studies with single intubation | 3 | 1179 | Mean Difference (IV, Fixed, 95% CI) | 0.62 [0.50, 0.73] |
| 3.2 Total polyps in distal colon in studies with double intubation | 2 | 342 | Mean Difference (IV, Fixed, 95% CI) | 0.29 [0.13, 0.45] |
| Outcome or subgroup title | No. of studies | No. of participants | Statistical method | Effect size |
| 1 Total neoplastic lesions Show forest plot | 7 | 2727 | Mean Difference (IV, Fixed, 95% CI) | 0.33 [0.25, 0.41] |
| 1.1 Total neoplastic lesions in studies with single intubation | 5 | 2385 | Mean Difference (IV, Fixed, 95% CI) | 0.34 [0.25, 0.43] |
| 1.2 Total neoplastic lesions in studies with double intubation | 2 | 342 | Mean Difference (IV, Fixed, 95% CI) | 0.30 [0.12, 0.49] |
| 2 Total neoplastic lesions in proximal colon Show forest plot | 6 | 2529 | Mean Difference (IV, Fixed, 95% CI) | 0.27 [0.19, 0.35] |
| 2.1 Total neoplastic lesions in proximal colon in studies with single intubation | 4 | 2187 | Mean Difference (IV, Fixed, 95% CI) | 0.24 [0.15, 0.33] |
| 2.2 Total neoplastic lesions in proximal colon in studies with double intubation | 2 | 342 | Mean Difference (IV, Fixed, 95% CI) | 0.35 [0.20, 0.50] |
| 3 Total neoplastic lesions in distal colon Show forest plot | 5 | 1869 | Mean Difference (IV, Fixed, 95% CI) | 0.08 [‐0.00, 0.17] |
| 3.1 Total neoplastic lesions in distal colon in studies with single intubation | 3 | 1527 | Mean Difference (IV, Fixed, 95% CI) | 0.11 [0.01, 0.21] |
| 3.2 Total neoplastic lesions in distal colon in studies with single intubation | 2 | 342 | Mean Difference (IV, Fixed, 95% CI) | 0.02 [‐0.14, 0.18] |
| 4 Total neoplastic lesions in studies with single intubation and controlled extubation Show forest plot | 4 | 2126 | Mean Difference (IV, Fixed, 95% CI) | 0.28 [0.18, 0.38] |
| Outcome or subgroup title | No. of studies | No. of participants | Statistical method | Effect size |
| 1 Number of participants with at least one polyp (neoplastic or non‐neoplastic) detected Show forest plot | 4 | 1515 | Odds Ratio (M‐H, Fixed, 95% CI) | 1.87 [1.51, 2.30] |
| 1.1 Number of participants with at least one polyp (neoplastic and non‐neoplastic detected in studies with single intubation | 3 | 1465 | Odds Ratio (M‐H, Fixed, 95% CI) | 1.83 [1.48, 2.27] |
| 1.2 Number of participants with at least one polyp (neoplastic and non‐neoplastic) detected in studies with double intubation | 1 | 50 | Odds Ratio (M‐H, Fixed, 95% CI) | 3.19 [1.00, 10.17] |
| 2 Participants with at least one polyp (neoplastic or non‐neoplastic) in the proximal colon in single intubation trials Show forest plot | 1 | 259 | Odds Ratio (M‐H, Fixed, 95% CI) | 1.87 [1.10, 3.16] |
| 3 Participants with at least one polyp (neoplastic or non‐neoplastic) in the distal colon in single intubation trials Show forest plot | 1 | 259 | Odds Ratio (M‐H, Fixed, 95% CI) | 1.92 [1.14, 3.24] |
| Outcome or subgroup title | No. of studies | No. of participants | Statistical method | Effect size |
| 1 Total participants with at least one neoplastic lesion Show forest plot | 7 | 2727 | Odds Ratio (M‐H, Fixed, 95% CI) | 1.53 [1.31, 1.79] |
| 1.1 Total participants with at least one neoplastic lesion in studies with single intubation | 5 | 2385 | Odds Ratio (M‐H, Fixed, 95% CI) | 1.56 [1.32, 1.83] |
| 1.2 Total participants with at least one neoplastic lesion in studies with double intubation | 2 | 342 | Odds Ratio (M‐H, Fixed, 95% CI) | 1.38 [0.89, 2.14] |
| 2 Participants with at least one neoplastic lesion in proximal colon Show forest plot | 2 | 551 | Odds Ratio (M‐H, Fixed, 95% CI) | 1.55 [1.04, 2.30] |
| 2.1 Participants with at least one neoplastic lesion in the proximal colon in studies with single intubation | 1 | 259 | Odds Ratio (M‐H, Fixed, 95% CI) | 1.53 [0.85, 2.77] |
| 2.2 Participants with at least one neoplastic lesion in the proximal colon in studies with double intubation | 1 | 292 | Odds Ratio (M‐H, Fixed, 95% CI) | 1.56 [0.91, 2.67] |
| 3 Participants with at least one neoplastic lesion in the distal colon Show forest plot | 2 | 551 | Odds Ratio (M‐H, Fixed, 95% CI) | 1.24 [0.79, 1.94] |
| 3.1 Participants with at least one neoplastic lesion in the distal colon in studies with single intubation | 1 | 259 | Odds Ratio (M‐H, Fixed, 95% CI) | 1.37 [0.65, 2.92] |
| 3.2 Participants with at least one neoplastic lesion in the distal colon in studies with double intubation | 1 | 292 | Odds Ratio (M‐H, Fixed, 95% CI) | 1.17 [0.67, 2.05] |
| Outcome or subgroup title | No. of studies | No. of participants | Statistical method | Effect size |
| 1 Number of diminutive neoplastic lesions Show forest plot | 4 | 1409 | Mean Difference (IV, Fixed, 95% CI) | 0.21 [0.10, 0.32] |
| 1.1 Number of diminutive neoplastic lesions in studies with single intubation | 3 | 1117 | Mean Difference (IV, Fixed, 95% CI) | 0.19 [0.07, 0.31] |
| 1.2 Number of diminutive neoplastic lesions in studies with double intubation | 1 | 292 | Mean Difference (IV, Fixed, 95% CI) | 0.29 [0.06, 0.52] |
| 2 Number of diminutive neoplastic lesions in the proximal colon Show forest plot | 2 | 551 | Mean Difference (IV, Fixed, 95% CI) | 0.27 [0.10, 0.44] |
| 2.1 Number of diminutive neoplastic lesions in the proximal colon in studies with single intubation | 1 | 259 | Mean Difference (IV, Fixed, 95% CI) | 0.37 [0.13, 0.61] |
| 2.2 Number of diminutive neoplastic lesions in the proximal colon in studies with double intubation | 1 | 292 | Mean Difference (IV, Fixed, 95% CI) | 0.18 [‐0.05, 0.41] |
| 3 Number of diminutive neoplastic lesions in the distal colon Show forest plot | 2 | 551 | Mean Difference (IV, Fixed, 95% CI) | 0.10 [‐0.07, 0.26] |
| 3.1 Number of diminutive neoplastic lesions in the proximal colon in studies with single intubation | 1 | 259 | Mean Difference (IV, Fixed, 95% CI) | 0.08 [‐0.16, 0.32] |
| 3.2 Number of diminutive neoplastic lesions in the proximal colon in studies with double intubation | 1 | 292 | Mean Difference (IV, Fixed, 95% CI) | 0.11 [‐0.12, 0.34] |
| Outcome or subgroup title | No. of studies | No. of participants | Statistical method | Effect size |
| 1 Participants with diminutive neoplastic lesions Show forest plot | 4 | 1757 | Odds Ratio (M‐H, Fixed, 95% CI) | 1.51 [1.19, 1.92] |
| 1.1 Participants with diminutive neoplastic lesions in studies with single intubation | 3 | 1465 | Odds Ratio (M‐H, Fixed, 95% CI) | 1.46 [1.12, 1.91] |
| 1.2 Participants with diminutive neoplastic lesions in studies with double intubation | 1 | 292 | Odds Ratio (M‐H, Fixed, 95% CI) | 1.73 [1.03, 2.90] |
| 2 Participants with diminutive neoplastic lesions in the proximal colon Show forest plot | 2 | 551 | Odds Ratio (M‐H, Fixed, 95% CI) | 2.01 [1.29, 3.15] |
| 2.1 Participants with diminutive neoplastic lesions in the proximal colon in studies with single intubation | 1 | 259 | Odds Ratio (M‐H, Fixed, 95% CI) | 1.95 [1.03, 3.68] |
| 2.2 Participants with diminutive neoplastic lesions in the proximal colon in studies with double intubation | 1 | 292 | Odds Ratio (M‐H, Fixed, 95% CI) | 2.08 [1.11, 3.89] |
| 3 Participants with diminutive neoplastic lesions in the distal colon Show forest plot | 2 | 551 | Odds Ratio (M‐H, Fixed, 95% CI) | 1.37 [0.81, 2.30] |
| 3.1 Participants with diminutive neoplastic lesions in the distal colon in studies with single intubation | 1 | 259 | Odds Ratio (M‐H, Fixed, 95% CI) | 1.34 [0.56, 3.22] |
| 3.2 Participants with diminutive neoplastic lesions in the distal colon in studies with double intubation | 1 | 292 | Odds Ratio (M‐H, Fixed, 95% CI) | 1.38 [0.72, 2.64] |
| Outcome or subgroup title | No. of studies | No. of participants | Statistical method | Effect size |
| 1 Number of participants with 3 or more adenomas Show forest plot | 5 | 1669 | Odds Ratio (M‐H, Fixed, 95% CI) | 1.34 [0.96, 1.87] |
| 1.1 Number of participants with 3 or more adenomas in studies with single intubation | 2 | 519 | Odds Ratio (M‐H, Fixed, 95% CI) | 4.63 [1.99, 10.80] |
| 1.2 Number of participants with 3 or more adenomas in studies with double intubation | 1 | 292 | Odds Ratio (M‐H, Fixed, 95% CI) | 1.78 [0.68, 4.65] |
| 1.3 Studies that used high definition colonoscopy in the control group | 2 | 858 | Odds Ratio (M‐H, Fixed, 95% CI) | 0.86 [0.57, 1.31] |