Scolaris Content Display Scolaris Content Display

Methodological quality summary: review authors' judgements about each methodological quality item for each included study
Figuras y tablas -
Figure 1

Methodological quality summary: review authors' judgements about each methodological quality item for each included study

Methodological quality graph: review authors' judgements about each methodological quality item presented as percentages across all included studies
Figuras y tablas -
Figure 2

Methodological quality graph: review authors' judgements about each methodological quality item presented as percentages across all included studies

Comparison 1 One type of BF education versus standard/routine care, Outcome 1 Duration of any breastfeeding.
Figuras y tablas -
Analysis 1.1

Comparison 1 One type of BF education versus standard/routine care, Outcome 1 Duration of any breastfeeding.

Comparison 1 One type of BF education versus standard/routine care, Outcome 2 Any breastfeeding at 3 months.
Figuras y tablas -
Analysis 1.2

Comparison 1 One type of BF education versus standard/routine care, Outcome 2 Any breastfeeding at 3 months.

Comparison 1 One type of BF education versus standard/routine care, Outcome 3 Any breastfeeding at 6 months.
Figuras y tablas -
Analysis 1.3

Comparison 1 One type of BF education versus standard/routine care, Outcome 3 Any breastfeeding at 6 months.

Comparison 1 One type of BF education versus standard/routine care, Outcome 4 Exclusive breastfeeding at 3 months.
Figuras y tablas -
Analysis 1.4

Comparison 1 One type of BF education versus standard/routine care, Outcome 4 Exclusive breastfeeding at 3 months.

Comparison 1 One type of BF education versus standard/routine care, Outcome 5 Exclusive breastfeeding at 6 months.
Figuras y tablas -
Analysis 1.5

Comparison 1 One type of BF education versus standard/routine care, Outcome 5 Exclusive breastfeeding at 6 months.

Comparison 1 One type of BF education versus standard/routine care, Outcome 6 Initiation of breastfeeding.
Figuras y tablas -
Analysis 1.6

Comparison 1 One type of BF education versus standard/routine care, Outcome 6 Initiation of breastfeeding.

Comparison 1 One type of BF education versus standard/routine care, Outcome 7 Initiation of BF (cluster‐randomised trial).
Figuras y tablas -
Analysis 1.7

Comparison 1 One type of BF education versus standard/routine care, Outcome 7 Initiation of BF (cluster‐randomised trial).

Comparison 1 One type of BF education versus standard/routine care, Outcome 8 Mastitis.
Figuras y tablas -
Analysis 1.8

Comparison 1 One type of BF education versus standard/routine care, Outcome 8 Mastitis.

Comparison 1 One type of BF education versus standard/routine care, Outcome 9 Breastfeeding complication (nipple pain).
Figuras y tablas -
Analysis 1.9

Comparison 1 One type of BF education versus standard/routine care, Outcome 9 Breastfeeding complication (nipple pain).

Comparison 1 One type of BF education versus standard/routine care, Outcome 10 Breastfeeding complication (nipple trauma).
Figuras y tablas -
Analysis 1.10

Comparison 1 One type of BF education versus standard/routine care, Outcome 10 Breastfeeding complication (nipple trauma).

Comparison 1 One type of BF education versus standard/routine care, Outcome 11 Breastfeeding problems.
Figuras y tablas -
Analysis 1.11

Comparison 1 One type of BF education versus standard/routine care, Outcome 11 Breastfeeding problems.

Comparison 2 One type of BF education versus a different type of BF education, Outcome 1 Any breastfeeding at 3 months.
Figuras y tablas -
Analysis 2.1

Comparison 2 One type of BF education versus a different type of BF education, Outcome 1 Any breastfeeding at 3 months.

Comparison 2 One type of BF education versus a different type of BF education, Outcome 2 Any breastfeeding at 6 months.
Figuras y tablas -
Analysis 2.2

Comparison 2 One type of BF education versus a different type of BF education, Outcome 2 Any breastfeeding at 6 months.

Comparison 2 One type of BF education versus a different type of BF education, Outcome 3 Exclusive breastfeeding at 6 months.
Figuras y tablas -
Analysis 2.3

Comparison 2 One type of BF education versus a different type of BF education, Outcome 3 Exclusive breastfeeding at 6 months.

Comparison 2 One type of BF education versus a different type of BF education, Outcome 4 Initiation of BF.
Figuras y tablas -
Analysis 2.4

Comparison 2 One type of BF education versus a different type of BF education, Outcome 4 Initiation of BF.

Comparison 3 Multiple methods of BF education versus a single method of BF education, Outcome 1 Duration of any breastfeeding (days).
Figuras y tablas -
Analysis 3.1

Comparison 3 Multiple methods of BF education versus a single method of BF education, Outcome 1 Duration of any breastfeeding (days).

Comparison 3 Multiple methods of BF education versus a single method of BF education, Outcome 2 Any breastfeeding at 6 months.
Figuras y tablas -
Analysis 3.2

Comparison 3 Multiple methods of BF education versus a single method of BF education, Outcome 2 Any breastfeeding at 6 months.

Comparison 4 Different combinations of multiple methods of providing BF education, Outcome 1 Any breastfeeding at 4 months (cluster‐randomised trial).
Figuras y tablas -
Analysis 4.1

Comparison 4 Different combinations of multiple methods of providing BF education, Outcome 1 Any breastfeeding at 4 months (cluster‐randomised trial).

Comparison 4 Different combinations of multiple methods of providing BF education, Outcome 2 Exclusive breastfeeding at 3 months.
Figuras y tablas -
Analysis 4.2

Comparison 4 Different combinations of multiple methods of providing BF education, Outcome 2 Exclusive breastfeeding at 3 months.

Comparison 4 Different combinations of multiple methods of providing BF education, Outcome 3 Exclusive breastfeeding at 6 months.
Figuras y tablas -
Analysis 4.3

Comparison 4 Different combinations of multiple methods of providing BF education, Outcome 3 Exclusive breastfeeding at 6 months.

Comparison 5 Multiple methods of BF education versus standard/routine care, Outcome 1 Duration of any breastfeeding (days).
Figuras y tablas -
Analysis 5.1

Comparison 5 Multiple methods of BF education versus standard/routine care, Outcome 1 Duration of any breastfeeding (days).

Comparison 5 Multiple methods of BF education versus standard/routine care, Outcome 2 Exclusive breastfeeding at 3 months.
Figuras y tablas -
Analysis 5.2

Comparison 5 Multiple methods of BF education versus standard/routine care, Outcome 2 Exclusive breastfeeding at 3 months.

Comparison 5 Multiple methods of BF education versus standard/routine care, Outcome 3 Exclusive breastfeeding at six months.
Figuras y tablas -
Analysis 5.3

Comparison 5 Multiple methods of BF education versus standard/routine care, Outcome 3 Exclusive breastfeeding at six months.

Comparison 5 Multiple methods of BF education versus standard/routine care, Outcome 4 Initiation of breastfeeding.
Figuras y tablas -
Analysis 5.4

Comparison 5 Multiple methods of BF education versus standard/routine care, Outcome 4 Initiation of breastfeeding.

Comparison 6 Summary of findings: one type of BF education versus standard/routine care, Outcome 1 Initiation of breastfeeding.
Figuras y tablas -
Analysis 6.1

Comparison 6 Summary of findings: one type of BF education versus standard/routine care, Outcome 1 Initiation of breastfeeding.

Comparison 6 Summary of findings: one type of BF education versus standard/routine care, Outcome 2 Exclusive breastfeeding at 3 months.
Figuras y tablas -
Analysis 6.2

Comparison 6 Summary of findings: one type of BF education versus standard/routine care, Outcome 2 Exclusive breastfeeding at 3 months.

Comparison 6 Summary of findings: one type of BF education versus standard/routine care, Outcome 3 Exclusive breastfeeding at 6 months.
Figuras y tablas -
Analysis 6.3

Comparison 6 Summary of findings: one type of BF education versus standard/routine care, Outcome 3 Exclusive breastfeeding at 6 months.

Comparison 6 Summary of findings: one type of BF education versus standard/routine care, Outcome 4 Any breastfeeding at 3 months.
Figuras y tablas -
Analysis 6.4

Comparison 6 Summary of findings: one type of BF education versus standard/routine care, Outcome 4 Any breastfeeding at 3 months.

Comparison 6 Summary of findings: one type of BF education versus standard/routine care, Outcome 5 Any breastfeeding at 6 months.
Figuras y tablas -
Analysis 6.5

Comparison 6 Summary of findings: one type of BF education versus standard/routine care, Outcome 5 Any breastfeeding at 6 months.

Summary of findings for the main comparison. Antenatal breastfeeding (BF) education versus standard care

BF education versus standard/routine care

Patient or population: pregnant women
Setting: outpatient antenatal care at hospitals and clinics in Australia, Canada, Denmark, Hong Kong, Singapore, UK and USA
Intervention: any antenatal BF education

Comparison: standard/routine care

Outcomes

Anticipated absolute effects* (95% CI)

Relative effect
(95% CI)

№ of participants
(studies)

Quality of the evidence
(GRADE)

Comments

Risk with Standard/routine care

Risk with Summary of findings: One BF education

Initiation of BF

Study population

average RR 1.01
(0.94 to 1.90)

3505
(8 RCTs)

⊕⊕⊕⊕
HIGH 1

We have not downgraded any outcome for lack of blinding. No trial contributing data had adequate blinding of staff and participants

750 per 1000

758 per 1000
(705 to 818)

Proportion of women exclusively BF at 3 months

Study population

RR 1.06
(0.90 to 1.25)

822
(3 RCTs)

⊕⊕⊕⊝
MODERATE 2

376 per 1000

398 per 1000
(338 to 470)

Proportion of women exclusively BF at 6 months

Study population

RR 1.07
(0.87 to 1.30)

2161
(4 RCTs)

⊕⊕⊕⊝
MODERATE 3

154 per 1000

165 per 1000
(134 to 201)

Proportion of women any BF at 3 months

Study population

average RR 0.98
(0.82 to 1.18)

654
(2 RCTs)

⊕⊕⊝⊝
LOW 4 5

609 per 1000

597 per 1000
(500 to 719)

Proportion of women any BF at 6 months

Study population

average RR 1.05
(0.90 to 1.23)

1636
(4 RCTs)

⊕⊕⊕⊕
HIGH6

505 per 1000

531 per 1000
(455 to 621)

Breastfeeding complications

Duffy 1997 (n = 70) reported no group differences for mastitis, but less nipple pain and less nipple trauma for women who had a lactation consultant.2

Kronborg 2012 (n = 1162) reported no group differences as to whether women responded yes when asked about BF problems.3

(2 studies)

Moderate

Both trials compared the intervention with standard care

*The risk in the intervention group (and its 95% confidence interval) is based on the assumed risk in the comparison group and the relative effect of the intervention (and its 95% CI).

CI: Confidence interval; RR: Risk ratio; OR: Odds ratio;

GRADE Working Group grades of evidence
High quality: We are very confident that the true effect lies close to that of the estimate of the effect
Moderate quality: We are moderately confident in the effect estimate: the true effect is likely to be close to the estimate of the effect, but there is a possibility that it is substantially different
Low quality: Our confidence in the effect estimate is limited: the true effect may be substantially different from the estimate of the effect
Very low quality: We have very little confidence in the effect estimate: the true effect is likely to be substantially different from the estimate of effect

1 Statistical heterogeneity I² = 69% (not downgraded)

2 Downgraded for imprecision due to small sample size (‐1).

3 Downgraded for imprecision due to wide confidence intervals crossing the line of no effect (‐1).

4 Statistical heterogeneity I² = 60% (not downgraded)

5 Wide confidence intervals crossing the line of no effect and small sample size (‐2)

6 Statistical heterogeneity I² = 61% (not downgraded)

Figuras y tablas -
Summary of findings for the main comparison. Antenatal breastfeeding (BF) education versus standard care
Comparison 1. One type of BF education versus standard/routine care

Outcome or subgroup title

No. of studies

No. of participants

Statistical method

Effect size

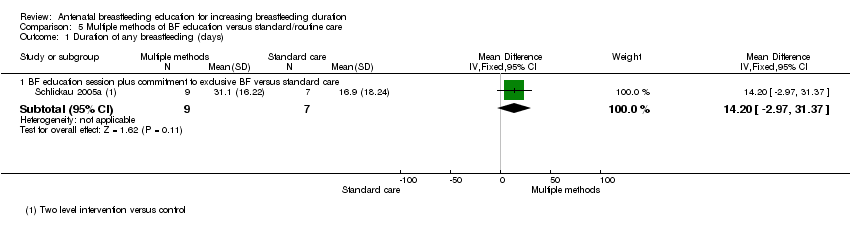
1 Duration of any breastfeeding Show forest plot

2

Mean Difference (IV, Fixed, 95% CI)

Subtotals only

1.1 BF education session versus standard care (weeks)

1

165

Mean Difference (IV, Fixed, 95% CI)

0.0 [‐2.78, 2.78]

1.2 BF education session versus standard care (days)

1

16

Mean Difference (IV, Fixed, 95% CI)

6.20 [‐10.84, 23.24]

2 Any breastfeeding at 3 months Show forest plot

2

Risk Ratio (M‐H, Fixed, 95% CI)

Subtotals only

2.1 BF education workshop versus standard care

1

185

Risk Ratio (M‐H, Fixed, 95% CI)

1.07 [0.92, 1.24]

2.2 BF education session versus standard care

1

469

Risk Ratio (M‐H, Fixed, 95% CI)

0.90 [0.75, 1.07]

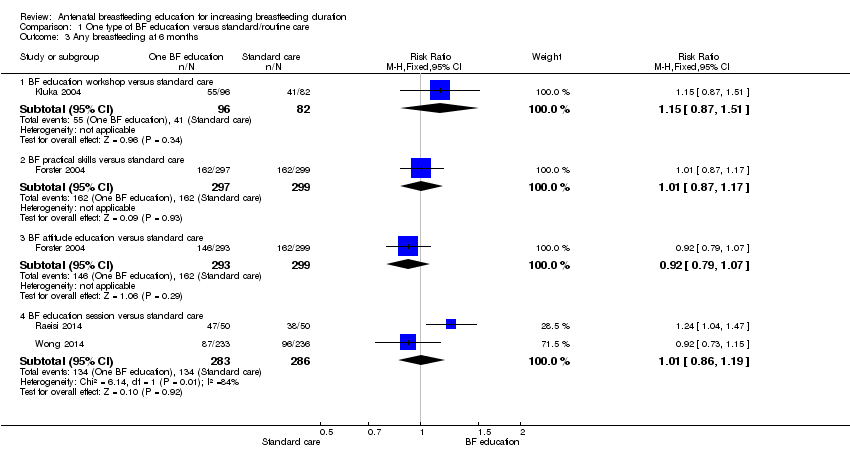
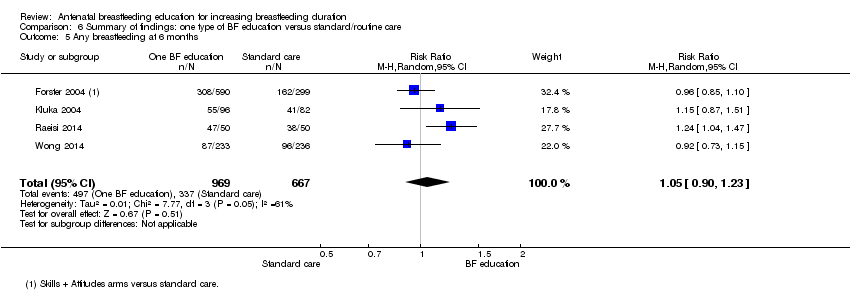
3 Any breastfeeding at 6 months Show forest plot

4

Risk Ratio (M‐H, Fixed, 95% CI)

Subtotals only

3.1 BF education workshop versus standard care

1

178

Risk Ratio (M‐H, Fixed, 95% CI)

1.15 [0.87, 1.51]

3.2 BF practical skills versus standard care

1

596

Risk Ratio (M‐H, Fixed, 95% CI)

1.01 [0.87, 1.17]

3.3 BF attitude education versus standard care

1

592

Risk Ratio (M‐H, Fixed, 95% CI)

0.92 [0.79, 1.07]

3.4 BF education session versus standard care

2

569

Risk Ratio (M‐H, Fixed, 95% CI)

1.01 [0.86, 1.19]

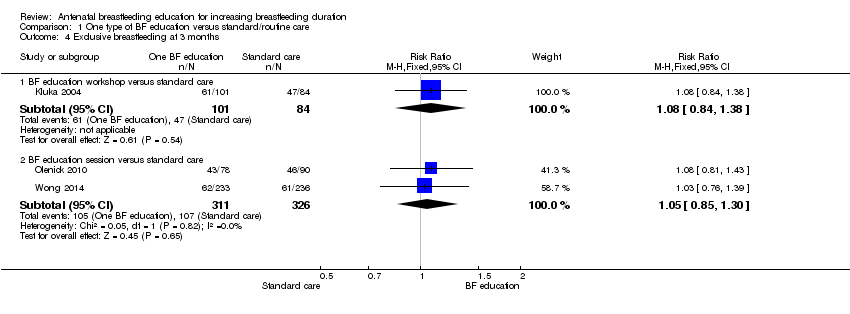
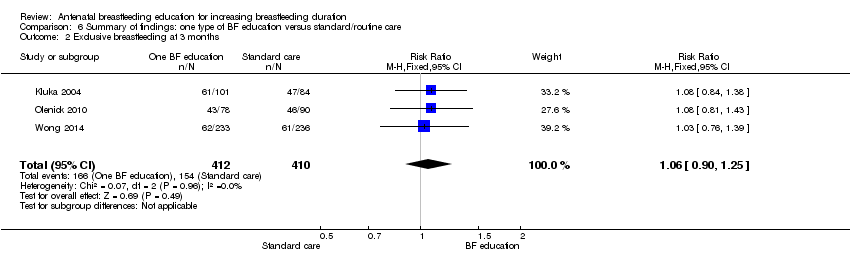
4 Exclusive breastfeeding at 3 months Show forest plot

3

Risk Ratio (M‐H, Fixed, 95% CI)

Subtotals only

4.1 BF education workshop versus standard care

1

185

Risk Ratio (M‐H, Fixed, 95% CI)

1.08 [0.84, 1.38]

4.2 BF education session versus standard care

2

637

Risk Ratio (M‐H, Fixed, 95% CI)

1.05 [0.85, 1.30]

5 Exclusive breastfeeding at 6 months Show forest plot

4

Risk Ratio (M‐H, Fixed, 95% CI)

Subtotals only

5.1 BF education workshop versus standard care

1

178

Risk Ratio (M‐H, Fixed, 95% CI)

1.13 [0.70, 1.80]

5.2 BF practical skills versus standard care

1

596

Risk Ratio (M‐H, Fixed, 95% CI)

1.19 [0.69, 2.05]

5.3 Formal BF attitude versus standard care

1

592

Risk Ratio (M‐H, Fixed, 95% CI)

1.16 [0.67, 2.01]

5.4 BF education session versus standard care

2

1094

Risk Ratio (M‐H, Fixed, 95% CI)

1.02 [0.80, 1.31]

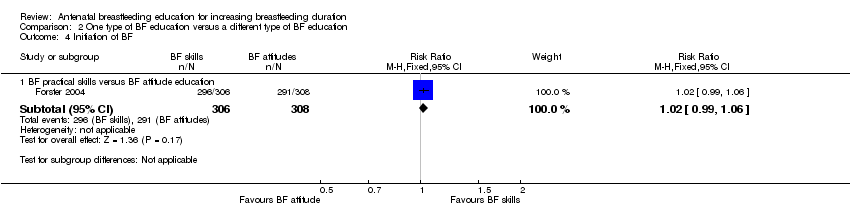
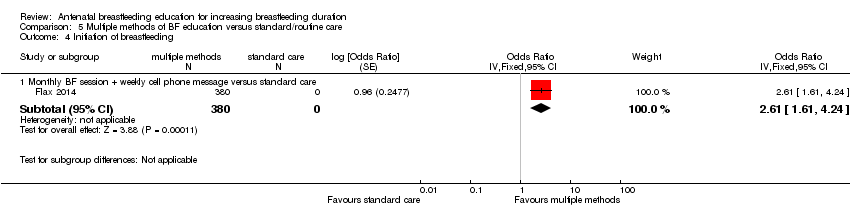
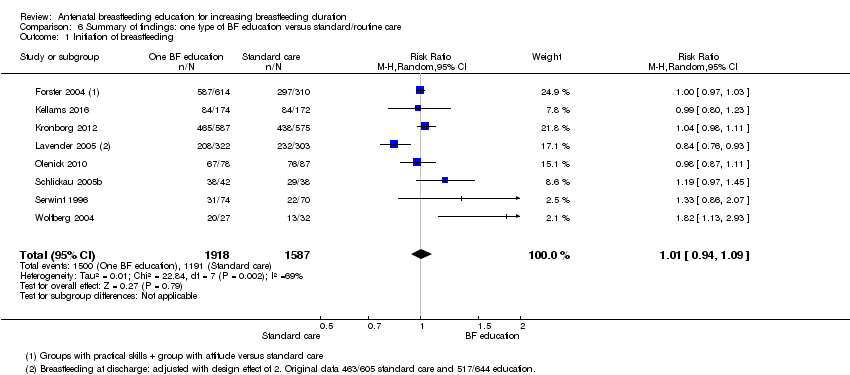
6 Initiation of breastfeeding Show forest plot

7

Risk Ratio (M‐H, Fixed, 95% CI)

Subtotals only

6.1 BF education workshop versus standard care

1

80

Risk Ratio (M‐H, Fixed, 95% CI)

1.19 [0.97, 1.45]

6.2 Peer counselling versus standard care

1

59

Risk Ratio (M‐H, Fixed, 95% CI)

1.82 [1.13, 2.93]

6.3 BF practical skills versus standard care

1

616

Risk Ratio (M‐H, Fixed, 95% CI)

1.01 [0.98, 1.04]

6.4 BF attitude education versus standard care

1

618

Risk Ratio (M‐H, Fixed, 95% CI)

0.99 [0.95, 1.02]

6.5 BF education session versus standard care

2

1327

Risk Ratio (M‐H, Fixed, 95% CI)

1.03 [0.98, 1.09]

6.6 BF education video versus standard care

1

346

Risk Ratio (M‐H, Fixed, 95% CI)

0.99 [0.80, 1.23]

6.7 LC versus standard care

1

144

Risk Ratio (M‐H, Fixed, 95% CI)

1.33 [0.86, 2.07]

7 Initiation of BF (cluster‐randomised trial) Show forest plot

2

Odds Ratio (Fixed, 95% CI)

Subtotals only

7.1 Peer counselling versus standard care

1

2398

Odds Ratio (Fixed, 95% CI)

1.11 [0.86, 1.43]

7.2 Group LC session versus standard care

1

1249

Odds Ratio (Fixed, 95% CI)

1.20 [0.80, 1.80]

8 Mastitis Show forest plot

1

Risk Ratio (M‐H, Fixed, 95% CI)

Subtotals only

8.1 LC versus standard care

1

70

Risk Ratio (M‐H, Fixed, 95% CI)

0.2 [0.01, 4.02]

9 Breastfeeding complication (nipple pain) Show forest plot

1

Mean Difference (IV, Fixed, 95% CI)

Subtotals only

9.1 LC versus standard care

1

70

Mean Difference (IV, Fixed, 95% CI)

‐19.8 [‐23.23, ‐16.37]

10 Breastfeeding complication (nipple trauma) Show forest plot

1

Mean Difference (IV, Fixed, 95% CI)

Subtotals only

10.1 LC versus standard care

1

70

Mean Difference (IV, Fixed, 95% CI)

38.65 [32.95, 44.35]

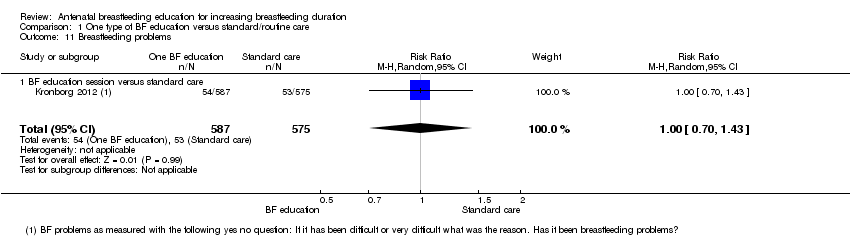
11 Breastfeeding problems Show forest plot

1

1162

Risk Ratio (M‐H, Random, 95% CI)

1.00 [0.70, 1.43]

11.1 BF education session versus standard care

1

1162

Risk Ratio (M‐H, Random, 95% CI)

1.00 [0.70, 1.43]

Figuras y tablas -
Comparison 1. One type of BF education versus standard/routine care
Comparison 2. One type of BF education versus a different type of BF education

Outcome or subgroup title

No. of studies

No. of participants

Statistical method

Effect size

1 Any breastfeeding at 3 months Show forest plot

1

Risk Ratio (M‐H, Fixed, 95% CI)

Subtotals only

1.1 Group education versus individual education

1

74

Risk Ratio (M‐H, Fixed, 95% CI)

2.84 [0.61, 13.18]

2 Any breastfeeding at 6 months Show forest plot

1

Risk Ratio (M‐H, Fixed, 95% CI)

Subtotals only

2.1 BF practical skills versus BF attitude education

1

590

Risk Ratio (M‐H, Fixed, 95% CI)

1.09 [0.94, 1.28]

3 Exclusive breastfeeding at 6 months Show forest plot

1

Risk Ratio (M‐H, Fixed, 95% CI)

Subtotals only

3.1 BF practical skills versus BF attitude education

1

590

Risk Ratio (M‐H, Fixed, 95% CI)

1.03 [0.61, 1.73]

4 Initiation of BF Show forest plot

1

Risk Ratio (M‐H, Fixed, 95% CI)

Subtotals only

4.1 BF practical skills versus BF attitude education

1

614

Risk Ratio (M‐H, Fixed, 95% CI)

1.02 [0.99, 1.06]

Figuras y tablas -
Comparison 2. One type of BF education versus a different type of BF education
Comparison 3. Multiple methods of BF education versus a single method of BF education

Outcome or subgroup title

No. of studies

No. of participants

Statistical method

Effect size

1 Duration of any breastfeeding (days) Show forest plot

1

Mean Difference (IV, Fixed, 95% CI)

Subtotals only

1.1 BF education session plus commitment to exclusive BF versus BF education session

1

18

Mean Difference (IV, Fixed, 95% CI)

8.0 [‐6.84, 22.84]

2 Any breastfeeding at 6 months Show forest plot

1

Risk Ratio (M‐H, Fixed, 95% CI)

Subtotals only

2.1 Video + education session versus pamphlets

1

175

Risk Ratio (M‐H, Fixed, 95% CI)

1.59 [0.86, 2.94]

Figuras y tablas -
Comparison 3. Multiple methods of BF education versus a single method of BF education
Comparison 4. Different combinations of multiple methods of providing BF education

Outcome or subgroup title

No. of studies

No. of participants

Statistical method

Effect size

1 Any breastfeeding at 4 months (cluster‐randomised trial) Show forest plot

1

Odds Ratio (Fixed, 95% CI)

Subtotals only

1.1 LC + BF booklet + 24 h free LC versus BF booklet + phone number for BF questions and problems.

1

698

Odds Ratio (Fixed, 95% CI)

0.82 [0.58, 1.16]

2 Exclusive breastfeeding at 3 months Show forest plot

2

Odds Ratio (Fixed, 95% CI)

Subtotals only

2.1 LC + BF booklet + 24 hrs free LC versus BF booklet + phone number for BF questions and problems.

1

698

Odds Ratio (Fixed, 95% CI)

0.79 [0.57, 1.09]

2.2 BF booklet + video + LC versus BF booklet + video

1

150

Odds Ratio (Fixed, 95% CI)

1.40 [0.70, 2.80]

3 Exclusive breastfeeding at 6 months Show forest plot

1

Odds Ratio (Fixed, 95% CI)

Subtotals only

3.1 BF booklet + video + LC versus BF booklet + video

1

169

Odds Ratio (Fixed, 95% CI)

2.50 [1.00, 6.25]

Figuras y tablas -
Comparison 4. Different combinations of multiple methods of providing BF education
Comparison 5. Multiple methods of BF education versus standard/routine care

Outcome or subgroup title

No. of studies

No. of participants

Statistical method

Effect size

1 Duration of any breastfeeding (days) Show forest plot

1

Mean Difference (IV, Fixed, 95% CI)

Subtotals only

1.1 BF education session plus commitment to exclusive BF versus standard care

1

16

Mean Difference (IV, Fixed, 95% CI)

14.20 [‐2.97, 31.37]

2 Exclusive breastfeeding at 3 months Show forest plot

2

Odds Ratio (Fixed, 95% CI)

Subtotals only

2.1 BF booklet + video + LC versus standard care

1

159

Odds Ratio (Fixed, 95% CI)

2.60 [1.25, 5.40]

2.2 BF booklet + video versus standard care

1

159

Odds Ratio (Fixed, 95% CI)

1.80 [0.80, 4.05]

2.3 Monthly BF session + weekly cell phone message versus standard care

1

390

Odds Ratio (Fixed, 95% CI)

1.80 [1.10, 2.95]

3 Exclusive breastfeeding at six months Show forest plot

2

Odds Ratio (Fixed, 95% CI)

Subtotals only

3.1 BF booklet + video + LC versus standard care

1

175

Odds Ratio (Fixed, 95% CI)

2.40 [1.00, 5.76]

3.2 BF booklet + video versus standard care

1

184

Odds Ratio (Fixed, 95% CI)

0.90 [0.30, 2.70]

3.3 Monthly BF session + weekly cell phone message versus standard care

1

390

Odds Ratio (Fixed, 95% CI)

2.40 [1.40, 4.11]

4 Initiation of breastfeeding Show forest plot

1

Odds Ratio (Fixed, 95% CI)

Subtotals only

4.1 Monthly BF session + weekly cell phone message versus standard care

1

380

Odds Ratio (Fixed, 95% CI)

2.61 [1.61, 4.24]

Figuras y tablas -
Comparison 5. Multiple methods of BF education versus standard/routine care
Comparison 6. Summary of findings: one type of BF education versus standard/routine care

Outcome or subgroup title

No. of studies

No. of participants

Statistical method

Effect size

1 Initiation of breastfeeding Show forest plot

8

3505

Risk Ratio (M‐H, Random, 95% CI)

1.01 [0.94, 1.09]

2 Exclusive breastfeeding at 3 months Show forest plot

3

822

Risk Ratio (M‐H, Fixed, 95% CI)

1.06 [0.90, 1.25]

3 Exclusive breastfeeding at 6 months Show forest plot

4

2161

Risk Ratio (M‐H, Fixed, 95% CI)

1.07 [0.87, 1.30]

4 Any breastfeeding at 3 months Show forest plot

2

654

Risk Ratio (M‐H, Random, 95% CI)

0.98 [0.82, 1.18]

5 Any breastfeeding at 6 months Show forest plot

4

1636

Risk Ratio (M‐H, Random, 95% CI)

1.05 [0.90, 1.23]

Figuras y tablas -
Comparison 6. Summary of findings: one type of BF education versus standard/routine care