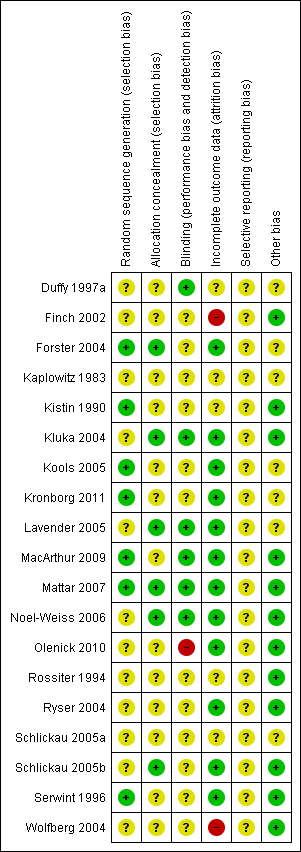
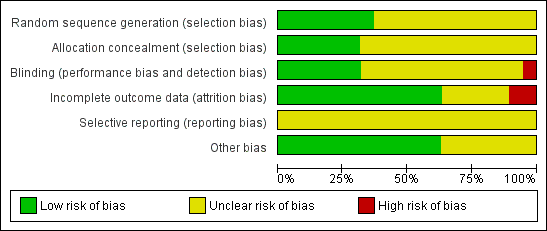
| 1 Initiation rate of breastfeeding Show forest plot | 5 | | Risk Ratio (M‐H, Fixed, 95% CI) | Subtotals only |
|
| 1.1 BF education workshop versus routine care | 1 | 80 | Risk Ratio (M‐H, Fixed, 95% CI) | 1.19 [0.97, 1.45] |
| 1.2 Peer counselling versus routine care | 1 | 59 | Risk Ratio (M‐H, Fixed, 95% CI) | 1.82 [1.13, 2.93] |
| 1.3 BF practical skills versus routine care | 1 | 616 | Risk Ratio (M‐H, Fixed, 95% CI) | 1.01 [0.98, 1.04] |
| 1.4 BF attitude education versus routine care | 1 | 618 | Risk Ratio (M‐H, Fixed, 95% CI) | 0.99 [0.95, 1.02] |
| 1.5 Training programme versus routine care | 1 | 1162 | Risk Ratio (M‐H, Fixed, 95% CI) | 1.04 [0.98, 1.11] |
| 1.6 Structured group prenatal education versus routine care | 1 | 165 | Risk Ratio (M‐H, Fixed, 95% CI) | 0.98 [0.87, 1.11] |
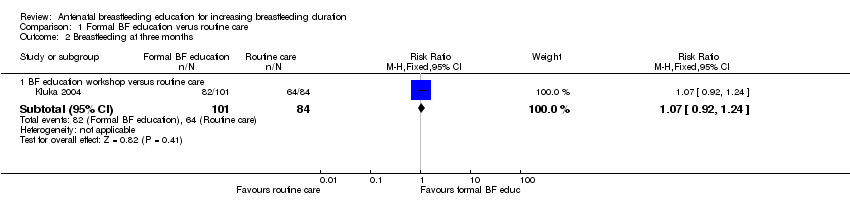
| 2 Breastfeeding at three months Show forest plot | 1 | | Risk Ratio (M‐H, Fixed, 95% CI) | Subtotals only |
|
| 2.1 BF education workshop versus routine care | 1 | 185 | Risk Ratio (M‐H, Fixed, 95% CI) | 1.07 [0.92, 1.24] |
| 3 Breastfeeding at six months Show forest plot | 2 | | Risk Ratio (M‐H, Fixed, 95% CI) | Subtotals only |
|
| 3.1 BF education workshop versus routine care | 1 | 178 | Risk Ratio (M‐H, Fixed, 95% CI) | 1.15 [0.87, 1.51] |
| 3.2 BF practical skills versus routine care | 1 | 596 | Risk Ratio (M‐H, Fixed, 95% CI) | 1.01 [0.87, 1.17] |
| 3.3 BF attitude education versus routine care | 1 | 592 | Risk Ratio (M‐H, Fixed, 95% CI) | 0.92 [0.79, 1.07] |
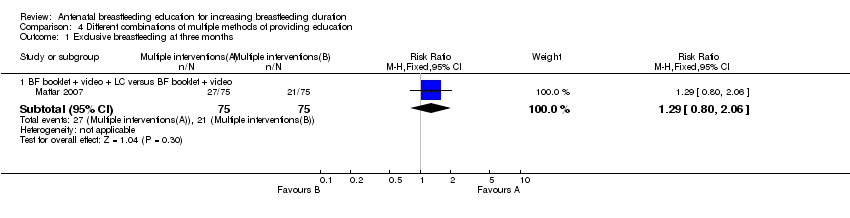
| 4 Exclusive breastfeeding at three months Show forest plot | 2 | | Risk Ratio (M‐H, Fixed, 95% CI) | Subtotals only |
|
| 4.1 BF education workshop versus routine care | 1 | 185 | Risk Ratio (M‐H, Fixed, 95% CI) | 1.08 [0.84, 1.38] |
| 4.2 Structured group prenatal education versus routine care | 1 | 168 | Risk Ratio (M‐H, Fixed, 95% CI) | 1.08 [0.81, 1.43] |
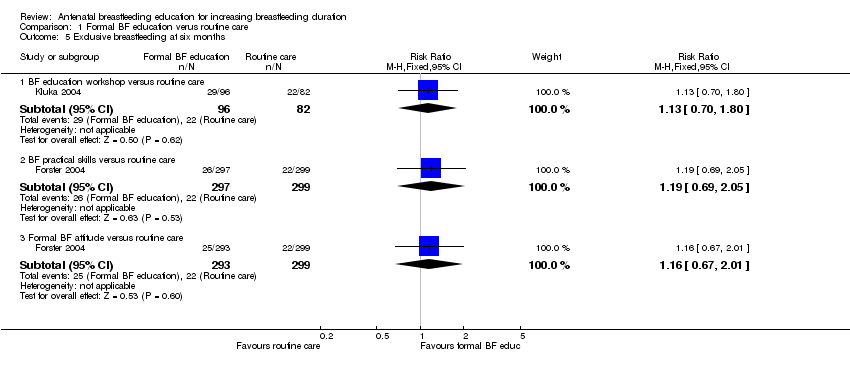
| 5 Exclusive breastfeeding at six months Show forest plot | 2 | | Risk Ratio (M‐H, Fixed, 95% CI) | Subtotals only |
|
| 5.1 BF education workshop versus routine care | 1 | 178 | Risk Ratio (M‐H, Fixed, 95% CI) | 1.13 [0.70, 1.80] |
| 5.2 BF practical skills versus routine care | 1 | 596 | Risk Ratio (M‐H, Fixed, 95% CI) | 1.19 [0.69, 2.05] |
| 5.3 Formal BF attitude versus routine care | 1 | 592 | Risk Ratio (M‐H, Fixed, 95% CI) | 1.16 [0.67, 2.01] |
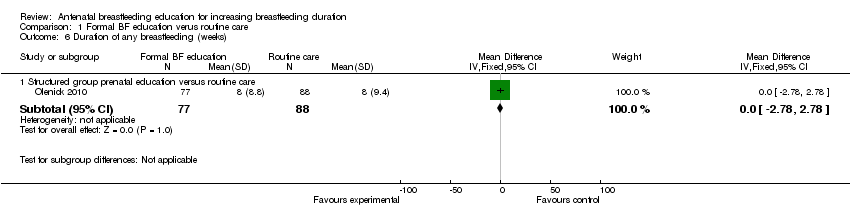
| 6 Duration of any breastfeeding (weeks) Show forest plot | 1 | | Mean Difference (IV, Fixed, 95% CI) | Subtotals only |
|
| 6.1 Structured group prenatal education versus routine care | 1 | 165 | Mean Difference (IV, Fixed, 95% CI) | 0.0 [‐2.78, 2.78] |