| Study | Number | Follow‐up | Diagnosis | Treatment type | CBT or PST | Treatment provider | Treatment frequency | Comparison type | Work outcome |
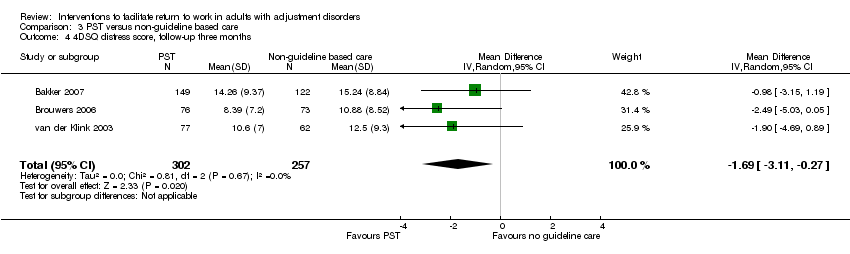
| Bakker 2007; the Netherlands | 227 versus 206 | 12 months | Stress‐related mental disorders measured by means of self reported levels of distress with a validated questionnaire | Individual sessions on: information on the importance of the patient's active role with regard to successful RTW; advice on the content of functional rehabilitation; monitoring of the patient's efforts to translate the (work) situation into a problem that could be solved; referral to specialised care in case of no progressions | PST: translate the (work) situation into a problem that could be solved Work: information on successful RTW; the work situation is translated into a problem that could be solved | 24 primary care physicians trained in the intervention (2 session of 3.5 hours and 2 follow‐up sessions of 2 hours) | 3 consultations within 3 months | Care as usual by primary care physician | Duration of sick leave in calendar days from the first day of sick leave until full RTW, lasting for a period of at least 4 weeks without partial or full relapse into sick leave (self report) |
| Blonk 2006; the Netherlands | 40 versus 21 | 12 months | Adjustment disorders diagnosed with the CIDI | Individual sessions on cognitive restructuring; registration of symptoms and situations; sessions on time‐management, work resumption, workplace interventions, conflict handling and fatigue; assignments related to the work situation | CBT: sessions on cognitive restructuring Work: sessions on work resumption and workplace interventions | Psychologists who followed a highly structured protocol | 11 sessions of 45 minutes (2 sessions a week) | No treatment | The length of time until partial RTW and the length of time until full RTW (register‐based) |
| Blonk work 2006; the Netherlands | 40 versus 21 | 12 months | Adjustment disorders diagnosed with the CIDI | Individual sessions on: psycho education on work stress; registration of symptoms and situations; relaxation; self help books on rational emotive behaviour therapy; time‐management; writing assignments; advice on work processes (setting priorities, planning, conflict management, reducing work demands, delegating tasks, organisation of work); stimulating work resumption | CBT: self help books on rational emotive behaviour therapy Work: advice on work processes; stimulating work resumption | 6 labour experts trained in brief CBT‐based stress management | 5 to 6 1‐hour sessions (2 sessions a week) | No treatment | The length of time until partial RTW and the length of time until full RTW (register‐based) |
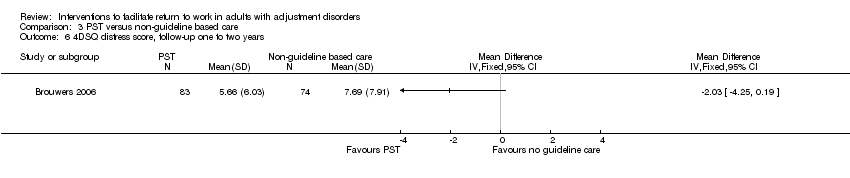
| Brouwers 2006; the Netherlands | 98 versus 96 | 18 months | Emotional distress or minor mental disorders according to GPs and self report | Individual sessions on: acknowledging the problem and accepting responsibility for its resolution; developing and implementing
problem solving strategies, with a special focus on solving work‐related problems and promoting early work resumption; making a daily activity schedule | PST: developing and implementing problem solving strategies Work: focus on work‐related problems and promoting early work resumption | 11 social workers trained in the intervention (3‐day training course with 2 follow‐up sessions) | 5 individual 50‐minute sessions over 10 weeks | Care as usual by the GP | Sick leave duration
(in days), defined as the period between the first
day of absenteeism and the first day of partial and full work resumption (self report) |
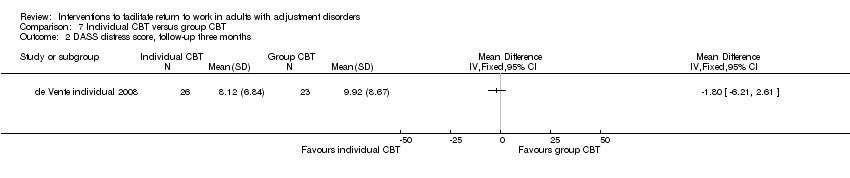
| de Vente group 2008; the Netherlands | 28 versus 13 | 10 months | Symptoms of neurasthenia based on a screening interview | Group sessions and homework assignments on: psycho education; self assessment of stressors and complaints; life style; relaxation techniques; cognitive restructuring; time‐management; goal setting; assertiveness skills; evaluation and relapse prevention | CBT: cognitive restructuring | 12 clinical psychologists trained in the intervention (4 x 1‐hour sessions) | 12 x 1‐hour sessions | Care as usual by the occupational physician and GP | Number of days absent and number of weeks until complete work resumption (self report) |
| de Vente individual 2008; the Netherlands | 28 versus 13 | 10 months | Symptoms of neurasthenia based on a screening interview | Individual sessions and homework assignments on: psycho education; self assessment of stressors and complaints; life style; relaxation techniques; cognitive restructuring; time‐management; goal setting; assertiveness skills; evaluation and relapse prevention | CBT: cognitive restructuring | 12 clinical psychologists trained in the intervention (4 x 1‐hour sessions) | 12 x 2‐hour sessions | Care as usual by the occupational physician and GP | Number of days absent and number of weeks until complete work resumption (self report) |
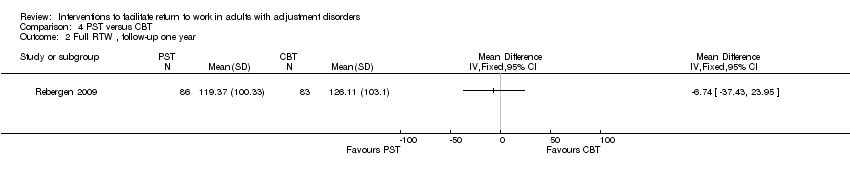
| Rebergen 2009; the Netherlands | 125 versus 115 | 12 months | Symptoms of adjustment disorders based on the DASS (based on unpublished data from author) | Individuals sessions on: information about the origin and cause of loss of control; structuring daily activities developing and implementing problem solving skills and strategies for the causes of stress; gradual RTW | PST: developing and implementing problem solving skills Work: gradual RTW | 5 OPs trained in the intervention (3‐day training course) | Mean number of consultations with OP was 3.4 | Minimal involvement of the OP (same OPs as intervention group) and access to treatment by a psychologist | Duration of sick leave due to mental health problems in calendar days from the moment of inclusion to first (partial or full) and full RTW, respectively, in own or equal earnings; duration of sick leave days until full RTW added with number of days of recurrences on sick leave in the 1‐year follow‐up |
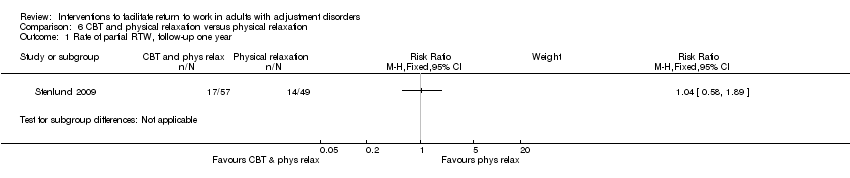
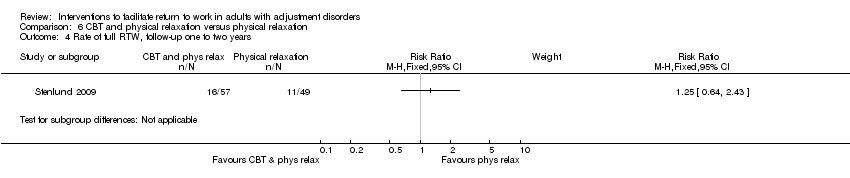
| Stenlund 2009; Sweden | 67 versus 69 | 2 years | Burnout based on psychological examinations at the Stress Clinic | Group session on: education on stress reactions, medication and rest; awareness of reactions and self talk; development of cognitive/behavioural/emotional skills; spiritual issues and life values; preparation for RTW; physical relaxation and mindfulness meditation | CBT: awareness of reactions and self talk Work: preparation for RTW | 1 group leader trained in CBR; 1 physiotherapist | CBR: 30 x 3‐hour sessions over 1 year with short follow‐up meetings 3, 6 and 12 months after the treatment year; Qigong: a 1‐hour session every week during 1 year | Physical relaxation and mindfulness meditation | Sick leave rate: 100, 75, 50, 25 or 0% (register‐based) |
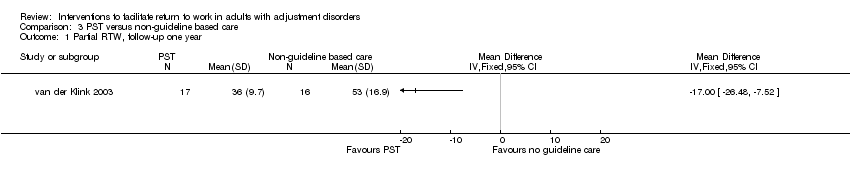
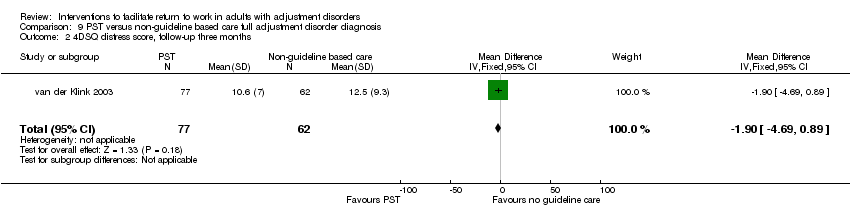
| van der Klink 2003; the Netherlands | 109 versus 83 | 12 months | Adjustment disorders diagnosed with a checklist based on the DSM‐IV criteria for adjustment disorder | Individual sessions on: information on the origin and cause of loss of control; structuring daily activities; development and implementation of problem solving strategies for the causes of stress; gradual RTW | PST: development and implementation of problem solving strategies Work: gradual RTW | 17 occupational physicians trained in the intervention (3‐day training course) | 4 to 5 sessions (with a total length over all sessions of at least 90 minutes) in the first 6 weeks of sickness leave and 1 session after work resumption | Care as usual by occupational physicians | Time (days) to partial and full RTW; duration (days) of sick leave; partial and full RTW rate at 3 and 12 months follow‐up; incidence of recurrent sick leave in the year following full RTW; time to first recurrent sick leave in the year following full RTW (register‐based) |
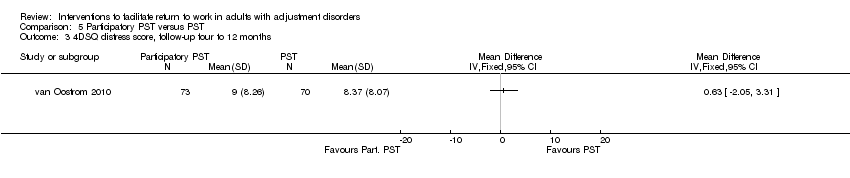
| van Oostrom 2010; the Netherlands | 73 versus 72 | 12 months | Distress based on a validated screening questionnaire | Consultations with the worker and supervisor to (1) identify obstacles and solutions for RTW, (2) formulate a plan for implementation of the solutions and (3) to evaluate the actual implementation of solutions | PST: identifying obstacles (problems) for RTW and finding/implementing solutions Work: problems related to RTW | 9 RTW co‐ordinators (company social worker or a labour expert) trained in the intervention | 3 sessions at 1 day and a follow‐up meeting after 1 month | Care as usual by occupational physicians | Days until full and lasting RTW; total number of days of sick leave in the 12‐month follow‐up (register‐based) |
| Willert 2011; Denmark | 51 versus 51 | 48 weeks | Persistent symptoms of work‐related stress based on a semi‐structured assessment interview | Group sessions and homework on: introduction to CBT; psycho education on stress; identifying dysfunctional thinking; modifying dysfunctional thinking; communication and stress; communication skills training; implementing strategies at work (e.g. cope with stressful situations at work); review of techniques | CBT: identifying and modifying dysfunctional thinking Work: implementing strategies at work (e.g. cope with stressful situations at work) | 2 licensed clinical psychologists, with > 5 years of clinical experience and a 1‐year advanced training course in CBT | 8 x 3‐hour sessions over a period of 3 months | Waiting list control group; after 3 months on the waiting list, the participants also received the intervention | Sick leave days 3‐month in retrospect (self report); weeks registered with part‐ or full‐time sick leave (register‐based) |