| 1 Cognition:ADAScog all studies Show forest plot | 9 | 1745 | Mean Difference (IV, Random, 95% CI) | ‐1.41 [‐3.13, 0.32] |
|
| 1.1 traditional NSAIDs vs placebo | 6 | 411 | Mean Difference (IV, Random, 95% CI) | ‐3.81 [‐7.94, 0.33] |
| 1.2 Selective COX‐2 inhibitor | 4 | 1334 | Mean Difference (IV, Random, 95% CI) | 0.30 [‐0.99, 1.60] |
| 2 Cognition:MMSE all Show forest plot | 6 | 1268 | Mean Difference (IV, Random, 95% CI) | ‐1.08 [‐2.21, 0.04] |
|
| 2.1 traditional NSAIDs vs placebo | 4 | 234 | Mean Difference (IV, Random, 95% CI) | ‐3.22 [‐6.58, 0.14] |
| 2.2 Selective COX‐2 inhibitor | 2 | 1034 | Mean Difference (IV, Random, 95% CI) | 0.34 [‐0.07, 0.76] |
| 3 CIBIC+ Show forest plot | 3 | 1099 | Mean Difference (IV, Fixed, 95% CI) | 0.04 [‐0.09, 0.16] |
|
| 3.1 traditional NSAIDs vs placebo | 1 | 38 | Mean Difference (IV, Fixed, 95% CI) | ‐0.10 [‐0.58, 0.38] |
| 3.2 Selective COX‐2 inhibitor | 2 | 1061 | Mean Difference (IV, Fixed, 95% CI) | 0.05 [‐0.08, 0.18] |
| 4 CDR sum score Show forest plot | 3 | 1124 | Mean Difference (IV, Fixed, 95% CI) | 0.03 [‐0.25, 0.30] |
|
| 4.1 traditional NSAIDs vs placebo | 1 | 229 | Mean Difference (IV, Fixed, 95% CI) | 0.10 [‐0.50, 0.70] |
| 4.2 Selective COX‐2 inhibitor | 3 | 895 | Mean Difference (IV, Fixed, 95% CI) | 0.01 [‐0.30, 0.32] |
| 5 NPI Show forest plot | 3 | 632 | Mean Difference (IV, Fixed, 95% CI) | 0.81 [0.14, 1.49] |
|
| 5.1 traditional NSAIDs vs placebo | 3 | 399 | Mean Difference (IV, Fixed, 95% CI) | 0.84 [0.14, 1.54] |
| 5.2 Selective COX‐2 inhibitor | 1 | 233 | Mean Difference (IV, Fixed, 95% CI) | 0.40 [‐2.54, 3.34] |
| 6 Mood/depression Show forest plot | 1 | 40 | Std. Mean Difference (IV, Random, 95% CI) | ‐0.34 [‐0.96, 0.29] |
|
| 6.1 selective COX‐2 inhibitor vs placebo | 1 | 40 | Std. Mean Difference (IV, Random, 95% CI) | ‐0.34 [‐0.96, 0.29] |
| 7 Clinical global impression: GDS Show forest plot | 1 | 31 | Std. Mean Difference (IV, Random, 95% CI) | ‐0.43 [‐1.15, 0.29] |
|
| 7.1 traditional NSAIDs vs placebo | 1 | 31 | Std. Mean Difference (IV, Random, 95% CI) | ‐0.43 [‐1.15, 0.29] |
| 8 Clinical global impression: CGIC and NOSGER 6 months Show forest plot | 2 | 441 | Std. Mean Difference (IV, Random, 95% CI) | ‐0.07 [‐0.49, 0.35] |
|
| 8.1 traditional NSAIDs vs placebo | 1 | 31 | Std. Mean Difference (IV, Random, 95% CI) | ‐0.44 [‐1.16, 0.27] |
| 8.2 Selective COX‐2 inhibitor | 1 | 410 | Std. Mean Difference (IV, Random, 95% CI) | 0.05 [‐0.16, 0.26] |
| 9 Behavioral disturbance Show forest plot | 3 | 479 | Std. Mean Difference (IV, Random, 95% CI) | 0.09 [‐0.29, 0.46] |
|
| 9.1 traditional NSAIDs vs placebo | 2 | 69 | Std. Mean Difference (IV, Random, 95% CI) | ‐0.03 [‐0.89, 0.82] |
| 9.2 Selective COX‐2 inhibitor | 1 | 410 | Std. Mean Difference (IV, Random, 95% CI) | 0.16 [‐0.04, 0.37] |
| 10 Activity of daily living Show forest plot | 7 | 1737 | Std. Mean Difference (IV, Random, 95% CI) | ‐0.22 [‐0.48, 0.04] |
|
| 10.1 traditional NSAIDs vs placebo | 4 | 375 | Std. Mean Difference (IV, Random, 95% CI) | ‐0.48 [‐0.97, 0.01] |
| 10.2 Selective COX‐2 inhibitor | 4 | 1362 | Std. Mean Difference (IV, Random, 95% CI) | ‐0.03 [‐0.22, 0.17] |
| 11 Quality of life Show forest plot | 2 | 382 | Std. Mean Difference (IV, Random, 95% CI) | 0.08 [‐0.14, 0.29] |
|
| 11.1 traditional NSAIDs vs placebo | 2 | 205 | Std. Mean Difference (IV, Random, 95% CI) | 0.07 [‐0.22, 0.36] |
| 11.2 Selective COX‐2 inhibitor | 1 | 177 | Std. Mean Difference (IV, Random, 95% CI) | 0.09 [‐0.23, 0.41] |
| 12 Caregiver burden Show forest plot | 3 | 201 | Std. Mean Difference (IV, Random, 95% CI) | ‐0.35 [‐0.63, ‐0.07] |
|
| 12.1 traditional NSAIDs vs placebo | 3 | 201 | Std. Mean Difference (IV, Random, 95% CI) | ‐0.35 [‐0.63, ‐0.07] |
| 13 Gastrointestinal side effects Show forest plot | 9 | 1675 | Risk Ratio (M‐H, Fixed, 95% CI) | 1.94 [1.36, 2.77] |
|
| 14 Elevated creatinine Show forest plot | 2 | 92 | Risk Ratio (M‐H, Fixed, 95% CI) | 4.30 [0.54, 34.30] |
|
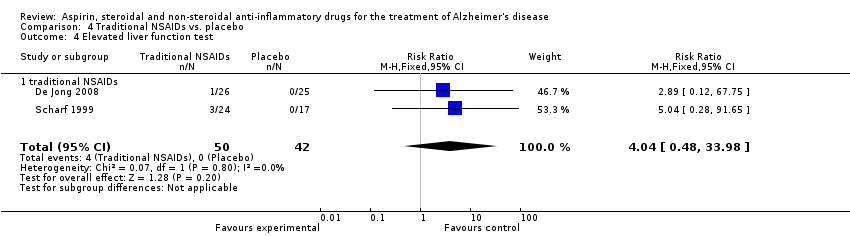
| 15 Elevated liver function test Show forest plot | 3 | 132 | Risk Ratio (M‐H, Fixed, 95% CI) | 4.27 [0.97, 18.76] |
|
| 16 Headache Show forest plot | 4 | 577 | Risk Ratio (M‐H, Fixed, 95% CI) | 1.08 [0.34, 3.44] |
|
| 17 Psychiatric side effects Show forest plot | 4 | 586 | Risk Ratio (M‐H, Fixed, 95% CI) | 1.11 [0.67, 1.86] |
|
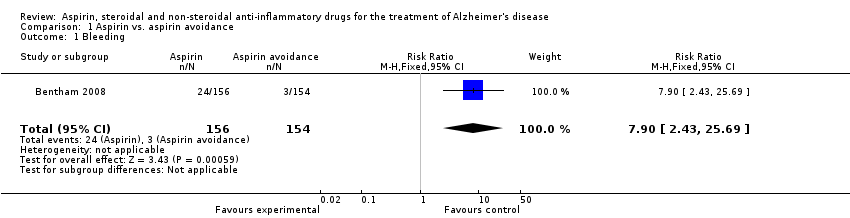
| 18 Bleeding Show forest plot | 1 | 425 | Risk Ratio (M‐H, Fixed, 95% CI) | 3.45 [0.18, 66.35] |
|
| 19 Heart disease Show forest plot | 2 | 776 | Risk Ratio (M‐H, Fixed, 95% CI) | 7.58 [1.48, 38.90] |
|
| 20 Cerebrovascular side effects Show forest plot | 4 | 1555 | Risk Ratio (M‐H, Fixed, 95% CI) | 1.05 [0.54, 2.02] |
|
| 21 Hypertension Show forest plot | 2 | 402 | Risk Ratio (M‐H, Fixed, 95% CI) | 5.41 [1.36, 21.60] |
|
| 22 Hyperglycemia Show forest plot | 1 | 51 | Risk Ratio (M‐H, Fixed, 95% CI) | 1.92 [0.19, 19.90] |
|
| 23 Rash Show forest plot | 2 | 61 | Risk Ratio (M‐H, Fixed, 95% CI) | 3.47 [1.00, 12.04] |
|
| 24 Respiratory side effects Show forest plot | 1 | 461 | Risk Ratio (M‐H, Fixed, 95% CI) | 2.73 [0.61, 12.17] |
|
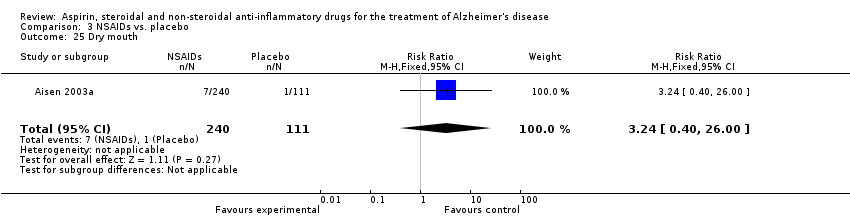
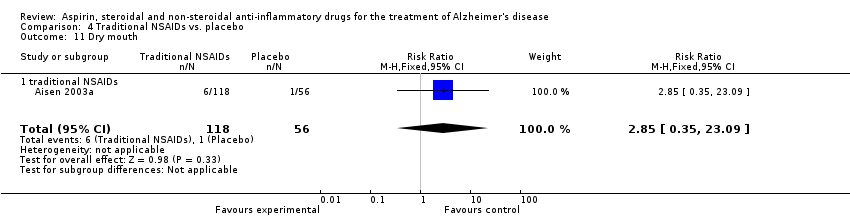
| 25 Dry mouth Show forest plot | 1 | 351 | Risk Ratio (M‐H, Fixed, 95% CI) | 3.24 [0.40, 26.00] |
|
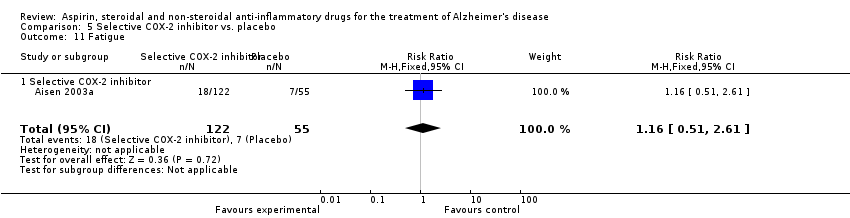
| 26 Fatigue Show forest plot | 1 | 351 | Risk Ratio (M‐H, Fixed, 95% CI) | 2.31 [1.06, 5.04] |
|
| 27 Dizziness Show forest plot | 3 | 423 | Risk Ratio (M‐H, Fixed, 95% CI) | 2.40 [1.10, 5.25] |
|
| 28 Abnormal labs other than Cr. and LFT Show forest plot | 2 | 466 | Risk Ratio (M‐H, Fixed, 95% CI) | 1.34 [0.21, 8.69] |
|
| 29 Withdrawal due to side effects Show forest plot | 3 | 1083 | Risk Ratio (M‐H, Fixed, 95% CI) | 1.22 [0.89, 1.65] |
|
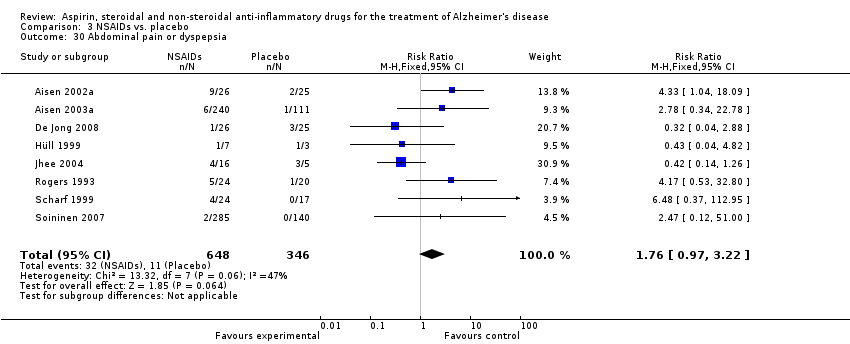
| 30 Abdominal pain or dyspepsia Show forest plot | 8 | 994 | Risk Ratio (M‐H, Fixed, 95% CI) | 1.76 [0.97, 3.22] |
|
| 31 Constipation or diarrhea Show forest plot | 3 | 527 | Risk Ratio (M‐H, Fixed, 95% CI) | 2.03 [0.84, 4.88] |
|
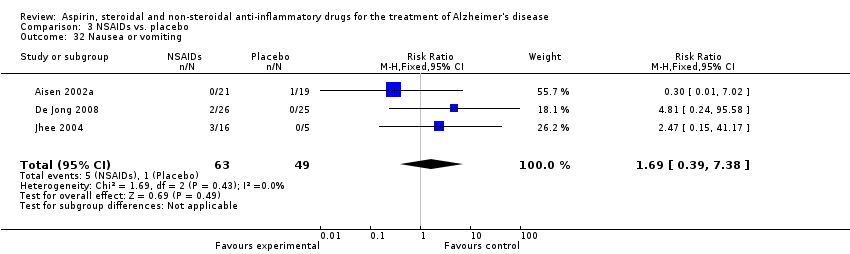
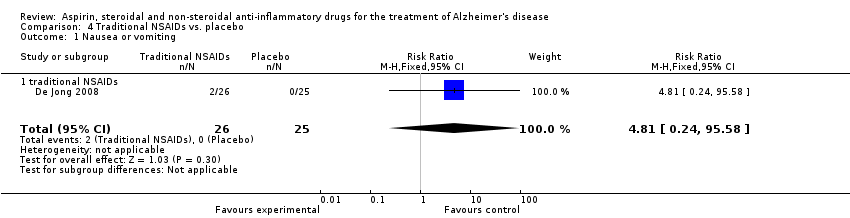
| 32 Nausea or vomiting Show forest plot | 3 | 112 | Risk Ratio (M‐H, Fixed, 95% CI) | 1.69 [0.39, 7.38] |
|
| 33 Death Show forest plot | 9 | 1711 | Risk Ratio (M‐H, Fixed, 95% CI) | 1.67 [0.85, 3.31] |
|