Intervenciones con cabestrillos mediouretrales para la incontinencia urinaria de esfuerzo en mujeres
Resumen
Antecedentes
La incontinencia urinaria es un problema muy frecuente y debilitante que afecta a cerca del 50% de las mujeres en algún momento de sus vidas. La incontinencia urinaria de esfuerzo (IUE) es una causa contribuyente o predominante en el 30% al 80% de estas mujeres. Las intervenciones con cabestrillos mediouretrales (CMU) son un tratamiento quirúrgico mínimamente invasivo reconocido para la IUE. El CMU incluye el paso de una tira pequeña de cinta por el espacio retropúbico u obturador, con puntos de entrada o salida al abdomen inferior o la ingle, respectivamente. Esta revisión no incluye cabestrillos con incisión única.
Objetivos
Evaluar los efectos clínicos de las intervenciones con cabestrillos mediouretrales (CMU) para el tratamiento de la incontinencia urinaria de esfuerzo (IUE), la incontinencia de esfuerzo urodinámica (IEU) o la incontinencia urinaria mixta (IUM) en mujeres.
Métodos de búsqueda
Se hicieron búsquedas en el registro especializado del Grupo Cochrane de Incontinencia (Cochrane Incontinence Group) que contiene ensayos identificados en CENTRAL, MEDLINE, MEDLINE in process, ClinicalTrials.gov y búsquedas manuales en revistas y actas de congresos (búsqueda 26 junio 2014), Embase y Embase Classic (enero 1947 hasta semana 25, 2014), WHO ICTRP (búsqueda 30 junio 2014) y en las listas de referencias de artículos relevantes.
Criterios de selección
Ensayos controlados aleatorios o cuasialeatorios en pacientes con IUE, IEU o IUM, en los cuales ambos brazos del ensayo incluyen una intervención con CMU.
Obtención y análisis de los datos
Dos autores de la revisión de forma independiente evaluaron la calidad metodológica de los estudios potencialmente elegibles y extrajeron los datos de los ensayos incluidos.
Resultados principales
Se incluyeron 81 ensayos que evaluaron a 12 113 mujeres. La calidad de las pruebas para los resultados se evaluó mediante la herramienta de evaluación GRADE; la calidad de la mayoría de los resultados fue moderada, principalmente debido al riesgo de sesgo o la falta de precisión.
Cincuenta y cinco ensayos con 8652 pacientes contribuyeron con datos y compararon el uso de la vía transobturador (VTO) y la vía retropúbica (VRP). Hay pruebas de calidad moderada de que a corto plazo (hasta un año) la tasa de curación subjetiva con la VTO y la VRP son similares (CR 0,98; IC del 95%: 0,96 a 1,00; 36 ensayos, 5514 mujeres; pruebas de calidad moderada) con una variación del 62% al 98% en el grupo de VTO y del 71% al 97% en el grupo de VRP. La curación objetiva a corto plazo fue similar en los grupos de VTO y VRP (CR 0,98; IC del 95%: 0,96 a 1,00; 40 ensayos, 6145 mujeres). Menos ensayos informaron datos a plazo medio (uno a cinco años) y a más largo plazo (más de cinco años), pero la curación subjetiva fue similar entre los grupos (CR 0,97; IC del 95%: 0,87 a 1,09; cinco ensayos, 683 mujeres; pruebas de baja calidad; y CR 0,95; IC del 95%: 0,80 a 1,12; cuatro ensayos, 714 mujeres; pruebas de calidad moderada, respectivamente). A largo plazo, las tasas de curación subjetivas variaron del 43% al 92% en el grupo de VTO, y del 51% al 88% en el grupo de VRP.
Los procedimientos de CMU realizados mediante la VRP tuvieron mayor morbilidad en comparación con la VTO, aunque la tasa general de eventos adversos permaneció baja. La tasa de perforación vesical fue inferior después de la VTO (0,6% versus 4,5%; CR 0,13; IC del 95%: 0,08 a 0,20; 40 ensayos, 6372 mujeres; pruebas de calidad moderada). La lesión vascular / visceral grave, la media del tiempo quirúrgico, la pérdida de sangre operatoria y la duración de la estancia hospitalaria fueron inferiores con la VTO.
La disfunción postoperatoria de la evacuación fue menos frecuente después de la VTO (CR 0,53; IC del 95%: 0,43 a 0,65; 37 ensayos, 6200 mujeres; pruebas de calidad moderada). Las tasas generales de dolor en la ingle fueron mayores en el grupo de VTO (6,4% versus 1,3%; CR 4,12; IC del 95%: 2,71 a 6,27; 18 ensayos, 3221 mujeres; pruebas de calidad moderada) mientras que el dolor suprapúbico fue menor en el grupo de VTO (0,8% versus 2,9%; CR 0,29; IC del 95%: 0,11 a 0,78); y ambos fueron de corta duración. La tasa general de erosión / exposición / extrusión de la cinta en la vagina fue baja en ambos grupos: 24/1000 casos con VTO en comparación con 21/1000 con VRP (CR 1,13; IC del 95%: 0,78 a 1,65; 31 ensayos, 4743 mujeres; pruebas de calidad moderada). Solamente hubo datos limitados para informar la necesidad de cirugía repetida por incontinencia a largo plazo, pero fue más probable en el grupo de VTO que en el grupo de VRP (CR 8,79; IC del 95%: 3,36 a 23,00; cuatro ensayos, 695 mujeres; pruebas de baja calidad).
La vía retropúbica inferior a superior fue más efectiva que la vía superior a inferior para la curación subjetiva (CR 1,10; IC del 95%: 1,01 a 1,19; tres ensayos, 477 mujeres; pruebas de calidad moderada). Esta vía incurrió en significativamente menos disfunción de la evacuación, y dio lugar a menos perforaciones vesicales y erosiones de la cinta en la vagina.
Las tasas de curación subjetiva a corto y medio plazo entre las cintas transobturador pasadas mediante un enfoque medial a lateral en contraposición con un enfoque lateral a medial fueron similares (CR 1,00; IC del 95%: 0,96 a 1,06; seis ensayos, 759 mujeres; pruebas de calidad moderada, y CR 1,06; IC del 95%: 0,91 a 1,23; dos ensayos, 235 mujeres; pruebas de calidad moderada). Hubo pruebas de calidad moderada que la disfunción de la evacuación fue más frecuente en el grupo medial a lateral (CR 1,74; IC del 95%: 1,06 a 2,88; ocho ensayos, 1121 mujeres; pruebas de calidad moderada), pero la perforación vaginal fue menos frecuente en la vía medial a lateral (CR 0,25; IC del 95%: 0,12 a 0,53; tres ensayos, 541 mujeres). Debido a la calidad muy baja de las pruebas, no está claro si las tasas inferiores de perforación del epitelio vaginal afectaron la erosión de la cinta en la vagina (CR 0,42; IC del 95%: 0,16 a 1,09; siete ensayos, 1087 mujeres; pruebas de muy baja calidad).
Conclusiones de los autores
Las intervenciones con cabestrillos mediouretrales han sido el tratamiento quirúrgico investigado más ampliamente para la incontinencia urinaria de esfuerzo (IUE) en mujeres y tienen un buen perfil de seguridad. Independientemente de las vías utilizadas, son muy eficaces a corto y medio plazo y se han acumulado pruebas que demuestran su efectividad a largo plazo. Esta revisión ilustra su repercusión positiva sobre la mejoría en la calidad de vida de las pacientes con IUE. Con la excepción del dolor en la ingle, ocurren menos eventos adversos con el empleo de un enfoque transobturador. Al comparar las técnicas transobturator de una inserción medial a lateral versus una inserción lateral a medial no hay pruebas para apoyar el uso de un enfoque sobre el otro. Sin embargo, una vía inferior a superior fue más eficaz que la vía superior a inferior para las cintas retropúbicas.
Un punto destacado demostrado a través de la revisión es la necesidad del informe de datos de resultado a más largo plazo de los numerosos ensayos existentes. Lo anterior aumentaría de manera significativa la base de pruebas y proporcionaría aclaración con respecto a las incertidumbres acerca de la efectividad a largo plazo y el perfil de eventos adversos.
PICOs
Resumen en términos sencillos
Intervenciones con cabestrillos mediouretrales para la incontinencia urinaria de esfuerzo en mujeres
Antecedentes
La incontinencia urinaria de esfuerzo (pérdida involuntaria de orina con el esfuerzo o el ejercicio; o al estornudar, toser o reír) es la forma más frecuente de incontinencia en las mujeres y provoca una reducción de la calidad de vida. Las pacientes con incontinencia urinaria de esfuerzo también pueden tener problemas con el coito, ya que pueden producirse pérdidas de orina. Una de cada tres mujeres mayores de 18 años estará afectada por incontinencia urinaria de esfuerzo en algún momento de la vida.
Con el transcurso de los años, la cirugía para eliminar este problema se ha vuelto menos invasiva y hay muchos tipos diferentes de intervenciones disponibles. Las intervenciones con cabestrillos mediouretrales se realizan habitualmente para tratar y curar la incontinencia urinaria de esfuerzo. Estas intervenciones son apropiadas en las pacientes a las que se les realiza una primera intervención para impedir la incontinencia y también en las pacientes que han recibido anteriormente una cirugía sin éxito. En la intervención con cabestrillo mediouretral se coloca una cinta debajo de la uretra, que es el conducto que lleva la orina fuera de la vejiga. Cuando la paciente tose, la cinta comprime el conducto, por lo que proporciona el apoyo necesario para prevenir la pérdida de orina.
Hay dos formas principales de realizar estas intervenciones, ya sea al insertar una cinta detrás del hueso púbico a través del abdomen ("retropúbica"), o a través de la ingle ("transobturador").
Lo que esta revisión trató de determinar
Se analizaron los efectos de las intervenciones con cabestrillos mediouretrales cuando se utilizaron estos dos métodos diferentes para realizar las intervenciones. También se compararon diferentes formas de insertar la cinta, y el uso de cintas hechas de materiales diferentes. El objetivo de esta revisión fue determinar la efectividad de estas intervenciones en el tratamiento de la incontinencia urinaria de esfuerzo y ayudar a determinar la tasa de posibles complicaciones o potenciales.
Principales hallazgos de esta revisión
Se realizó una búsqueda exhaustiva de la literatura médica hasta junio 2014. Se identificaron 81 ensayos con un total de 12 113 mujeres. Estos ensayos mostraron que más del 80% de las pacientes con incontinencia urinaria de esfuerzo se curan o tienen una mejoría significativa en los síntomas con cualquiera de las intervenciones, durante hasta cinco años después de la cirugía. Se encontró que el resultado anterior ocurrió independientemente de las cintas utilizadas y la vía de inserción de las cintas. Los estudios utilizaron cuestionarios diferentes para evaluar la calidad de vida, lo que significó que no fue posible combinar los resultados para el análisis. Sin embargo, la información que está disponible para la calidad de vida indica que mejora como resultado de estas intervenciones, aunque no hay diferencias claras entre los dos procedimientos. Solamente unos pocos ensayos proporcionaron información acerca de la efectividad de estas cintas más de cinco años después de la cirugía. Las pruebas que se han podido evaluar indican que persisten los efectos positivos.
Efectos adversos
Las cintas que pasan por detrás del hueso púbico (retropúbica) parecen conllevar un riesgo mayor de daño de la vejiga durante la intervención y de que las pacientes experimenten problemas para lograr el vaciado completo de la vejiga después de la cirugía. Sin embargo, esta intervención provoca menos dolor en la ingle a corto plazo. Hay algunas pruebas limitadas de que esta manera de insertar la cinta tiene un riesgo menor de necesitar una intervención repetida a largo plazo en comparación con las cintas que pasan a través de la ingle (transobturador). Hay pruebas de calidad moderada de que las tasas generales informadas de complicaciones relacionadas con la cinta son bajas, como la erosión de la cinta en la vagina de alrededor del 2% para ambas vías de inserción de la cinta. El informe de la aparición de problemas con el coito que incluye el dolor fue bajo y la pérdida de orina durante el coito mejoró después de la inserción de estas cintas.
Limitaciones de la revisión
La mayoría de los resultados de esta revisión se basa en pruebas de calidad moderada. La mayoría de los ensayos no describió los métodos claramente, lo que da lugar a algún grado de incertidumbre en los resultados. Actualmente, hay solamente un número limitado de ensayos controlados aleatorios (estos producen los resultados más fiables) que han publicado datos más allá de los cinco años después de la cirugía. Lo anterior significa que las pruebas acerca del nivel de eficacia y seguridad de estos procedimientos a más largo plazo están a la zaga de las pruebas a corto y a medio plazo (hasta cinco años). Los investigadores deben animarse a publicar datos a más largo plazo para ayudar a aumentar la fiabilidad de los resultados a más largo plazo en esta área.
Conclusiones de los autores
Summary of findings
| Transobturator (TOR) compared to retropubic (RPR) route for stress urinary incontinence in women | ||||||
| Patient or population: women with stress urinary incontinence | ||||||
| Outcomes | Illustrative comparative risks* (95% CI) | Relative effect | No of participants | Quality of the evidence | Comments | |
| Assumed risk | Corresponding risk | |||||
| Retropubic (RPR) route | Transobturator (TOR) | |||||
| Subjective cure (Short term < 1 year) | Study population | RR 0.98 | 5514 | ⊕⊕⊕⊝ | ||
| 844 per 1000 | 827 per 1000 | |||||
| Mean control group risk across studies | ||||||
| 833 per 1000 | 816 per 1000 | |||||
| Subjective cure (medium term, 1 to 5 years) | Study population | RR 0.97 | 683 | ⊕⊕⊝⊝ | ||
| 881 per 1000 | 854 per 1000 | |||||
| Mean control group risk across studies | ||||||
| 869 per 1000 | 843 per 1000 | |||||
| Subjective cure (long term, > 5 years) | Study population | RR 0.95 | 714 | ⊕⊕⊕⊝ | ||
| 707 per 1000 | 671 per 1000 | |||||
| Mean control group risk across studies | ||||||
| 843 per 1000 | 801 per 1000 | |||||
| Bladder or urethral perforation | Study population | RR 0.13 | 6372 | ⊕⊕⊕⊝ | ||
| 49 per 1000 | 6 per 1000 | |||||
| Mean control group risk across studies | ||||||
| 25 per 1000 | 3 per 1000 | |||||
| Voiding dysfunction (short and medium term, up to 5 years) | Study population | RR 0.53 | 6217 | ⊕⊕⊕⊝ | ||
| 72 per 1000 | 38 per 1000 | |||||
| Mean control group risk across studies | ||||||
| 55 per 1000 | 29 per 1000 | |||||
| De novo urgency or urgency incontinence (short term, up to 12 months) | Study population | RR 0.98 | 4923 | ⊕⊕⊕⊝ | ||
| 82 per 1000 | 80 per 1000 | |||||
| Mean control group risk across studies | ||||||
| 83 per 1000 | 81 per 1000 | |||||
| Groin pain | Study population | RR 4.62 | 3226 | ⊕⊕⊕⊝ | ||
| 14 per 1000 | 66 per 1000 | |||||
| Mean control group risk across studies | ||||||
| 45 per 1000 | 208 per 1000 | |||||
| Suprapubic pain | Study population | RR 0.29 | 1105 | ⊕⊕⊕⊝ | ||
| 29 per 1000 | 8 per 1000 | |||||
| Mean control group risk across studies | ||||||
| 18 per 1000 | 5 per 1000 | |||||
| Vaginal tape erosion (short and medium term, up to 5 years) | Study population | RR 1.13 | 4743 | ⊕⊕⊕⊝ | ||
| 20 per 1000 | 22 per 1000 | |||||
| Mean control group risk across studies | ||||||
| 21 per 1000 | 24 per 1000 | |||||
| Repeat incontinence surgery (short term, within 12 months) | Study population | RR 1.64 | 1402 | ⊕⊕⊕⊝ | ||
| 19 per 1000 | 31 per 1000 | |||||
| mean control group across studies | ||||||
| 24 per 1000 | 39 per 1000 | |||||
| Repeat incontinence surgery (long term, > 5 years) | Study population | RR 8.79 | 695 | ⊕⊕⊝⊝ | ||
| 11 per 1000 | 100 per 1000 | |||||
| Mean control group across studies | ||||||
| 67 per 1000 | 589 per 1000 | |||||
| Cost effectiveness of intervention | An economic analysis was performed in only one RCT. This showed that over a 12‐month follow‐up period there was cost saving with TOR of CAD 1133 per patient (95% CI ‐2793 to 442), despite no difference in health outcome between the groups (adjusted to 2007 Canadian prices). The average cost of TOR was 17% less than that of RPR. | ‐ | (1 RCT) | |||
| Quality of life | 16 different validated questionnaires were used by different studies to assess QoL. This outcome was reported in 11 RCTs, but reported in different ways which precluded meta‐analysis. In all but one of the RCTs where QoL was assessed there was improvement in the QoL in women after the intervention, irrespective of which route was used, with no significant difference in scores between groups. Where assessment of sexual function was performed, there was an equal amount of improvement in sexual function following surgical treatment, irrespective of the route employed | ‐ | (11 RCTs) | |||
| *The basis for the assumed risk (e.g. the median control group risk across studies) is provided in footnotes. The corresponding risk (and its 95% confidence interval) is based on the assumed risk in the comparison group and the relative effect of the intervention (and its 95% CI). CI: confidence interval RCT: randomised controlled trial RPR: retropubic route RR: risk ratio TOR: transobturator route | ||||||
| GRADE Working Group grades of evidence | ||||||
| 1Random sequence generation was unclear in 13 studies and at high risk of bias in 2 studies, and allocation concealment was unclear in 20 studies and at high risk in 2/37 studies 2Allocation concealment was unclear in 2/5 trials and sequence generation was unclear in 1/5 trials, so we decided to downgrade by 1 level 3There was potential substantial heterogeneity with an I² value of 67%, so we downgraded the quality rating by 1 level 4There was potential substantial heterogeneity among studies with an I² value of 65%, which lead us to downgrade by 1 level 5As allocation concealment was unclear in 18/40 trials and at high risk in 3/40, and sequence generation was unclear in 14/40 trials and at high risk in 3/40, we decided to downgrade by 1 level 6As allocation concealment was unclear in 16/37 trials and at high risk in 2/37, and sequence generation was unclear in 11/37 trials and at high risk in 2/37, we decided to downgrade by 1 level 7Random sequence generation was unclear in 10/31 studies and at high risk of bias in 2/31, and allocation concealment was unclear in 15/31 studies and at high risk in 2/31, so we downgraded by 1 level 8Random sequence generation was unclear in 4/18 studies and at high risk in 2/18, and allocation concealment was unclear in 9/18 studies and at high risk in 2/18, so we downgraded the quality of the evidence by 1 level 9Random sequence generation was at high risk in 1/4 studies, while allocation concealment was unclear in 2/4 and at high risk in 1/4, so we downgraded by 1 level 10Allocation concealment was unclear in 12/31 trials and at high risk in 1/31, while sequence generation was unclear in 6/31 trials and at high risk in 1/31, so we decided to downgrade by 1 level 11The wide confidence interval was judged to include a threshold for appreciable harm considered to be > 25% increase in RR, in this case there was much more than a 25% increase in RR for harm, so we downgraded the level by 1 12There was potential substantial heterogeneity with an I² value of 46%, so we downgraded the quality rating by 1 level 13Due to the low number of studies reporting data for this outcome, and the low number of events and wide CI around the estimate of the effect, we downgraded the quality of evidence by 1 level due to imprecision | ||||||
| Retropubic bottom‐to‐top approach compared to retropubic top‐to‐bottom approach for stress urinary incontinence in women | ||||||
| Patient or population: women with stress urinary incontinence | ||||||
| Outcomes | Illustrative comparative risks* (95% CI) | Relative effect | No of participants | Quality of the evidence | Comments | |
| Assumed risk | Corresponding risk | |||||
| retropubic top‐to‐bottom approach | Retropubic bottom‐to‐top approach | |||||
| Subjective cure (short term, ≤ 1 year) | Study population | RR 1.10 | 492 | ⊕⊕⊕⊝ | ||
| 770 per 1000 | 847 per 1000 | |||||
| Mean control group across studies | ||||||
| 890 per 1000 | 979 per 1000 | |||||
| Subjective cure (medium term, 1 to 5 years) | No studies reported this outcome | ‐ | (0 studies) | |||
| Subjective cure long term: > 5 years | No studies reported this outcome | ‐ | (0 studies) | |||
| Bladder or urethral perforation | Study population | RR 0.55 | 631 | ⊕⊕⊕⊝ | ||
| 85 per 1000 | 47 per 1000 | |||||
| Mean control group across studies | ||||||
| 115 per 1000 | 63 per 1000 | |||||
| Voiding dysfunction | Study population | RR 0.40 | 631 | ⊕⊕⊕⊝ | ||
| 60 per 1000 | 24 per 1000 | |||||
| Mean control group across studies | ||||||
| 49 per 1000 | 20 per 1000 | |||||
| De novo urgency or urgency incontinence | Study population | RR 0.84 | 547 | ⊕⊕⊝⊝ | ||
| 123 per 1000 | 103 per 1000 | |||||
| Mean control group across studies | ||||||
| 187 per 1000 | 157 per 1000 | |||||
| Vaginal tape erosion | Study population | RR 0.27 | 569 | ⊕⊕⊕⊝ | ||
| 35 per 1000 | 9 per 1000 | |||||
| Mean control group across studies | ||||||
| 69 per 1000 | 19 per 1000 | |||||
| Repeat incontinence surgery short term | No studies reported this outcome | ‐ | (0 studies) | |||
| Repeat incontinence surgery long term | No studies reported this outcome | ‐ | (0 studies) | |||
| Cost effectiveness of intervention | No studies reported this outcome | ‐ | (0 studies) | |||
| Quality of life (IIQ scores) | The mean quality of life (IIQ scores) in the control group was 49.9 | The mean quality of life (IIQ scores) in the intervention group was 4.6 lower (14.17 lower to 4.97 higher) | ‐ | 84 | ||
| *The basis for the assumed risk (e.g. the median control group risk across studies) is provided in footnotes. The corresponding risk (and its 95% confidence interval) is based on the assumed risk in the comparison group and the relative effect of the intervention (and its 95% CI). IIQ: Incontinence Impact questionnaire RCT: randomised controlled trial RR risk ratio; | ||||||
| GRADE Working Group grades of evidence | ||||||
| 1Sequence generation and allocation concealment was unclear in 2/3 trials, so we downgraded by 1 level 2Sequence generation and allocation concealment was unclear in 3/5 trials, so we downgraded by 1 level 3Sequence generation was unclear in 2/4 studies and allocation concealment unclear in 3/4 studies, so we downgraded by 1 level 4The wide confidence interval was judged to include a threshold for appreciable harm considered to be > 25% increase in RR, in this case there was much more than a 25% increase in RR for harm, so we downgraded the level by 1 5Sequence generation unclear in 3/4 studies and allocation concealment unclear in 2/4 studies, so we downgraded by 1 level | ||||||
| Obturator medial‐to‐lateral approach compared to obturator lateral‐to‐medial approach for stress urinary incontinence in women | ||||||
| Patient or population: women with stress urinary incontinence | ||||||
| Outcomes | Illustrative comparative risks* (95% CI) | Relative effect | No of participants | Quality of the evidence | Comments | |
| Assumed risk | Corresponding risk | |||||
| Obturator lateral‐to‐medial approach | Obturator medial‐to‐lateral approach | |||||
| Subjective cure (short term ≤ 1 year) | Study population | RR 1.00 | 759 | ⊕⊕⊝⊝ | ||
| 877 per 1000 | 877 per 1000 | |||||
| Mean control group risk across studies | ||||||
| 880 per 1000 | 880 per 1000 | |||||
| Subjective cure (medium term, 1 to 5 years) | Study population | RR 1.06 | 235 | ⊕⊕⊝⊝ | ||
| 711 per 1000 | 753 per 1000 | |||||
| Mean control group risk across studies | ||||||
| 736 per 1000 | 780 per 1000 | |||||
| Subjective cure | No studies reported this outcome | ‐ | (0 studies) | |||
| Bladder or urethral perforation | Study population | RR 0.38 | 794 | ⊕⊕⊕⊝ | ||
| 11 per 1000 | 4 per 1000 | |||||
| Mean control group risk across studies | ||||||
| 6 per 1000 | 2 per 1000 | |||||
| Voiding dysfunction (short and medium term, up to 5 years) | Study population | RR 1.74 | 1121 | ⊕⊕⊕⊝ | ||
| 40 per 1000 | 70 per 1000 | |||||
| Mean control group risk across studies | ||||||
| 55 per 1000 | 96 per 1000 | |||||
| De novo urgency or urgency incontinence (short term, up to 12 months) | Study population | RR 1.01 | 357 | ⊕⊕⊝⊝ | ||
| 63 per 1000 | 63 per 1000 | |||||
| Mean control group risk across studies | ||||||
| 64 per 1000 | 65 per 1000 | |||||
| Groin pain | Study population | RR 1.15 | 837 | ⊕⊝⊝⊝ | ||
| 80 per 1000 | 92 per 1000 | |||||
| Mean control group risk across studies | ||||||
| 74 per 1000 | 85 per 1000 | |||||
| Vaginal tape erosion (short and medium term, up to 5 years) | Study population | RR 0.42 | 1087 | ⊕⊝⊝⊝ | ||
| 24 per 1000 | 10 per 1000 | |||||
| Mean control group risk across studies | ||||||
| 17 per 1000 | 7 per 1000 | |||||
| Repeat incontinence surgery (short term, up to 12 months) | Study population | RR 0.64 | 532 | ⊕⊕⊝⊝ | ||
| 71 per 1000 | 45 per 1000 | |||||
| Mean control group risk across studies | ||||||
| 58 per 1000 | 37 per 1000 | |||||
| Repeat incontinence surgery | No studies reported this outcome | ‐ | (0 studies) | |||
| Cost effectiveness of intervention | No studies reported this outcome | ‐ | (0 studies) | |||
| Quality of life | The mean quality of life in the control group was 0 | The mean quality of life in the intervention group was 16.54 higher (4.84 higher to 28.24 higher) | ‐ | 46 | ⊕⊝⊝⊝ | |
| *The basis for the assumed risk (e.g. the median control group risk across studies) is provided in footnotes. The corresponding risk (and its 95% confidence interval) is based on the assumed risk in the comparison group and the relative effect of the intervention (and its 95% CI). RCT: randomised controlled trial RR: risk ratio; | ||||||
| GRADE Working Group grades of evidence | ||||||
| 1Random sequence generation was unclear in 4/6 studies, allocation concealment was unclear in5/6 and at high risk in 1/6 studies, so we downgraded the quality of evidence due to risk of bias by 2 levels 2Random sequence generation was unclear in all both studies, allocation concealment was unclear in 1 and high risk of bias in the other study, so we downgraded by 2 levels 3Sequence generation was unclear in 2 studies and allocation concealment was unclear in 3 studies, so we downgraded the quality rating by 1 level 4Sequence generation was unclear in 3 studies and at high risk in 1 study, while allocation concealment was unclear in 4 studies and at high risk in 1 study, so we downgraded by 1 level 5Sequence generation was unclear in 2/3 studies and at high risk in 1/3, allocation concealment was unclear in 2/3 studies and high in 1/3, so we downgraded by 2 levels 6Random sequence generation was unclear in 2/5 and high in 1/5 studies, while allocation concealment was unclear in 2/5 and high in 2/5 studies, so we downgraded the quality of evidence due to high risk of bias by 2 levels 7The wide confidence interval was judged to include a threshold for appreciable harm considered to be > 25% increase in RR, in this case there was > 65% increase in RR for harm, so we downgraded by 1 level 8Sequence generation was unclear in 3/7 studies and at high risk in 1/7. Allocation concealment was unclear in 5/7 studies and at high risk in 1/7. We downgraded the quality rating by 2 levels 9Sequence generation and allocation concealment were unclear in 1/2 studies, so we downgraded by 1 level 10Sequence generation and allocation concealment were unclear, so we downgraded by 1 level 11As there was only 1 study with very few events and CIs around estimates of effect included appreciable benefit and appreciable harm, we downgraded by 2 levels | ||||||
| Monofilament compared to multifilament tapes for stress urinary incontinence in women | ||||||
| Patient or population: women with stress urinary incontinence | ||||||
| Outcomes | Illustrative comparative risks* (95% CI) | Relative effect | No of participants | Quality of the evidence | Comments | |
| Assumed risk | Corresponding risk | |||||
| multifilament tapes | Monofilament | |||||
| Subjective cure (short term ≤ 1 year) | Study population | RR 1.07 | 505 | ⊕⊕⊕⊝ | ||
| 784 per 1000 | 839 per 1000 | |||||
| Mean control group risk across studies | ||||||
| 810 per 1000 | 867 per 1000 | |||||
| Subjective cure (medium term: 1 to 5 years) | No studies reported this outcome | ‐ | (0 studies) | |||
| Subjective cure (long term: > 5 years) | No studies reported this outcome | ‐ | (0 studies) | |||
| Bladder or urethral perforation | Study population | RR 0.76 | 496 | ⊕⊕⊕⊝ | ||
| 37 per 1000 | 28 per 1000 | |||||
| Mean control group risk across studies | ||||||
| 32 per 1000 | 25 per 1000 | |||||
| Voiding dysfunction | Study population | RR 2.20 | 400 | ⊕⊕⊝⊝ | ||
| 41 per 1000 | 89 per 1000 | |||||
| Mean control group risk across studies | ||||||
| 65 per 1000 | 143 per 1000 | |||||
| De novo urgency or urgency incontinence | Study population | RR 1.09 | 496 | ⊕⊕⊝⊝ | ||
| 102 per 1000 | 111 per 1000 | |||||
| Mean control group risk across studies | ||||||
| 107 per 1000 | 117 per 1000 | |||||
| Vaginal tape erosion | Study population | RR 0.43 | 396 | ⊕⊕⊕⊕ | ||
| 62 per 1000 | 26 per 1000 | |||||
| Mean control group risk across studies | ||||||
| 43 per 1000 | 18 per 1000 | |||||
| Repeat incontinence surgery (short term ≤ 1 year) | No studies reported this outcome | ‐ | (0 studies) | |||
| Repeat incontinence surgery (long term > 5 years) | No studies reported this outcome | ‐ | (0 studies) | |||
| Cost effectiveness of intervention | No studies reported this outcome | ‐ | (0 studies) | |||
| Quality of life scores ICIQ | The mean quality of life scores ICIQ in the control group was 2.1 | The mean quality of life scores ICIQ in the intervention group was 0.6 lower (0.76 lower to 0.44 lower) | ‐ | 96 | ⊕⊕⊕⊕ | |
| *The basis for the assumed risk (e.g. the median control group risk across studies) is provided in footnotes. The corresponding risk (and its 95% confidence interval) is based on the assumed risk in the comparison group and the relative effect of the intervention (and its 95% CI). ICIQ: International Consultation on Incontinence questionnaire RCT: randomised controlled trial RR: risk ratio | ||||||
| GRADE Working Group grades of evidence | ||||||
| 1Random sequence generation and allocation concealment unclear in 2/4 studies, so we downgraded by 1 level 2Random sequence generation and allocation concealment unclear in 2/3 studies, so downgraded by 1 level 3The wide confidence interval was judged to include a threshold for appreciable harm considered to be > 25% increase in RR, in this case there was much more than a 25% increase in RR for harm, so we downgraded by 1 level 4Sequence generation and allocation concealment were unclear in 2/4 studies, so we downgraded the quality rating by 1 level 5The wide confidence interval was judged to include a threshold for appreciable harm considered to be > 25% increase in RR, in this case there was > 65% increase in RR for harm, so we downgraded by 1 level | ||||||
Antecedentes
La incontinencia urinaria es una afección muy frecuente en las mujeres. Se asocia con morbilidad física significativa, disfunción sexual, pérdida de la independencia y reducción del bienestar psicológico, con la consiguiente reducción en la participación en las actividades sociales y domésticas (Wetle 1995; Thom 1998; Van Oyen 2002; Salonia 2004; Botlero 2010). Se ha calculado que la prevalencia de la incontinencia urinaria en las mujeres adultas se encuentra entre el 10% y el 40%, y se considera grave en cerca del 3% al 17%, con una incidencia anual que varía del 2% al 11% (Hunskaar 2002; Milsom 2009). La prevalencia de la incontinencia urinaria de esfuerzo (IUE) en las mujeres se encuentra entre el 12% y el 46% (Irwin 2006; Botlero 2008; Coyne 2009). Es un problema social potencialmente debilitante, con implicaciones significativas de costo para los individuos y los servicios de atención sanitaria. El costo anual calculado para el sistema de atención sanitaria en el Reino Unido excede los GBP 700 000 000 y en los EE.UU. es de más de USD 20 000 000 000 (Fantl 1996; Hu 2004; Turner 2004). También existe un costo significativo para las mujeres de manera individual, con una estimación de más de GBP 178 000 000 por año (Turner 2004; Papanicolaou 2005).
La continencia se logra mediante la interacción de las propiedades anatómicas y fisiológicas normales de la vejiga, la uretra, el esfínter uretral y el suelo pelviano, con la coordinación de estos órganos por el sistema nervioso. La uretra y su esfínter actúan como un mecanismo de cierre durante el llenado de la vejiga y contienen la orina en la vejiga, lo que permite su almacenamiento por un tiempo conveniente hasta que tenga lugar el vaciamiento. El suelo pelviano proporciona apoyo a la vejiga y la uretra y permite la transmisión de la presión abdominal normal a la uretra proximal, lo que es esencial en el mantenimiento de la continencia. La coordinación entre la vejiga, la uretra, el esfínter y el suelo pelviano es de importancia crucial para el funcionamiento saludable de los mismos, y es facilitada por un sistema nervioso intacto.
Hay muchas teorías e hipótesis sobre la fisiopatología de la incontinencia urinaria de esfuerzo. Históricamente Goran Enhorning fue el primero en medir las presiones simultáneas vesicales y uretrales. Indicó que durante el impulso de la tos, la presión se transmite del abdomen a la uretra con una reducción concurrente en la presión de cierre uretral, lo que da lugar a la IUE (Enhorning 1961). La clasificación de McGuire modificada de la IUE recalca el principio de la deficiencia intrínseca del esfínter (DIE) como causa de la IUE. Se dice que ocurre debido a la función deficiente del cierre uretral, resultado de la coaptación deficiente de la mucosa uretral. Estas dos teorías informaron procedimientos como la colposuspensión de Burch y las intervenciones de Marshall Marchetti Krantz. La teoría de la "hamaca" de De Lancey indicó que la transmisión de las presiones abdominales al cuello vesical y la uretra da lugar a que la uretra proximal se comprima contra la fascia pubo‐vesical y la pared vaginal anterior, lo que mantiene la continencia (DeLancey 1994).
Hallazgos recientes sobre la fisiopatología de la incontinencia urinaria han demostrado que el apoyo mediouretral proporcionado por los ligamentos pubo‐uretrales también desempeña una función importante en el mantenimiento de la continencia cuando la presión intraabdominal aumenta. Lo anterior ha dado lugar a la "teoría integrada" para el mantenimiento de la continencia en pacientes con IUE (Petros 1990; Petros 1993). Esta teoría es a su vez la base para el uso actual de las cintas mediouretrales mínimamente invasivas en el tratamiento de la IUE.
Cuando se realiza la cirugía con la cinta mediouretral se utilizan diferentes tipos de materiales sintéticos. Las mallas sintéticas se dividieron en cuatro grupos:
-
el tipo 1 son macroporos, monofilamento;
-
el tipo 2 son microporos;
-
el tipo 3 son macroporos, multifilamento;
-
el tipo 4 son bimateriales submicrónicos recubiertos, con tamaños de los poros menores de 1 μm.
La malla tipo 1 tiene una biocompatibilidad más alta con una propensión mínima para la infección. Las diferencias en la eficacia y las complicaciones probablemente se deban a varios factores, incluidos los diferentes tipos de puntos y texturas de los materiales de la cinta, las propiedades biomecánicas y la biocompatibilidad histológica. El tamaño del poro afecta la respuesta inflamatoria y la formación de tejido conectivo dentro y en la malla, o el reordenamiento de materiales como el colágeno dentro de la estructura de la malla. Las mallas macroporos (tamaño del poro > 75 μm) permiten que los macrófagos, los leucocitos, los fibroblastos, los vasos sanguíneos y el colágeno atraviesen los poros: por lo tanto, las mallas macroporos promueven el crecimiento del tejido del huésped, lo que da lugar a biocompatibilidad y bajo riesgo de infección (Amid 1997). Las cintas monofilamento están ampliamente disponibles y actualmente predominan en la práctica clínica.
Por el contrario, las mallas microporos (tamaño del poro > 10 μm) permiten que las bacterias pasen y se repliquen pero excluyen a los macrófagos. Las cintas multifilamento tienen microporos, es decir, el tamaño del poro es más pequeño. Lo anterior podría explicar por qué la erosión de la cinta fue más frecuente en las cintas multifilamento, aunque no se alcanzó significación estadística.
Descripción de la afección
La incontinencia se presenta cuando esta relación normal entre los componentes de las vías urinarias inferiores se interrumpe como resultado de un daño nervioso o un traumatismo mecánico directo a los órganos pelvianos. La edad avanzada, un mayor número de partos, el parto vaginal, la obesidad y el estado posmenopáusico se asocian con un mayor riesgo de incontinencia urinaria (Wilson 1996).
Hay diferentes formas de incontinencia urinaria, de las que la IUE es el tipo más frecuente y representa al menos el 50% de los casos de incontinencia urinaria en las mujeres (Hannestad 2000). La IUE es la pérdida involuntaria de orina que ocurre con el esfuerzo físico (p.ej. las actividades deportivas), o al estornudar o toser (Haylen 2010). La incontinencia de esfuerzo urodinámica (IEU) es la pérdida involuntaria de orina observada durante la cistometría de llenado y se asocia con el aumento de la presión intraabdominal, en ausencia de contracción del detrusor (Haylen 2010). Se reconocen dos mecanismos para la incontinencia de esfuerzo: hipermovilidad o desplazamiento significativo de la uretra y el cuello vesical durante el esfuerzo, y deficiencia intrínseca del esfínter uretral(Blaivas 1988). Estos mecanismos pueden coexistir en las pacientes (O'Donnell 1994). Pocos ensayos clínicos han diferenciado las dos afecciones, probablemente porque no hay pruebas estandarizadas y validadas disponibles hasta la fecha (Blaivas 1988; McGuire 1993). En esta revisión se consideraron las pacientes con incontinencia probablemente debida a cualquiera de los mecanismos combinados.
El diagnóstico de incontinencia de esfuerzo urodinámica implica que se realizó una investigación urodinámica para confirmar la incontinencia de esfuerzo; también puede identificar la presencia de hiperactividad del detrusor en la incontinencia mixta. La evaluación clínica estándar incluye la anamnesis, el examen físico, los gráficos de frecuencia y volumen y el análisis de orina. Algunos autores describieron pacientes con síntomas de incontinencia de esfuerzo solamente (el diagnóstico se realizó mediante una evaluación clínica sin urodinamia). En esta revisión se incluyeron pacientes con incontinencia urinaria de esfuerzo y pacientes con incontinencia de esfuerzo urodinámica.
La incontinencia urinaria de urgencia (IUU) es un deseo súbito e imperioso de orinar, difícil de diferir (urgencia) y que se acompaña de pérdida involuntaria de orina. La hiperactividad del detrusor (HD) es un diagnóstico que denota contracciones involuntarias del detrusor observadas durante la fase de llenado de una evaluación urodinámica. Puede ser espontánea o provocada y puede ser calificada según la causa (neurogénica o idiopática)(Haylen 2010). En la revisión se incluyeron pacientes con IUU y diagnóstico urodinámico formal de HD solamente si tenían incontinencia de esfuerzo coexistente (denominada incontinencia urinaria mixta [IUM]).
Las pacientes con IUM que se incluyeron en esta revisión presentaban síntomas de IUE más urgencia o IUU, o incontinencia de esfuerzo urodinámica (IEU) más HD (diagnóstico urodinámico).
Descripción de la intervención
El tratamiento de la IUE incluye intervenciones conservadoras, mecánicas, farmacológicas y quirúrgicas.
-
El tratamiento conservador se centra en modificaciones del estilo de vida, métodos físicos que incluyen entrenamiento muscular del suelo pélvico, estimulación eléctrica, biorretroalimentación y el uso de conos con peso.
-
Existen dispositivos mecánicos que previenen o reducen la pérdida urinaria, como por ejemplo los parches o tapones metálicos y los implantes uretrales o vaginales.
-
En el pasado se han utilizado farmacoterapias como los estrógenos y los agentes adrenérgicos alfa. Recientemente, los inhibidores de la recaptación de serotonina y la norepinefrina se han propuesto como nueva farmacoterapia para la IUE, solos o en combinación con otro tratamiento conservador (Ghoniem 2005).
Se deben ensayar estos tratamientos conservadores antes de recurrir a la cirugía. Las siguientes intervenciones son el tema de otras revisiones Cochrane.
-
Intervenciones de estilo de vida para el tratamiento de la incontinencia urinaria en adultos (Imamura 2010).
-
Entrenamiento de la vejiga para la incontinencia urinaria en adultos (Wallace 2004).
-
Comparaciones de los enfoques al entrenamiento muscular del suelo pelviano para la incontinencia urinaria en las mujeres (Hay‐Smith 2011).
-
Retroalimentación (feedback) o biorretroalimentación (biofeedback) para aumentar el entrenamiento muscular del piso pelviano en la incontinencia urinaria de la mujer (Herderschee 2011).
-
Entrenamiento muscular del piso pélvico agregado a otro tratamiento activo versus el mismo tratamiento activo solo para la incontinencia urinaria en mujeres(Ayeleke 2013).
-
Entrenamiento muscular del piso pelviano versus ningún tratamiento o tratamientos de control inactivo para la incontinencia urinaria en mujeres (Dumoulin 2014).
-
Intervenciones conservadoras combinadas para la incontinencia de urgencia, de esfuerzo o mixta en adultos (French 2010).
-
Conos vaginales con peso para la incontinencia urinaria (Herbison 2013).
-
Dispositivos mecánicos para la incontinencia urinaria en mujeres (Lipp 2011).
-
Terapia estrogénica para la incontinencia urinaria en mujeres posmenopáusicas (Cody 2012).
-
Fármacos adrenérgicos para la incontinencia urinaria en adultos (Alhasso 2005).
-
Inhibidores de la recaptación de serotonina y noradrenalina (IRSN) para la incontinencia urinaria de esfuerzo en adultos (Mariappan 2005).
-
Acupuntura para la incontinencia urinaria de esfuerzo en adultos(Wang 2013).
Los procedimientos quirúrgicos para tratar la IUE por lo general están dirigidos a levantar y apoyar la unión vesicouretral entre la uretra y la vejiga, pero en la última década se ha hecho énfasis en el apoyo suburetral a nivel de la uretra media. Debido a los desacuerdos sobre el mecanismo preciso por el cual se logra la continencia, la elección del procedimiento quirúrgico está influenciada por los problemas coexistentes, la preferencia del cirujano y las características físicas de la persona afectada.
En revisiones Cochrane se ha descrito y evaluado un gran número de métodos quirúrgicos para la IUE. Tradicionalmente, se agrupan en siete categorías:
-
cabestrillos suburetrales (incluidas las intervenciones tradicionales con cabestrillos suburetrales y las intervenciones mínimamente invasivas con cabestrillos; Rehman 2011);
-
suspensión abdominal retropúbica abierta (p.ej., colposuspensión [Burch/ Burch modificada], Marshall‐Marchetti‐Krantz [MMK); Lapitan 2012);
-
suspensión laparoscópica retropúbica (Dean 2006);
-
reparación vaginal anterior (colporrafia anterior; Glazener 2001);
-
suspensiones con aguja (Glazener 2004);
-
inyecciones uretrales (Kirchin 2012); y
-
esfínteres artificiales.
Los cabestrillos suburetrales se han convertido en la cirugía primaria preferida para la continencia en la práctica clínica actual. Varios desarrollos en el tipo y la técnica han dado lugar a la separación de la revisión original sobre cabestrillos, Bezerra 2005, en tres revisiones diferentes que se centran en:
-
cabestrillos suburetrales tradicionales (Rehman 2011)
-
cabestrillos mínimamente invasivos como TVT y TOT (Ogah 2009), y
-
cabestrillos con incisión única, también conocidos como minicabestrillos (Nambiar 2014).
Los materiales utilizados para los cabestrillos pueden ser biológicos o sintéticos. La primera de estas revisiones se concentran en las intervenciones con cabestrillos suburetrales tradicionales (biológicos) (Rehman 2011). Una intervención tradicional con cabestrillos suburetrales requiere un abordaje combinado abdominal y vaginal. Las cintas de material se tunelizan por debajo de la uretra. Se fijan al músculo recto o a los ligamentos ileopectíneos, lo que provoca el ajuste del cabestrillo y un mayor apoyo vesical cada vez que la mujer contrae los músculos para impedir una pérdida. Se aplican bajo cirugía abierta y se fijan con suturas.
La presente revisión actual es una actualización de la segunda de estas revisiones y se centra en las intervenciones mínimamente invasivas con cabestrillos suburetrales con cabestrillos de materiales artificiales no absorbibles (sintéticos) (Ogah 2009). Las técnicas de estos procedimientos se describen a continuación. Esta revisión no incluye cabestrillos con incisión única.
La tercera de estas revisiones es una revisión nueva publicada recientemente que compara un nuevo tipo de cabestrillo, el cabestrillos con incisión única, que también se conoce como minicabestrillo (Nambiar 2014). La técnica es diferente de la de los cabestrillos originales sintéticos en que se realiza una incisión única dentro de la vagina mediante una cinta significativamente más corta y no hay una incisión para la salida de la cinta.
De qué manera podría funcionar la intervención
La presente revisión se centra en las intervenciones con cabestrillos mediouretrales. Incluyen la inserción de una cinta cubierta por una envoltura plástica alrededor de la uretra media sin fijación con suturas, realizada en algunos centros bajo anestesia local (Ulmsten 1995a; Ulmsten 1996; Smith 2002). El objetivo es restaurar o mejorar el apoyo uretral de la paciente durante un movimiento súbito como toser o estornudar, lo que evitaría la pérdida involuntaria de orina. Estudios ecográficos indican que el mecanismo de acción es la obstrucción intermitente o dinámica de la uretra por la cinta cuando ocurre un aumento de la presión abdominal (como al toser o estornudar; Dietz 2004).
Existen dos tipos principales de abordajes quirúrgicos.
-
Retropúbico: Este procedimiento incluye la inserción de dos agujas pasadas a través del espacio retropúbico de forma ciega desde la vagina al abdomen o del abdomen a la vagina. Se recomienda realizar una cistoscopía para detectar cualquier perforación de la vejiga o la uretra (Ulmsten 1995a; Ulmsten 1995b).
-
Transobturador: Se trata de otro tipo de intervención mínimamente invasiva con cabestrillos suburetrales sintéticos en la que la cinta se inserta en un plano horizontal por debajo de la zona media de la uretra entre los dos agujeros obturadores. Los extremos de la cinta se tunelizan percutáneamente con un tunelizador (aguja curva), nuevamente sin fijación con suturas. Como no se escinde el espacio retropúbico, se señala que no se requiere una cistoscopía (Delorme 2001; Delorme 2003; Delorme 2003; Poco después del desarrollo de esta técnica se describió una intervención similar en la que se pasa una cinta percutáneamente a través del agujero obturador, mediante una técnica dentro‐fuera, es decir, medial a lateral (de Leval 2003; de Leval 2005).
En esta revisión solamente se incluyeron las intervenciones con cabestrillos mediouretrales, con materiales de cinta sintéticos aplicados mediante intervenciones mínimamente invasivas a través del espacio retropúbico o la vía transobturador. Sin embargo, se han descrito varias modificaciones de la cirugía transobturador que utilizan la misma vía y también se incluyeron.
En esta actualización, a diferencia de la revisión original en la que los ensayos de cabestrillos mínimamente invasivos se compararon con los cabestrillos tradicionales, la colposuspensión abierta o la colposuspensión laparoscópica, estas técnicas de comparación no se incluyeron, ya que actualmente son analizadas por otras revisiones Cochrane (Dean 2006; Rehman 2011; Lapitan 2012).
Una inquietud al utilizar material sintético es el riesgo potencial de complicaciones causadas por la infección y la reacción tisular a las cintas. Entre los aspectos del material que pueden variar se incluyen el tamaño del poro, el diseño de monofilamento o multifilamentos y la biocompatibilidad. En esta revisión se incluyeron todos los tipos de mallas utilizadas en diferentes cabestrillos mínimamente invasivos, y se evaluaron las posibles diferencias entre el riesgo de complicaciones.
Por qué es importante realizar esta revisión
Se dispone de una amplia variedad de cintas sintéticas mínimamente invasivas, utilizadas en todo el mundo para el tratamiento de la IUE. La efectividad y la seguridad informada de estos procedimientos les hicieron muy populares, pero en el pasado ha habido controversia acerca de cuál de estos procedimientos es mejor, ya que la introducción de muchos de estos procedimientos y cintas estuvo dictada por el mercado y no se acompañó de ensayos controlados aleatorios prospectivos rigurosos de efectividad. Actualmente se han publicado más ensayos controlados aleatorios que evalúan su efectividad, pero muchos son demasiado pequeños para establecer conclusiones definitivas, de ahí la necesidad de la primera revisión.
La revisión inicial, Ogah 2009, mostró pruebas de eficacia a corto plazo, ya que muchos ensayos solamente informaron un seguimiento de 12 meses. Una ventaja significativa de una revisión Cochrane no es solamente la búsqueda en las bases de datos y la metodología rigurosas, sino lo que es más importante, la capacidad de actualizar la revisión y el metanálisis cuando hay nuevas pruebas disponibles. Este metanálisis de los ensayos disponibles es necesario para ayudar a emitir valoraciones sobre la eficacia a medio y a más largo plazo, ya que en la actualidad existen datos valiosos de 18 años desde el informe inicial de la cinta retropúbica mediouretral y de más de 11 años desde que se publicaron los primeros ensayos aleatorios de las cintas vaginales sin tensión y las cintas transobturador. También es necesario aportar pruebas sobre la seguridad presunta y esperada a medio y a más largo plazo de los dispositivos, así como sobre los eventos adversos inesperados a largo plazo. Esta actualización de la revisión intenta aclarar la incertidumbre que rodea el uso de los cabestrillos mediouretrales en cuanto al abordaje quirúrgico, la vía de inserción y el tipo de cinta utilizada.
Esta actualización solamente analiza los efectos de los cabestrillos mediouretrales y excluye los cabestrillos con incisión única y otros procedimientos quirúrgicos, p.ej. los cabestrillos tradicionales y la colposuspensión. También se excluyen las opciones de ningún tratamiento, tratamiento conservador y tratamiento farmacológico, ya que se analizarán en una revisión Cochrane futura.
Objetivos
Evaluar los efectos clínicos de las intervenciones con cabestrillos mediouretrales (CMU) para el tratamiento de la incontinencia urinaria de esfuerzo (IUE), la incontinencia de esfuerzo urodinámica (IEU) o la incontinencia urinaria mixta (IUM) en mujeres.
Métodos
Criterios de inclusión de estudios para esta revisión
Tipos de estudios
Ensayos controlados aleatorios o cuasialeatorios en pacientes con IUE (diagnóstico urodinámico) o síntomas de IEU o IUM (diagnóstico clínico), en los que ambos brazos del ensayo incluyen una intervención con un cabestrillo mediouretral.
Tipos de participantes
Mujeres adultas con IUE debido a hipermovilidad o deficiencia intrínseca del esfínter o ambas, diagnosticada clínicamente o mediante pruebas urodinámicas, y mujeres con IUM en las que la incontinencia de esfuerzo fue el síntoma predominante. La clasificación de los diagnósticos se aceptó tal como la definieron los autores de los ensayos.
Tipos de intervenciones
Ambos brazos de estudio del ensayo deben incluir intervenciones con cabestrillos mediouretrales para tratar la IUE o la IUM.
Se hicieron las siguientes comparaciones.
-
Vía transobturator (VTO) versus vía retropúbica (VRP).
-
Abordaje retropúbico inferior a superior versus abordaje retropúbico superior a inferior.
-
Abordaje obturador medial a lateral versus abordaje obturador lateral a medial.
-
Un método de inserción de cinta mediouretral versus otro método, la misma vía.
-
Un tipo de material de cinta versus otro
Las comparaciones con otros tipos de cirugía (es decir, cabestrillos tradicionales, cabestrillos con incisión única y colposuspensión) para la incontinencia urinaria se analizan en otras revisiones Cochrane recientes. Las opciones de ningún tratamiento, tratamiento conservador y tratamiento farmacológico también se han eliminado ya que se analizarán en una revisión Cochrane futura.
Tipos de medida de resultado
Resultados primarios
Las medidas de resultado utilizadas en esta revisión se seleccionaron sobre la base de su pertinencia para la curación clínica o la mejoría de la incontinencia. Se consideró que las principales medidas de efectividad son:
1. Observaciones de las mujeres
-
la proporción de pacientes curadas (continentes o secas) después de la cirugía;
-
la proporción de pacientes con mejoría de la incontinencia;
-
curación y mejoría medidas a corto plazo (menos de un año); a medio plazo (uno a cinco años); y a largo plazo (más de cinco años).
Resultados secundarios
2. Observaciones de las mujeres
-
Síntomas de incontinencia o tenesmo.
3. Cuantificación de los síntomas
-
Cambios de protectores absorbentes (a partir del número de protectores absorbentes utilizados autoinformado por la paciente).
-
Episodios de incontinencia (a partir de un gráfico vesical completado por la paciente).
-
Pruebas de apósito de goteo cuantificado (volumen promedio o peso de la pérdida urinaria).
4. Observaciones del médico
-
Tasas de curación objetiva a corto plazo (menos de un año); a medio plazo (uno a cinco años); y a largo plazo (más de cinco años).
-
Hiperactividad del detrusor de novo (diagnóstico urodinámico).
5. Medidas de resultado quirúrgicas
-
Duración de la operación.
-
Duración de la estancia hospitalaria.
-
Tiempo para regresar al nivel normal de actividad.
-
Pérdida de sangre durante la cirugía.
6. Eventos adversos
-
Lesión vascular o visceral grave.
-
Perforación vesical, uretral o intestinal.
-
Daño nervioso.
-
Complicaciones quirúrgicas perioperatorias (p.ej. infección, bacteriuria, hemorragia con o sin lesión de grandes vasos).
-
Disfunción de la evacuación vesical o la dificultad después de tres meses (con o sin confirmación urodinámica) o necesidad de uso de la sonda urinaria a largo plazo.
-
Infección relacionada con el uso de la malla sintética.
-
Erosión o extrusión o exposición de la cinta en la vagina.
-
Erosión o extrusión o exposición de la cinta en la vejiga o la uretra.
7. Necesidad de tratamiento adicional
-
Tratamiento con fisioterapia.
-
Farmacoterapia para la incontinencia urinaria o los síntomas.
-
Prolapso de los órganos pelvianos (p.ej. cistocele, rectocele, enterocele).
-
Cirugía de incontinencia repetida.
-
Cirugía posterior por prolapso.
8. Calidad de vida
Calidad de vida evaluada con:
-
medidas del estado de salud general (p.ej., Short Form 36 (Ware 1993));
-
instrumentos específicos de la afección diseñados para evaluar la incontinencia, p.ej. el cuestionario Bristol Female Lower Urinary Tract Symptoms (BFLUTS; Jackson 1996);
-
evaluación de la función sexual específica de la afección p.ej. mediante el Pelvic Organ Prolapse/Urinary Incontinence Sexual Function Questionnaire (PISQ‐12;Rogers 2003);
-
medidas psicológicas.
9. Medidas económicas
-
Costes de las intervenciones.
-
Relación entre coste y efectividad de las intervenciones.
-
Utilización de recursos.
10. Otros resultados
-
Resultados no predefinidos que se consideraron importantes al realizar la revisión.
Results
Description of studies
Results of the search
We screened the 841 records identified by the literature searches and obtained a total of 290 full‐text articles for further assessment. Altogether 217 reports concerning 81 randomised trials met the inclusion criteria. A further two trials were ongoing.
We excluded 551 records on the basis of either the title or abstract alone, and 71 reports relating to 62 studies after retrieval of the full text publication. Exclusion was either because they were not randomised trials, they did not include a mid‐urethral sling operation, or because the women included in the trial were not urinary incontinent. A full description of these trials can be found in the Characteristics of excluded studies section of this review. The flow of literature through the assessment process is shown in Figure 1.

PRISMA study flow diagram
We analysed trials with multiple treatment groups by treating each pair of arms as a separate comparison, as appropriate. There were six trials in this review that supplied data and for which this method was employed, thus leading to 87 comparisons. There were no trials with non‐standard designs, such as cross‐over trials and cluster‐randomised trials.
Included studies
Further characteristics of the trials are reported in the Characteristics of included studies table.
Comparisons and interventions
1. Transobturator (TOR) versus retropubic route (RPR)
This comparison of mid‐urethral sling operations was based on the routes that the tapes traverse, i.e. transobturator route (TOR) versus retropubic route (RPR). There were 55 trials that investigated this (Aigmuller 2014; Alkady 2009; Andonian 2007; Aniuliene 2009; Araco 2008; Barber 2008; Barry 2008; Cervigni 2006; Chen 2010; Chen 2012; Choe 2013; Darabi Mahboub 2012; David‐Montefiore 2006; Deffieux 2010; de Tayrac 2004; Diab 2012; El‐Hefnawy 2010; Enzelsberger 2005; Freeman 2011; Hammoud 2011; Jakimiuk 2012; Kamel 2009; Karateke 2009; Kilic 2007; Kim 2005; Krofta 2010; Laurikainen 2007; Leanza 2009; Lee 2007; Liapis 2006; Mansoor 2003; Mehdiyev 2010; Meschia 2007; Nerli 2009; Nyyssonen 2014; Oliveira 2006; Palomba 2008; Porena 2007; Rechberger 2009; Richter 2010; Riva 2006; Ross 2009; Salem 2014; Scheiner 2012; Schierlitz 2008; Tanuri 2010; Tarcan 2011; Teo 2011; van Leijsen 2013; Wang 2006; Wang 2008; Wang 2009; Wang 2010; Wang 2011; Zullo 2007).
2. Retropubic bottom‐to‐top approach versus retropubic top‐to‐bottom approach
Trials in this group compared the retropubic bottom‐to‐top approach (e.g. tension‐free vaginal tape (TVTTM); tape inserted from the vagina through the retropubic space and exiting onto the abdominal skin in the suprapubic region) with a retropubic top‐to‐bottom approach (e.g. suprapubic urethral support sling (SPARCTM); tape inserted from the abdomen in the suprapubic region through the retropubic space and exiting in the vagina). There were five such trials (Andonian 2005; Kim 2004; Lim 2005; Lord 2006; Tseng 2005).
3. Obturator medial‐to‐lateral approach versus obturator lateral‐to‐medial approach
Ten trials reported on this comparison which compared tapes traversing the obturator route: obturator lateral‐to‐medial approach, (e.g. TOTTM tape inserted in the thigh crease and through the obturator route exiting in the vagina) with obturator medial‐to‐lateral approach (e.g. TVT‐OTM tape inserted in the vagina and through the obturator route exiting in the thigh crease; Abdel‐Fattah 2010; But 2008; Chen 2010; Hassan 2013; Houwert 2009; Lee 2008; Liapis 2008; Park 2012; Peattie 2006; Scheiner 2012).
4. One method of mid‐urethral tape insertion versus another method, same route
Ten trials compared different methods of carrying out operations using the same route (Cho 2010; de Leval 2011; Elbadry 2014; Juang 2007; Naumann 2006; Paparella 2010; Rechberger 2011; Tommaselli 2012; Ugurlucan 2013; Zhang 2011).
The trials compared the following operations.
Transobturator lateral to medial
-
Monarc® TOT versus TOT® (Cho 2010).
-
TOT versus adjustable TOT (Elbadry 2014).
-
TOT versus TOT with two‐point fixation sutures (Rechberger 2011).
-
Synthetic TOT versus biological TOT (Paparella 2010; Ugurlucan 2013).
Transobturator medial to lateral
-
TVT‐O versus modified TVT‐O (shorter tape and less lateral dissection; de Leval 2011).
-
TVT‐O versus TVT‐O plus Ingleman‐Sundberg bladder denervation procedure (Juang 2007).
-
TVT‐O versus modified TVT‐O (reduced dissection; Tommaselli 2012).
-
TVT‐O versus modified TVT‐O (self‐tailored mesh; Zhang 2011).
Retropubic
-
TVT versus modified TVT, bottom‐to‐top (suburethral pad; Naumann 2006).
5. One type of tape material versus another
A final group compared different mid‐urethral sling operations based on the properties of the tape material. All used synthetic non‐absorbable mesh for the tape material, but differed in the structure of the material, i.e. monofilament tapes versus multifilament tapes. There were four such trials (Lim 2005; Meschia 2006; Okulu 2013; Rechberger 2003), which made the following comparisons.
-
Monofilament (TVT SPARC) verus multifilament (IVS; Lim 2005).
-
Monofilament (TVT) versus multifilament (IVS; Meschia 2006).
-
Synthetic monofilament (prolene light mesh) versus a combined synthetic mesh coated with a biological film (Ultrapro mesh) versus a multifilament mesh (Vypro; Okulu 2013).
-
Monofilament (TVT) versus multifilament (IVS; Rechberger 2003).
Publication type and sample characteristics
1. Retropubic route versus transobturator route
The sample sizes ranged from 20 to 597; with a median of 131.
Twelve of the 55 trials were reported only as abstracts (Cervigni 2006; Choe 2013; Darabi Mahboub 2012; Diab 2012; Hammoud 2011; Kamel 2009; Leanza 2009; Mansoor 2003; Oliveira 2006; Riva 2006; Salem 2014; Tarcan 2011).
Inclusion and exclusion criteria were not clearly stated in eight trials (Cervigni 2006; Chen 2010; Darabi Mahboub 2012; Kamel 2009; Mansoor 2003; Mehdiyev 2010; Oliveira 2006; Tarcan 2011).
All trials had women either presenting with SUI or had USI confirmed. In addition other characteristics included:
-
23 trials included women with MUI (Alkady 2009; Aigmuller 2014; Andonian 2007; Barber 2008; Barry 2008; Cervigni 2006; David‐Montefiore 2006; Deffieux 2010; El‐Hefnawy 2010; Freeman 2011; Kim 2005; Krofta 2010; Laurikainen 2007; Lee 2007; Nerli 2009; Nyyssonen 2014; Porena 2007; Richter 2010; Riva 2006; Scheiner 2012; Tarcan 2011; van Leijsen 2013; Wang 2011).
-
ten trials included women with previous incontinence surgery (Andonian 2007; Aniuliene 2009; Barber 2008; Barry 2008; David‐Montefiore 2006; de Tayrac 2004; Kim 2005; Lee 2007; Richter 2010; Wang 2010).
-
28 trials included women with pelvic organ prolapse (POP; Alkady 2009; Andonian 2007; Aniuliene 2009; Barber 2008; Barry 2008; Cervigni 2006; Chen 2012; David‐Montefiore 2006; El‐Hefnawy 2010; Freeman 2011; Krofta 2010; Laurikainen 2007; Mansoor 2003; Meschia 2007; Nerli 2009; Porena 2007; Rechberger 2009; Richter 2010; Riva 2006; Scheiner 2012; Schierlitz 2008; Tanuri 2010; Tarcan 2011; van Leijsen 2013; Wang 2006; Wang 2008; Wang 2009; Wang 2010).
-
in 13 trials women had concomitant pelvic or prolapse surgery (Andonian 2007; Barber 2008; Barry 2008; Cervigni 2006; David‐Montefiore 2006; Richter 2010; Riva 2006; Scheiner 2012; Schierlitz 2008; Tarcan 2011; Wang 2008; Wang 2009; Wang 2010).
Follow‐up for women ranged from one month to five years with a median follow‐up of 12 months.
2. Retropubic bottom‐to‐top approach versus retropubic top‐to‐bottom approach
Five trials investigated a retropubic bottom‐to‐top approach versus a retropubic top‐to‐bottom approach (Andonian 2005; Kim 2004; Lim 2005; Lord 2006; Tseng 2005). One of the five trials was reported only as an abstract (Kim 2004), and this was the only study without clear inclusion and exclusion criteria.
The sample sizes ranged from 62 to 304; the average sample size, 'n' (standard deviation), for retropubic in‐out was 62 (49) and for retropubic out‐in was 64 (53).
All trials had women either presenting with SUI or had USI confirmed. All trials except Tseng 2005 included women with MUI. Andonian 2005 and Lord 2006 included women with previous incontinence surgery.
All the trials included women with POP and had concomitant pelvic or POP surgery performed.
Follow‐up for women ranged from 1.5 months to 2 years with a median of 12 months.
3. Obturator medial‐to‐lateral approach versus obturator lateral‐to‐medial approach
Nine trials compared the obturator medial‐to‐lateral approach with the obturator lateral‐to‐medial approach (Abdel‐Fattah 2010; But 2008; Chen 2010; Hassan 2013; Houwert 2009; Lee 2008; Liapis 2008; Park 2012; Scheiner 2012). With the exception of Hassan 2013, which was reported only as an abstract, the other eight trials were reported as full articles. Peattie 2006 appears in a trials registry but its status is unclear; we have contacted the authors and are awaiting a response.
The sample sizes ranged from 74 to 341 with a median size of 110.
Inclusion and exclusion criteria were not clearly stated in two trials (But 2008; Hassan 2013).
All trials had women either presenting with SUI or had USI confirmed.
Five trials included women with MUI (Abdel‐Fattah 2010; But 2008; Lee 2008; Park 2012; Scheiner 2012), and two trials included women who had undergone previous incontinence surgery (Abdel‐Fattah 2010; Scheiner 2012). Scheiner 2012 included women with POP and women with concomitant pelvic or POP surgery.
Follow‐up ranged from three months to three years with a median follow up of 12 months.
4. One method of mid‐urethral tape insertion versus another method, same route
Ten trials investigated one method of mid‐urethral tape versus another method, using the same route (Cho 2010; de Leval 2011; Elbadry 2014; Juang 2007; Naumann 2006; Paparella 2010; Rechberger 2011; Tommaselli 2012; Ugurlucan 2013; Zhang 2011). Three of these trials were reported only as abstract publications (Cho 2010; Elbadry 2014; Naumann 2006). The sample sizes ranged from 72 to 463 with a median of 156.
All the trials included women with SUI or USI. Rechberger 2011 reported women with ISD. Inclusion and exclusion criteria were not clearly defined in four of the ten trials (Cho 2010; Elbadry 2014; Juang 2007; Naumann 2006). Juang 2007, Tommaselli 2012 and Ugurlucan 2013 included women with MUI, whilst de Leval 2011 and Ugurlucan 2013 included women who had undergone previous incontinence surgery. Women with prolapse were included in de Leval 2011 and Ugurlucan 2013, but concomitant POP surgery was performed only in Ugurlucan 2013.
Follow‐up ranged from three months to three years.
5. One type of tape material versus another
Four trials investigated the use of monofilament tape versus multifilament tape (Lim 2005; Meschia 2006; Okulu 2013; Rechberger 2003). All four trials were reported as full article publications.
The sample sizes ranged from 70 to 182 with a median value of 144.
The trials had women either presenting with SUI or had USI confirmed: all had clear inclusion and exclusion criteria. Three trials included women with POP (Lim 2005; Meschia 2006; Rechberger 2003). Two trials included women with MUI (Lim 2005; Meschia 2006). Three trials included women with previous incontinence surgery (Lim 2005; Okulu 2013; Rechberger 2003), whereas only Lim 2005 included women who had concomitant pelvic or POP surgery.
Follow‐up for women ranged from three months to three years.
Outcomes
The trials reported their outcomes in a variety of different ways. The primary outcome, subjective cure of urinary incontinence (UI), was defined as follows:
-
no subjective report of UI (Aniuliene 2009; Barber 2008; But 2008; Cho 2010; Darabi Mahboub 2012; de Leval 2011; de Tayrac 2004; Deffieux 2010; El‐Hefnawy 2010; Freeman 2011; Hassan 2013; Houwert 2009; Jakimiuk 2012; Kim 2004; Laurikainen 2007; Leanza 2009; Liapis 2006; Lim 2005; Lord 2006; Mansoor 2003; Naumann 2006; Nerli 2009; Okulu 2013; Paparella 2010; Porena 2007; Richter 2010; Riva 2006; Scheiner 2012; Schierlitz 2008; Tanuri 2010; Tarcan 2011; Ugurlucan 2013; van Leijsen 2013; Wang 2010; Wang 2011; Zhang 2011);
-
no subjective report of UI and negative stress test (Lee 2007; Meschia 2006; Meschia 2007; Park 2012; Rechberger 2003; Rechberger 2009; Wang 2008);
-
no or improved subjective report of UI (Abdel‐Fattah 2010; Aigmuller 2014; Barry 2008; Karateke 2009; Ross 2009; Teo 2011; Zullo 2007).
Secondary outcome objective cure was defined by the trialists as follows:
-
absence of USI on urodynamics (UDS) (Abdel‐Fattah 2010; Araco 2008; Barry 2008; Cervigni 2006; Enzelsberger 2005; Kamel 2009; Karateke 2009; Kilic 2007; Kim 2005; Krofta 2010; Lim 2005; Riva 2006; Schierlitz 2008; Zullo 2007);
-
absence of SUI and negative stress test (Alkady 2009; Paparella 2010; Porena 2007);
-
one‐hour pad test less than 2 g (Andonian 2005; Andonian 2007; But 2008; Ross 2009; Tseng 2005);
-
24‐hour pad test less than 5 g (Darabi Mahboub 2012; Okulu 2013; Teo 2011);
-
negative stress test (Aigmuller 2014; Aniuliene 2009; Barber 2008; Chen 2010; David‐Montefiore 2006; de Leval 2011; de Tayrac 2004; Deffieux 2010; El‐Hefnawy 2010; Juang 2007; Kim 2004; Kim 2005; Laurikainen 2007; Lord 2006; Meschia 2007; Nerli 2009; Tarcan 2011; van Leijsen 2013; Wang 2009; Wang 2011);
-
multiple objective measures used (El‐Hefnawy 2010; Juang 2007; Kamel 2009; Kim 2005; Krofta 2010; Liapis 2006; Liapis 2008; Mansoor 2003; Meschia 2006; Naumann 2006; Nyyssonen 2014; Oliveira 2006; Rechberger 2011; Richter 2010; Scheiner 2012; Tanuri 2010; Tommaselli 2012; Wang 2006; Wang 2008; Wang 2010).
Excluded studies
We excluded 62 studies after retrieval of the full text publication because they were not randomised trials, did not include a mid‐urethral sling operation, the participants did not have urinary incontinence, or the participants were randomised to an intervention other than a mid‐urethral sling (such as no treatment, pelvic floor muscle training, drugs, or a different class of surgery). The details of the reasons for exclusion are given in the Characteristics of excluded studies table.
Ongoing trials
There are two ongoing trials: Cavkaytar 2013 and Sung 2013.
Cavkaytar 2013 is a randomised controlled trial (RCT) comparing RPR and TOR for the treatment of SUI in women with no intrinsic sphincter deficiency. This study is currently recruiting and includes women with SUI and excludes women with MUI or detrusor overactivity (DO), previous incontinence surgery, and women with a body mass index greater than 35. Fifty women have been randomly assigned into each arm for evaluation.
Sung 2013 is an RCT comparing mid‐urethral sling operations and behavioural or pelvic floor therapy in combination versus suburethral sling operations alone for women with MUI. The ESTEEM trial includes women over 18 years of age who have had urodynamic investigation within the last 18 months, and excludes women with prolapse, previous incontinence surgery, and women currently on antimuscarinic medication. This trial is currently recruiting participants.
Studies awaiting classification
There are no studies awaiting classification.
New trials included in this update
We have included 48 new trials in this update (Abdel‐Fattah 2010; Aigmuller 2014; Alkady 2009; Andonian 2007; Aniuliene 2009; Chen 2010; Chen 2012; Cho 2010; Choe 2013; Darabi Mahboub 2012; de Leval 2011; Diab 2012; Elbadry 2014; El‐Hefnawy 2010; Freeman 2011; Hassan 2013; Hammoud 2011; Jakimiuk 2012; Juang 2007; Kamel 2009; Karateke 2009; Kilic 2007; Krofta 2010; Leanza 2009; Mehdiyev 2010; Naumann 2006; Nerli 2009; Nyyssonen 2014; Okulu 2013; Palomba 2008; Paparella 2010; Park 2012; Peattie 2006; Rechberger 2011; Richter 2010; Ross 2009; Salem 2014; Scheiner 2012; Tanuri 2010; Tarcan 2011; Teo 2011; Tommaselli 2012; Ugurlucan 2013; van Leijsen 2013; Wang 2008; Wang 2010; Wang 2011; Zhang 2011).
Previously included trials with new outcome data
We have included new data from 11 trials previously included in this review, including the report of medium‐ or long‐term outcomes (Barber 2008; But 2008; David‐Montefiore 2006; Deffieux 2010; Houwert 2009; Laurikainen 2007; Porena 2007; Rechberger 2009; Schierlitz 2008; Wang 2009; Zullo 2007).
Previously included trials with no new outcome data
Twenty‐two trials included in the earlier version of this review have not published new outcome data (Andonian 2005; Araco 2008; Barry 2008; Cervigni 2006; de Tayrac 2004; Enzelsberger 2005; Kim 2004; Kim 2005; Lee 2007; Lee 2008; Liapis 2006; Liapis 2008; Lim 2005; Lord 2006; Mansoor 2003; Meschia 2006; Meschia 2007; Oliveira 2006; Rechberger 2003; Riva 2006; Tseng 2005; Wang 2006).
Risk of bias in included studies
Details of the criteria used to assess the risk of bias and the ratings for each study are reported in the 'Risk of bias' tables that accompany the Characteristics of included studies. Further information on the risk of bias in included trials is shown in Figure 2 the 'Risk of bias' graph and Figure 3 the ‘Risk of bias' summary.

Risk of bias graph: review authors' judgments about each risk of bias item presented as percentages across all included studies.

Risk of bias summary: review authors' judgments about each risk of bias item for each included study.
The risk of bias in the trials included was variable, though overall only few trials were judged to be at high risk of bias. In over 50% of trials the random sequence generation was judged to be adequate, for example with the use of a computer‐generated list or a table of random numbers. Approximately 30% of trials confirmed that secure concealment of the randomisation process was used, for example allocation by a remote person or the use of sealed envelopes.
Blinding of participants was unclear in the majority of trials. This is an obvious limitation with trials comparing surgical interventions, though one trial described the use of a 'sham' procedure (Jakimiuk 2012). Blinding of patients and the post‐operative reviewer was not reported in most trials. Loss to follow‐up in most trials was minimal, and in approximately 50% of included trials the risk of attrition bias was judged to be low.
We judged that 39 trials had adequate random sequence generation (Abdel‐Fattah 2010; Aigmuller 2014; Alkady 2009; Andonian 2005; Araco 2008; Barber 2008; But 2008; Cervigni 2006; Chen 2012; David‐Montefiore 2006; Deffieux 2010; de Tayrac 2004; Freeman 2011; Jakimiuk 2012; Karateke 2009; Krofta 2010; Laurikainen 2007; Lord 2006; Mansoor 2003; Meschia 2006; Meschia 2007; Nyyssonen 2014; Okulu 2013; Paparella 2010; Porena 2007; Richter 2010; Ross 2009; Scheiner 2012; Schierlitz 2008; Teo 2011; Tommaselli 2012; Tseng 2005; Ugurlucan 2013; van Leijsen 2013; Wang 2006; Wang 2008; Wang 2009; Wang 2011; Zullo 2007).
We judged that adequate allocation concealment occurred in 26 trials (Abdel‐Fattah 2010; Aigmuller 2014; Alkady 2009; Andonian 2005; Araco 2008; Barber 2008; David‐Montefiore 2006; Deffieux 2010; de Tayrac 2004; El‐Hefnawy 2010; Freeman 2011; Laurikainen 2007; Lord 2006; Mansoor 2003; Meschia 2006; Meschia 2007; Nyyssonen 2014; Okulu 2013; Paparella 2010; Porena 2007; Ross 2009; Teo 2011; Tommaselli 2012; van Leijsen 2013; Wang 2011; Zullo 2007).
We judged that 24 trials had an adequate randomisation process and secure concealment of the randomisation process (Aigmuller 2014; Alkady 2009; Andonian 2005; Araco 2008; Barber 2008; David‐Montefiore 2006; Deffieux 2010; de Tayrac 2004; Freeman 2011; Laurikainen 2007; Lord 2006; Mansoor 2003; Meschia 2006; Meschia 2007; Nyyssonen 2014; Okulu 2013; Paparella 2010; Porena 2007; Ross 2009; Teo 2011; Tommaselli 2012; van Leijsen 2013; Wang 2011; Zullo 2007).
We judged that 22 trials adequately blinded outcome assessors (Abdel‐Fattah 2010; Andonian 2005; Andonian 2007; Araco 2008; Barber 2008; de Tayrac 2004; El‐Hefnawy 2010; Karateke 2009; Krofta 2010; Liapis 2006; Liapis 2008; Lord 2006; Paparella 2010; Porena 2007; Rechberger 2003; Tseng 2005; Ugurlucan 2013; van Leijsen 2013; Wang 2006; Wang 2009; Wang 2010; Zullo 2007).
We judged 36 trials to be at a low risk of attrition bias (Abdel‐Fattah 2010; Aigmuller 2014; Alkady 2009; Andonian 2005; Aniuliene 2009; Barber 2008; Barry 2008; But 2008; Deffieux 2010; de Leval 2011; El‐Hefnawy 2010; Freeman 2011; Karateke 2009; Krofta 2010; Laurikainen 2007; Liapis 2006; Liapis 2008; Lord 2006; Meschia 2007; Nyyssonen 2014; Paparella 2010; Park 2012; Porena 2007; Rechberger 2009; Ross 2009; Scheiner 2012; Tanuri 2010; Tommaselli 2012; Tseng 2005; Ugurlucan 2013; Wang 2006; Wang 2008; Wang 2009; Wang 2010; Wang 2011; Zullo 2007).
Effects of interventions
See: Summary of findings for the main comparison Transobturator (TOR) compared to retropubic (RPR) route for stress urinary incontinence in women; Summary of findings 2 Retropubic bottom‐to‐top approach compared to retropubic top‐to‐bottom approach for stress urinary incontinence in women; Summary of findings 3 Obturator medial‐to‐lateral approach compared to obturator lateral‐to‐medial approach for stress urinary incontinence in women; Summary of findings 4 Monofilament compared to multifilament tapes for stress urinary incontinence in women
Comparison 1. Transobturator versus retropubic route
Fifty‐five trials addressed this comparison (Aigmuller 2014; Alkady 2009; Andonian 2007; Aniuliene 2009; Araco 2008; Barber 2008; Barry 2008; Cervigni 2006; Chen 2010; Chen 2012; Choe 2013; Darabi Mahboub 2012; David‐Montefiore 2006; de Tayrac 2004; Deffieux 2010; Diab 2012; El‐Hefnawy 2010; Enzelsberger 2005; Freeman 2011; Hammoud 2011; Jakimiuk 2012; Kamel 2009; Karateke 2009; Kilic 2007; Kim 2005; Krofta 2010; Laurikainen 2007; Leanza 2009; Lee 2007; Liapis 2006; Mansoor 2003; Mehdiyev 2010; Meschia 2007; Nerli 2009; Nyyssonen 2014; Oliveira 2006; Palomba 2008; Porena 2007; Rechberger 2009; Richter 2010; Riva 2006; Ross 2009; Salem 2014; Scheiner 2012; Schierlitz 2008; Tanuri 2010; Tarcan 2011; Teo 2011; van Leijsen 2013; Wang 2006; Wang 2008; Wang 2009; Wang 2010; Wang 2011; Zullo 2007).
1.1 Women's observations
Subjective cure within 12 months was reported in 36 trials with a total of 5514 participants. Assessment of cure was self‐reported by participants and by responses to symptom‐based questionnaires. The combined results from the 36 trials showed no statistically significant difference in the subjective cure rates between the two routes (RR 0.98, 95% CI 0.96 to 1.00; Analysis 1.1). The short‐term subjective cure ranged from 62% to 98% for TOR and from 71% to 97% for RPR.
The mean subjective cure rate across both groups was 83.3% and, using this as the assumed control subjective cure rate in the RPR group, for every 1000 women there were 17 fewer cured in the TOR group (95% CI from 0 fewer to 33 fewer per 1000). This was not statistically significant and is also unlikely to be considered to be a clinically significant difference. The funnel plot inspection shows no strong evidence of publication bias Figure 4.
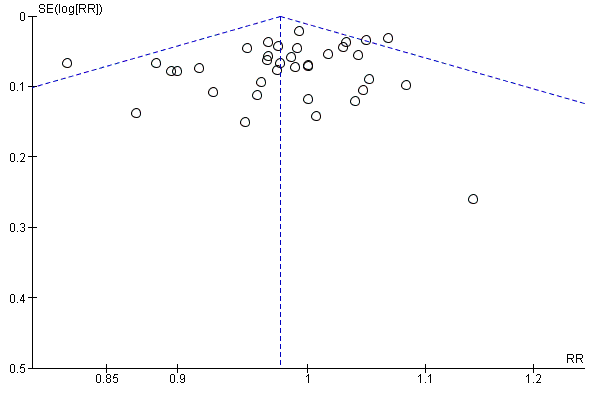
Funnel plot of comparison: 1 Transobturator (TOR) versus retropubic (RPR) route, outcome: 1.1 Subjective cure (short term, ≤ 1 year)
There was also no statistically significant difference between the two groups in terms of symptomatic improvement and cure rate (RR 0.98, 95% CI 0.96 to 1.00; Analysis 1.2).
Medium‐term outcomes
Only seven trials provided information after the first year (Deffieux 2010; Laurikainen 2007; Nyyssonen 2014; Porena 2007; Schierlitz 2008; Tarcan 2011; Zullo 2007). Five trials (683 participants) contributed medium‐term data between one and five years after surgery, which showed no significant difference in subjective cure between the two groups (RR 0.97, 95% CI 0.87 to 1.09; Analysis 1.3). Subjective cure rates ranged from 82% to 91% in the TOR group and from 77% to 98% in the RPR group.
The average medium‐term subjective cure rate across both groups was 86.9% and, using this as the assumed control cure rate in the RPR group, for every 1000 women there were 26 fewer women cured in the TOR group (95% CI from 26 per 1000 more to 70 per 1000 fewer).
Long‐term outcomes
Four trials (714 women) reported long‐term results for subjective cure after five years (Laurikainen 2007; Porena 2007; Richter 2010; Zullo 2007); the difference between the groups was not statistically significant (RR 0.95, 95% CI 0.80 to 1.12; Analysis 1.4). Subjective cure rates range from 43% to 92% in the TOR group and from 51% to 88% in the RPR group.
The average long‐term subjective cure rate across both groups was 84.3% and, using this as the assumed control cure rate in the RPR group, for every 1000 women there were 42 fewer women cured in the TOR group (95% CI from 110 per 1000 less to 34 per 1000 more).
Two trials with 340 women reported long‐term data for subjective cure and improvement and the difference between the groups was not statistically significant (RR 0.92, 95% CI 0.67 to 1.28; Analysis 1.5); due to significant heterogeneity we also performed a random‐effects analysis that produced similar results and, as there were only two trials, the fixed‐effect analysis was maintained.
1.2 Quantification of symptoms
Only two trials provided data about pad test weights (Tanuri 2010 used a non standardised modified/simplified pad test and Wang 2006 used the standard one‐hour pad test). The information provided was not suitable for meta‐analysis, but each reported a significant reduction in pad weight postoperatively in each group without a significant difference between the groups.
1.3 Clinician's observations
Objective cure was assessed by 40 trials with 6145 participants in the short term using a variety of measures such as urodynamic assessment, negative cough‐stress test, one‐hour pad test of 2 g or less, one‐hour pad test of 1 g or less, and 24‐hour pad test of 5g or less. The cure rate with the obturator route was 85.7% versus 87.2% for the RPR (RR 0.98, 95% CI 0.96 to 1.00, Analysis 1.6). The confidence interval was narrow and this statistically non significant difference between the groups (2%) is unlikely to represent a clinically significant difference in outcome between the two methods in the short term.
The small difference in the objective cure and improvement rate in the short term was not statistically ‐ nor was it likely to be clinically ‐ significant (RR 0.98, 95% CI 0.96 to 1.01; 10 studies, 1478 women; Analysis 1.7). The same holds true for the medium‐term objective cure rates (RR 1.00, 95% CI 0.95 to 1.06; 5 studies, 596 women; Analysis 1.8), and long‐term cure rates (RR 0.97, 95% CI 0.90 to 1.06; 3 studies, 400 women; Analysis 1.9).
1.4 Surgical outcome measures
Duration of operation was significantly shorter, by an average of approximately seven minutes, with the TOR compared with the RPR (MD ‐7.54 minutes, 95% CI ‐9.31 to ‐5.77). There was statistically significant heterogeneity, but all the trials reported a shorter operating time with the TOR. This may be attributable to most surgeons routinely performing a cystoscopy following a RPR procedure, but not necessarily doing this after a TOR procedure.
To investigate this theory, we performed a sensitivity analysis to assess the difference in operative time between the RPR and TOR approach in trials where cystoscopy was performed in both comparison groups as defined by the trialists. In eight trials where cystoscopy was performed in both TOR and RPR groups we still found a shorter operating time with the TOR in comparison to the RPR (MD ‐6.50 95% CI ‐7.57 to ‐5.44) although high heterogeneity persisted. Using a random‐effects method on the full analysis of 31 trials still showed the duration of operation to be statistically significantly shorter with TOR approach (MD ‐7.54 minutes, 95% CI ‐9.31 to ‐5.77; Analysis 1.10).
Intraoperative blood loss was small (mean loss ranged from 15 ml to 125 ml), but was significantly less with the TOR approach (MD ‐6.49 ml, 95% CI ‐12.33 to ‐0.65; Analysis 1.11). There was significant heterogeneity that was accounted for by three small trials (Nerli 2009; Wang 2008; Zullo 2007). In view of the small blood volumes involved, this is unlikely to be a clinically significant finding.
Length of stay was also significantly shorter by an average of 0.17 days with the TOR compared with the retropubic route (MD ‐0.17, 95% CI ‐0.25 to ‐0.10; Analysis 1.12). A high level of between‐study heterogeneity (I² 94%) was present with the length of stay, thus a random‐effects model was used, which then showed no significant difference (MD ‐0.25, 95% CI ‐0.59 to 0.09; Analysis 1.12).
The mean time the women took to return to normal activity ranged from under two weeks to just over five weeks, with no statistically significant difference between the two surgical approaches (MD ‐0.05, 95% CI ‐0.15 to 0.06; Analysis 1.13). This confirms the minimally invasive nature of both operations, compared with a more normal recovery period of three months after major abdominal surgery.
1.5 Adverse events
In trials where overall perioperative complication rates were reported there were no statistically significant differences in the rate of perioperative complications between the TOR and RPR groups (RR 0.91, 95% CI 0.73 to 1.14; Analysis 1.14).
In trials where specific complications were recorded there were significant differences in the rate of each individual complication sustained.
Major vascular/visceral injury
Major vascular injury such as retropubic haematoma or major visceral injury, for example bowel perforation, was reported by 28 trials with 4676 women. This occurred significantly less often with TOR than with RPR (RR 0.33, 95% CI 0.19 to 0.55; Analysis 1.15).
Bladder/urethral perforation
Forty trials assessed rate of bladder perforation. The rate was significantly lower in the TOR group than the RPR group (RR 0.13, 95% CI 0.08 to 0.20; Analysis 1.16). The average bladder perforation rate across both groups was 2.54% and, using this as the assumed control bladder perforation rate in the RPR group, there were 22 fewer perforations per 1000 in the TOR group (95% CI from 20 to 23 per 1000 fewer). There was some degree of asymmetry in the funnel plot, which raised the possibility of some publication bias Figure 5.

Funnel plot of comparison: 1 Transobturator (TOR) versus retropubic (RPR) route, outcome: 1.16 Bladder or urethral perforation
Postoperative voiding dysfunction (POVD)
Rates of postoperative voiding dysfunction (POVD) was assessed in 37 trials with 6200 participants. This showed significantly lower rates in the TOR group than in the RPR group (RR 0.53 95% CI 0.43 to 0.65; Analysis 1.17). The average POVD rate across both groups was 5.53% and, using this as the assumed control rate in the RPR group, there were 26 fewer POVD per 1000 in the TOR group (95% CI from 19 to 32 per 1000 fewer). The funnel plot showed symmetry on visual inspection, which suggests a low likelihood of publication bias Figure 6.

Funnel plot of comparison: 1 Transobturator (TOR) versus retropubic (RPR) route, outcome: 1.17 Voiding dysfunction
Urgency and urgency urinary incontinence (UUI)
The 31 trials (4923 women) that reported de novo urgency and urgency urinary incontinence (UUI) showed no statistically significant difference between the two groups (RR 0.98, 95% CI 0.82 to 1.17; Analysis 1.18). In the short term the average rate of de novo urgency/UUI across both groups was 8.35% and, using this as the assumed control rate in the RPR group, there were two fewer cases per 1000 in the TOR group (95% CI from 15 per 1000 fewer to 14 per 1000 more).
Equally, in the medium term the rate of de novo urgency and UUI was not significantly different (RR 0.98, 95% CI 0.55 to 1.73, Analysis 1.19). Laurikainen 2007 reported long‐term data for de novo urgency and UUI for 253 women; this showed no difference between the groups (RR 0.81, 95% CI 0.18 to 3.53; 253 women; Analysis 1.20).
Four trials with 853 women with DO showed a rate of 8% in both groups (RR 1.00, 95% CI 0.58 to 1.73; Analysis 1.21).
In one trial of women with MUI (Laurikainen 2007), 84% who had pre‐existing moderate or severe urinary frequency and urgency symptoms were cured of these symptoms post operatively at the five‐year follow‐up.
Vaginal tape erosion
Vaginal tape erosion was assessed in 31 trials with 4743 participants. No significant difference was demonstrated between the groups (RR 1.13, 95% CI 0.78 to 1.65; Analysis 1.22). The average rate of vaginal tape erosion across both groups was 2.09%, and, using this as the assumed control rate in the RPR group, there were three more cases per 1000 in the TOR group (95% CI from 5 per 1000 fewer to 14 per 1000 more). The funnel plot showed symmetry on visual inspection suggesting low likelihood of publication bias Figure 7. In the one trial that reported long‐term tape erosion (Laurikainen 2007), no tape erosion was reported in either group. Bladder or urethral tape erosion was assessed in four trials with 374 participants. No significant difference was demonstrated between the groups (RR 0.34, 95% CI 0.01 to 8.13; Analysis 1.23).
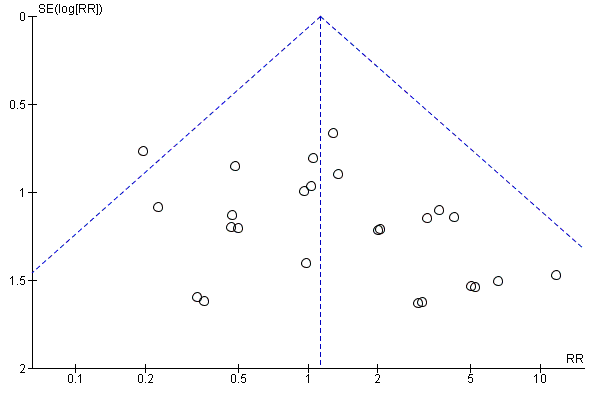
Funnel plot of comparison: 1 Transobturator (TOR) versus retropubic (RPR) route, outcome: 1.22 Vaginal tape erosion
Pain
There was a significantly higher occurrence of groin pain in women who underwent a TOR procedure than in women who underwent a RPR procedure (RR 4.12, 95% CI 2.71 to 6.27; Analysis 1.24). The average rate of groin pain across both groups was 4.51% and, using this as the assumed control rate in the RPR group, there were 163 more cases per 1000 in the TOR group (95% CI from 94 to 266 per 1000 more). Conversely, suprapubic pain was found to be significantly lower in women who underwent a TOR procedure than a RPR procedure (RR 0.29, 95% CI 0.11 to 0.78; Analysis 1.25). Both groin and suprapubic pain occurrence were short‐lasting, with most resolving within the first six months. The duration of pain ranged from two to 52 weeks, with a median duration of eight weeks. The funnel plot for groin pain showed symmetry on visual inspection, suggesting low likelihood of publication bias Figure 8.

Funnel plot of comparison: 1 Transobturator (TOR) versus retropubic (RPR) route, outcome: 1.24 Groin pain
1.6 Need for further treatment
Nine trials (1402 women) reported the number of women who required repeat incontinence surgery in the short term (up to one year). The difference between the TOR and RPR groups was not statistically significant (RR 1.64, 95% CI 0.85 to 3.16; Analysis 1.26). The average rate of repeat incontinence surgery in the short term across both groups was 2.43% and, using this as the assumed control rate in the RPR group, there were 12 more cases per 1000 in the TOR group (95% CI from 3 per 1000 fewer to 41 per 1000 more).
More women required repeat incontinence surgeries in the TOR group in the medium term (RR 21.89, 95% CI 4.36 to 109.77; two studies, 355 women; Analysis 1.27).
In the long term, three trials with data from 487 women, found that more women required repeat incontinence surgery in the TOR group (RR 8.79, 95% CI 3.36 to 23.00; Analysis 1.28). The average rate of repeat incontinence surgery in the long term across both groups was 5.34% and, using this as the assumed control rate in the RPR group, there were 231 more cases per 1000 in the TOR group (95% CI from 45 to 767/1000 more).
1.7 Quality of life
Thirty‐three of the 55 trials in this comparison assessed quality of life (QoL; Aigmuller 2014; Andonian 2007; Barber 2008; Barry 2008; Chen 2012; Darabi Mahboub 2012; David‐Montefiore 2006; Deffieux 2010; de Tayrac 2004; El‐Hefnawy 2010; Freeman 2011; Jakimiuk 2012; Karateke 2009; Kim 2005; Krofta 2010; Laurikainen 2007; Leanza 2009; Mansoor 2003; Meschia 2007; Nerli 2009; Porena 2007; Richter 2010; Riva 2006; Ross 2009; Scheiner 2012; Schierlitz 2008; Tanuri 2010; Tarcan 2011; Teo 2011; Wang 2008; Wang 2010; Wang 2011; Zullo 2007); however only 11 of these trials reported QoL scores (Andonian 2007; Barber 2008; Barry 2008; David‐Montefiore 2006; de Tayrac 2004; Laurikainen 2007; Meschia 2007; Porena 2007; Riva 2006; Schierlitz 2008; Wang 2008).
A wide variety of measures were used by different trials to assess this outcome, including:
Condition‐specific measures
-
Incontinence Impact Questionnaire (IIQ‐7).
-
Urogenital Distress Inventory (UDI‐6).
-
International Consultation on Incontinence Questionnaire (ICIQ).
-
Urinary Incontinence Quality of Life Scale (I‐QOL).
-
Kings Health Questionnaire (KHQ).
-
Bristol Female Lower Urinary Tract Symptoms questionnaire (BFLUTS).
-
Women Irritative Prostate Symptoms Score (W‐IPSS).
-
Urinary Incontinence Severity Score (UISS).
-
Detrusor Instability Score (DIS).
-
A Visual Analogue Scale (VAS).
-
CONTILIFE.
Generic measures
-
EuroQoL 5‐Dimensional Classification Component Scores (EuroQoL‐5D).
-
Short‐Form Health‐Related QoL (SF‐36).
-
Patient Global Impression of Severity (PGI‐S).
-
Patient Global Impression of Improvement (PGI‐I).
The data on quality of life outcomes were reported in different ways, which precluded meta‐analysis. In general, with the exception of Araco 2008, all trials found that women's QoL improved significantly post‐operatively within each group, but no statistically significant differences were found between the randomised groups. Only the Araco 2008 trial found the I‐QOL scores to be statistically significantly higher postoperatively after the retropubic approach.
Sexual function quality of life measures
Sexual function was addressed in 10 trials (Barber 2008; Barry 2008; Deffieux 2010; de Tayrac 2004; Freeman 2011; Krofta 2010; Richter 2010; Ross 2009; Scheiner 2012; Schierlitz 2008), which used a variety of measures including validated questionnaires and direct questioning. Questionnaires employed were:
-
Prolapse/Incontinence Symptoms Questionairre (PISQ‐12);
-
Bristol Female Lower Urinary Tract Symptoms questionnaire (BFLUTS);
-
International Consultation on Incontinence Questionnaire Lower Urinary Tract Symptoms quality of life questionnaire (ICIQ‐LUTSqol); and
-
Visual Analogue Scale (VAS).
In all the trials there was significant improvement in sexual function from baseline scores during the follow‐up period that spanned six to 24 months. There were no significant differences between the two groups. At 24‐month follow‐up, rates of superficial and deep dyspareunia were low, with no difference between the groups.
1.8 Economic measures
Economic analysis from an RCT comparing TOR and RPR showed that over a 12‐month follow‐up period there was a cost saving with TOR of CAD (Canadian Dollars) 1135 per patient despite no difference in health outcome between the groups (Ross 2009). The average cost of TOR was 17% less than that of RPR. Despite no significant difference there was a probability greater than 80% of TOR being more cost effective than RPR (Lier 2011).
Comparison 2. Retropubic bottom‐to‐top approach versus retropubic top‐to‐bottom approach
Five small trials, with 636 women in total, addressed this comparison (Andonian 2005; Kim 2004; Lim 2005; Lord 2006; Tseng 2005).
2.1 Women's observations
Three trials (477 women) investigated subjective cure defined as self‐reported absence of urinary leakage on stress (Kim 2004; Lim 2005; Lord 2006). In the 12 months following surgery, women were significantly more often dry with the bottom‐to‐top approach (TVTTM) compared to the top‐to‐bottom approach (SPARCTM; 87.34% versus 79.58%; RR 1.10, 95% CI 1.01 to 1.19; Analysis 2.1).
2.2 Quantification of symptoms
No data were reported for this outcome.
2.3 Clinician's observation
Five trials assessed objective cure using a variety of measures (Andonian 2005; Kim 2004; Lim 2005; Lord 2006; Tseng 2005): one‐hour pad test of 2g or less, negative stress test on urodynamics (UDS), the observed absence of urinary leakage when the patient coughed while supine and with a comfortably full bladder, and one‐hour pad test of 1g or less, respectively. In a total of 622 participants, the objective cure rate was similar between the two groups (94.19% versus 89.10%; RR 1.06, 95% CI 0.97 to 1.17; Analysis 2.2).
2.4 Surgical outcome measures
Two small trials, Kim 2004 and Tseng 2005, reported that there were no statistically significant differences in duration of operation (Analysis 2.3) or length of hospital stay (Analysis 2.4).
2.5 Adverse events
No statistically significant difference was seen in overall perioperative complications, but the confidence interval was wide (RR 0.98, 95% CI 0.53 to 1.84; Analysis 2.5).
Significantly fewer women experienced certain complications with the bottom‐to‐top approach (TVTTM), which included:
-
bladder perforation (RR 0.55, 95% CI 0.31 to 0.98; 5 trials; Analysis 2.6);
-
voiding dysfunction after the bottom‐to‐top approach (TVTTM; RR 0.40, 95% CI 0.18 to 0.90; 5 trials; Analysis 2.7);
-
vaginal tape erosions (RR 0.27, 95% CI 0.08 to 0.95; 4 trials; Analysis 2.10).
There were no statistically significant differences between the two groups with respect to:
-
postoperative de novo urgency symptoms and UUI (RR 0.84, 95% CI 0.52 to 1.34; 4 trials; Analysis 2.8); or
-
DO (1 trial; Analysis 2.9).
However, the confidence intervals were wide for each of these five outcomes, which reflects the small number of trials.
2.6 Need for further treatment
No data were reported on the need for further treatment.
2.7 Quality of life
Only one of the five trials, Andonian 2005, assessed the QoL of women using the Incontinence Impact Questionnaire (IIQ; Shumaker 1994), where a score of less than 50 represents a good QoL, 50 to 70 represents moderate QoL, and over 70 indicates a poor QoL. In this study the mean IIQ scores were similar in the groups preoperatively and improved postoperatively, but there was no significant difference between the groups after operation. At one year follow‐up, there was no statistically significant difference in the mean IIQ scores (mean difference of ‐4.6; 95% CI: ‐7.5 to 16.7).
2.8 Economic measures
No economic data were reported for this comparison.
Comparison 3. Obturator medial‐to‐lateral approach versus obturator lateral‐to‐medial approach
Ten trials reported this comparison (Abdel‐Fattah 2010; But 2008; Chen 2010; Hassan 2013; Houwert 2009; Lee 2008; Liapis 2008; Park 2012; Peattie 2006; Scheiner 2012).
3.1 Women's observations
Six trials investigated short‐term subjective cure rate and five of these assessed subjective cure and improvement in the short term (within 12 months of surgery). There were no statistically significant differences in either subjective cure rates (RR 1.0, 95% CI 0.96 to 1.06; Analysis 3.1) or subjective cure and improvement rates (RR 1.02, 95% CI 0.97 to 1.08 Analysis 3.2), and the confidence intervals for each were quite narrow. Two trials reported no statistically significant difference in subjective cure in the medium term (RR 1.06, 95% CI 0.91 to 1.23; Analysis 3.3) and a further two trials reported no significant difference in subjective cure and improvement in the medium term (RR 1.00, 95% CI 0.90 to 1.11; Analysis 3.4). There are no published trials with long‐term data.
3.2 Quantification of symptoms
No data were reported for this comparison.
3.3 Clinician's observation
Six trials assessed objective cure (short term, ≤ 1 year); there was no statistically significant difference between the two groups (RR 0.99, 95% CI 0.95 to 1.04; Analysis 3.5), and the confidence interval was narrow. There was also no statistically significant difference in the objective cure or improvement rate between the two groups (RR 1.00, 95% CI 0.95 to 1.07; Analysis 3.6).
3.4 Surgical outcome measures
There were no statistically significant differences between the two groups in terms of:
-
duration of operation, (in minutes, MD 0.52, 95% CI ‐1.09 to 2.13; 4 studies, 481 women; Analysis 3.7);
-
operative blood loss (in ml, MD 1.11, 95% CI ‐6.01 to 8.22; 3 studies, 255 women; Analysis 3.8);
-
length of hospital stay (in days, MD ‐0.77, 95% CI ‐2.54 to 0.99; 2 studies, 190 women; Analysis 3.9);
-
time to return to normal activity (in weeks, MD ‐0.60, 95% CI ‐1.80 to 0.60; 1 study, 100 women; Analysis 3.10).
3.5 Adverse events
Vaginal perforation was significantly less likely to occur with the medial‐to‐lateral approach (RR 0.25, 95% CI 0.12 to 0.53; I² of 43%; Analysis 3.13). The average rate of vaginal wall perforation across both groups was 7.39% and, using this as the assumed control rate in the lateral‐to‐medial group, there were 55 fewer cases per 1000 in the medial‐to‐lateral group (95% CI from 35 per 1000 fewer to 65 per 1000 more).
Voiding dysfunction occurred significantly more in the medial‐to‐lateral compared to the lateral‐to‐medial group (RR 1.74, 95% CI 1.06 to 2.88; I² of 0%; 8 studies, 1121 women; Analysis 3.15). The average rate of POVD across both groups was 5.53% and, using this as the assumed control rate in the lateral‐to‐medial group, there were 41 more cases per 1000 in the medial‐to‐lateral group (95% CI from 3 to 104 per 1000 more).
There were no statistically significant differences between the two groups in terms of:
-
overall perioperative complication rate (RR 1.30, 95% CI 0.23 to 7.51; 2 studies, 214 women; Analysis 3.11);
-
major vascular/visceral injury (RR 0.71, 95% CI 0.23 to 2.19; 4 studies, 622 women; Analysis 3.12);
-
bladder perforation (RR 0.38, 95% CI 0.07 to 1.92; 6 studies, 794 women; Analysis 3.14);
-
de novo urgency symptoms and UUI rates (RR 1.01, 95% CI 0.46 to 2.20; 3 studies, 357 women; Analysis 3.16);
-
detrusor overactivity (RR 0.87, 95% CI 0.27 to 2.84; 1 study, 114 women; Analysis 3.17);
-
vaginal tape erosions (RR 0.42, 95% CI 0.16 to 1.09; 7 studies, 1087 women; Analysis 3.18);
-
groin/thigh pain (9.2% versus 8%; RR 1.15, 95% CI 0.75 to 1.76; 6 studies, 837 women; Analysis 3.19).
3.6 Need for further treatment
Two large trials showed no significant difference in the rates of repeat incontinence surgery in the medium term (4.6% versus 7.1%; RR 0.64, 95% CI 0.32 to 1.30; Analysis 3.20).
3.7 Quality of life
Quality of life was assessed in five of the ten trials using validated QoL questionnaires. All of these trials reported QoL scores.
Condition‐specific QoL scores
-
Houwert 2009 used the short forms of the IIQ‐7 and UDI‐6. Within each group there was significant improvement postoperatively compared to scores obtained preoperatively, but no significant postoperative differences between the two groups (MD 16.54, 95% CI 4.84 to 28.24; 1 study, 42 women).
-
But 2008 assessed QoL with IIQ and UDI questionnaires and VAS scores, but reported no results.
-
Lee 2008 used a validated Korean version of the Incontinence QoL questionnaire (I‐QoL) and showed improvements within the groups, but with no significant differences between the groups after surgery.
-
Scheiner 2012 used the KHQ and found no significantly difference between the groups at baseline and postoperatively, but with improvement following surgery compared to baseline scores in all domains.
-
Abdel‐Fattah 2010 used the KHQ, Birmingham Bowel and Urinary Symptoms Questionnaire (BBUSQ‐22), PISQ‐12, PGI‐I and the short form of the ICIQ (ICIQ‐SF) to assess QoL. Overall there was statistically significant improvement in total scores, as well as in each of the nine domains of the KHQ. This remained the case when comparing baseline score in each group postoperatively; there was no significant difference in the QoL scores between the two routes.
Sexual function
Sexual function was addressed in three trials that used a variety of measures including validated questionnaires and direct questioning (Abdel‐Fattah 2010; Houwert 2009; Park 2012). Questionnaires included: the PISQ‐12, and BFLUTS (Abdel‐Fattah 2010). There was significant improvement in PISQ‐12 scores following surgery (improved sexual function compared to baseline), but no significant difference between the two groups at follow‐up. Rates of dyspareunia following surgery were extremely low, with evidence of resolution by 24 months.
3.8 Economic measures
No economic data were reported for this comparison.
Comparison 4. One method of mid‐urethral tape insertion versus another method, same route
Ten trials compared different methods of carrying out TOR and RPR operations using the same route (Cho 2010; de Leval 2011; Elbadry 2014; Juang 2007; Naumann 2006; Paparella 2010; Rechberger 2011; Tommaselli 2012; Ugurlucan 2013; Zhang 2011). The following operations were compared.
Transobturator lateral‐to‐medial
-
Monarc® TOT versus TOT® (Cho 2010).
-
TOT versus adjustable TOT (Elbadry 2014).
-
TOT versus TOT with two‐point fixation sutures (Rechberger 2011).
-
Synthetic TOT versus biological TOT (Paparella 2010; Ugurlucan 2013).
Transobturator medial‐to‐lateral
-
TVT‐O versus modified TVT‐O (shorter tape and less lateral dissection; de Leval 2011).
-
TVT‐O versus TVT‐O plus Ingleman‐Sundberg bladder denervation procedure (Juang 2007).
-
TVT‐O versus modified TVT‐O (reduced dissection; Tommaselli 2012).
-
TVT‐O versus modified TVT‐O (self‐tailored mesh; Zhang 2011).
Retropubic
-
TVT versus modified TVT, bottom‐to‐top (suburethral pad; Naumann 2006).
Each comparison group included only a small single trial, which precluded any meaningful statistical analysis of the outcomes measured, except for the synthetic versus biological TOT comparison, for which there were two small trials (Analysis 4.1; Analysis 4.2; Analysis 4.3; Analysis 4.5; Analysis 4.4; Analysis 4.6; Analysis 4.7; Analysis 4.8; Analysis 4.10; Analysis 4.11; Analysis 4.12; Analysis 4.13; Analysis 4.14; Analysis 4.15; Analysis 4.16). Naumann 2006 reported no usable data.
For all outcomes measured in each trial, there were no statistically significant differences reported, with the exception of Juang 2007, where significant differences were found in favour of TVT‐O plus Ingleman‐Sundberg bladder denervation procedure for objective cure, operative time and intraoperative blood loss. Objecture cure in the short term for synthetic versus biological TOT showed no significant difference (RR 1.03, 95% CI 0.94 to 1.14; 2 trials; Analysis 4.5.2)
Sexual function was assessed by Paparella 2010 and Tommaselli 2012 using the PISQ‐12. The PISQ‐12 scores decreased after the procedure in both groups, indicating improved sexual function after surgery. No significant differences were observed between groups after the procedures.
Comparison 5. One type of tape material versus another
Four trials compared different mid‐urethral sling operations based on their tape properties, e.g. monofilament tapes versus multifilament tapes (Lim 2005; Meschia 2006; Okulu 2013; Rechberger 2003). The interventions compared were:
-
monofilament (TVT SPARC) verus multifilament (IVS; Lim 2005);
-
monofilament (TVT) versus multifilament (IVS; Meschia 2006);
-
synthetic monofilament (prolene light mesh) versus combined synthetic and biological (Ultrapro mesh) versus multifilament mesh (Vypro; Okulu 2013);
-
monofilament (TVT) versus multifilament (IVS; Rechberger 2003).
5.1 Women's observations
In the short and medium term there was no statistically significant difference between monofilament and multifilament tapes in terms of their subjective cure rates; neither was there a significant difference found where the combined synthetic and biological tapes were compared to monofilament tapes (RR 1.03, 95% CI 0.95 to 1.10; RR 0.91, 95% CI 0.79 to 1.05; RR 1.10, 95% CI 0.96 to 1.26; Analysis 5.1: RR 1.03, 95% CI 0.85 to 1.23; RR 0.91, 95% CI 0.78 to 1.06; RR 1.13, 95% CI 0.96 to 1.32; Analysis 5.2).
5.2 Quantification of symptoms
No data were reported for this comparison.
5.3 Clinician's observation
The objective cure rate for monofilament tape and multifilament tapes show no significant difference between the groups (RR 1.07, 95% CI 0.96 to 1.19; Analysis 5.3).
5.4 Surgical outcome measures
There were no statistically significant differences in the duration of operation or length of hospital stay reported (RR 0.00, 95% CI ‐1.49 to 1.49; Analysis 5.4: RR 0.20, 95% CI ‐0.09 to 0.49; Analysis 5.5).
5.5 Adverse events
There were few perioperative complications with no statistically significant difference between the groups (RR 1.16, 95% CI 0.36 to 3.69; Analysis 5.6). No major vascular/visceral injury was reported in any of the trials (Analysis 5.7). Bladder perforation occurred in 4.49% of monofilament and 3.67% of multifilament tape procedures (RR 1.15, 95% CI 0.49 to 2.70; Analysis 5.8).
There were no statistically significant differences between the groups for:
-
POVD (RR 2.10, 95% CI 0.96 to 4.59; Analysis 5.9);
-
de novo urgency symptoms and UUI (RR 1.11, 95% CI 0.68 to 1.82; Analysis 5.10);
-
DO (RR 0.70, 95% CI 0.12 to 4.06; Analysis 5.11).
In three trials, vaginal tape erosions were more common in the multifilament group, but this did not reach statistical significance (RR 0.79, 95% CI 0.09 to 6.84; Analysis 5.12).
5.6 Need for further treatment
No data were reported regarding the need for further treatment in this comparison.
5.7 Quality of life
Only the Okulu 2013 study assessed QoL and showed improvement from baseline scores, with no significant difference between the comparison groups. At 48 months mean postoperative ICI‐Q QoL scores were significantly better in the monofilament group than in the multifilament group (MD ‐0.06, 95% CI ‐0.76 to ‐0.44; 1 study, 96 women; Analysis 5.13).
5.8 Economic measures
No economic data were reported for this comparison.
We have included extracted data of all the included studies in Table 1
| Study | Outcome data |
| Abdel‐Fattah 2010 | Group A: TVT‐O (n = 170) Group B: TOT (n = 171) Loss to follow up at 1yr: A: 18/170, B: 24/171 Loss to follow up at 3yrs: A: 44/170, B: 59/171 Objective cure: A: 114/121, B: 96/109 Subjective success: A: 121/149, B: 111/143 Bladder/urethral perforation: A: 1/170, B: 2/171 Voiding dysfunction: A: 12/170, B: 9/171 Tape erosion: A: 3/153, B: 5/149 Groin pain: A: 27/150, B: 19/147 Repeat continence surgery: A: 7/170, B: 15/171 QoL assessed via: King’s Health Questionnaire (KHQ) [10], Birmingham Bowel Urinary Symptom (BBUSQ‐22) [11] and Pelvic Organ Prolapse/Incontinence Sexual Function Questionnaire (PISQ‐12). In addition Patient Global Impression of Improvement (PGI‐I) [13] and International Consultation on Incontinence Questionnaire‐ Short form (ICIQ‐SF) [14] questionnaires. QOL scores were much improve following surgery with no significant inter group (A vs B) differences. Sexual dysfunction: PISQ‐12 employed. 199 patients completed this assessment and in most domains a significant improvement in postoperative PISQ‐12 scores was found with no significant difference demonstrated between the two groups. Intermediate (3 yr) Subjective success (very much & much improved) on PGI‐I: A: 93/126, B: 81/112 |
| Aigmuller 2014 | Group A: TVT: (n = 285; 38 of whom were lost to follow‐up) Group B: TVT‐O: (n = 269; 36 of whom were lost to follow‐up) Participants were evaluated at 3 months, with a further evaluation scheduled at 5 years
At 5‐year review:
|
| Alkady 2009 | Group A: TVT (n = 15) Group B: TVT‐O (n = 15)
|
| Andonian 2005 | Group A: SPARC Group B: TVT
|
| Andonian 2007 | Group A: Obtape (n = 78) Group B: DUPS (n = 32) ‐ suspended Group C: TVT (n = 80)
|
| Aniuliene 2009 | Group A: TVT‐O (n = 150) Group B: TVT (n = 114)
|
| Araco 2008 | Group A: TVT‐O (n = 120)
|
| Barber 2008 | Group A: TVT (n = 88) Group B: TOT (n = 82)
|
| Barry 2008 | Group A: TOT (n = 58)
|
| But 2008 | Group A: TVT‐O (n = 60) Group B: TOT (n = 60)
|
| Cervigni 2006 | Numbers in each group unreported. It was, thus, impossible to abstract results |
| Chen 2010 | Group A: TVT (n = 77) Group B: TOT (n = 45) Group C: TVT‐O (n = 65)
|
| Chen 2012 | A: TVT (n = 102) B: TVT‐O (n = 103)
|
| Cho 2010 | Group A: Monarc TOT (n = 48) Group B: TOT (n = 45)
|
| Choe 2013 | We were not able to use the data provided, as the number in each group was not specified |
| Darabi Mahboub 2012 | Group A: TOT (n = 40) Group B: TVT (n = 40) Operative time (minutes (SD): A: 64.50 (9.04), B: 64.00 (9.48) Mean hospital stay (days): A: 2.56 (0.51), B: 2.52 (0.47) |
| David‐Montefiore 2006 | Group A: RPR (n = 42) Group B: TOR (n = 46)
|
| de Leval 2011 | Group A: TVT‐O (n = 87) Group B: modified TVT‐O (n = 88)
At 3‐year follow‐up:
|
| de Tayrac 2004 | Group: A: TOT (n = 30) Group: B: TVT (n = 31)
|
| Deffieux 2010 | Group A: TVT (n = 75) Group B: TVT‐O (n = 74)
|
| Diab 2012 | Group A: TOT (n = 31) Group B: TVT (n = 32)
All the preoperative parameters were comparable in both groups. The mean operative time was significantly longer and bladder injury was significantly higher in the TVT group. There were no significant difference in cure rates, voiding dysfunction, de novo urgency and reoperation rate. The postoperative groin/thigh pain was higher in the TOT group. |
| El‐Hefnway 2010 | Preliminary results: Group A: TVT: (n = 19) Group B: TOT: (n = 21) At 24 months: Group A: TVT: (n = 45) Group B: TOT: (n = 42)
|
| Elbadry 2014 | Group A: adjustable TOT (n = 48) Group B: TOT: (n = 48)
|
| Enzelsberger 2005 | Group A: TOT (n = 56) Group B: TVT (n = 54)
|
| Freeman 2011 | Group A: Monarc TOT (n = 100) Group B: Gynaecare TVT (n = 92)
|
| Hammoud 2011 | Group A: TVT (n = 60) Group B: TVT‐O (n = 50) Subjective cure: A: 56/60, B: 48/50 |
| Hassan 2013 | Group A: inside‐out TOT (n = 125) Group B: outside‐in TOT (n = 125)
|
| Houwert 2009 | Group A: TVT‐O (n = 93) Group B: Monarc TOT (n = 98)
|
| Jakimiuk 2012 | Group A: TVT (n = 19) Group B: TVT‐O (n = 16)
|
| Juang 2007 | Group A: TVT‐O (n = 47) Group B: TVT‐O plus IS: (n = 49)
|
| Kamel 2009 | A: TVT (n = 60) B: TVT‐O (n = 60)
|
| Karateke 2009 | Group A: TVT (n = 83) Group B: TVT‐O (n = 84)
|
| Kilic 2007 | Group A: TVT (n = 10) Group B: TOT (n = 10)
|
| Kim 2004 | Group A: TVT (n = 32) Group B: SPARC (n = 30)
|
| Kim 2005 | Group A: Monarc (n = 65) Group B: SPARC (n = 65)
|
| Krofta 2010 | Group A: TVTTM (n = 149) Group B: TVT –OTM (n = 151)
|
| Laurikainen 2007 | Group A: TVT‐O (n = 131)
QoL: The scores of the condition specific quality of life questionnaires were significantly lower at the 3 and 5 year follow up compared with pre‐operative scores. This improvements were statistically significant, but with no difference between the groups. 84% of women with pre‐operative moderate and severe frequency and urgency symptoms were cured of these symptoms at the 5 year follow up. |
| Leanza 2009 | Group A: r‐TICT (n = 229; retropubic) Group B: t‐TICT (n = 220; transobturator) Subjective cure: A: 190/215, B: 178/208 |
| Lee 2007 | Group A: TVT (n = 60) Group B: TVT‐O (n = 60)
|
| Lee 2008 | Group A: TVT‐O (n = 50) Group B: TOT (n = 50)
|
| Liapis 2006 | Group A: TVT (n = 46) Group B: TVT‐O (n = 43)
|
| Liapis 2008 | Group A: TVT‐O (n = 61) Group B: Monarc TOT (n = 53)
|
| Lim 2005 | Group A: TVT (n = 61) Group B: IVS (n = 60) Group C: SPARC (n = 61)
|
| Lord 2006 | Group A: TVT (n = 147)
|
| Mansoor 2003 | Group A: TVT‐O (n = 48)
|
| Mehdiyev 2010 | A: TOT (n = 17) B: TVT (n = 15)
|
| Meschia 2006 | Group A: TVT (n = 92)
|
| Meschia 2007 | Group A: TVT‐O (n = 117) Group B: TVT (n = 114)
|
| Naumann 2006 | Group A: TVT (n = 123) Group B: LIFT (n = 125)
|
| Nerli 2009 | Group A: TVT (n = 18) Group B: TOT (n = 18)
|
| Nyyssonen 2014 | Group A: TOT (n = 50) Group B: TVT (n = 50)
|
| Okulu 2013 | Group A: Vypro mesh: (n = 48; multifilament) Group B: Ultrapro mesh: (n = 48; monofilament + biological combined mesh) Group C: Prolene light mesh: (n = 48; monofilament)
|
| Oliveira 2006 | Group A: TVT (n = 17)
|
| Palomba 2008 | Trial terminated. |
| Paparella 2010 | Group A: synthetic UretexTO® (n = 34) Group B: biological PelviLaceTO® (n‐36)
|
| Park 2012 | Group A: TVT‐O (n = 39) Group B: TOT Monarc (n = 35)
|
| Peattie 2006 | No published data. |
| Porena 2007 | Group A: TVT (n = 70) Group B: TOT (n = 75)
|
| Rechberger 2003 | Group A: TVT (n = 50) Group B: IVS (n = 50)
|
| Rechberger 2009 | Group A: retropubic (IVS‐02; n = 269) Group B: transobturator (IVS‐04; n = 268)
|
| Rechberger 2011 | Group A: TOT (n = 232) Group B: TOT with fixation (n = 231)
|
| Richter 2010 | Group A: retropubic sling (TVT; n = 298) Group B: transobturator tapes (TVT‐O, and TOT Monarc; n = 299) (Group C (?): TVT‐O (inside‐out) ‐ separate data not provided) (Group D (?): TOT (Monarch, outside‐in) ‐ separate data not provided) Objective cure at 1 year: A: 232/280 (80.8%), B: 233/285 (77.7%) Subjective cure at 1 year: A: 181/280 (62.2%), B: 163/285 (55.8%) Secondary outcomes:
PISQ‐12 (Prolapse / urinary incontinence sexual questionnaire): Analysis of results for group A and group B combined showed significant improvement in sexual function in both groups with a mean PISQ‐12 score increase from 32.8+/‐7.1 at baseline to 37.3+/‐ 6 at 24 months. These changes are >0.6 SD units, which reflects “medium” improvement in the PISQ‐12 score after surgery. Compared with women with successful surgery, women who experienced surgical failure, regardless of assigned type of surgery, reported worse adjusted sexual function scores at all postoperative time points. Improvement in PISQ‐12 scores was consistent with change in the 3 specific items from the sexual function measure of interest: (1) the experience of pain during sexual activity, (2) UI during sexual activity, and (3) fear of incontinence during sexual activities. Pain with intercourse was reported by 153 of 406 of sexually active women (38%) at baseline and decreased to 27% at 12 months after surgery (P.003). Self‐reported UI and the fear of incontinence occurring during sexual activity also significantly improved by 12 months after surgery, regardless of sling route. To specifically investigate the association of synthetic mesh slings on dyspareunia, we repeated the analysis on the 247 women who underwent MUS only (no concurrent procedures) and who completed baseline and 12‐month assessments. In this subset of women, dyspareunia decreased from 57% at baseline to 43% at 12 months after surgery (P .03). 5‐year data provided, but without numbers in each group, so could not be used for meta‐analysis |
| Riva 2006 | Group A: TOT (n = 65) Group B: TVT (n = 66) |
| Ross 2009 | Group A: TVT (n = 105) Group B: TOT (n = 94)
|
| Salem 2014 | Group A: TOT (n = 37) Group B: TVT (n = 39) No significant difference was noticed between the two groups as regard the mean operative time, perioperative complications, intraoperative blood loss, hospital stay, and time to return to normal activities. The mean of abdominal leak point pressure and urethral closure pressure showed marked and maintained improvement for 5 years later in group I whereas in group II, they showed marked and maintained improvement for only one year then shows significant decline in comparison with group I. As regard the mean of objective SEAPI score shows marked decrease (improvement) in both groups and this was maintained for the five years in group I but in group II, it increased after one year later. No usable data provided. |
| Scheiner 2012 | Group A: TVT (n = 80) Group B: TOT outside‐in approach (Monarc; n = 40) Group C: TVT‐O inside‐out approach (Gynecare; n = 40)
|
| Schierlitz 2008 | Group A: TVT (n = 81) Group B: Monarc sling (n = 82)
|
| Tanuri 2010 | Group A: Safyre VS retropubic tape (n = 10) Group B: Safyre T transobturator tape (n = 20)
|
| Tarcan 2011 | Group A: TVT (n = 27) Group B: TOT (n = 27) 12‐month follow‐up assessed:
2 year follow‐up assessed:
|
| Teo 2011 | Group A: TVT (n = 66) Group B: TVT‐O (n = 61)
|
| Tommaselli 2012 | Group A: TVT‐O (n = 48) Group B: modified TVT‐O (n = 24)
|
| Tseng 2005 | Group A: SPARC (n = 31)
|
| Ugurlucan 2013 | Group A: biological PELVILACE TO (n = 50) Group B: synthetic TOT ALIGN ®TO (n = 50)
|
| van Leijsen 2013 | Group A: RPR (n = 33) Group B: TOT (n = 90)
|
| Wang 2006 | Group A: Monarc (n = 31) Group B: SPARC (n = 29)
|
| Wang 2008 | Group A: TVT (n = 35) Group B: TVT‐O (n = 34)
|
| Wang 2009 | Group A: TVT (n = 154) Group B: TVT‐O (n = 146)
|
| Wang 2010 | Group A: TVT (n = 70) Group B: TOT (n = 70)
|
| Wang 2011 | Group A: TVT (n = 32) Group B: TVT‐O (n = 36)
|
| Zhang 2011 | Group A: TVT‐O (n = 76) Group B: modified TVT‐O (n = 80)
|
| Zullo 2007 | Group A: TVT (n = 35) Group B: TVT‐O (n = 37)
|
Abbreviations
BFLUTS: Bristol lower urinary tract symptoms questionnaires
BMI: body‐mass index
DO: detrusor overactivity
DUP: distal urethral polypropylene sling
EQOL‐5D: Euro Quality of life ‐5 Dimension
hr: hour/s
HRT: hormone replacement therapy
ICIQ: International Consultation on Incontinence questionnaire
ICIQ‐FLUTS: International Consultation on Incontinence questionnaire ‐ female lower urinary tract symptoms
ICIQ‐ LUTSquol: International Consultation on Incontinence questionnaire ‐ lower urinary tract quality of life questionnaire
ICIQ‐SF: International Consultation on Incontinence questionnaire short form
ICIQ‐SF15: International Consultation on Incontinence questionnaire short form 15
IIQ: Incontinence Impact questionnaire
ICS: International Continence Society
I‐QoL: Incontinence Quality of Life questionnaire
ISD: intrinsic sphincter deficiency
IVS: intravaginal slingoplasty
KHQ: King's Health questionnaireMUI: mixed urinary incontinence
MUCP: Maximum urethral closure pressure
MUI: mixed urinary incontinence
OAB: overactive bladder
PGI‐I: Patient Global Impression of Improvment
PGI‐S: Patient Global Impression of Severity
PISQ‐12: pelvic organ prolapse/urinary incontinence sexual questionnaire
POP: pelvic organ prolapse
POP‐Q: pelvic organ prolapse quantification
POP‐Q ICS: pelvic organ prolapse quantification International Continence Society
PVR: post void residual
RCT: randomized controlled trial
RPR: retropubic route
QoL: quality of life
QRCT: quasi‐randomised trial
SEAPI‐QMM: Stress related leak, Empyting ability, Anatomy, Protection, Inhibition‐Quality of life, Mobility and Mental status incontinence classification system
SD: standard deviation
SIS: Single incision sling
SPARC: suprapubic arc (procedure)
SUI: stress urinary incontinence
TOR: transobturator
TOT: transobturator tape
TOT‐ARIS: transobturator tape‐ARIS
TVT: tension‐free vaginal tape
TVT‐O: transobturator tension‐free vaginal tape
UDI: Urinary Distress Impact questionnaire
UDI‐6: Urinary Distress Impact questionnaire short form
UDS: urodynamics study
UI: urinary incontinence
UISS: urinary incontinence severity score
USI: urodynamic stress incontinence
USS: ultrasound
UTI: urinary tract infection
UUI: urgency urinary incontinence
VAS: visual analogue scale
VLPP: Valsalval leak point pressure
Discusión
Resumen de los resultados principales
1. Vía transobturador (VTO) versus vía retropúbica (VRP)
La comparación de la vía transobturador (VTO) versus la vía retropúbica (VRP) se analizó en 55 ensayos que incluyeron 8652 pacientes. Treinta y seis de estos ensayos (5514 pacientes) contribuyeron con datos al resultado primario curación subjetiva, que mostró que a corto plazo no hubo diferencias entre la VTO y la VRP. Solamente seis de estos 53 ensayos informaron datos a medio o a largo plazo, nuevamente con números relativamente pequeños de pacientes que no mostraron una diferencia significativa en la curación sintomática. Estos números pequeños limitan las valoraciones que se pueden emitir acerca de las tasas de curación a más largo plazo para la eficacia de las cintas individuales o para la comparación de la vía de inserción de la cinta. Es posible que al menos 22 de estos ensayos hayan publicado resultados a medio o a más largo plazo, debido a sus fechas de publicación. De manera similar, las tasas de curación objetivas no mostraron diferencias significativas entre las dos vías.
Las pruebas de 40 ensayos (6372 pacientes) mostraron un aumento de 30 veces en el porcentaje de la tasa de perforación vesical con el enfoque VRP comparado con el enfoque VTO. Por este motivo, en la práctica algunos médicos están a favor de la VTO en las pacientes con mayor riesgo de perforación vesical / uretral, por ejemplo, las que se les ha realizado anteriormente cirugía pelviana o por incontinencia. De manera similar, 37 ensayos (6217 pacientes) que evaluaron la disfunción postoperatoria de la evacuación (DPOE) mostraron que este resultado adverso fue significativamente menos frecuente cuando se utilizó la VTO. Sin embargo, las secuelas informadas en ambos resultados son generalmente de corta duración.
Treinta y un ensayos (4743 pacientes) que evaluaron la erosión de la cinta en la vagina no mostraron diferencias significativas cuando se utilizó cualquiera de las vías. Más pacientes presentaron dolor inguinal en el grupo VTO que en el grupo VRP. Este dolor inguinal generalmente fue de corta duración y se resolvió en ocho semanas en la mayoría casos. La aparición de dolor suprapúbico después de un procedimiento por VRP se informó de manera deficiente. Fue más frecuente en el grupo VRP; sin embargo, cuando se proporcionaron los datos, solamente una minoría de las pacientes presentó este síntoma y durante un período corto.
En general, los cabestrillos mediouretrales son un tratamiento muy eficaz para la incontinencia urinaria de esfuerzo (IUE). A corto plazo existe equivalencia en la eficacia entre las dos vías, que persiste a medio y a más largo plazo, aunque los datos de este resultado están algo limitados por los números pequeños. Hay algunas pruebas que indican que las pacientes tienen mayores probabilidades de necesitar cirugía repetida por incontinencia a más largo plazo con la VTO, pero este hallazgo requiere una interpretación cautelosa, ya que los números son muy pequeños. La mejoría en la calidad de vida general fue igual en las pacientes de ambas vías. La función sexual mejoró en ambos grupos como resultado de la cirugía, más probablemente debido a la reducción de la incontinencia coital, sin diferencias significativas en la función sexual entre los dos grupos. El único análisis económico realizado en un ensayo favoreció la VTO.
2. Abordaje retropúbico inferior a superior versus abordaje retropúbico superior a inferior
Cinco ensayos con 636 pacientes compararon el enfoque retropúbico inferior a superior con el superior a inferior. Estos ensayos mostraron que el paso de la cinta por vía retropúbica en dirección inferior a superior (p.ej. TVTTM) fue más eficaz que el paso en dirección superior a inferior(p.ej. SPARCTM) y dio lugar a menos eventos adversos intra y postoperatorios.
3. Abordaje obturador medial a lateral versus abordaje obturador lateral a medial
Diez ensayos con 1199 pacientes compararon el enfoque obturador medial a lateral con el enfoque obturador lateral a medial. Las pruebas de los diez ensayos, dos de los cuales informaron datos a medio plazo, no mostraron diferencias entre los dos enfoques en cuanto a la mayoría de los resultados medidos. Las únicas excepciones fueron la disfunción de la evacuación, en la que se informaron tasas mayores en el grupo medial a lateral y la perforación vaginal, con tasas mayores en el grupo lateral a medial. A pesar de lo anterior, no se produjo un consiguiente aumento de la tasa de erosión de la cinta. Por lo tanto, es razonable que prevalezca la preferencia del que realiza el procedimiento cuando se decide cuál de estos dos enfoques adoptar. Cabe señalar que ambas vías mejoraron la calidad de vida y la función sexual postoperatoriamente.
4. Un método de inserción de cinta mediouretral versus otro método, la misma vía
Diez ensayos con 1569 pacientes compararon un método de inserción de la cinta mediouretral con otro mediante la misma vía. A pesar de los numerosos diseños o modificaciones en el procedimiento del paso de la cinta a través de la misma vía, no hubo diferencias en la eficacia, los resultados quirúrgicos o la aparición de eventos adversos.
5. Un tipo de material de cinta versus otro
Cuatro ensayos con 505 pacientes compararon cintas monofilamento con cintas multifilamento. No hubo diferencias estadísticas en las tasas de curación observadas por el médico ni en la curación informada por la paciente entre los grupos. No hubo diferencias significativas en la tasa de erosión de la cinta en la vagina.
Compleción y aplicabilidad general de las pruebas
Muchos de los ensayos que contribuyeron con esta revisión aportaron pruebas con respecto al resultado primario, que fue determinar la efectividad de las intervenciones con cabestrillos mediouretrales en el tratamiento de la incontinencia urinaria. Estos ensayos confirman que las intervenciones con cabestrillos mediouretrales para la IUE son un tratamiento quirúrgico efectivo disponible en la práctica actual. Una limitación importante fue la calidad variable de muchos ensayos.
No se intentó analizar los datos por subgrupos según las características clínicas de las pacientes como los síntomas de IUE, la incontinencia de esfuerzo urodinámica, el diagnóstico de hipermovilidad uretral o deficiencia intrínseca del esfínter uretral, la obesidad, la cirugía previa por incontinencia, la presencia o ausencia de prolapso, la anestesia utilizada o la experiencia del cirujano. En realidad la mayoría de los ensayos no describió estas características de las mujeres.
Las implicaciones económicas para las pacientes a nivel personal y el costo para los servicios de salud se investigaron de forma deficiente en muchos ensayos. De manera similar, la calidad de vida se informó de manera deficiente con el uso de varios instrumentos, lo que impidió realizar un metanálisis, aunque estos resultados son de importancia capital para las mujeres y los que toman decisiones.
Complicaciones
Las complicaciones graves como las lesiones nerviosas, intestinales o vasculares, el hematoma pelviano, la fascitis necrosante, el absceso isquiorrectal y la muerte son poco frecuentes y es poco probable que se registren en ensayos controlados aleatorios (ECA) pequeños. Existe la posibilidad de determinar una incidencia más exacta a partir de los registros nacionales grandes y los registros de informes de voluntarias o las bases de datos para el informe de las complicaciones, como la Manufacturer and User Facility Device Experience (MAUDE) de la Food and Drug Administration (FDA) de los EE.UU. Sin embargo, hay que tener presente las limitaciones de este método. Varios de estos registros han informado sus hallazgos (Collinet 2008; Dyrkorn 2010; Kuuva 2002; Koops 2005; Tamussino 2001; Tamussino 2007; Tincello 2011).
Cintas retropúbicas
De la lista anterior de registros, para la cinta vaginal sin tensión el número de procedimientos informados varió de 809 a 4281 y se encontraron tasas bajas de complicaciones graves.
-
La perforación vesical ocurrió en el 2,7% al 3,9% de los casos.
-
Las tasas de reintervención relacionadas con la inserción de la cinta o la disfunción postoperatoria de la evacuación (DPOE) variaron del 1,6% al 2,4%.
-
La tasa de retención urinaria fue del 1,6%.
-
El hematoma pelviano ocurrió en el 0,7% al 1,9% de las pacientes.
-
La tasa de infección fue del 0,7%.
-
La tasa de erosión / extrusión de la cinta en la vagina fue del 1,5%.
-
El dolor inguinal ocurrió en el 0,4% de las pacientes.
Estas tasas son en gran parte similares a las informadas en los ensayos incluidos en esta revisión. También hubo pocos casos de lesiones viscerales graves como las lesiones intestinales y uretrales.
Cintas transobturador
Los registros de las cintas transobturador informaron tasas mucho menores de complicaciones.
-
La perforación vesical ocurrió en el 0,4% de casos.
-
La tasa de reintervención relacionada con la inserción de la cinta varió del 0,8% al 2,2%.
-
La tasa de retención urinaria fue del 0,5%.
-
El hematoma pelviano ocurrió en el 0,5% de las pacientes.
-
La tasa de infección fue del 0,6%.
-
La tasa de erosión / extrusión de la cinta en la vagina fue del 0,4%.
-
El dolor inguinal ocurrió en el 1,6% de las pacientes.
La FDA recibió 1876 informes de complicaciones asociadas al uso de los cabestrillos para la IUE en el período entre el 1 de enero de 2008 y el 30 de setiembre de 2011. Las complicaciones más frecuentes informadas fueron dolor, erosión de la cinta en la vagina (exposición, extrusión o protrusión), infección, problemas urinarios, incontinencia recurrente, dolor durante el sexo (dispareunia), hemorragia, perforación de órganos, problemas neuromusculares y cicatrización vaginal. Muchas de estas complicaciones requirieron intervención médica adicional y en ocasiones requirieron tratamiento quirúrgico u hospitalización, o ambos. Con la excepción de la erosión de la cinta, también se encontró que las complicaciones anteriores ocurrieron después de las reparaciones quirúrgicas sin malla para la IUE. Se debe tener presente que este tipo de sistema de informe es un sistema de vigilancia pasivo limitado por la inclusión del posible envío de datos incompletos o inexactos, el subinforme de los eventos, la falta de datos del denominador (número de cintas) y la falta de un informe oportuno.
Es de señalar que el últimas comunicaciones escritas y de seguridad de la FDA sobre las mallas emitidas en 2011 ‐ a diferencia de la emisión anterior en 2008 (FDA 2008) ‐ se relacionan con inquietudes constantes por la malla utilizada para tratar el prolapso de órganos pélvicos (POP) y no con las bandas pequeñas de malla / cinta / cabestrillo utilizadas para tratar la IUE (FDA 2011a; FDA 2011b). En realidad la FDA señala que la seguridad y efectividad de los cabestrillos mediouretrales están bien establecidas en ensayos clínicos con seguimiento de un año (FDA 2013).
Igualmente, debido al número cada vez mayor de eventos adversos e inquietudes de las pacientes informados, en 2012 el Medicines and Healthcare Products and Regulatory Agency (MHRA) de Europa publicó un informe encargado sobre los eventos adversos informados con mayor frecuencia asociados con diferentes mallas / cintas / cabestrillos (MHRA 2012). El informe mostró que en el tratamiento de la IUE la tasa de erosión de la cinta en la vagina fue baja, entre el 1,1% y el 2,5%. Incluso en una cohorte seleccionada de pacientes que presentaban principalmente eventos adversos de la malla, fue menos probable que las que recibieron cabestrillo mediouretral presentaran erosiones de la malla que las que recibieron malla para la reparación del POP. La presentación de la erosión de la malla después del tratamiento para la IUE es menos grave y es menos probable que requiera tratamiento quirúrgico bajo anestesia general que la erosión después de la inserción de la malla para la reparación del POP. Lo anterior se relaciona con el grado 4 de la clasificación de la gravedad de las complicaciones (Abbott 2014; (Abbott 2014;
En su informe de 2014, el MHRA concluyó que de la revisión de la información disponible, pareció no haber pruebas de que los implantes de mallas vaginales para la IUE sean inseguros, ni hubo pruebas que justificaran que el MHRA tomara acciones para su retiro del mercado o eliminar su uso. El informe concluyó que el efecto beneficioso general sobrepasó la tasa relativamente baja de complicaciones (MHRA 2014).
Aunque el número de eventos adversos generalmente fue bajo y pocas veces fueron graves, se reconoce que el valor de los ECA para identificar los efectos adversos poco frecuentes es deficiente. Con el aumento de la popularidad de los procedimientos con CMU, la aparición de complicaciones a corto plazo está bien establecida, pero en general se tratan fácilmente o se resuelven espontáneamente. Sin embargo, debido a que pocos investigadores han realizado un seguimiento a largo plazo, hay información muy escasa acerca de si hay un grupo oculto de efectos adversos graves que se podrían contraponer a los efectos beneficiosos de curar la incontinencia.
Resultados a más largo plazo después del CMU
Estudios observacionales de los CMU muestran datos que confirman la efectividad a largo plazo con algunos datos que cubren de 15 a 17 años(Aigmueller 2011; Athanasiou 2014; Heinonen 2013; Nilsson 2013; Serati 2012; Serati 2013; Svenningsen 2013a; Svenningsen 2013b). Estos ensayos de CMU, como estudios observacionales similares para la colposuspensión abierta, muestran una disminución de la efectividad que depende del tiempo y también muestran tasas altas de síntomas de urgencia de novo (15%) y dificultades de la evacuación (23%). Es difícil dilucidar los motivos de estos síntomas a largo plazo, pero podrían estar relacionados con la edad, o deberse a nuevas patologías, o ser una consecuencia real de la cirugía. No obstante, recalcan la necesidad de datos a más largo plazo de ECA para ayudar a asesorar apropiadamente a las pacientes.
Con respecto a los datos a largo plazo de ECA, hay escasez de ensayos que informen resultados a más largo plazo y la mayoría de los datos a largo plazo informados para la colposuspensión abierta y los CMU son de cinco a seis años. Si las pruebas de ECA reflejan las de los estudios observacionales, no solamente se requerirá que muchos ECA que se han publicado sobre los CMU informen sus datos a más largo plazo, sino que de hecho necesitarán seguir a estas pacientes durante al menos entre 10 y 15 años. Lo anterior permitiría descubrir si hay una disminución en la efectividad que depende del tiempo y permitiría dilucidar el desarrollo a largo plazo de nuevos efectos adversos.
Comparaciones con otros métodos de cirugía para la continencia
Tratamiento quirúrgico de referencia (gold standard) para la incontinencia urinaria de estrés (IUE)
La colposuspensión retropúbica abdominal abierta se solía considerar el tratamiento de referencia para la IUE. Es de señalar que no hay ensayos controlados aleatorios de colposuspensión abierta versus ningún tratamiento. Dos ensayos pequeños que compararon colposuspensión abierta con tratamiento conservador fueron poco confiables debido a los números muy pequeños de participantes y al alto riesgo de sesgo (Lapitan 2012). De manera similar, las pruebas de los CMU versus ningún tratamiento o tratamiento conservador son limitadas y se analizarán en una revisión Cochrane futura.
La revisión inicial mostró la efectividad de los CMU a corto plazo y, como ha pasado el tiempo, se esperaba que con los informes de datos a largo plazo quedara claro si la eficacia a largo plazo de los CMU se podía comparar con la de la colposuspensión retropúbica abierta. Una revisión Cochrane de colposuspensión retropúbica abierta identificó 15 ECA que compararon intervenciones con cabestrillos mediouretrales (12 VRP y tres VTO) con colposuspensión (Lapitan 2012). Esta revisión concluyó que no hubo diferencias significativas en las tasas de incontinencia entre los dos procedimientos durante todos los períodos evaluados. Ambos procedimientos condujeron a una mejoría en la calidad de vida de las mujeres. Aunque algunas complicaciones como la perforación vesical se informaron más con los CMU, los números fueron pequeños. Otras complicaciones como la DPOE, que se informó fue mayor con los CMU, estuvo influenciada por un ensayo grande que no informó riesgo de dificultades de la evacuación después de la colposuspensión, pero datos consistentes de ensayos de TVT no mostraron diferencias significativas en el riesgo de disfunción de la evacuación entre los CMU y la colposuspensión. Los CMU tuvieron un tiempo quirúrgico, una duración de la estancia hospitalaria y costos menores. Solamente un ECA que comparó CMU con colposuspensión abierta presentó los resultados de un seguimiento de cinco años y no logró detectar diferencias significativas entre las tasas de éxito del CMU y la colposuspensión. También indicó que el efecto sobre la curación de la incontinencia y la mejoría en la calidad de vida se mantuvo en ambos procedimientos a los cinco años (Ward 2008).
Datos observacionales de la colposuspensión abierta con un seguimiento de diez a 20 años muestran tasas altas de efectividad a largo plazo (Alcalay 1995; Kjolhede 2005; Brubaker 2012). Esta curación a largo plazo muestra ser dependiente del tiempo, con tasas de curación máximas alrededor del 69% a los diez a 12 años. Además, algunos informes muestran tasas de continencia de solamente el 44% a los 14 años, con tasas altas de dificultades de la evacuación (del 36%) al seguimiento a los 14 años.
Intervenciones con cabestrillos mediouretrales versus cabestrillos tradicionales
Históricamente, las intervenciones con cabestrillos suburetrales tradicionales se utilizaban en mujeres que presentaban incontinencia de esfuerzo recurrente (después del fracaso de una intervención anterior para la continencia). Sin embargo, la revisión no presentó los resultados por separado para las pacientes con incontinencia nueva o recurrente (Rehman 2011). Estos procedimientos se diseñaron para restaurar el apoyo de la unión vesicouretral normal mediante la compresión mecánica o el plegamiento de la uretra proximal.
Los cabestrillos suburetrales sintéticos mínimamente invasivos parecieron ser tan efectivos como los cabestrillos suburetrales tradicionales en cuanto a las tasas de incontinencia a corto plazo (CR 0,97; IC del 95%: 0,78 a 1,20), aunque el intervalo de confianza es compatible con que los cabestrillos mínimamente invasivos fueron 20% mejores o 12% peores. El tiempo quirúrgico y la estancia hospitalaria también fueron significativamente más cortos con las intervenciones con cabestrillos suburetrales sintéticos mínimamente invasivos, y las pacientes tuvieron menos complicaciones perioperatorias y menos hiperactividad del detrusor.
Intervenciones con cabestrillos mediouretrales versus colposuspensión retropúbica abierta
Aunque se encontraron 14 ECA que compararon intervenciones con TVT con colposuspensión (Lapitan 2012), los datos de cinco de ellos no mostraron diferencias claras en las probabilidades de incontinencia a corto o medio plazo en comparación con la colposuspensión abierta. Aunque hubo más complicaciones después de las intervenciones con cabestrillos, los números fueron pequeños.
Intervenciones con cabestrillos mediouretrales versus colposuspensión laparoscópica
Otra revisión Cochrane identificó ocho ensayos que compararon las intervenciones con cabestrillos mediouretrales con la colposuspensión laparoscópica (Dean 2006). En general, la revisión indicó que las tasas de curación subjetivas fueron similares con ambas técnicas de mínimo acceso a corto plazo, mientras que los tiempos quirúrgicos fueron más cortos con los cabestrillos. Sin embargo, faltan datos a largo plazo.
Intervenciones con cabestrillos mediouretrales versus cabestrillos con incisión única
Cabestrillos con incisión única comparados con cabestrillos retropúbicos mediouretrales
Las pacientes tuvieron dos veces más probabilidades de presentar incontinencia después de un cabestrillo con incisión única que después de una TVT retropúbica (CR 2,08; IC del 95%: 1,04 a 4,14; Nambiar 2014), aunque tomó menos tiempo realizar la cirugía. Sin embargo, este resultado está principalmente relacionado con un tipo de cabestrillo con incisión única (TVT‐Secur), que en la actualidad se ha retirado del mercado debido a la falta de eficacia.
Cabestrillos con incisión única comparados con cabestrillos transobturador mediouretrales
Las pacientes tuvieron también dos veces más probabilidades de presentar incontinencia después de un procedimiento con cabestrillo con incisión única que después de un procedimiento con cabestrillo transobturador (CR 1,91; IC del 95%: 1,53 a 2,39; Nambiar 2014). Además, tuvieron mayores probabilidades de necesitar una intervención adicional por complicaciones o cirugía repetida por incontinencia. Sin embargo, los riesgos de dolor postoperatorio y dolor a largo plazo fueron ligeramente mayores con los cabestrillos transobturador.
Intervenciones con cabestrillos mediouretrales versus reparación anterior
Hasta la fecha no se han identificado ensayos que comparen la intervención original para la IUE, la reparación anterior (con suturas de refuerzo uretral, o suturas de Kelly) directamente con los cabestrillos mediouretrales (Glazener 2001). Sin embargo, debido a las preocupaciones actuales acerca de los efectos adversos del uso de los materiales sintéticos de malla o cinta, quizás sea el momento de reevaluar el valor de esta intervención, que no es menos importante debido a su función adicional en el tratamiento del prolapso.
Calidad de la evidencia
La calidad de las pruebas se valoró mediante la clasificación GRADE como moderada para la mayoría de los resultados. Las pruebas fueron de bajo nivel para los resultados restantes evaluados. El motivo principal de la disminución en la calidad de las pruebas de muchos resultados fue un alto riesgo de sesgo, debido a que la ocultación de la asignación o la generación de la secuencia aleatoria se consideraron inciertas. La falta de precisión de las estimaciones de los efectos también contribuyó a la calidad variable de las pruebas en algunos resultados.
En la comparación principal entre la VTO y la VRP la calidad de las pruebas de la mayoría de los resultados fue moderada. La disminución de alta calidad a moderada calidad de las pruebas se debió principalmente a que en una proporción pequeña de ensayos hubo un alto riesgo de sesgo en el diseño o en la implementación del estudio, que redujo por lo tanto la confianza en las estimaciones de los efectos.
Sesgos potenciales en el proceso de revisión
Se seleccionaron resultados específicos de GRADE en el momento de la revisión original. Estos resultados se han modificado para esta actualización. Es posible que se haya introducido sesgo, ya que idealmente estos resultados específicos de GRADE se deberían haber seleccionado en el momento del protocolo y habría existido consistencia entre los resultados seleccionados en la revisión original y en la actualización.
Risk of bias graph: review authors' judgments about each risk of bias item presented as percentages across all included studies.
Risk of bias summary: review authors' judgments about each risk of bias item for each included study.
Funnel plot of comparison: 1 Transobturator (TOR) versus retropubic (RPR) route, outcome: 1.1 Subjective cure (short term, ≤ 1 year)
Funnel plot of comparison: 1 Transobturator (TOR) versus retropubic (RPR) route, outcome: 1.16 Bladder or urethral perforation
Funnel plot of comparison: 1 Transobturator (TOR) versus retropubic (RPR) route, outcome: 1.17 Voiding dysfunction
Funnel plot of comparison: 1 Transobturator (TOR) versus retropubic (RPR) route, outcome: 1.22 Vaginal tape erosion
Funnel plot of comparison: 1 Transobturator (TOR) versus retropubic (RPR) route, outcome: 1.24 Groin pain

Comparison 1 Transobturator (TOR) versus retropubic route (RPR), Outcome 1 Subjective cure (short term, ≤ 1 year).
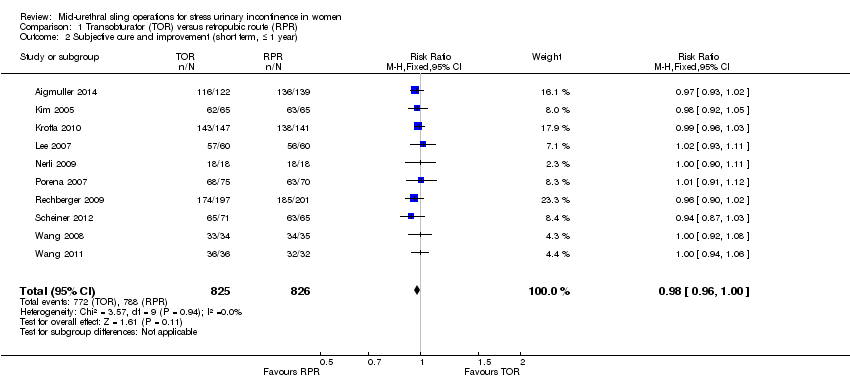
Comparison 1 Transobturator (TOR) versus retropubic route (RPR), Outcome 2 Subjective cure and improvement (short term, ≤ 1 year).

Comparison 1 Transobturator (TOR) versus retropubic route (RPR), Outcome 3 Subjective cure (medium term, 1 to 5 years).

Comparison 1 Transobturator (TOR) versus retropubic route (RPR), Outcome 4 Subjective cure (long term, > 5 years).

Comparison 1 Transobturator (TOR) versus retropubic route (RPR), Outcome 5 Subjective cure and improvement (long term, > 5 years).

Comparison 1 Transobturator (TOR) versus retropubic route (RPR), Outcome 6 Objective cure (short term, ≤ 1 year).

Comparison 1 Transobturator (TOR) versus retropubic route (RPR), Outcome 7 Objective cure and improvement (short term, ≤ 1 year).

Comparison 1 Transobturator (TOR) versus retropubic route (RPR), Outcome 8 Objective cure (medium term, 1 to 5 years).

Comparison 1 Transobturator (TOR) versus retropubic route (RPR), Outcome 9 Objective cure (long term, > 5 years).

Comparison 1 Transobturator (TOR) versus retropubic route (RPR), Outcome 10 Operative time (minutes).

Comparison 1 Transobturator (TOR) versus retropubic route (RPR), Outcome 11 Operative blood loss (ml).

Comparison 1 Transobturator (TOR) versus retropubic route (RPR), Outcome 12 Length of hospital stay (days).

Comparison 1 Transobturator (TOR) versus retropubic route (RPR), Outcome 13 Time to return to normal activity level (weeks).
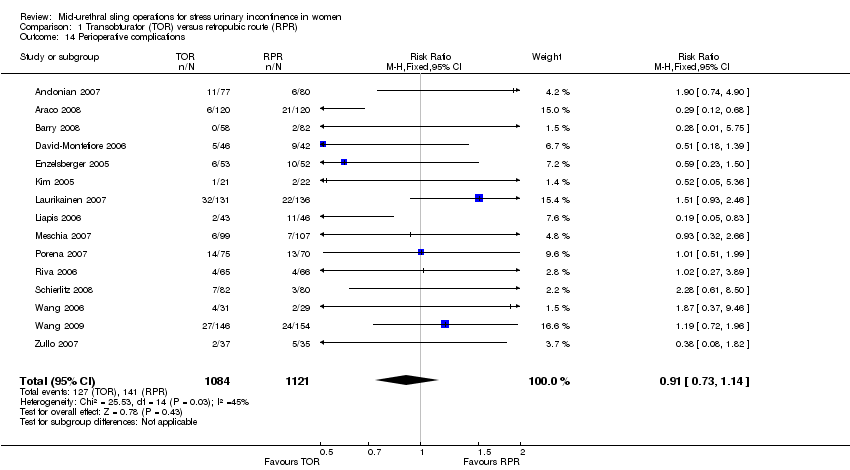
Comparison 1 Transobturator (TOR) versus retropubic route (RPR), Outcome 14 Perioperative complications.

Comparison 1 Transobturator (TOR) versus retropubic route (RPR), Outcome 15 Major vascular or visceral injury.

Comparison 1 Transobturator (TOR) versus retropubic route (RPR), Outcome 16 Bladder or urethral perforation.

Comparison 1 Transobturator (TOR) versus retropubic route (RPR), Outcome 17 Voiding dysfunction.

Comparison 1 Transobturator (TOR) versus retropubic route (RPR), Outcome 18 De novo urgency or urgency incontinence (short term, ≤ 1 year).

Comparison 1 Transobturator (TOR) versus retropubic route (RPR), Outcome 19 De novo urgency or urgency incontinence (medium term, 1 to 5 years).

Comparison 1 Transobturator (TOR) versus retropubic route (RPR), Outcome 20 De novo urgency or urgency incontinence (long term, > 5 years).
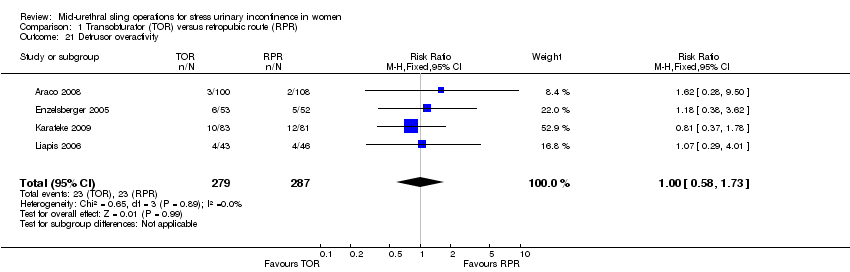
Comparison 1 Transobturator (TOR) versus retropubic route (RPR), Outcome 21 Detrusor overactivity.

Comparison 1 Transobturator (TOR) versus retropubic route (RPR), Outcome 22 Vaginal tape erosion.

Comparison 1 Transobturator (TOR) versus retropubic route (RPR), Outcome 23 Bladder/urethral erosion.

Comparison 1 Transobturator (TOR) versus retropubic route (RPR), Outcome 24 Groin pain.

Comparison 1 Transobturator (TOR) versus retropubic route (RPR), Outcome 25 Suprapubic pain.

Comparison 1 Transobturator (TOR) versus retropubic route (RPR), Outcome 26 Repeat incontinence surgery (short term, ≤ 1 year).

Comparison 1 Transobturator (TOR) versus retropubic route (RPR), Outcome 27 Repeat incontinence surgery (medium term , 1 to 5 years).

Comparison 1 Transobturator (TOR) versus retropubic route (RPR), Outcome 28 Repeat incontinence surgery (long term > 5 years).

Comparison 2 Retropubic bottom‐to‐top approach versus retropubic top‐to‐bottom approach, Outcome 1 Subjective cure (short term, ≤ 1 year).
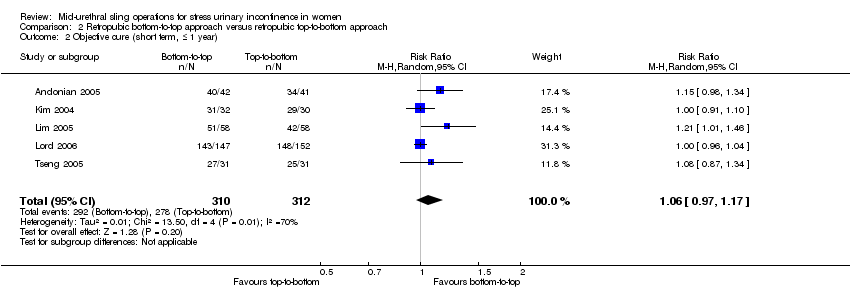
Comparison 2 Retropubic bottom‐to‐top approach versus retropubic top‐to‐bottom approach, Outcome 2 Objective cure (short term, ≤ 1 year).
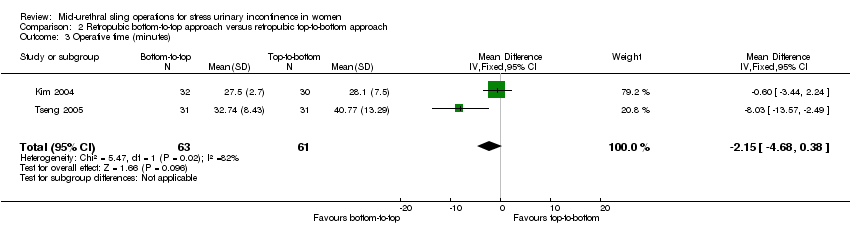
Comparison 2 Retropubic bottom‐to‐top approach versus retropubic top‐to‐bottom approach, Outcome 3 Operative time (minutes).

Comparison 2 Retropubic bottom‐to‐top approach versus retropubic top‐to‐bottom approach, Outcome 4 Length of hospital stay (days).

Comparison 2 Retropubic bottom‐to‐top approach versus retropubic top‐to‐bottom approach, Outcome 5 Perioperative complications.

Comparison 2 Retropubic bottom‐to‐top approach versus retropubic top‐to‐bottom approach, Outcome 6 Bladder or urethral perforation.

Comparison 2 Retropubic bottom‐to‐top approach versus retropubic top‐to‐bottom approach, Outcome 7 Voiding dysfunction.

Comparison 2 Retropubic bottom‐to‐top approach versus retropubic top‐to‐bottom approach, Outcome 8 De novo urgency or urgency incontinence.

Comparison 2 Retropubic bottom‐to‐top approach versus retropubic top‐to‐bottom approach, Outcome 9 Detrusor overactivity.

Comparison 2 Retropubic bottom‐to‐top approach versus retropubic top‐to‐bottom approach, Outcome 10 Vaginal tape erosion.

Comparison 2 Retropubic bottom‐to‐top approach versus retropubic top‐to‐bottom approach, Outcome 11 QoL specific.

Comparison 3 Obturator medial‐to‐lateral approach versus obturator lateral‐to‐medial approach, Outcome 1 Subjective cure (short term, ≤ 1 year).

Comparison 3 Obturator medial‐to‐lateral approach versus obturator lateral‐to‐medial approach, Outcome 2 Subjective cure and improvement (short term, ≤ 1 year).

Comparison 3 Obturator medial‐to‐lateral approach versus obturator lateral‐to‐medial approach, Outcome 3 Subjective cure (medium term, 1 to 5 years).

Comparison 3 Obturator medial‐to‐lateral approach versus obturator lateral‐to‐medial approach, Outcome 4 Subjective cure and improvement (medium term, 1 to 5 years).

Comparison 3 Obturator medial‐to‐lateral approach versus obturator lateral‐to‐medial approach, Outcome 5 Objective cure (short term, ≤ 1 year).

Comparison 3 Obturator medial‐to‐lateral approach versus obturator lateral‐to‐medial approach, Outcome 6 Objective cure and improvement (short term, ≤ 1 year).
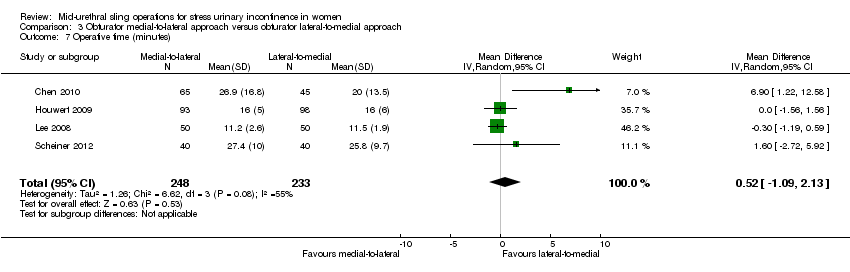
Comparison 3 Obturator medial‐to‐lateral approach versus obturator lateral‐to‐medial approach, Outcome 7 Operative time (minutes).

Comparison 3 Obturator medial‐to‐lateral approach versus obturator lateral‐to‐medial approach, Outcome 8 Operative blood loss (ml).

Comparison 3 Obturator medial‐to‐lateral approach versus obturator lateral‐to‐medial approach, Outcome 9 Length of hospital stay (days).

Comparison 3 Obturator medial‐to‐lateral approach versus obturator lateral‐to‐medial approach, Outcome 10 Time to return to normal activity level.
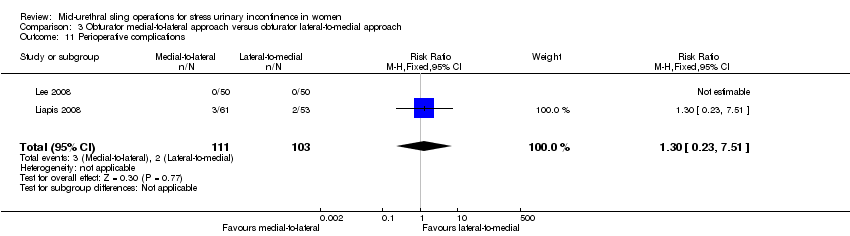
Comparison 3 Obturator medial‐to‐lateral approach versus obturator lateral‐to‐medial approach, Outcome 11 Perioperative complications.
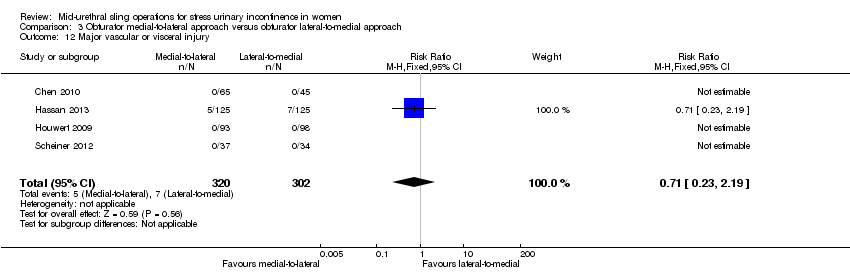
Comparison 3 Obturator medial‐to‐lateral approach versus obturator lateral‐to‐medial approach, Outcome 12 Major vascular or visceral injury.
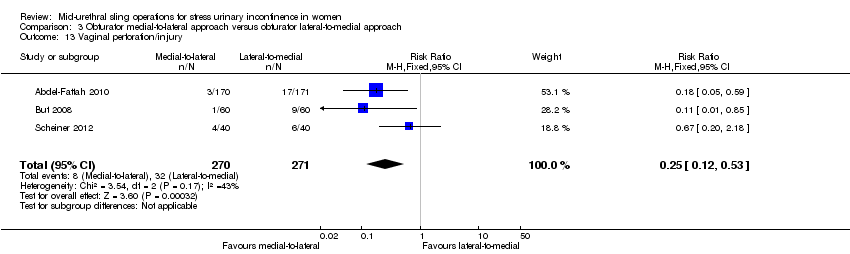
Comparison 3 Obturator medial‐to‐lateral approach versus obturator lateral‐to‐medial approach, Outcome 13 Vaginal perforation/injury.
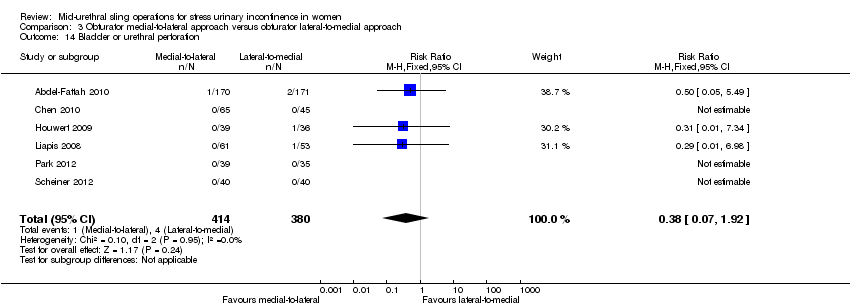
Comparison 3 Obturator medial‐to‐lateral approach versus obturator lateral‐to‐medial approach, Outcome 14 Bladder or urethral perforation.
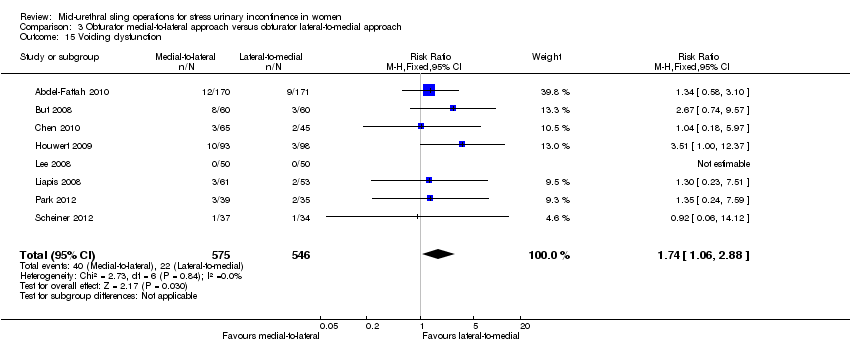
Comparison 3 Obturator medial‐to‐lateral approach versus obturator lateral‐to‐medial approach, Outcome 15 Voiding dysfunction.

Comparison 3 Obturator medial‐to‐lateral approach versus obturator lateral‐to‐medial approach, Outcome 16 De novo urgency or urgency incontinence.

Comparison 3 Obturator medial‐to‐lateral approach versus obturator lateral‐to‐medial approach, Outcome 17 Detrusor overactivity.

Comparison 3 Obturator medial‐to‐lateral approach versus obturator lateral‐to‐medial approach, Outcome 18 Vaginal tape erosion.

Comparison 3 Obturator medial‐to‐lateral approach versus obturator lateral‐to‐medial approach, Outcome 19 Groin/thigh pain.

Comparison 3 Obturator medial‐to‐lateral approach versus obturator lateral‐to‐medial approach, Outcome 20 Repeat incontinence surgery.

Comparison 3 Obturator medial‐to‐lateral approach versus obturator lateral‐to‐medial approach, Outcome 21 QoL specific.

Comparison 4 One method of mid‐urethral tape insertion versus another method, same route, Outcome 1 Subjective cure (short term, up to 1 year).

Comparison 4 One method of mid‐urethral tape insertion versus another method, same route, Outcome 2 Subjective cure and improvement (short term, up to 1 year).

Comparison 4 One method of mid‐urethral tape insertion versus another method, same route, Outcome 3 Subjective cure (medium term, 1 to 5 years).
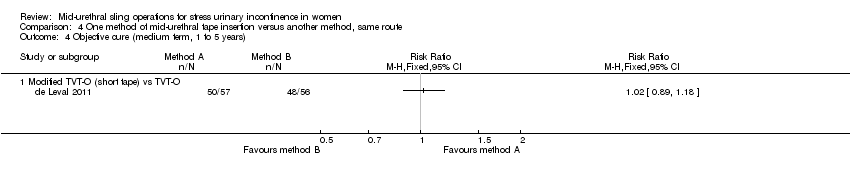
Comparison 4 One method of mid‐urethral tape insertion versus another method, same route, Outcome 4 Objective cure (medium term, 1 to 5 years).

Comparison 4 One method of mid‐urethral tape insertion versus another method, same route, Outcome 5 Objective cure (short term, ≤ 1 year).

Comparison 4 One method of mid‐urethral tape insertion versus another method, same route, Outcome 6 Operative time (minutes).
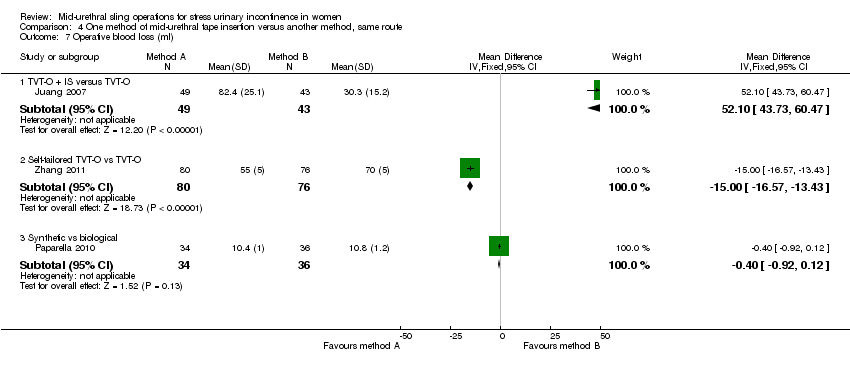
Comparison 4 One method of mid‐urethral tape insertion versus another method, same route, Outcome 7 Operative blood loss (ml).
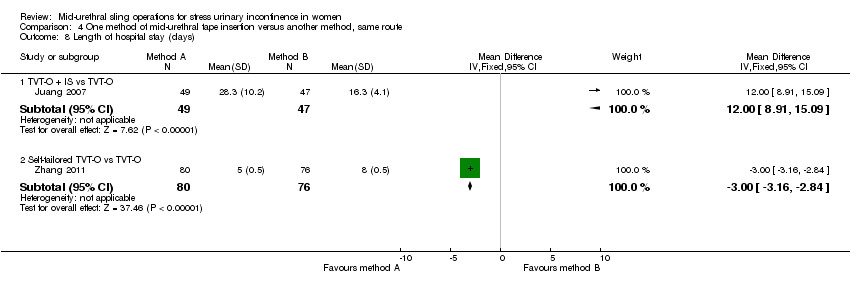
Comparison 4 One method of mid‐urethral tape insertion versus another method, same route, Outcome 8 Length of hospital stay (days).

Comparison 4 One method of mid‐urethral tape insertion versus another method, same route, Outcome 9 Perioperative complications.

Comparison 4 One method of mid‐urethral tape insertion versus another method, same route, Outcome 10 Major vascular or visceral injury.

Comparison 4 One method of mid‐urethral tape insertion versus another method, same route, Outcome 11 Bladder/urethral perforation.

Comparison 4 One method of mid‐urethral tape insertion versus another method, same route, Outcome 12 Voiding dysfunction.

Comparison 4 One method of mid‐urethral tape insertion versus another method, same route, Outcome 13 De novo urgency or urgency incontinence.

Comparison 4 One method of mid‐urethral tape insertion versus another method, same route, Outcome 14 Vaginal tape erosion.

Comparison 4 One method of mid‐urethral tape insertion versus another method, same route, Outcome 15 Bladder/urethral erosion.
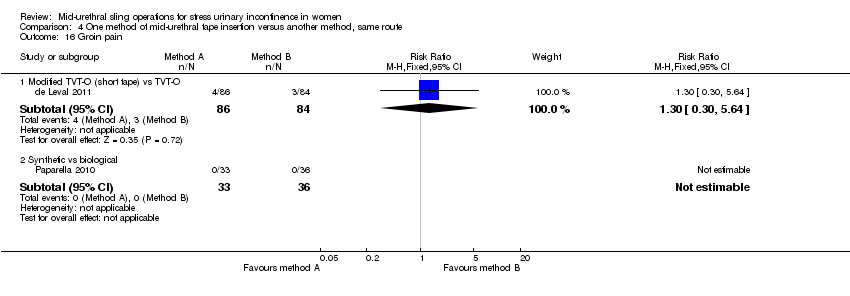
Comparison 4 One method of mid‐urethral tape insertion versus another method, same route, Outcome 16 Groin pain.
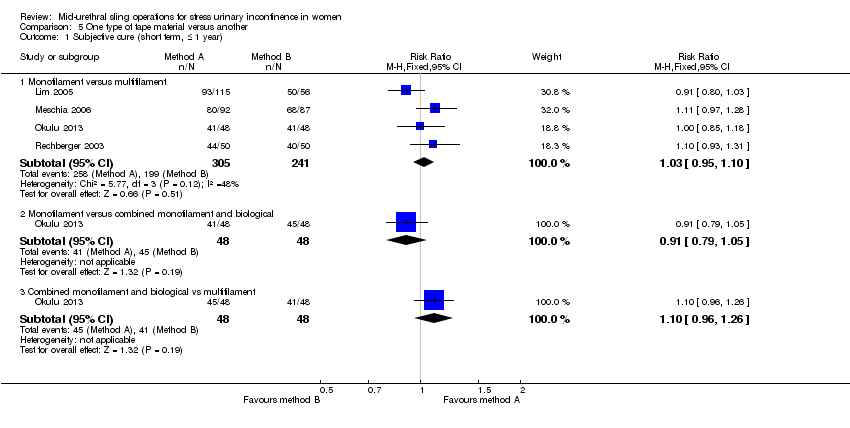
Comparison 5 One type of tape material versus another, Outcome 1 Subjective cure (short term, ≤ 1 year).

Comparison 5 One type of tape material versus another, Outcome 2 Subjective cure (medium term, 1 to 5 years).
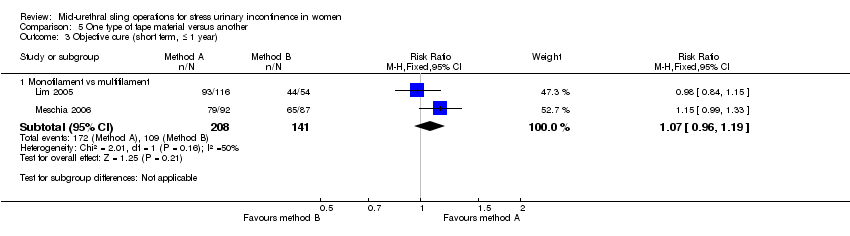
Comparison 5 One type of tape material versus another, Outcome 3 Objective cure (short term, ≤ 1 year).

Comparison 5 One type of tape material versus another, Outcome 4 Operative time (minutes).
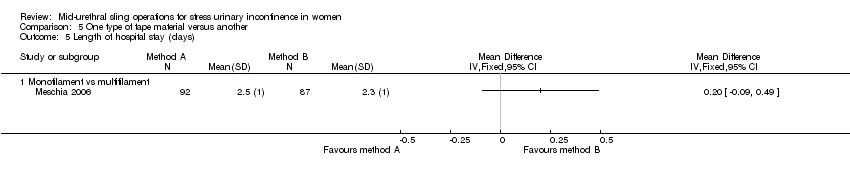
Comparison 5 One type of tape material versus another, Outcome 5 Length of hospital stay (days).
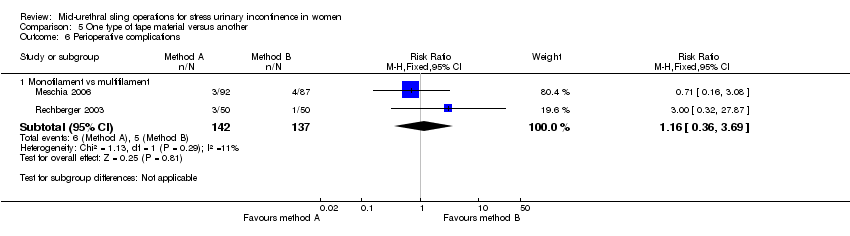
Comparison 5 One type of tape material versus another, Outcome 6 Perioperative complications.
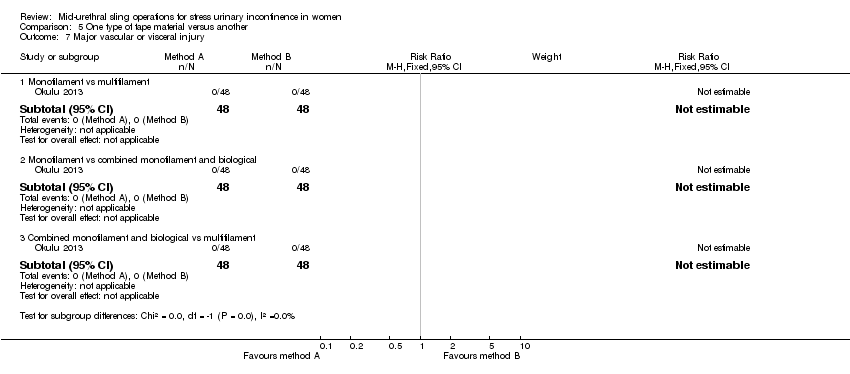
Comparison 5 One type of tape material versus another, Outcome 7 Major vascular or visceral injury.

Comparison 5 One type of tape material versus another, Outcome 8 Bladder or urethral perforation.

Comparison 5 One type of tape material versus another, Outcome 9 Voiding dysfunction.

Comparison 5 One type of tape material versus another, Outcome 10 De novo urgency or urgency incontinence.

Comparison 5 One type of tape material versus another, Outcome 11 Detrusor overactivity.

Comparison 5 One type of tape material versus another, Outcome 12 Vaginal tape erosion.

Comparison 5 One type of tape material versus another, Outcome 13 QoL specific (ICIQ).
| Transobturator (TOR) compared to retropubic (RPR) route for stress urinary incontinence in women | ||||||
| Patient or population: women with stress urinary incontinence | ||||||
| Outcomes | Illustrative comparative risks* (95% CI) | Relative effect | No of participants | Quality of the evidence | Comments | |
| Assumed risk | Corresponding risk | |||||
| Retropubic (RPR) route | Transobturator (TOR) | |||||
| Subjective cure (Short term < 1 year) | Study population | RR 0.98 | 5514 | ⊕⊕⊕⊝ | ||
| 844 per 1000 | 827 per 1000 | |||||
| Mean control group risk across studies | ||||||
| 833 per 1000 | 816 per 1000 | |||||
| Subjective cure (medium term, 1 to 5 years) | Study population | RR 0.97 | 683 | ⊕⊕⊝⊝ | ||
| 881 per 1000 | 854 per 1000 | |||||
| Mean control group risk across studies | ||||||
| 869 per 1000 | 843 per 1000 | |||||
| Subjective cure (long term, > 5 years) | Study population | RR 0.95 | 714 | ⊕⊕⊕⊝ | ||
| 707 per 1000 | 671 per 1000 | |||||
| Mean control group risk across studies | ||||||
| 843 per 1000 | 801 per 1000 | |||||
| Bladder or urethral perforation | Study population | RR 0.13 | 6372 | ⊕⊕⊕⊝ | ||
| 49 per 1000 | 6 per 1000 | |||||
| Mean control group risk across studies | ||||||
| 25 per 1000 | 3 per 1000 | |||||
| Voiding dysfunction (short and medium term, up to 5 years) | Study population | RR 0.53 | 6217 | ⊕⊕⊕⊝ | ||
| 72 per 1000 | 38 per 1000 | |||||
| Mean control group risk across studies | ||||||
| 55 per 1000 | 29 per 1000 | |||||
| De novo urgency or urgency incontinence (short term, up to 12 months) | Study population | RR 0.98 | 4923 | ⊕⊕⊕⊝ | ||
| 82 per 1000 | 80 per 1000 | |||||
| Mean control group risk across studies | ||||||
| 83 per 1000 | 81 per 1000 | |||||
| Groin pain | Study population | RR 4.62 | 3226 | ⊕⊕⊕⊝ | ||
| 14 per 1000 | 66 per 1000 | |||||
| Mean control group risk across studies | ||||||
| 45 per 1000 | 208 per 1000 | |||||
| Suprapubic pain | Study population | RR 0.29 | 1105 | ⊕⊕⊕⊝ | ||
| 29 per 1000 | 8 per 1000 | |||||
| Mean control group risk across studies | ||||||
| 18 per 1000 | 5 per 1000 | |||||
| Vaginal tape erosion (short and medium term, up to 5 years) | Study population | RR 1.13 | 4743 | ⊕⊕⊕⊝ | ||
| 20 per 1000 | 22 per 1000 | |||||
| Mean control group risk across studies | ||||||
| 21 per 1000 | 24 per 1000 | |||||
| Repeat incontinence surgery (short term, within 12 months) | Study population | RR 1.64 | 1402 | ⊕⊕⊕⊝ | ||
| 19 per 1000 | 31 per 1000 | |||||
| mean control group across studies | ||||||
| 24 per 1000 | 39 per 1000 | |||||
| Repeat incontinence surgery (long term, > 5 years) | Study population | RR 8.79 | 695 | ⊕⊕⊝⊝ | ||
| 11 per 1000 | 100 per 1000 | |||||
| Mean control group across studies | ||||||
| 67 per 1000 | 589 per 1000 | |||||
| Cost effectiveness of intervention | An economic analysis was performed in only one RCT. This showed that over a 12‐month follow‐up period there was cost saving with TOR of CAD 1133 per patient (95% CI ‐2793 to 442), despite no difference in health outcome between the groups (adjusted to 2007 Canadian prices). The average cost of TOR was 17% less than that of RPR. | ‐ | (1 RCT) | |||
| Quality of life | 16 different validated questionnaires were used by different studies to assess QoL. This outcome was reported in 11 RCTs, but reported in different ways which precluded meta‐analysis. In all but one of the RCTs where QoL was assessed there was improvement in the QoL in women after the intervention, irrespective of which route was used, with no significant difference in scores between groups. Where assessment of sexual function was performed, there was an equal amount of improvement in sexual function following surgical treatment, irrespective of the route employed | ‐ | (11 RCTs) | |||
| *The basis for the assumed risk (e.g. the median control group risk across studies) is provided in footnotes. The corresponding risk (and its 95% confidence interval) is based on the assumed risk in the comparison group and the relative effect of the intervention (and its 95% CI). CI: confidence interval RCT: randomised controlled trial RPR: retropubic route RR: risk ratio TOR: transobturator route | ||||||
| GRADE Working Group grades of evidence | ||||||
| 1Random sequence generation was unclear in 13 studies and at high risk of bias in 2 studies, and allocation concealment was unclear in 20 studies and at high risk in 2/37 studies 2Allocation concealment was unclear in 2/5 trials and sequence generation was unclear in 1/5 trials, so we decided to downgrade by 1 level 3There was potential substantial heterogeneity with an I² value of 67%, so we downgraded the quality rating by 1 level 4There was potential substantial heterogeneity among studies with an I² value of 65%, which lead us to downgrade by 1 level 5As allocation concealment was unclear in 18/40 trials and at high risk in 3/40, and sequence generation was unclear in 14/40 trials and at high risk in 3/40, we decided to downgrade by 1 level 6As allocation concealment was unclear in 16/37 trials and at high risk in 2/37, and sequence generation was unclear in 11/37 trials and at high risk in 2/37, we decided to downgrade by 1 level 7Random sequence generation was unclear in 10/31 studies and at high risk of bias in 2/31, and allocation concealment was unclear in 15/31 studies and at high risk in 2/31, so we downgraded by 1 level 8Random sequence generation was unclear in 4/18 studies and at high risk in 2/18, and allocation concealment was unclear in 9/18 studies and at high risk in 2/18, so we downgraded the quality of the evidence by 1 level 9Random sequence generation was at high risk in 1/4 studies, while allocation concealment was unclear in 2/4 and at high risk in 1/4, so we downgraded by 1 level 10Allocation concealment was unclear in 12/31 trials and at high risk in 1/31, while sequence generation was unclear in 6/31 trials and at high risk in 1/31, so we decided to downgrade by 1 level 11The wide confidence interval was judged to include a threshold for appreciable harm considered to be > 25% increase in RR, in this case there was much more than a 25% increase in RR for harm, so we downgraded the level by 1 12There was potential substantial heterogeneity with an I² value of 46%, so we downgraded the quality rating by 1 level 13Due to the low number of studies reporting data for this outcome, and the low number of events and wide CI around the estimate of the effect, we downgraded the quality of evidence by 1 level due to imprecision | ||||||
| Retropubic bottom‐to‐top approach compared to retropubic top‐to‐bottom approach for stress urinary incontinence in women | ||||||
| Patient or population: women with stress urinary incontinence | ||||||
| Outcomes | Illustrative comparative risks* (95% CI) | Relative effect | No of participants | Quality of the evidence | Comments | |
| Assumed risk | Corresponding risk | |||||
| retropubic top‐to‐bottom approach | Retropubic bottom‐to‐top approach | |||||
| Subjective cure (short term, ≤ 1 year) | Study population | RR 1.10 | 492 | ⊕⊕⊕⊝ | ||
| 770 per 1000 | 847 per 1000 | |||||
| Mean control group across studies | ||||||
| 890 per 1000 | 979 per 1000 | |||||
| Subjective cure (medium term, 1 to 5 years) | No studies reported this outcome | ‐ | (0 studies) | |||
| Subjective cure long term: > 5 years | No studies reported this outcome | ‐ | (0 studies) | |||
| Bladder or urethral perforation | Study population | RR 0.55 | 631 | ⊕⊕⊕⊝ | ||
| 85 per 1000 | 47 per 1000 | |||||
| Mean control group across studies | ||||||
| 115 per 1000 | 63 per 1000 | |||||
| Voiding dysfunction | Study population | RR 0.40 | 631 | ⊕⊕⊕⊝ | ||
| 60 per 1000 | 24 per 1000 | |||||
| Mean control group across studies | ||||||
| 49 per 1000 | 20 per 1000 | |||||
| De novo urgency or urgency incontinence | Study population | RR 0.84 | 547 | ⊕⊕⊝⊝ | ||
| 123 per 1000 | 103 per 1000 | |||||
| Mean control group across studies | ||||||
| 187 per 1000 | 157 per 1000 | |||||
| Vaginal tape erosion | Study population | RR 0.27 | 569 | ⊕⊕⊕⊝ | ||
| 35 per 1000 | 9 per 1000 | |||||
| Mean control group across studies | ||||||
| 69 per 1000 | 19 per 1000 | |||||
| Repeat incontinence surgery short term | No studies reported this outcome | ‐ | (0 studies) | |||
| Repeat incontinence surgery long term | No studies reported this outcome | ‐ | (0 studies) | |||
| Cost effectiveness of intervention | No studies reported this outcome | ‐ | (0 studies) | |||
| Quality of life (IIQ scores) | The mean quality of life (IIQ scores) in the control group was 49.9 | The mean quality of life (IIQ scores) in the intervention group was 4.6 lower (14.17 lower to 4.97 higher) | ‐ | 84 | ||
| *The basis for the assumed risk (e.g. the median control group risk across studies) is provided in footnotes. The corresponding risk (and its 95% confidence interval) is based on the assumed risk in the comparison group and the relative effect of the intervention (and its 95% CI). IIQ: Incontinence Impact questionnaire RCT: randomised controlled trial RR risk ratio; | ||||||
| GRADE Working Group grades of evidence | ||||||
| 1Sequence generation and allocation concealment was unclear in 2/3 trials, so we downgraded by 1 level 2Sequence generation and allocation concealment was unclear in 3/5 trials, so we downgraded by 1 level 3Sequence generation was unclear in 2/4 studies and allocation concealment unclear in 3/4 studies, so we downgraded by 1 level 4The wide confidence interval was judged to include a threshold for appreciable harm considered to be > 25% increase in RR, in this case there was much more than a 25% increase in RR for harm, so we downgraded the level by 1 5Sequence generation unclear in 3/4 studies and allocation concealment unclear in 2/4 studies, so we downgraded by 1 level | ||||||
| Obturator medial‐to‐lateral approach compared to obturator lateral‐to‐medial approach for stress urinary incontinence in women | ||||||
| Patient or population: women with stress urinary incontinence | ||||||
| Outcomes | Illustrative comparative risks* (95% CI) | Relative effect | No of participants | Quality of the evidence | Comments | |
| Assumed risk | Corresponding risk | |||||
| Obturator lateral‐to‐medial approach | Obturator medial‐to‐lateral approach | |||||
| Subjective cure (short term ≤ 1 year) | Study population | RR 1.00 | 759 | ⊕⊕⊝⊝ | ||
| 877 per 1000 | 877 per 1000 | |||||
| Mean control group risk across studies | ||||||
| 880 per 1000 | 880 per 1000 | |||||
| Subjective cure (medium term, 1 to 5 years) | Study population | RR 1.06 | 235 | ⊕⊕⊝⊝ | ||
| 711 per 1000 | 753 per 1000 | |||||
| Mean control group risk across studies | ||||||
| 736 per 1000 | 780 per 1000 | |||||
| Subjective cure | No studies reported this outcome | ‐ | (0 studies) | |||
| Bladder or urethral perforation | Study population | RR 0.38 | 794 | ⊕⊕⊕⊝ | ||
| 11 per 1000 | 4 per 1000 | |||||
| Mean control group risk across studies | ||||||
| 6 per 1000 | 2 per 1000 | |||||
| Voiding dysfunction (short and medium term, up to 5 years) | Study population | RR 1.74 | 1121 | ⊕⊕⊕⊝ | ||
| 40 per 1000 | 70 per 1000 | |||||
| Mean control group risk across studies | ||||||
| 55 per 1000 | 96 per 1000 | |||||
| De novo urgency or urgency incontinence (short term, up to 12 months) | Study population | RR 1.01 | 357 | ⊕⊕⊝⊝ | ||
| 63 per 1000 | 63 per 1000 | |||||
| Mean control group risk across studies | ||||||
| 64 per 1000 | 65 per 1000 | |||||
| Groin pain | Study population | RR 1.15 | 837 | ⊕⊝⊝⊝ | ||
| 80 per 1000 | 92 per 1000 | |||||
| Mean control group risk across studies | ||||||
| 74 per 1000 | 85 per 1000 | |||||
| Vaginal tape erosion (short and medium term, up to 5 years) | Study population | RR 0.42 | 1087 | ⊕⊝⊝⊝ | ||
| 24 per 1000 | 10 per 1000 | |||||
| Mean control group risk across studies | ||||||
| 17 per 1000 | 7 per 1000 | |||||
| Repeat incontinence surgery (short term, up to 12 months) | Study population | RR 0.64 | 532 | ⊕⊕⊝⊝ | ||
| 71 per 1000 | 45 per 1000 | |||||
| Mean control group risk across studies | ||||||
| 58 per 1000 | 37 per 1000 | |||||
| Repeat incontinence surgery | No studies reported this outcome | ‐ | (0 studies) | |||
| Cost effectiveness of intervention | No studies reported this outcome | ‐ | (0 studies) | |||
| Quality of life | The mean quality of life in the control group was 0 | The mean quality of life in the intervention group was 16.54 higher (4.84 higher to 28.24 higher) | ‐ | 46 | ⊕⊝⊝⊝ | |
| *The basis for the assumed risk (e.g. the median control group risk across studies) is provided in footnotes. The corresponding risk (and its 95% confidence interval) is based on the assumed risk in the comparison group and the relative effect of the intervention (and its 95% CI). RCT: randomised controlled trial RR: risk ratio; | ||||||
| GRADE Working Group grades of evidence | ||||||
| 1Random sequence generation was unclear in 4/6 studies, allocation concealment was unclear in5/6 and at high risk in 1/6 studies, so we downgraded the quality of evidence due to risk of bias by 2 levels 2Random sequence generation was unclear in all both studies, allocation concealment was unclear in 1 and high risk of bias in the other study, so we downgraded by 2 levels 3Sequence generation was unclear in 2 studies and allocation concealment was unclear in 3 studies, so we downgraded the quality rating by 1 level 4Sequence generation was unclear in 3 studies and at high risk in 1 study, while allocation concealment was unclear in 4 studies and at high risk in 1 study, so we downgraded by 1 level 5Sequence generation was unclear in 2/3 studies and at high risk in 1/3, allocation concealment was unclear in 2/3 studies and high in 1/3, so we downgraded by 2 levels 6Random sequence generation was unclear in 2/5 and high in 1/5 studies, while allocation concealment was unclear in 2/5 and high in 2/5 studies, so we downgraded the quality of evidence due to high risk of bias by 2 levels 7The wide confidence interval was judged to include a threshold for appreciable harm considered to be > 25% increase in RR, in this case there was > 65% increase in RR for harm, so we downgraded by 1 level 8Sequence generation was unclear in 3/7 studies and at high risk in 1/7. Allocation concealment was unclear in 5/7 studies and at high risk in 1/7. We downgraded the quality rating by 2 levels 9Sequence generation and allocation concealment were unclear in 1/2 studies, so we downgraded by 1 level 10Sequence generation and allocation concealment were unclear, so we downgraded by 1 level 11As there was only 1 study with very few events and CIs around estimates of effect included appreciable benefit and appreciable harm, we downgraded by 2 levels | ||||||
| Monofilament compared to multifilament tapes for stress urinary incontinence in women | ||||||
| Patient or population: women with stress urinary incontinence | ||||||
| Outcomes | Illustrative comparative risks* (95% CI) | Relative effect | No of participants | Quality of the evidence | Comments | |
| Assumed risk | Corresponding risk | |||||
| multifilament tapes | Monofilament | |||||
| Subjective cure (short term ≤ 1 year) | Study population | RR 1.07 | 505 | ⊕⊕⊕⊝ | ||
| 784 per 1000 | 839 per 1000 | |||||
| Mean control group risk across studies | ||||||
| 810 per 1000 | 867 per 1000 | |||||
| Subjective cure (medium term: 1 to 5 years) | No studies reported this outcome | ‐ | (0 studies) | |||
| Subjective cure (long term: > 5 years) | No studies reported this outcome | ‐ | (0 studies) | |||
| Bladder or urethral perforation | Study population | RR 0.76 | 496 | ⊕⊕⊕⊝ | ||
| 37 per 1000 | 28 per 1000 | |||||
| Mean control group risk across studies | ||||||
| 32 per 1000 | 25 per 1000 | |||||
| Voiding dysfunction | Study population | RR 2.20 | 400 | ⊕⊕⊝⊝ | ||
| 41 per 1000 | 89 per 1000 | |||||
| Mean control group risk across studies | ||||||
| 65 per 1000 | 143 per 1000 | |||||
| De novo urgency or urgency incontinence | Study population | RR 1.09 | 496 | ⊕⊕⊝⊝ | ||
| 102 per 1000 | 111 per 1000 | |||||
| Mean control group risk across studies | ||||||
| 107 per 1000 | 117 per 1000 | |||||
| Vaginal tape erosion | Study population | RR 0.43 | 396 | ⊕⊕⊕⊕ | ||
| 62 per 1000 | 26 per 1000 | |||||
| Mean control group risk across studies | ||||||
| 43 per 1000 | 18 per 1000 | |||||
| Repeat incontinence surgery (short term ≤ 1 year) | No studies reported this outcome | ‐ | (0 studies) | |||
| Repeat incontinence surgery (long term > 5 years) | No studies reported this outcome | ‐ | (0 studies) | |||
| Cost effectiveness of intervention | No studies reported this outcome | ‐ | (0 studies) | |||
| Quality of life scores ICIQ | The mean quality of life scores ICIQ in the control group was 2.1 | The mean quality of life scores ICIQ in the intervention group was 0.6 lower (0.76 lower to 0.44 lower) | ‐ | 96 | ⊕⊕⊕⊕ | |
| *The basis for the assumed risk (e.g. the median control group risk across studies) is provided in footnotes. The corresponding risk (and its 95% confidence interval) is based on the assumed risk in the comparison group and the relative effect of the intervention (and its 95% CI). ICIQ: International Consultation on Incontinence questionnaire RCT: randomised controlled trial RR: risk ratio | ||||||
| GRADE Working Group grades of evidence | ||||||
| 1Random sequence generation and allocation concealment unclear in 2/4 studies, so we downgraded by 1 level 2Random sequence generation and allocation concealment unclear in 2/3 studies, so downgraded by 1 level 3The wide confidence interval was judged to include a threshold for appreciable harm considered to be > 25% increase in RR, in this case there was much more than a 25% increase in RR for harm, so we downgraded by 1 level 4Sequence generation and allocation concealment were unclear in 2/4 studies, so we downgraded the quality rating by 1 level 5The wide confidence interval was judged to include a threshold for appreciable harm considered to be > 25% increase in RR, in this case there was > 65% increase in RR for harm, so we downgraded by 1 level | ||||||
| Study | Outcome data |
| Abdel‐Fattah 2010 | Group A: TVT‐O (n = 170) Group B: TOT (n = 171) Loss to follow up at 1yr: A: 18/170, B: 24/171 Loss to follow up at 3yrs: A: 44/170, B: 59/171 Objective cure: A: 114/121, B: 96/109 Subjective success: A: 121/149, B: 111/143 Bladder/urethral perforation: A: 1/170, B: 2/171 Voiding dysfunction: A: 12/170, B: 9/171 Tape erosion: A: 3/153, B: 5/149 Groin pain: A: 27/150, B: 19/147 Repeat continence surgery: A: 7/170, B: 15/171 QoL assessed via: King’s Health Questionnaire (KHQ) [10], Birmingham Bowel Urinary Symptom (BBUSQ‐22) [11] and Pelvic Organ Prolapse/Incontinence Sexual Function Questionnaire (PISQ‐12). In addition Patient Global Impression of Improvement (PGI‐I) [13] and International Consultation on Incontinence Questionnaire‐ Short form (ICIQ‐SF) [14] questionnaires. QOL scores were much improve following surgery with no significant inter group (A vs B) differences. Sexual dysfunction: PISQ‐12 employed. 199 patients completed this assessment and in most domains a significant improvement in postoperative PISQ‐12 scores was found with no significant difference demonstrated between the two groups. Intermediate (3 yr) Subjective success (very much & much improved) on PGI‐I: A: 93/126, B: 81/112 |
| Aigmuller 2014 | Group A: TVT: (n = 285; 38 of whom were lost to follow‐up) Group B: TVT‐O: (n = 269; 36 of whom were lost to follow‐up) Participants were evaluated at 3 months, with a further evaluation scheduled at 5 years
At 5‐year review:
|
| Alkady 2009 | Group A: TVT (n = 15) Group B: TVT‐O (n = 15)
|
| Andonian 2005 | Group A: SPARC Group B: TVT
|
| Andonian 2007 | Group A: Obtape (n = 78) Group B: DUPS (n = 32) ‐ suspended Group C: TVT (n = 80)
|
| Aniuliene 2009 | Group A: TVT‐O (n = 150) Group B: TVT (n = 114)
|
| Araco 2008 | Group A: TVT‐O (n = 120)
|
| Barber 2008 | Group A: TVT (n = 88) Group B: TOT (n = 82)
|
| Barry 2008 | Group A: TOT (n = 58)
|
| But 2008 | Group A: TVT‐O (n = 60) Group B: TOT (n = 60)
|
| Cervigni 2006 | Numbers in each group unreported. It was, thus, impossible to abstract results |
| Chen 2010 | Group A: TVT (n = 77) Group B: TOT (n = 45) Group C: TVT‐O (n = 65)
|
| Chen 2012 | A: TVT (n = 102) B: TVT‐O (n = 103)
|
| Cho 2010 | Group A: Monarc TOT (n = 48) Group B: TOT (n = 45)
|
| Choe 2013 | We were not able to use the data provided, as the number in each group was not specified |
| Darabi Mahboub 2012 | Group A: TOT (n = 40) Group B: TVT (n = 40) Operative time (minutes (SD): A: 64.50 (9.04), B: 64.00 (9.48) Mean hospital stay (days): A: 2.56 (0.51), B: 2.52 (0.47) |
| David‐Montefiore 2006 | Group A: RPR (n = 42) Group B: TOR (n = 46)
|
| de Leval 2011 | Group A: TVT‐O (n = 87) Group B: modified TVT‐O (n = 88)
At 3‐year follow‐up:
|
| de Tayrac 2004 | Group: A: TOT (n = 30) Group: B: TVT (n = 31)
|
| Deffieux 2010 | Group A: TVT (n = 75) Group B: TVT‐O (n = 74)
|
| Diab 2012 | Group A: TOT (n = 31) Group B: TVT (n = 32)
All the preoperative parameters were comparable in both groups. The mean operative time was significantly longer and bladder injury was significantly higher in the TVT group. There were no significant difference in cure rates, voiding dysfunction, de novo urgency and reoperation rate. The postoperative groin/thigh pain was higher in the TOT group. |
| El‐Hefnway 2010 | Preliminary results: Group A: TVT: (n = 19) Group B: TOT: (n = 21) At 24 months: Group A: TVT: (n = 45) Group B: TOT: (n = 42)
|
| Elbadry 2014 | Group A: adjustable TOT (n = 48) Group B: TOT: (n = 48)
|
| Enzelsberger 2005 | Group A: TOT (n = 56) Group B: TVT (n = 54)
|
| Freeman 2011 | Group A: Monarc TOT (n = 100) Group B: Gynaecare TVT (n = 92)
|
| Hammoud 2011 | Group A: TVT (n = 60) Group B: TVT‐O (n = 50) Subjective cure: A: 56/60, B: 48/50 |
| Hassan 2013 | Group A: inside‐out TOT (n = 125) Group B: outside‐in TOT (n = 125)
|
| Houwert 2009 | Group A: TVT‐O (n = 93) Group B: Monarc TOT (n = 98)
|
| Jakimiuk 2012 | Group A: TVT (n = 19) Group B: TVT‐O (n = 16)
|
| Juang 2007 | Group A: TVT‐O (n = 47) Group B: TVT‐O plus IS: (n = 49)
|
| Kamel 2009 | A: TVT (n = 60) B: TVT‐O (n = 60)
|
| Karateke 2009 | Group A: TVT (n = 83) Group B: TVT‐O (n = 84)
|
| Kilic 2007 | Group A: TVT (n = 10) Group B: TOT (n = 10)
|
| Kim 2004 | Group A: TVT (n = 32) Group B: SPARC (n = 30)
|
| Kim 2005 | Group A: Monarc (n = 65) Group B: SPARC (n = 65)
|
| Krofta 2010 | Group A: TVTTM (n = 149) Group B: TVT –OTM (n = 151)
|
| Laurikainen 2007 | Group A: TVT‐O (n = 131)
QoL: The scores of the condition specific quality of life questionnaires were significantly lower at the 3 and 5 year follow up compared with pre‐operative scores. This improvements were statistically significant, but with no difference between the groups. 84% of women with pre‐operative moderate and severe frequency and urgency symptoms were cured of these symptoms at the 5 year follow up. |
| Leanza 2009 | Group A: r‐TICT (n = 229; retropubic) Group B: t‐TICT (n = 220; transobturator) Subjective cure: A: 190/215, B: 178/208 |
| Lee 2007 | Group A: TVT (n = 60) Group B: TVT‐O (n = 60)
|
| Lee 2008 | Group A: TVT‐O (n = 50) Group B: TOT (n = 50)
|
| Liapis 2006 | Group A: TVT (n = 46) Group B: TVT‐O (n = 43)
|
| Liapis 2008 | Group A: TVT‐O (n = 61) Group B: Monarc TOT (n = 53)
|
| Lim 2005 | Group A: TVT (n = 61) Group B: IVS (n = 60) Group C: SPARC (n = 61)
|
| Lord 2006 | Group A: TVT (n = 147)
|
| Mansoor 2003 | Group A: TVT‐O (n = 48)
|
| Mehdiyev 2010 | A: TOT (n = 17) B: TVT (n = 15)
|
| Meschia 2006 | Group A: TVT (n = 92)
|
| Meschia 2007 | Group A: TVT‐O (n = 117) Group B: TVT (n = 114)
|
| Naumann 2006 | Group A: TVT (n = 123) Group B: LIFT (n = 125)
|
| Nerli 2009 | Group A: TVT (n = 18) Group B: TOT (n = 18)
|
| Nyyssonen 2014 | Group A: TOT (n = 50) Group B: TVT (n = 50)
|
| Okulu 2013 | Group A: Vypro mesh: (n = 48; multifilament) Group B: Ultrapro mesh: (n = 48; monofilament + biological combined mesh) Group C: Prolene light mesh: (n = 48; monofilament)
|
| Oliveira 2006 | Group A: TVT (n = 17)
|
| Palomba 2008 | Trial terminated. |
| Paparella 2010 | Group A: synthetic UretexTO® (n = 34) Group B: biological PelviLaceTO® (n‐36)
|
| Park 2012 | Group A: TVT‐O (n = 39) Group B: TOT Monarc (n = 35)
|
| Peattie 2006 | No published data. |
| Porena 2007 | Group A: TVT (n = 70) Group B: TOT (n = 75)
|
| Rechberger 2003 | Group A: TVT (n = 50) Group B: IVS (n = 50)
|
| Rechberger 2009 | Group A: retropubic (IVS‐02; n = 269) Group B: transobturator (IVS‐04; n = 268)
|
| Rechberger 2011 | Group A: TOT (n = 232) Group B: TOT with fixation (n = 231)
|
| Richter 2010 | Group A: retropubic sling (TVT; n = 298) Group B: transobturator tapes (TVT‐O, and TOT Monarc; n = 299) (Group C (?): TVT‐O (inside‐out) ‐ separate data not provided) (Group D (?): TOT (Monarch, outside‐in) ‐ separate data not provided) Objective cure at 1 year: A: 232/280 (80.8%), B: 233/285 (77.7%) Subjective cure at 1 year: A: 181/280 (62.2%), B: 163/285 (55.8%) Secondary outcomes:
PISQ‐12 (Prolapse / urinary incontinence sexual questionnaire): Analysis of results for group A and group B combined showed significant improvement in sexual function in both groups with a mean PISQ‐12 score increase from 32.8+/‐7.1 at baseline to 37.3+/‐ 6 at 24 months. These changes are >0.6 SD units, which reflects “medium” improvement in the PISQ‐12 score after surgery. Compared with women with successful surgery, women who experienced surgical failure, regardless of assigned type of surgery, reported worse adjusted sexual function scores at all postoperative time points. Improvement in PISQ‐12 scores was consistent with change in the 3 specific items from the sexual function measure of interest: (1) the experience of pain during sexual activity, (2) UI during sexual activity, and (3) fear of incontinence during sexual activities. Pain with intercourse was reported by 153 of 406 of sexually active women (38%) at baseline and decreased to 27% at 12 months after surgery (P.003). Self‐reported UI and the fear of incontinence occurring during sexual activity also significantly improved by 12 months after surgery, regardless of sling route. To specifically investigate the association of synthetic mesh slings on dyspareunia, we repeated the analysis on the 247 women who underwent MUS only (no concurrent procedures) and who completed baseline and 12‐month assessments. In this subset of women, dyspareunia decreased from 57% at baseline to 43% at 12 months after surgery (P .03). 5‐year data provided, but without numbers in each group, so could not be used for meta‐analysis |
| Riva 2006 | Group A: TOT (n = 65) Group B: TVT (n = 66) |
| Ross 2009 | Group A: TVT (n = 105) Group B: TOT (n = 94)
|
| Salem 2014 | Group A: TOT (n = 37) Group B: TVT (n = 39) No significant difference was noticed between the two groups as regard the mean operative time, perioperative complications, intraoperative blood loss, hospital stay, and time to return to normal activities. The mean of abdominal leak point pressure and urethral closure pressure showed marked and maintained improvement for 5 years later in group I whereas in group II, they showed marked and maintained improvement for only one year then shows significant decline in comparison with group I. As regard the mean of objective SEAPI score shows marked decrease (improvement) in both groups and this was maintained for the five years in group I but in group II, it increased after one year later. No usable data provided. |
| Scheiner 2012 | Group A: TVT (n = 80) Group B: TOT outside‐in approach (Monarc; n = 40) Group C: TVT‐O inside‐out approach (Gynecare; n = 40)
|
| Schierlitz 2008 | Group A: TVT (n = 81) Group B: Monarc sling (n = 82)
|
| Tanuri 2010 | Group A: Safyre VS retropubic tape (n = 10) Group B: Safyre T transobturator tape (n = 20)
|
| Tarcan 2011 | Group A: TVT (n = 27) Group B: TOT (n = 27) 12‐month follow‐up assessed:
2 year follow‐up assessed:
|
| Teo 2011 | Group A: TVT (n = 66) Group B: TVT‐O (n = 61)
|
| Tommaselli 2012 | Group A: TVT‐O (n = 48) Group B: modified TVT‐O (n = 24)
|
| Tseng 2005 | Group A: SPARC (n = 31)
|
| Ugurlucan 2013 | Group A: biological PELVILACE TO (n = 50) Group B: synthetic TOT ALIGN ®TO (n = 50)
|
| van Leijsen 2013 | Group A: RPR (n = 33) Group B: TOT (n = 90)
|
| Wang 2006 | Group A: Monarc (n = 31) Group B: SPARC (n = 29)
|
| Wang 2008 | Group A: TVT (n = 35) Group B: TVT‐O (n = 34)
|
| Wang 2009 | Group A: TVT (n = 154) Group B: TVT‐O (n = 146)
|
| Wang 2010 | Group A: TVT (n = 70) Group B: TOT (n = 70)
|
| Wang 2011 | Group A: TVT (n = 32) Group B: TVT‐O (n = 36)
|
| Zhang 2011 | Group A: TVT‐O (n = 76) Group B: modified TVT‐O (n = 80)
|
| Zullo 2007 | Group A: TVT (n = 35) Group B: TVT‐O (n = 37)
|
| Abbreviations BFLUTS: Bristol lower urinary tract symptoms questionnaires BMI: body‐mass index DO: detrusor overactivity DUP: distal urethral polypropylene sling EQOL‐5D: Euro Quality of life ‐5 Dimension hr: hour/s HRT: hormone replacement therapy ICIQ: International Consultation on Incontinence questionnaire ICIQ‐FLUTS: International Consultation on Incontinence questionnaire ‐ female lower urinary tract symptoms ICIQ‐ LUTSquol: International Consultation on Incontinence questionnaire ‐ lower urinary tract quality of life questionnaire ICIQ‐SF: International Consultation on Incontinence questionnaire short form ICIQ‐SF15: International Consultation on Incontinence questionnaire short form 15 IIQ: Incontinence Impact questionnaire ICS: International Continence Society I‐QoL: Incontinence Quality of Life questionnaire ISD: intrinsic sphincter deficiency IVS: intravaginal slingoplasty KHQ: King's Health questionnaireMUI: mixed urinary incontinence MUCP: Maximum urethral closure pressure MUI: mixed urinary incontinence OAB: overactive bladder PGI‐I: Patient Global Impression of Improvment PGI‐S: Patient Global Impression of Severity PISQ‐12: pelvic organ prolapse/urinary incontinence sexual questionnaire POP: pelvic organ prolapse POP‐Q: pelvic organ prolapse quantification POP‐Q ICS: pelvic organ prolapse quantification International Continence Society PVR: post void residual RCT: randomized controlled trial RPR: retropubic route QoL: quality of life QRCT: quasi‐randomised trial SEAPI‐QMM: Stress related leak, Empyting ability, Anatomy, Protection, Inhibition‐Quality of life, Mobility and Mental status incontinence classification system SD: standard deviation SIS: Single incision sling SPARC: suprapubic arc (procedure) SUI: stress urinary incontinence TOR: transobturator TOT: transobturator tape TOT‐ARIS: transobturator tape‐ARIS TVT: tension‐free vaginal tape TVT‐O: transobturator tension‐free vaginal tape UDI: Urinary Distress Impact questionnaire UDI‐6: Urinary Distress Impact questionnaire short form UDS: urodynamics study UI: urinary incontinence UISS: urinary incontinence severity score USI: urodynamic stress incontinence USS: ultrasound UTI: urinary tract infection UUI: urgency urinary incontinence VAS: visual analogue scale VLPP: Valsalval leak point pressure | |
| Outcome or subgroup title | No. of studies | No. of participants | Statistical method | Effect size |
| 1 Subjective cure (short term, ≤ 1 year) Show forest plot | 36 | 5514 | Risk Ratio (M‐H, Fixed, 95% CI) | 0.98 [0.96, 1.00] |
| 2 Subjective cure and improvement (short term, ≤ 1 year) Show forest plot | 10 | 1651 | Risk Ratio (M‐H, Fixed, 95% CI) | 0.98 [0.96, 1.00] |
| 3 Subjective cure (medium term, 1 to 5 years) Show forest plot | 5 | 683 | Risk Ratio (M‐H, Random, 95% CI) | 0.97 [0.87, 1.09] |
| 4 Subjective cure (long term, > 5 years) Show forest plot | 4 | 714 | Risk Ratio (M‐H, Random, 95% CI) | 0.95 [0.80, 1.12] |
| 5 Subjective cure and improvement (long term, > 5 years) Show forest plot | 2 | 340 | Risk Ratio (M‐H, Random, 95% CI) | 0.92 [0.67, 1.28] |
| 6 Objective cure (short term, ≤ 1 year) Show forest plot | 40 | 6145 | Risk Ratio (M‐H, Fixed, 95% CI) | 0.98 [0.96, 1.00] |
| 7 Objective cure and improvement (short term, ≤ 1 year) Show forest plot | 10 | 1478 | Risk Ratio (M‐H, Fixed, 95% CI) | 0.98 [0.96, 1.01] |
| 8 Objective cure (medium term, 1 to 5 years) Show forest plot | 5 | 596 | Risk Ratio (M‐H, Fixed, 95% CI) | 1.00 [0.95, 1.06] |
| 9 Objective cure (long term, > 5 years) Show forest plot | 3 | 400 | Risk Ratio (M‐H, Fixed, 95% CI) | 0.97 [0.90, 1.06] |
| 10 Operative time (minutes) Show forest plot | 31 | 4713 | Mean Difference (IV, Random, 95% CI) | ‐7.54 [‐9.31, ‐5.77] |
| 11 Operative blood loss (ml) Show forest plot | 14 | 1869 | Mean Difference (IV, Random, 95% CI) | ‐6.49 [‐12.33, ‐0.65] |
| 12 Length of hospital stay (days) Show forest plot | 17 | 2170 | Mean Difference (IV, Random, 95% CI) | ‐0.25 [‐0.59, 0.09] |
| 13 Time to return to normal activity level (weeks) Show forest plot | 4 | 626 | Mean Difference (IV, Fixed, 95% CI) | ‐0.05 [‐0.15, 0.06] |
| 14 Perioperative complications Show forest plot | 15 | 2205 | Risk Ratio (M‐H, Fixed, 95% CI) | 0.91 [0.73, 1.14] |
| 15 Major vascular or visceral injury Show forest plot | 28 | 4676 | Risk Ratio (M‐H, Fixed, 95% CI) | 0.33 [0.19, 0.55] |
| 16 Bladder or urethral perforation Show forest plot | 40 | 6372 | Risk Ratio (M‐H, Fixed, 95% CI) | 0.13 [0.08, 0.20] |
| 17 Voiding dysfunction Show forest plot | 37 | 6200 | Risk Ratio (M‐H, Fixed, 95% CI) | 0.53 [0.43, 0.65] |
| 18 De novo urgency or urgency incontinence (short term, ≤ 1 year) Show forest plot | 31 | 4923 | Risk Ratio (M‐H, Fixed, 95% CI) | 0.98 [0.82, 1.17] |
| 19 De novo urgency or urgency incontinence (medium term, 1 to 5 years) Show forest plot | 4 | 481 | Risk Ratio (M‐H, Fixed, 95% CI) | 0.98 [0.55, 1.73] |
| 20 De novo urgency or urgency incontinence (long term, > 5 years) Show forest plot | 1 | Risk Ratio (M‐H, Fixed, 95% CI) | Totals not selected | |
| 21 Detrusor overactivity Show forest plot | 4 | 566 | Risk Ratio (M‐H, Fixed, 95% CI) | 1.00 [0.58, 1.73] |
| 22 Vaginal tape erosion Show forest plot | 31 | 4743 | Risk Ratio (M‐H, Fixed, 95% CI) | 1.13 [0.78, 1.65] |
| 23 Bladder/urethral erosion Show forest plot | 4 | 374 | Risk Ratio (M‐H, Fixed, 95% CI) | 0.34 [0.01, 8.13] |
| 24 Groin pain Show forest plot | 18 | 3221 | Risk Ratio (M‐H, Fixed, 95% CI) | 4.12 [2.71, 6.27] |
| 25 Suprapubic pain Show forest plot | 4 | 1105 | Risk Ratio (M‐H, Fixed, 95% CI) | 0.29 [0.11, 0.78] |
| 26 Repeat incontinence surgery (short term, ≤ 1 year) Show forest plot | 9 | 1402 | Risk Ratio (M‐H, Fixed, 95% CI) | 1.64 [0.85, 3.16] |
| 27 Repeat incontinence surgery (medium term , 1 to 5 years) Show forest plot | 2 | 355 | Risk Ratio (M‐H, Fixed, 95% CI) | 21.89 [4.36, 109.77] |
| 28 Repeat incontinence surgery (long term > 5 years) Show forest plot | 4 | 695 | Risk Ratio (M‐H, Fixed, 95% CI) | 8.79 [3.36, 23.00] |
| Outcome or subgroup title | No. of studies | No. of participants | Statistical method | Effect size |
| 1 Subjective cure (short term, ≤ 1 year) Show forest plot | 3 | 477 | Risk Ratio (M‐H, Fixed, 95% CI) | 1.10 [1.01, 1.19] |
| 2 Objective cure (short term, ≤ 1 year) Show forest plot | 5 | 622 | Risk Ratio (M‐H, Random, 95% CI) | 1.06 [0.97, 1.17] |
| 3 Operative time (minutes) Show forest plot | 2 | 124 | Mean Difference (IV, Fixed, 95% CI) | ‐2.15 [‐4.68, 0.38] |
| 4 Length of hospital stay (days) Show forest plot | 2 | 124 | Mean Difference (IV, Fixed, 95% CI) | ‐0.03 [‐0.37, 0.30] |
| 5 Perioperative complications Show forest plot | 4 | 507 | Risk Ratio (M‐H, Fixed, 95% CI) | 0.98 [0.53, 1.84] |
| 6 Bladder or urethral perforation Show forest plot | 5 | 631 | Risk Ratio (M‐H, Fixed, 95% CI) | 0.55 [0.31, 0.98] |
| 7 Voiding dysfunction Show forest plot | 5 | 631 | Risk Ratio (M‐H, Fixed, 95% CI) | 0.40 [0.18, 0.90] |
| 8 De novo urgency or urgency incontinence Show forest plot | 4 | 541 | Risk Ratio (M‐H, Fixed, 95% CI) | 0.84 [0.52, 1.34] |
| 9 Detrusor overactivity Show forest plot | 1 | Risk Ratio (M‐H, Fixed, 95% CI) | Totals not selected | |
| 10 Vaginal tape erosion Show forest plot | 4 | 563 | Risk Ratio (M‐H, Fixed, 95% CI) | 0.27 [0.08, 0.95] |
| 11 QoL specific Show forest plot | 1 | Mean Difference (IV, Fixed, 95% CI) | Totals not selected | |
| Outcome or subgroup title | No. of studies | No. of participants | Statistical method | Effect size |
| 1 Subjective cure (short term, ≤ 1 year) Show forest plot | 6 | 759 | Risk Ratio (M‐H, Fixed, 95% CI) | 1.00 [0.96, 1.06] |
| 2 Subjective cure and improvement (short term, ≤ 1 year) Show forest plot | 5 | 732 | Risk Ratio (M‐H, Fixed, 95% CI) | 1.02 [0.97, 1.08] |
| 3 Subjective cure (medium term, 1 to 5 years) Show forest plot | 2 | 235 | Risk Ratio (M‐H, Fixed, 95% CI) | 1.06 [0.91, 1.23] |
| 4 Subjective cure and improvement (medium term, 1 to 5 years) Show forest plot | 2 | 399 | Risk Ratio (M‐H, Fixed, 95% CI) | 1.00 [0.90, 1.11] |
| 5 Objective cure (short term, ≤ 1 year) Show forest plot | 6 | 745 | Risk Ratio (M‐H, Fixed, 95% CI) | 0.99 [0.95, 1.04] |
| 6 Objective cure and improvement (short term, ≤ 1 year) Show forest plot | 2 | 214 | Risk Ratio (M‐H, Fixed, 95% CI) | 1.00 [0.95, 1.07] |
| 7 Operative time (minutes) Show forest plot | 4 | 481 | Mean Difference (IV, Random, 95% CI) | 0.52 [‐1.09, 2.13] |
| 8 Operative blood loss (ml) Show forest plot | 3 | 255 | Mean Difference (IV, Fixed, 95% CI) | 1.11 [‐6.01, 8.22] |
| 9 Length of hospital stay (days) Show forest plot | 2 | 190 | Mean Difference (IV, Random, 95% CI) | ‐0.77 [‐2.54, 0.99] |
| 10 Time to return to normal activity level Show forest plot | 1 | Mean Difference (IV, Fixed, 95% CI) | Totals not selected | |
| 11 Perioperative complications Show forest plot | 2 | 214 | Risk Ratio (M‐H, Fixed, 95% CI) | 1.30 [0.23, 7.51] |
| 12 Major vascular or visceral injury Show forest plot | 4 | 622 | Risk Ratio (M‐H, Fixed, 95% CI) | 0.71 [0.23, 2.19] |
| 13 Vaginal perforation/injury Show forest plot | 3 | 541 | Risk Ratio (M‐H, Fixed, 95% CI) | 0.25 [0.12, 0.53] |
| 14 Bladder or urethral perforation Show forest plot | 6 | 794 | Risk Ratio (M‐H, Fixed, 95% CI) | 0.38 [0.07, 1.92] |
| 15 Voiding dysfunction Show forest plot | 8 | 1121 | Risk Ratio (M‐H, Fixed, 95% CI) | 1.74 [1.06, 2.88] |
| 16 De novo urgency or urgency incontinence Show forest plot | 3 | 357 | Risk Ratio (M‐H, Fixed, 95% CI) | 1.01 [0.46, 2.20] |
| 17 Detrusor overactivity Show forest plot | 1 | Risk Ratio (M‐H, Fixed, 95% CI) | Totals not selected | |
| 18 Vaginal tape erosion Show forest plot | 7 | 1087 | Risk Ratio (M‐H, Fixed, 95% CI) | 0.42 [0.16, 1.09] |
| 19 Groin/thigh pain Show forest plot | 6 | 837 | Risk Ratio (M‐H, Fixed, 95% CI) | 1.15 [0.75, 1.76] |
| 20 Repeat incontinence surgery Show forest plot | 2 | 532 | Risk Ratio (M‐H, Fixed, 95% CI) | 0.64 [0.32, 1.30] |
| 21 QoL specific Show forest plot | 1 | 46 | Mean Difference (IV, Fixed, 95% CI) | 16.54 [4.84, 28.24] |
| Outcome or subgroup title | No. of studies | No. of participants | Statistical method | Effect size |
| 1 Subjective cure (short term, up to 1 year) Show forest plot | 7 | Risk Ratio (M‐H, Fixed, 95% CI) | Subtotals only | |
| 1.1 Modified TVT‐O (short tape) vs TVT‐O | 1 | 175 | Risk Ratio (M‐H, Fixed, 95% CI) | 1.00 [0.90, 1.11] |
| 1.2 Modified TVT (suburethral pad) versus TVT | 1 | 248 | Risk Ratio (M‐H, Fixed, 95% CI) | 1.00 [0.91, 1.10] |
| 1.3 Self‐tailored TVT‐O vs TVT‐O | 1 | 156 | Risk Ratio (M‐H, Fixed, 95% CI) | 1.02 [0.93, 1.11] |
| 1.4 Monarc®TOT open edge + tension suture vs TOT® | 1 | 93 | Risk Ratio (M‐H, Fixed, 95% CI) | 1.04 [0.87, 1.24] |
| 1.5 AdjustableTOT vs TOT® | 1 | 96 | Risk Ratio (M‐H, Fixed, 95% CI) | 1.05 [0.87, 1.28] |
| 1.6 Synthetic vs biological | 2 | 169 | Risk Ratio (M‐H, Fixed, 95% CI) | 1.02 [0.86, 1.22] |
| 2 Subjective cure and improvement (short term, up to 1 year) Show forest plot | 3 | Risk Ratio (M‐H, Fixed, 95% CI) | Subtotals only | |
| 2.1 Modified TVT‐O (short tape) vs TVT‐O | 1 | 170 | Risk Ratio (M‐H, Fixed, 95% CI) | 1.03 [0.97, 1.09] |
| 2.2 TOT + 2‐point tape fixation vs TOT | 1 | 418 | Risk Ratio (M‐H, Fixed, 95% CI) | 1.07 [1.00, 1.14] |
| 2.3 TVT versus modified TVT (suburethral pad) | 1 | 248 | Risk Ratio (M‐H, Fixed, 95% CI) | 1.03 [0.98, 1.08] |
| 3 Subjective cure (medium term, 1 to 5 years) Show forest plot | 1 | Risk Ratio (M‐H, Fixed, 95% CI) | Subtotals only | |
| 3.1 Modified TVT‐O (short tape) vs TVT‐O | 1 | 153 | Risk Ratio (M‐H, Fixed, 95% CI) | 0.98 [0.86, 1.12] |
| 4 Objective cure (medium term, 1 to 5 years) Show forest plot | 1 | Risk Ratio (M‐H, Fixed, 95% CI) | Totals not selected | |
| 4.1 Modified TVT‐O (short tape) vs TVT‐O | 1 | Risk Ratio (M‐H, Fixed, 95% CI) | 0.0 [0.0, 0.0] | |
| 5 Objective cure (short term, ≤ 1 year) Show forest plot | 5 | Risk Ratio (M‐H, Fixed, 95% CI) | Subtotals only | |
| 5.1 Modified TVT‐O (less dissection) vs TVT‐O | 1 | 69 | Risk Ratio (M‐H, Fixed, 95% CI) | 1.02 [0.91, 1.15] |
| 5.2 Synthetic vs biological | 2 | 136 | Risk Ratio (M‐H, Fixed, 95% CI) | 1.03 [0.94, 1.14] |
| 5.3 TVT‐O + IS vs TVT‐O | 1 | 93 | Risk Ratio (M‐H, Fixed, 95% CI) | 1.45 [1.02, 2.06] |
| 5.4 TOT + 2‐point tape fixation vs TOT | 1 | 418 | Risk Ratio (M‐H, Fixed, 95% CI) | 1.07 [1.01, 1.13] |
| 6 Operative time (minutes) Show forest plot | 2 | Mean Difference (IV, Fixed, 95% CI) | Subtotals only | |
| 6.1 TVT‐O + IS vs TVT‐O | 1 | 96 | Mean Difference (IV, Fixed, 95% CI) | 12.0 [8.91, 15.09] |
| 6.2 Self‐tailored TVT‐O vs TVT‐O | 1 | 156 | Mean Difference (IV, Fixed, 95% CI) | ‐25.0 [‐26.73, ‐23.27] |
| 7 Operative blood loss (ml) Show forest plot | 3 | Mean Difference (IV, Fixed, 95% CI) | Subtotals only | |
| 7.1 TVT‐O + IS versus TVT‐O | 1 | 92 | Mean Difference (IV, Fixed, 95% CI) | 52.10 [43.73, 60.47] |
| 7.2 Self‐tailored TVT‐O vs TVT‐O | 1 | 156 | Mean Difference (IV, Fixed, 95% CI) | ‐13.00 [‐16.57, ‐13.43] |
| 7.3 Synthetic vs biological | 1 | 70 | Mean Difference (IV, Fixed, 95% CI) | ‐0.40 [‐0.92, 0.12] |
| 8 Length of hospital stay (days) Show forest plot | 2 | Mean Difference (IV, Fixed, 95% CI) | Subtotals only | |
| 8.1 TVT‐O + IS vs TVT‐O | 1 | 96 | Mean Difference (IV, Fixed, 95% CI) | 12.0 [8.91, 15.09] |
| 8.2 Self‐tailored TVT‐O vs TVT‐O | 1 | 156 | Mean Difference (IV, Fixed, 95% CI) | ‐3.0 [‐3.16, ‐2.84] |
| 9 Perioperative complications Show forest plot | 2 | Risk Ratio (M‐H, Fixed, 95% CI) | Subtotals only | |
| 9.1 Synthetic vs biological | 2 | 170 | Risk Ratio (M‐H, Fixed, 95% CI) | 0.0 [0.0, 0.0] |
| 10 Major vascular or visceral injury Show forest plot | 4 | Risk Ratio (M‐H, Fixed, 95% CI) | Subtotals only | |
| 10.1 TVT‐O + IS vs TVT‐O | 1 | 96 | Risk Ratio (M‐H, Fixed, 95% CI) | 0.72 [0.17, 3.04] |
| 10.2 Synthetic vs biological | 2 | 170 | Risk Ratio (M‐H, Fixed, 95% CI) | 0.0 [0.0, 0.0] |
| 10.3 AdjustableTOT vs TOT® | 1 | 96 | Risk Ratio (M‐H, Fixed, 95% CI) | 0.0 [0.0, 0.0] |
| 11 Bladder/urethral perforation Show forest plot | 4 | Risk Ratio (M‐H, Fixed, 95% CI) | Subtotals only | |
| 11.1 TVT‐O + IS vs TVT‐O | 1 | 96 | Risk Ratio (M‐H, Fixed, 95% CI) | 0.0 [0.0, 0.0] |
| 11.2 TOT + 2‐point tape fixation vs TOT | 1 | 463 | Risk Ratio (M‐H, Fixed, 95% CI) | 0.75 [0.17, 3.33] |
| 11.3 TVT versus modified TVT (suburethral pad) | 1 | 248 | Risk Ratio (M‐H, Fixed, 95% CI) | 0.49 [0.05, 5.36] |
| 11.4 AdjustableTOT vs TOT® | 1 | 96 | Risk Ratio (M‐H, Fixed, 95% CI) | 0.0 [0.0, 0.0] |
| 12 Voiding dysfunction Show forest plot | 6 | Risk Ratio (M‐H, Fixed, 95% CI) | Subtotals only | |
| 12.1 Modified TVT‐O (less dissection) vs TVT‐O | 1 | 72 | Risk Ratio (M‐H, Fixed, 95% CI) | 2.0 [0.13, 30.61] |
| 12.2 TVT versus modified TVT (suburethral pad) | 1 | 248 | Risk Ratio (M‐H, Fixed, 95% CI) | 2.21 [0.70, 7.00] |
| 12.3 Self‐tailored TVT‐O vs TVT‐O | 1 | 156 | Risk Ratio (M‐H, Fixed, 95% CI) | 0.95 [0.06, 14.92] |
| 12.4 Monarc®TOT open edge + tension suture vs TOT® | 1 | 93 | Risk Ratio (M‐H, Fixed, 95% CI) | 0.47 [0.04, 4.99] |
| 12.5 Synthetic vs biological | 2 | 170 | Risk Ratio (M‐H, Fixed, 95% CI) | 5.0 [0.25, 101.58] |
| 13 De novo urgency or urgency incontinence Show forest plot | 1 | Risk Ratio (M‐H, Fixed, 95% CI) | Subtotals only | |
| 13.1 Modified TVT‐O (short tape) vs TVT‐O | 1 | 170 | Risk Ratio (M‐H, Fixed, 95% CI) | 1.22 [0.51, 2.94] |
| 14 Vaginal tape erosion Show forest plot | 6 | Risk Ratio (M‐H, Fixed, 95% CI) | Subtotals only | |
| 14.1 Modified TVT‐O (short tape) vs TVT‐O | 1 | 170 | Risk Ratio (M‐H, Fixed, 95% CI) | 0.33 [0.01, 7.88] |
| 14.2 TVT versus modified TVT (suburethral pad) | 1 | 248 | Risk Ratio (M‐H, Fixed, 95% CI) | 2.30 [0.61, 8.68] |
| 14.3 TVT‐O + IS vs TVT‐O | 1 | 93 | Risk Ratio (M‐H, Fixed, 95% CI) | 0.94 [0.06, 14.55] |
| 14.4 Monarc®TOT open edge + tension suture vs TOT® | 1 | 93 | Risk Ratio (M‐H, Fixed, 95% CI) | 0.13 [0.01, 2.53] |
| 14.5 Synthetic vs biological | 2 | 169 | Risk Ratio (M‐H, Fixed, 95% CI) | 3.0 [0.13, 71.92] |
| 15 Bladder/urethral erosion Show forest plot | 1 | Risk Ratio (M‐H, Fixed, 95% CI) | Subtotals only | |
| 15.1 TVT versus modified TVT (suburethral pad) | 1 | 248 | Risk Ratio (M‐H, Fixed, 95% CI) | 0.98 [0.06, 15.56] |
| 16 Groin pain Show forest plot | 2 | Risk Ratio (M‐H, Fixed, 95% CI) | Subtotals only | |
| 16.1 Modified TVT‐O (short tape) vs TVT‐O | 1 | 170 | Risk Ratio (M‐H, Fixed, 95% CI) | 1.30 [0.30, 5.64] |
| 16.2 Synthetic vs biological | 1 | 69 | Risk Ratio (M‐H, Fixed, 95% CI) | 0.0 [0.0, 0.0] |
| Outcome or subgroup title | No. of studies | No. of participants | Statistical method | Effect size |
| 1 Subjective cure (short term, ≤ 1 year) Show forest plot | 4 | Risk Ratio (M‐H, Fixed, 95% CI) | Subtotals only | |
| 1.1 Monofilament versus multifilament | 4 | 546 | Risk Ratio (M‐H, Fixed, 95% CI) | 1.03 [0.95, 1.10] |
| 1.2 Monofilament versus combined monofilament and biological | 1 | 96 | Risk Ratio (M‐H, Fixed, 95% CI) | 0.91 [0.79, 1.05] |
| 1.3 Combined monofilament and biological vs multifilament | 1 | 96 | Risk Ratio (M‐H, Fixed, 95% CI) | 1.10 [0.96, 1.26] |
| 2 Subjective cure (medium term, 1 to 5 years) Show forest plot | 1 | Risk Ratio (M‐H, Fixed, 95% CI) | Subtotals only | |
| 2.1 Monofilament vs multifilament | 1 | 96 | Risk Ratio (M‐H, Fixed, 95% CI) | 1.03 [0.85, 1.23] |
| 2.2 Monofilament vs combined monofilament and biological | 1 | 96 | Risk Ratio (M‐H, Fixed, 95% CI) | 0.91 [0.78, 1.06] |
| 2.3 Combined monofilament and biological vs multifilament | 1 | 96 | Risk Ratio (M‐H, Fixed, 95% CI) | 1.13 [0.96, 1.32] |
| 3 Objective cure (short term, ≤ 1 year) Show forest plot | 2 | Risk Ratio (M‐H, Fixed, 95% CI) | Subtotals only | |
| 3.1 Monofilament vs multifilament | 2 | 349 | Risk Ratio (M‐H, Fixed, 95% CI) | 1.07 [0.96, 1.19] |
| 4 Operative time (minutes) Show forest plot | 1 | Mean Difference (IV, Fixed, 95% CI) | Totals not selected | |
| 4.1 Monofilament vs multifilament | 1 | Mean Difference (IV, Fixed, 95% CI) | 0.0 [0.0, 0.0] | |
| 5 Length of hospital stay (days) Show forest plot | 1 | Mean Difference (IV, Fixed, 95% CI) | Totals not selected | |
| 5.1 Monofilament vs multifilament | 1 | Mean Difference (IV, Fixed, 95% CI) | 0.0 [0.0, 0.0] | |
| 6 Perioperative complications Show forest plot | 2 | Risk Ratio (M‐H, Fixed, 95% CI) | Subtotals only | |
| 6.1 Monofilament vs multifilament | 2 | 279 | Risk Ratio (M‐H, Fixed, 95% CI) | 1.16 [0.36, 3.69] |
| 7 Major vascular or visceral injury Show forest plot | 1 | Risk Ratio (M‐H, Fixed, 95% CI) | Subtotals only | |
| 7.1 Monofilament vs multifilament | 1 | 96 | Risk Ratio (M‐H, Fixed, 95% CI) | 0.0 [0.0, 0.0] |
| 7.2 Monofilament vs combined monofilament and biological | 1 | 96 | Risk Ratio (M‐H, Fixed, 95% CI) | 0.0 [0.0, 0.0] |
| 7.3 Combined monofilament and biological vs multifilament | 1 | 96 | Risk Ratio (M‐H, Fixed, 95% CI) | 0.0 [0.0, 0.0] |
| 8 Bladder or urethral perforation Show forest plot | 4 | 749 | Risk Ratio (M‐H, Fixed, 95% CI) | 1.15 [0.49, 2.70] |
| 8.1 Monofilament vs multifilament | 4 | 557 | Risk Ratio (M‐H, Fixed, 95% CI) | 1.15 [0.49, 2.70] |
| 8.2 Monofilament vs combined monofilament and biological | 1 | 96 | Risk Ratio (M‐H, Fixed, 95% CI) | 0.0 [0.0, 0.0] |
| 8.3 Combined monofilament and biological vs multifilament | 1 | 96 | Risk Ratio (M‐H, Fixed, 95% CI) | 0.0 [0.0, 0.0] |
| 9 Voiding dysfunction Show forest plot | 3 | Risk Ratio (M‐H, Fixed, 95% CI) | Subtotals only | |
| 9.1 Monofilament vs multifilament | 3 | 461 | Risk Ratio (M‐H, Fixed, 95% CI) | 2.10 [0.96, 4.59] |
| 10 De novo urgency or urgency incontinence Show forest plot | 4 | Risk Ratio (M‐H, Fixed, 95% CI) | Subtotals only | |
| 10.1 Monofilament vs multifilament | 4 | 545 | Risk Ratio (M‐H, Fixed, 95% CI) | 1.11 [0.68, 1.82] |
| 10.2 Monofilament vs combined monofilament and biological | 1 | 96 | Risk Ratio (M‐H, Fixed, 95% CI) | 2.0 [0.38, 10.41] |
| 10.3 Combined monofilament and biological vs multifilament | 1 | 96 | Risk Ratio (M‐H, Fixed, 95% CI) | 0.4 [0.08, 1.96] |
| 11 Detrusor overactivity Show forest plot | 1 | Risk Ratio (M‐H, Fixed, 95% CI) | Totals not selected | |
| 11.1 Monofilament vs multifilament | 1 | Risk Ratio (M‐H, Fixed, 95% CI) | 0.0 [0.0, 0.0] | |
| 12 Vaginal tape erosion Show forest plot | 3 | Risk Ratio (M‐H, Random, 95% CI) | Subtotals only | |
| 12.1 Monofilament vs multifilament | 3 | 445 | Risk Ratio (M‐H, Random, 95% CI) | 0.79 [0.09, 6.84] |
| 12.2 Monofilament vs combined monofilament and biological | 1 | 96 | Risk Ratio (M‐H, Random, 95% CI) | 3.0 [0.32, 27.83] |
| 12.3 Combined monofilament and biological vs multifilament | 1 | 96 | Risk Ratio (M‐H, Random, 95% CI) | 0.33 [0.04, 3.09] |
| 13 QoL specific (ICIQ) Show forest plot | 1 | Mean Difference (IV, Fixed, 95% CI) | Subtotals only | |
| 13.1 Monofilament vs multifilament | 1 | 96 | Mean Difference (IV, Fixed, 95% CI) | ‐0.60 [‐0.76, ‐0.44] |