Agentes antiinflamatorios no esteroides para el resfriado común
Referencias
Referencias de los estudios incluidos en esta revisión
Referencias de los estudios excluidos de esta revisión
Referencias adicionales
Referencias de otras versiones publicadas de esta revisión
Characteristics of studies
Characteristics of included studies [author‐defined order]
Ir a:
| Methods | Double‐blind, placebo‐controlled, experimental colds | |
| Participants | 59 inoculated; 42 colds. Mean age 20.1 years, 43.3% women, university students | |
| Interventions | 2 groups: aspirin 4 g/day and ibuprofen 1.2 g/day for 7 days | |
| Outcomes | The proportion of nasal obstruction score > 5 in the aspirin group (6/15) significantly differed from that in the placebo group (0/14, P value < 0.05) | |
| Notes | — | |
| Risk of bias | ||
| Bias | Authors' judgement | Support for judgement |
| Random sequence generation (selection bias) | Unclear risk | "... a randomised double‐blind, placebo‐controlled clinical trial" |
| Allocation concealment (selection bias) | Unclear risk | Insufficient information to permit judgement |
| Blinding (performance bias and detection bias) | Low risk | "... identical capsules containing aspirin (500 mg), ibuprofen (200 mg) or placebo" Comment: probably done |
| Incomplete outcome data (attrition bias) | Low risk | "... 4 volunteers who were considered uninfected and were excluded from further analyses" Comment: probably done |
| Selective reporting (reporting bias) | Unclear risk | No protocol, no convincing text |
| Other bias | Low risk | The study appears to be free of other sources of bias |
| Methods | Double‐blind, placebo‐controlled, natural colds | |
| Participants | 174 adults, age 18 to 65 years, 35% women, 23 outpatients facilities, URTI onset 2 days or less | |
| Interventions | Loxoprofen 60 mg 2 times for 7 days | |
| Outcomes | Duration of illness; the number of days with limited daily activities was not significantly different between groups | |
| Notes | The primary outcome was duration of illness in days | |
| Risk of bias | ||
| Bias | Authors' judgement | Support for judgement |
| Random sequence generation (selection bias) | Low risk | "Randomisation was based on simple computer‐generated random digits" Comment: probably done |
| Allocation concealment (selection bias) | Low risk | "... self‐drawing a sealed opaque envelope in the physician's sight....the correspondence between the digits and the group assignment was held in the central, secured location by a third party independent of the investigators until data collection was completed. Thus, allocation was concealed and masked from both patients and physicians" Comment: probably done |
| Blinding (performance bias and detection bias) | Low risk | "A double‐blind, randomised, placebo‐controlled trial"; "those in the control group were to take a placebo which was quite similar to active loxoprofen in shape and taste" Comment: probably done |
| Incomplete outcome data (attrition bias) | Low risk | "... six (two in loxoprofen group and four in placebo group) withdrew from the study, because two patients (one in loxoprofen and another in placebo) did not complete the diary; three patients (one in loxoprofen and the others in placebo) did not return the diary; and one patient (placebo) decided not to continue the study after the allocation. We excluded nine more participants (two in loxoprofen and seven in placebo) from analyses" Comment: probably done (missing outcome data balanced in numbers across intervention groups, with similar reasons for missing data across groups) |
| Selective reporting (reporting bias) | Unclear risk | No protocol, no convincing text |
| Other bias | Low risk | The study appears to be free of other sources of bias |
| Methods | Double‐blind, head‐to‐head comparison, natural colds | |
| Participants | 184 adults, mean age, sex not reported for the subgroup of colds, 29 centres, outpatient departments of hospitals and clinics, URTI onset ≤ 3 days | |
| Interventions | 2 groups: ketoprofen 50 mg 3 times and aspirin 500 mg 3 times for 3 days | |
| Outcomes | No significant difference in FGIR between 2 groups | |
| Notes | No available data on adverse effects for the subgroup of common colds | |
| Risk of bias | ||
| Bias | Authors' judgement | Support for judgement |
| Random sequence generation (selection bias) | Unclear risk | Comment: insufficient information about the sequence generation process |
| Allocation concealment (selection bias) | Low risk | "... randomisation process was done by two controllers and key codes were kept by controllers (in Japanese)" Comment: probably done |
| Blinding (performance bias and detection bias) | Low risk | "... double‐blind method...active drug capsule and aspirin capsule were quite similar in shape (in Japanese)" Comment: probably done |
| Incomplete outcome data (attrition bias) | Low risk | "91/93 cases in ketoprofen group and 89/91 cases in aspirin group were finally analyzed" Number of withdrawals was too small to make any important difference to the estimated intervention effect Comment: probably done |
| Selective reporting (reporting bias) | Unclear risk | No protocol, no convincing text |
| Other bias | Low risk | The study appears to be free of other sources of bias |
| Methods | Double‐blind, double‐dummy, head‐to‐head comparison, natural colds | |
| Participants | 167 adults, mean age, sex not reported for the subgroup of colds, 32 centres, outpatient departments of hospitals and clinics, moderate to severe URTI, not requiring antibiotics | |
| Interventions | 2 groups: loxoprofen 180 mg/day and ibuprofen 600 mg for 3 days | |
| Outcomes | No significant difference in FGIR between 2 groups | |
| Notes | No available data on adverse effects for the subgroup of common colds | |
| Risk of bias | ||
| Bias | Authors' judgement | Support for judgement |
| Random sequence generation (selection bias) | Unclear risk | "... were randomly assigned to receive" Comment: insufficient information about the sequence generation process |
| Allocation concealment (selection bias) | Unclear risk | Comment: insufficient information about the allocation concealment |
| Blinding (performance bias and detection bias) | Low risk | "... double‐blind, double‐dummy method...active drug and placebo were quite similar in shape (in Japanese)" Comment: probably done |
| Incomplete outcome data (attrition bias) | Unclear risk | "112/130 of the CS‐600 group and 113/132 group were evaluated in the assessment improvement ratings" Comment: there are no reasons for missing participants. Insufficient reporting of attrition/exclusions to permit judgement |
| Selective reporting (reporting bias) | Unclear risk | No protocol, no convincing text |
| Other bias | Low risk | The study appears to be free of other sources of bias |
| Methods | Double‐blind, head‐to‐head comparison, natural colds | |
| Participants | 222 adults, sex not reported for the subgroup of colds, 51 centres, outpatient departments of hospitals and clinics, URTI onset ≤ 2 days and fever ≤ 39 °C | |
| Interventions | 2 groups: fentiazac 300 mg/day and ibuprofen 600 mg/day for 3 days | |
| Outcomes | Moderate to marked improvement of FGIR was more frequent in the fenoprofen group than the placebo (P value < 0.05) | |
| Notes | No available data on adverse effects for the subgroup of common colds | |
| Risk of bias | ||
| Bias | Authors' judgement | Support for judgement |
| Random sequence generation (selection bias) | Unclear risk | Comment: insufficient information about the sequence generation process |
| Allocation concealment (selection bias) | Low risk | "... randomisation process was done by two controllers and key codes were kept by controllers (in Japanese)" |
| Blinding (performance bias and detection bias) | Low risk | "... double‐blind, double‐dummy method...active drug and placebo were quite similar in shape (in Japanese)" Comment: probably done |
| Incomplete outcome data (attrition bias) | Low risk | "243 out of 244 patients were analyzed after the elimination of 1 drop‐out case" Comment: number of withdrawals was too small to make any important difference to the estimated intervention effect Comment: probably done |
| Selective reporting (reporting bias) | Unclear risk | No protocol, no convincing text |
| Other bias | Low risk | The study appears to be free of other sources of bias |
| Methods | Double‐blind, placebo‐controlled, natural colds | |
| Participants | 64 adults, age range 18 to 60 years, 75% women, single family centre, fever ≤ 37.8 °C with moderate pain due to malaise/aches | |
| Interventions | Fenoprofen 200 mg single dose | |
| Outcomes | No available data on efficacy | |
| Notes | Only 2 adverse effects (1 stomach discomfort and 1 drowsiness), both in the fenoprofen group | |
| Risk of bias | ||
| Bias | Authors' judgement | Support for judgement |
| Random sequence generation (selection bias) | Low risk | "... assigned to one of three treatment groups via a computer‐generated random table" |
| Allocation concealment (selection bias) | Low risk | "Each dose of medication was dispensed in identically appearing capsules" Single oral dose was given Comment: probably done |
| Blinding (performance bias and detection bias) | Low risk | "Each dose of medication was dispensed in identically appearing capsules in double‐blind method" Single oral dose was given Comment: probably done |
| Incomplete outcome data (attrition bias) | Low risk | All participants who entered the study completed treatment and were included in the assessment of effectiveness and side effects |
| Selective reporting (reporting bias) | Unclear risk | No protocol, no convincing text |
| Other bias | Low risk | The study appears to be free of other sources of bias |
| Methods | Double‐blind, placebo‐controlled, experimental colds | |
| Participants | 40 inoculated, 31 colds, mean age 21 years, 39.1% women, setting not reported, fever ≤ 37.7 °C | |
| Interventions | Ibuprofen 200 mg, 2 doses for the first day and 4 doses for the subsequent 4 days | |
| Outcomes | 4‐point scale. Moderate to marked severity (2‐ to 3‐point) was reduced in the ibuprofen group (18% versus 29%) but statistical significance was not reported | |
| Notes | Adverse effects were slightly more frequent in the ibuprofen group (6/23) than in the control group (4/23) | |
| Risk of bias | ||
| Bias | Authors' judgement | Support for judgement |
| Random sequence generation (selection bias) | Unclear risk | "... were randomly assigned to receive" Comment: insufficient information about the sequence generation process |
| Allocation concealment (selection bias) | Unclear risk | Comment: insufficient information about the allocation concealment |
| Blinding (performance bias and detection bias) | Low risk | "... two identically appearing capsules" Comment: probably done |
| Incomplete outcome data (attrition bias) | Low risk | Among 58 inoculated participants, 8 were excluded (7 not infected, 1 infected with wild type virus), 1 was withdrawn |
| Selective reporting (reporting bias) | Unclear risk | No protocol, no convincing text |
| Other bias | Low risk | The study appears to be free of other sources of bias |
| Methods | Double‐blind, placebo‐controlled, experimental colds | |
| Participants | 79 inoculated (first cohort 34, second cohort 24 and third cohort 21); 56 colds. Mean age 21.4 years, 52% women. Setting not reported | |
| Interventions | For first cohort, naproxen loading dose of 400 mg followed by 200 mg 3 times daily, and for second and third cohort, naproxen loading dose of 500 mg followed by 500 mg 3 times daily for 5 days | |
| Outcomes | 5‐point symptom score. Total cumulative 5‐day score for headache was lower in the naproxen group (0.5 versus 2.5, P value < 0.001) | |
| Notes | 1 in the naproxen group and 2 in the placebo group experienced gastrointestinal complaints | |
| Risk of bias | ||
| Bias | Authors' judgement | Support for judgement |
| Random sequence generation (selection bias) | Unclear risk | "Participants were randomly assigned to receive..." Comment: insufficient information about the sequence generation process |
| Allocation concealment (selection bias) | Unclear risk | Comment: insufficient information about the allocation concealment |
| Blinding (performance bias and detection bias) | Low risk | "The study drug and placebo were supplied in identically appearing capsules" Comment: probably done |
| Incomplete outcome data (attrition bias) | Low risk | "Among 87 volunteers completed, 79 were considered evaluable" The reason for exclusion (infected with wild type rhinovirus, not infected, missed dose of study drug) is unlikely to be related to the outcome of the trial (symptomatic improvement of common cold symptoms) Comment: probably done |
| Selective reporting (reporting bias) | Unclear risk | No protocol, no convincing text |
| Other bias | Low risk | The study appears to be free of other sources of bias |
| Methods | Double‐blind, placebo‐controlled, natural colds | |
| Participants | 80 adults, mean age 30.1 years, 60% women, single centre, medical students and members of the staff at the university | |
| Interventions | Ibuprofen 400 mg 3 times for 3 days | |
| Outcomes | 4‐point symptom score by patients. Sneezing, earache, headache, and pain in muscles and joints were significantly reduced in the ibuprofen group compared with the placebo group. Number of sneezing episodes was also reduced (21.33 ± 3.3 and 12.44 ± 1.5, P value = 0.02) | |
| Notes | No adverse effects in either group | |
| Risk of bias | ||
| Bias | Authors' judgement | Support for judgement |
| Random sequence generation (selection bias) | Unclear risk | "... randomised study of two parallel groups" Comment: insufficient information about the sequence generation process |
| Allocation concealment (selection bias) | Unclear risk | Comment: insufficient information about the allocation concealment |
| Blinding (performance bias and detection bias) | Low risk | "Coded vials with ibuprofen and placebo tablets were provided by Benzon Pharma" Comment: probably done |
| Incomplete outcome data (attrition bias) | Low risk | "All patients who entered the study completed treatment and were included in the assessment of effectiveness and side effects" Comment: probably done |
| Selective reporting (reporting bias) | Unclear risk | No protocol, no convincing text |
| Other bias | Unclear risk | No data on baseline imbalance |
CI: confidence interval
FGIR: final global improvement rating
SD: standard deviation
SE: standard error
URTI: upper respiratory tract infection
Characteristics of excluded studies [ordered by study ID]
Ir a:
| Study | Reason for exclusion |
| Not common cold | |
| Not common cold | |
| Not common cold | |
| Febrile URTI | |
| Not common cold | |
| Not common cold | |
| Not common cold | |
| Not common cold | |
| Not common cold | |
| Not common cold | |
| Not common cold | |
| Not common cold | |
| Not common cold | |
| Not common cold | |
| Not common cold | |
| Not common cold | |
| Not randomised | |
| Not common cold | |
| Not common cold | |
| Not common cold | |
| Not common cold | |
| Not common cold | |
| Not common cold | |
| Randomisation is not clear | |
| Not common cold | |
| Not common cold | |
| Not common cold | |
| Randomisation is not clear | |
| Not common cold | |
| Not common cold | |
| Not common cold | |
| Not common cold | |
| Not common cold | |
| Not common cold | |
| Not common cold | |
| Not common cold | |
| Not common cold | |
| Not common cold | |
| Not common cold | |
| Not common cold | |
| Not common cold | |
| Not common cold | |
| Not common cold | |
| Not common cold | |
| Not common cold | |
| Not common cold | |
| Randomisation is not clear | |
| Not common cold | |
| Not common cold | |
| Not common cold | |
| Not common cold |
URTI: upper respiratory tract infection
Data and analyses
| Outcome or subgroup title | No. of studies | No. of participants | Statistical method | Effect size |
| 1 Sum of overall symptom score (random‐effects model) Show forest plot | 3 | 293 | Std. Mean Difference (IV, Random, 95% CI) | ‐0.40 [‐1.03, 0.24] |
| Analysis 1.1  Comparison 1 NSAIDs versus placebo, global effect, Outcome 1 Sum of overall symptom score (random‐effects model). | ||||
| 2 Moderate to marked severity Show forest plot | 1 | 40 | Risk Ratio (M‐H, Fixed, 95% CI) | 0.61 [0.18, 2.11] |
| Analysis 1.2  Comparison 1 NSAIDs versus placebo, global effect, Outcome 2 Moderate to marked severity. | ||||
| 3 Duration of colds (random‐effects model) Show forest plot | 2 | 214 | Mean Difference (IV, Random, 95% CI) | ‐0.23 [‐1.75, 1.29] |
| Analysis 1.3  Comparison 1 NSAIDs versus placebo, global effect, Outcome 3 Duration of colds (random‐effects model). | ||||
| 4 Duration of restriction of daily activities Show forest plot | 1 | 174 | Mean Difference (IV, Fixed, 95% CI) | ‐0.56 [‐1.24, 0.12] |
| Analysis 1.4  Comparison 1 NSAIDs versus placebo, global effect, Outcome 4 Duration of restriction of daily activities. | ||||
| Outcome or subgroup title | No. of studies | No. of participants | Statistical method | Effect size |
| 1 Throat irritation score (fixed‐effect model) Show forest plot | 2 | 159 | Std. Mean Difference (IV, Fixed, 95% CI) | ‐0.01 [‐0.33, 0.30] |
| Analysis 2.1  Comparison 2 NSAIDs versus placebo, analgesic effect, Outcome 1 Throat irritation score (fixed‐effect model). | ||||
| 2 Headache score (random‐effects model) Show forest plot | 2 | 159 | Std. Mean Difference (IV, Random, 95% CI) | ‐0.65 [‐1.11, ‐0.19] |
| Analysis 2.2  Comparison 2 NSAIDs versus placebo, analgesic effect, Outcome 2 Headache score (random‐effects model). | ||||
| 3 Score of pain in muscles/joints score (fixed‐effect model) Show forest plot | 2 | 114 | Std. Mean Difference (IV, Fixed, 95% CI) | ‐0.40 [‐0.77, ‐0.03] |
| Analysis 2.3  Comparison 2 NSAIDs versus placebo, analgesic effect, Outcome 3 Score of pain in muscles/joints score (fixed‐effect model). | ||||
| 4 Malaise score (fixed‐effect model) Show forest plot | 2 | 159 | Std. Mean Difference (IV, Fixed, 95% CI) | ‐0.29 [‐0.60, 0.03] |
| Analysis 2.4  Comparison 2 NSAIDs versus placebo, analgesic effect, Outcome 4 Malaise score (fixed‐effect model). | ||||
| 5 Chilliness score (random‐effects model) Show forest plot | 2 | 159 | Std. Mean Difference (IV, Random, 95% CI) | ‐0.03 [‐1.12, 1.06] |
| Analysis 2.5  Comparison 2 NSAIDs versus placebo, analgesic effect, Outcome 5 Chilliness score (random‐effects model). | ||||
| 6 Nose irritation score Show forest plot | 1 | 80 | Std. Mean Difference (IV, Fixed, 95% CI) | ‐0.04 [‐0.48, 0.40] |
| Analysis 2.6  Comparison 2 NSAIDs versus placebo, analgesic effect, Outcome 6 Nose irritation score. | ||||
| 7 Score of pain on swallowing Show forest plot | 1 | 80 | Std. Mean Difference (IV, Fixed, 95% CI) | ‐0.07 [‐0.51, 0.37] |
| Analysis 2.7 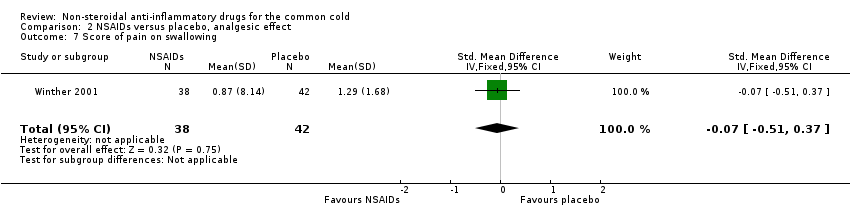 Comparison 2 NSAIDs versus placebo, analgesic effect, Outcome 7 Score of pain on swallowing. | ||||
| 8 Eye itching score Show forest plot | 1 | 80 | Std. Mean Difference (IV, Fixed, 95% CI) | ‐0.14 [‐0.58, 0.30] |
| Analysis 2.8  Comparison 2 NSAIDs versus placebo, analgesic effect, Outcome 8 Eye itching score. | ||||
| 9 Earache score Show forest plot | 1 | 80 | Std. Mean Difference (IV, Fixed, 95% CI) | ‐0.59 [‐1.04, ‐0.14] |
| Analysis 2.9  Comparison 2 NSAIDs versus placebo, analgesic effect, Outcome 9 Earache score. | ||||
| Outcome or subgroup title | No. of studies | No. of participants | Statistical method | Effect size |
| 1 Cough score (random‐effects model) Show forest plot | 2 | 159 | Std. Mean Difference (IV, Random, 95% CI) | ‐0.05 [‐0.66, 0.56] |
| Analysis 3.1  Comparison 3 NSAIDs versus placebo, non‐analgesic effect, Outcome 1 Cough score (random‐effects model). | ||||
| 2 Sneezing score (fixed‐effect model) Show forest plot | 2 | 159 | Std. Mean Difference (IV, Fixed, 95% CI) | ‐0.44 [‐0.75, ‐0.12] |
| Analysis 3.2  Comparison 3 NSAIDs versus placebo, non‐analgesic effect, Outcome 2 Sneezing score (fixed‐effect model). | ||||
| 3 Total number of sneezes Show forest plot | 1 | 80 | Std. Mean Difference (IV, Fixed, 95% CI) | ‐0.51 [‐0.95, ‐0.06] |
| Analysis 3.3  Comparison 3 NSAIDs versus placebo, non‐analgesic effect, Outcome 3 Total number of sneezes. | ||||
| 4 Rhinorrhoea score (fixed‐effect model) Show forest plot | 3 | 199 | Std. Mean Difference (IV, Fixed, 95% CI) | 0.03 [‐0.25, 0.30] |
| Analysis 3.4  Comparison 3 NSAIDs versus placebo, non‐analgesic effect, Outcome 4 Rhinorrhoea score (fixed‐effect model). | ||||
| 5 Nasal obstruction score (fixed‐effect model) Show forest plot | 3 | 199 | Std. Mean Difference (IV, Fixed, 95% CI) | ‐0.15 [‐0.43, 0.13] |
| Analysis 3.5 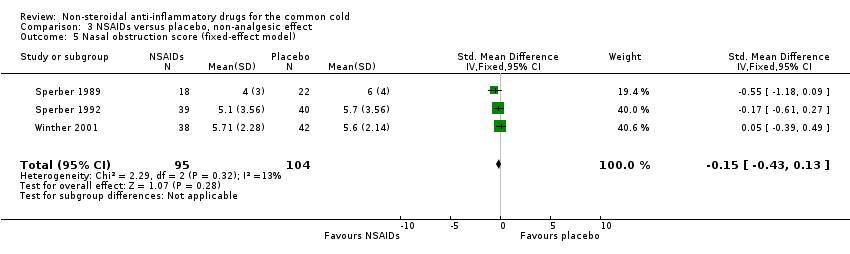 Comparison 3 NSAIDs versus placebo, non‐analgesic effect, Outcome 5 Nasal obstruction score (fixed‐effect model). | ||||
| 6 Nasal obstruction score > 5 Show forest plot | 1 | 27 | Risk Ratio (M‐H, Fixed, 95% CI) | 5.36 [0.28, 102.12] |
| Analysis 3.6 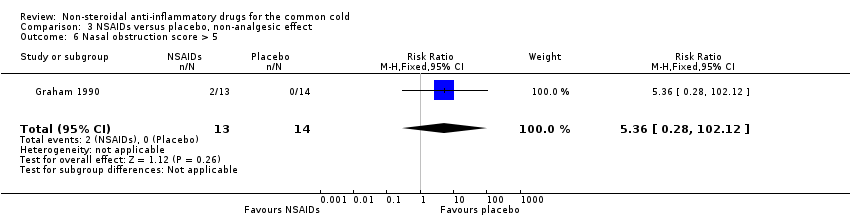 Comparison 3 NSAIDs versus placebo, non‐analgesic effect, Outcome 6 Nasal obstruction score > 5. | ||||
| 7 Total number of nose blows Show forest plot | 1 | 80 | Std. Mean Difference (IV, Fixed, 95% CI) | 0.17 [‐0.27, 0.61] |
| Analysis 3.7  Comparison 3 NSAIDs versus placebo, non‐analgesic effect, Outcome 7 Total number of nose blows. | ||||
| 8 Total mucus weight Show forest plot | 1 | 40 | Std. Mean Difference (IV, Fixed, 95% CI) | 0.13 [‐0.49, 0.76] |
| Analysis 3.8  Comparison 3 NSAIDs versus placebo, non‐analgesic effect, Outcome 8 Total mucus weight. | ||||
| 9 Total tissue number count Show forest plot | 1 | 40 | Std. Mean Difference (IV, Fixed, 95% CI) | ‐0.20 [‐0.83, 0.42] |
| Analysis 3.9 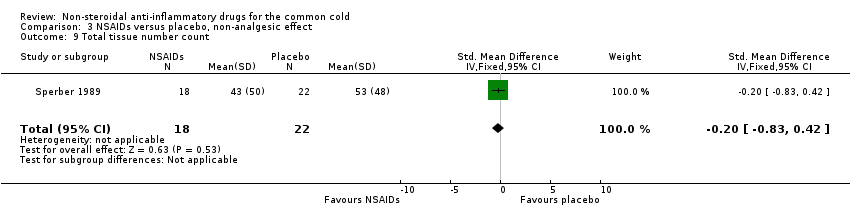 Comparison 3 NSAIDs versus placebo, non‐analgesic effect, Outcome 9 Total tissue number count. | ||||
| 10 Score of dryness in the nose Show forest plot | 1 | 80 | Std. Mean Difference (IV, Fixed, 95% CI) | 0.04 [‐0.40, 0.48] |
| Analysis 3.10  Comparison 3 NSAIDs versus placebo, non‐analgesic effect, Outcome 10 Score of dryness in the nose. | ||||
| 11 Score of reduced sense of smell Show forest plot | 1 | 80 | Std. Mean Difference (IV, Fixed, 95% CI) | 0.08 [‐0.36, 0.51] |
| Analysis 3.11  Comparison 3 NSAIDs versus placebo, non‐analgesic effect, Outcome 11 Score of reduced sense of smell. | ||||
| 12 Hoarseness score Show forest plot | 1 | 80 | Std. Mean Difference (IV, Fixed, 95% CI) | 0.32 [‐0.12, 0.76] |
| Analysis 3.12  Comparison 3 NSAIDs versus placebo, non‐analgesic effect, Outcome 12 Hoarseness score. | ||||
| 13 Fatigue score Show forest plot | 1 | 80 | Std. Mean Difference (IV, Fixed, 95% CI) | 0.18 [‐0.26, 0.62] |
| Analysis 3.13  Comparison 3 NSAIDs versus placebo, non‐analgesic effect, Outcome 13 Fatigue score. | ||||
| Outcome or subgroup title | No. of studies | No. of participants | Statistical method | Effect size |
| 1 Overall side effects (random‐effects model) Show forest plot | 2 | 220 | Risk Ratio (M‐H, Random, 95% CI) | 2.94 [0.51, 17.03] |
| Analysis 4.1  Comparison 4 NSAIDs versus placebo, adverse effects, Outcome 1 Overall side effects (random‐effects model). | ||||
| 2 GI complaint (fixed‐effect model) Show forest plot | 3 | 189 | Risk Ratio (M‐H, Fixed, 95% CI) | 0.76 [0.17, 3.32] |
| Analysis 4.2  Comparison 4 NSAIDs versus placebo, adverse effects, Outcome 2 GI complaint (fixed‐effect model). | ||||
| 3 Lethargy/drowsiness (fixed‐effect model) Show forest plot | 2 | 110 | Risk Ratio (M‐H, Fixed, 95% CI) | 1.0 [0.14, 6.91] |
| Analysis 4.3  Comparison 4 NSAIDs versus placebo, adverse effects, Outcome 3 Lethargy/drowsiness (fixed‐effect model). | ||||
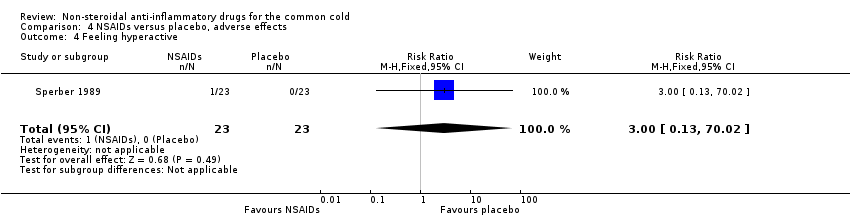
| 4 Feeling hyperactive Show forest plot | 1 | 46 | Risk Ratio (M‐H, Fixed, 95% CI) | 3.0 [0.13, 70.02] |
| Analysis 4.4  Comparison 4 NSAIDs versus placebo, adverse effects, Outcome 4 Feeling hyperactive. | ||||
| 5 Feeling more awake Show forest plot | 1 | 46 | Risk Ratio (M‐H, Fixed, 95% CI) | 3.0 [0.13, 70.02] |
| Analysis 4.5  Comparison 4 NSAIDs versus placebo, adverse effects, Outcome 5 Feeling more awake. | ||||
| 6 Flushed face Show forest plot | 1 | 46 | Risk Ratio (M‐H, Fixed, 95% CI) | 3.0 [0.13, 70.02] |
| Analysis 4.6 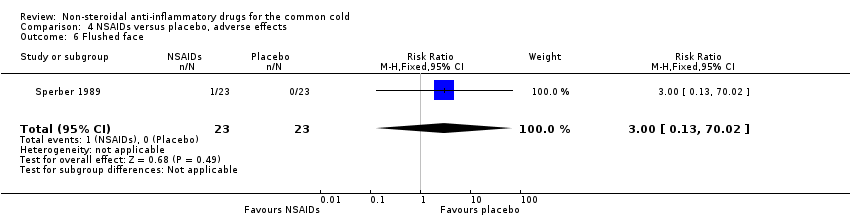 Comparison 4 NSAIDs versus placebo, adverse effects, Outcome 6 Flushed face. | ||||
| 7 Difficulty sleeping Show forest plot | 1 | 46 | Risk Ratio (M‐H, Fixed, 95% CI) | 0.33 [0.01, 7.78] |
| Analysis 4.7  Comparison 4 NSAIDs versus placebo, adverse effects, Outcome 7 Difficulty sleeping. | ||||
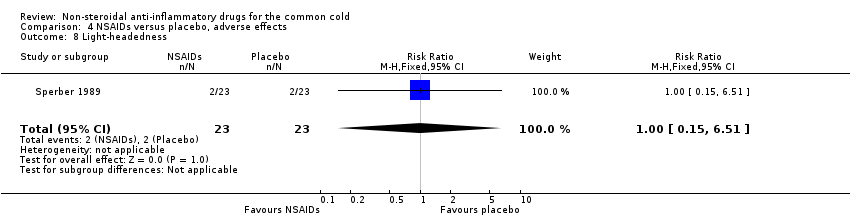
| 8 Light‐headedness Show forest plot | 1 | 46 | Risk Ratio (M‐H, Fixed, 95% CI) | 1.0 [0.15, 6.51] |
| Analysis 4.8  Comparison 4 NSAIDs versus placebo, adverse effects, Outcome 8 Light‐headedness. | ||||
| 9 Dry mouth Show forest plot | 1 | 46 | Risk Ratio (M‐H, Fixed, 95% CI) | 3.0 [0.13, 70.02] |
| Analysis 4.9  Comparison 4 NSAIDs versus placebo, adverse effects, Outcome 9 Dry mouth. | ||||
| Outcome or subgroup title | No. of studies | No. of participants | Statistical method | Effect size |
| 1 Global improvement rating, marked improvement (fixed‐effect model) Show forest plot | 2 | 365 | Risk Ratio (M‐H, Fixed, 95% CI) | 1.52 [0.99, 2.34] |
| Analysis 5.1 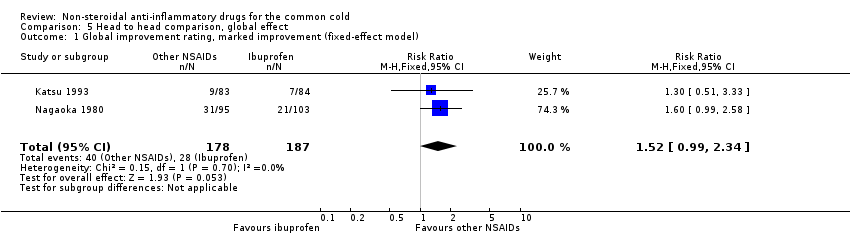 Comparison 5 Head to head comparison, global effect, Outcome 1 Global improvement rating, marked improvement (fixed‐effect model). | ||||
| 2 Global improvement rating, moderate to marked improvement (fixed‐effect model) Show forest plot | 2 | 365 | Risk Ratio (M‐H, Fixed, 95% CI) | 1.20 [1.02, 1.41] |
| Analysis 5.2  Comparison 5 Head to head comparison, global effect, Outcome 2 Global improvement rating, moderate to marked improvement (fixed‐effect model). | ||||
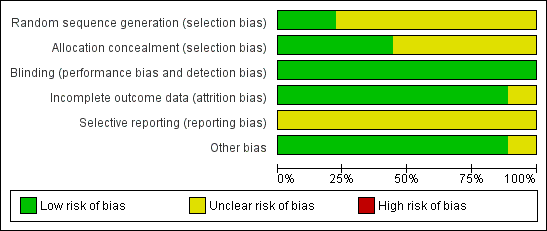
'Risk of bias' graph: review authors' judgements about each methodological quality item presented as percentages across all included studies
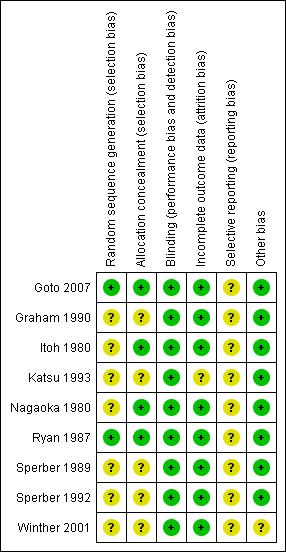
'Risk of bias' summary: review authors' judgements about each methodological quality item for each included study

Comparison 1 NSAIDs versus placebo, global effect, Outcome 1 Sum of overall symptom score (random‐effects model).

Comparison 1 NSAIDs versus placebo, global effect, Outcome 2 Moderate to marked severity.

Comparison 1 NSAIDs versus placebo, global effect, Outcome 3 Duration of colds (random‐effects model).
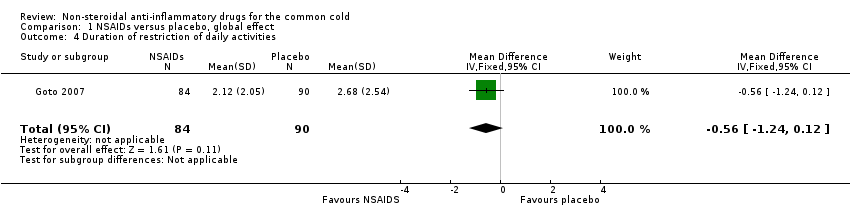
Comparison 1 NSAIDs versus placebo, global effect, Outcome 4 Duration of restriction of daily activities.

Comparison 2 NSAIDs versus placebo, analgesic effect, Outcome 1 Throat irritation score (fixed‐effect model).
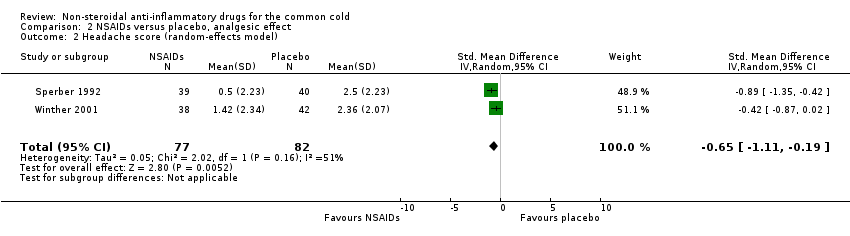
Comparison 2 NSAIDs versus placebo, analgesic effect, Outcome 2 Headache score (random‐effects model).

Comparison 2 NSAIDs versus placebo, analgesic effect, Outcome 3 Score of pain in muscles/joints score (fixed‐effect model).
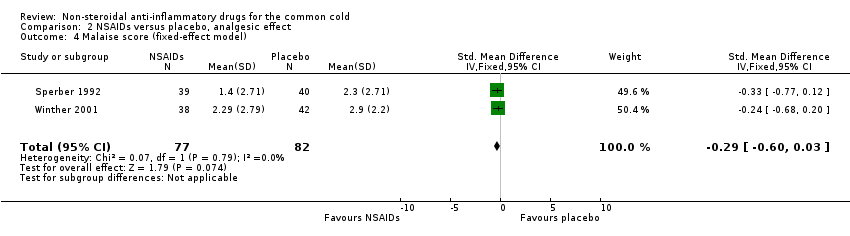
Comparison 2 NSAIDs versus placebo, analgesic effect, Outcome 4 Malaise score (fixed‐effect model).

Comparison 2 NSAIDs versus placebo, analgesic effect, Outcome 5 Chilliness score (random‐effects model).
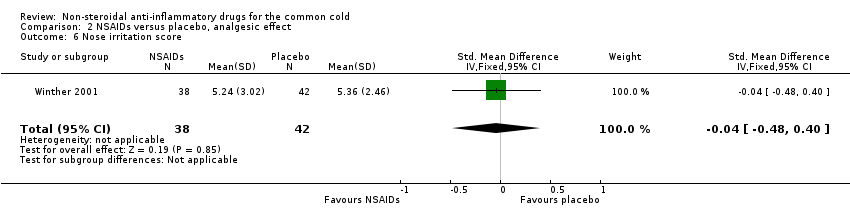
Comparison 2 NSAIDs versus placebo, analgesic effect, Outcome 6 Nose irritation score.

Comparison 2 NSAIDs versus placebo, analgesic effect, Outcome 7 Score of pain on swallowing.
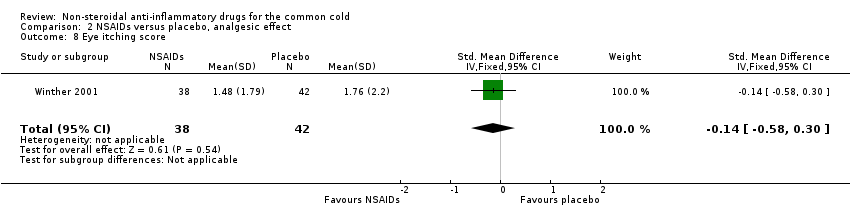
Comparison 2 NSAIDs versus placebo, analgesic effect, Outcome 8 Eye itching score.

Comparison 2 NSAIDs versus placebo, analgesic effect, Outcome 9 Earache score.
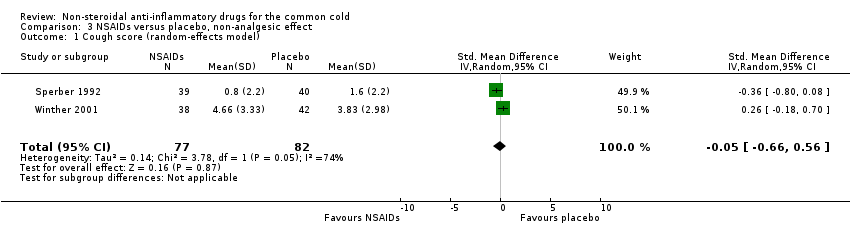
Comparison 3 NSAIDs versus placebo, non‐analgesic effect, Outcome 1 Cough score (random‐effects model).

Comparison 3 NSAIDs versus placebo, non‐analgesic effect, Outcome 2 Sneezing score (fixed‐effect model).

Comparison 3 NSAIDs versus placebo, non‐analgesic effect, Outcome 3 Total number of sneezes.
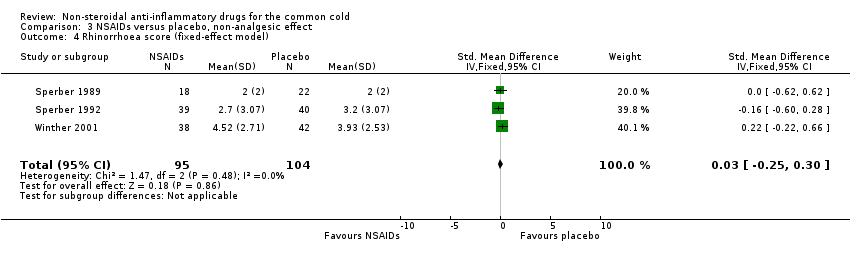
Comparison 3 NSAIDs versus placebo, non‐analgesic effect, Outcome 4 Rhinorrhoea score (fixed‐effect model).

Comparison 3 NSAIDs versus placebo, non‐analgesic effect, Outcome 5 Nasal obstruction score (fixed‐effect model).

Comparison 3 NSAIDs versus placebo, non‐analgesic effect, Outcome 6 Nasal obstruction score > 5.

Comparison 3 NSAIDs versus placebo, non‐analgesic effect, Outcome 7 Total number of nose blows.

Comparison 3 NSAIDs versus placebo, non‐analgesic effect, Outcome 8 Total mucus weight.

Comparison 3 NSAIDs versus placebo, non‐analgesic effect, Outcome 9 Total tissue number count.

Comparison 3 NSAIDs versus placebo, non‐analgesic effect, Outcome 10 Score of dryness in the nose.
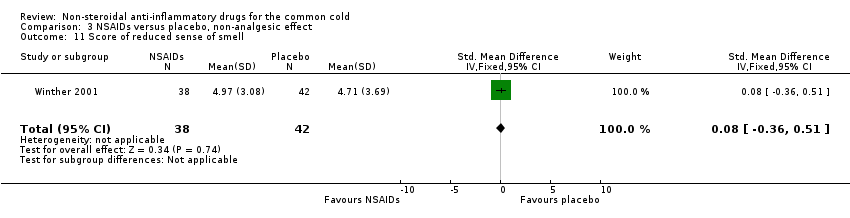
Comparison 3 NSAIDs versus placebo, non‐analgesic effect, Outcome 11 Score of reduced sense of smell.
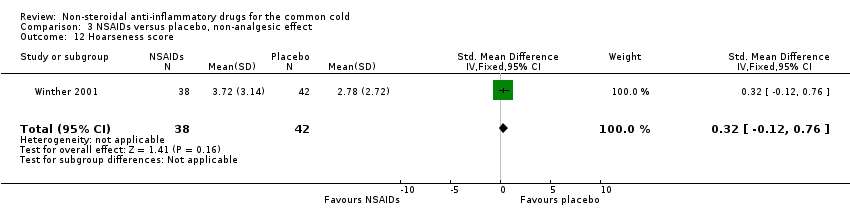
Comparison 3 NSAIDs versus placebo, non‐analgesic effect, Outcome 12 Hoarseness score.

Comparison 3 NSAIDs versus placebo, non‐analgesic effect, Outcome 13 Fatigue score.
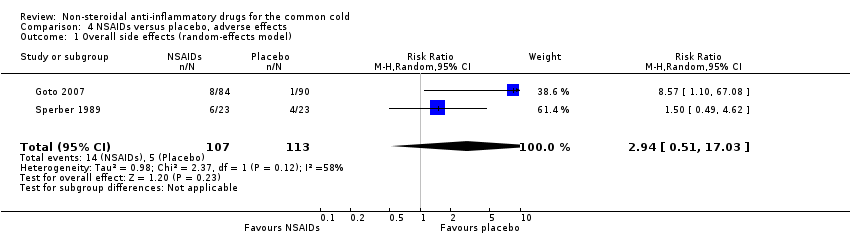
Comparison 4 NSAIDs versus placebo, adverse effects, Outcome 1 Overall side effects (random‐effects model).
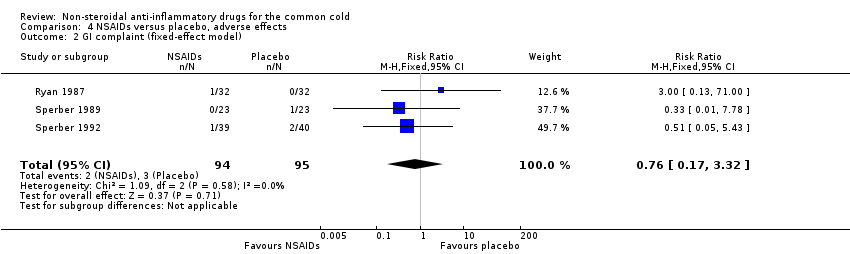
Comparison 4 NSAIDs versus placebo, adverse effects, Outcome 2 GI complaint (fixed‐effect model).
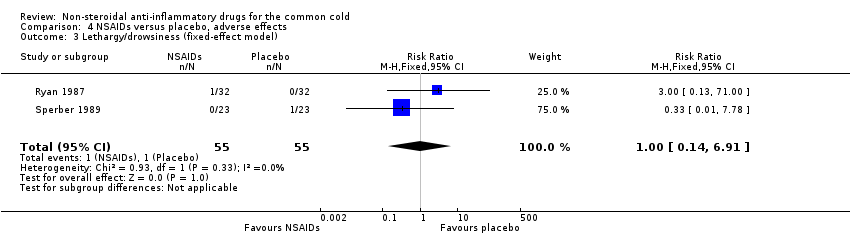
Comparison 4 NSAIDs versus placebo, adverse effects, Outcome 3 Lethargy/drowsiness (fixed‐effect model).
Comparison 4 NSAIDs versus placebo, adverse effects, Outcome 4 Feeling hyperactive.

Comparison 4 NSAIDs versus placebo, adverse effects, Outcome 5 Feeling more awake.

Comparison 4 NSAIDs versus placebo, adverse effects, Outcome 6 Flushed face.

Comparison 4 NSAIDs versus placebo, adverse effects, Outcome 7 Difficulty sleeping.
Comparison 4 NSAIDs versus placebo, adverse effects, Outcome 8 Light‐headedness.

Comparison 4 NSAIDs versus placebo, adverse effects, Outcome 9 Dry mouth.

Comparison 5 Head to head comparison, global effect, Outcome 1 Global improvement rating, marked improvement (fixed‐effect model).

Comparison 5 Head to head comparison, global effect, Outcome 2 Global improvement rating, moderate to marked improvement (fixed‐effect model).
| Non‐steroidal anti‐inflammatory drugs for the common cold | ||||||
| Patient or population: patients with common cold | ||||||
| Outcomes | Illustrative comparative risks* (95% CI) | Relative effect | No of participants | Quality of the evidence | Comments | |
| Assumed risk | Corresponding risk | |||||
| Control | Non‐steroidal anti‐inflammatory drugs | |||||
| Sum of overall symptom score | — | The mean sum of overall symptom score in the intervention groups was | — | 293 | ⊕⊕⊕⊝ | — |
| Duration of colds | — | The mean duration of colds in the intervention groups was | — | 214 | ⊕⊕⊕⊝ | — |
| Throat irritation score | — | The mean throat irritation score in the intervention groups was | — | 159 | ⊕⊕⊕⊝ | — |
| Headache score | — | The mean headache score in the intervention groups was | — | 159 | ⊕⊕⊕⊝ | — |
| Score of pain in muscles/joints score | — | The mean pain in muscles/joints score in the intervention groups was | — | 0 | See comment | — |
| Cough score | — | The mean cough score in the intervention groups was | — | 159 | ⊕⊕⊕⊝ | — |
| Rhinorrhoea score | — | The mean rhinorrhoea score in the intervention groups was | — | 199 | ⊕⊕⊕⊝ | — |
| *The basis for the assumed risk (e.g. the median control group risk across studies) is provided in footnotes. The corresponding risk (and its 95% confidence interval) is based on the assumed risk in the comparison group and the relative effect of the intervention (and its 95% CI). | ||||||
| GRADE Working Group grades of evidence | ||||||
| 1# NSAIDs group 141, placebo group 152. | ||||||
| Outcome or subgroup title | No. of studies | No. of participants | Statistical method | Effect size |
| 1 Sum of overall symptom score (random‐effects model) Show forest plot | 3 | 293 | Std. Mean Difference (IV, Random, 95% CI) | ‐0.40 [‐1.03, 0.24] |
| 2 Moderate to marked severity Show forest plot | 1 | 40 | Risk Ratio (M‐H, Fixed, 95% CI) | 0.61 [0.18, 2.11] |
| 3 Duration of colds (random‐effects model) Show forest plot | 2 | 214 | Mean Difference (IV, Random, 95% CI) | ‐0.23 [‐1.75, 1.29] |
| 4 Duration of restriction of daily activities Show forest plot | 1 | 174 | Mean Difference (IV, Fixed, 95% CI) | ‐0.56 [‐1.24, 0.12] |
| Outcome or subgroup title | No. of studies | No. of participants | Statistical method | Effect size |
| 1 Throat irritation score (fixed‐effect model) Show forest plot | 2 | 159 | Std. Mean Difference (IV, Fixed, 95% CI) | ‐0.01 [‐0.33, 0.30] |
| 2 Headache score (random‐effects model) Show forest plot | 2 | 159 | Std. Mean Difference (IV, Random, 95% CI) | ‐0.65 [‐1.11, ‐0.19] |
| 3 Score of pain in muscles/joints score (fixed‐effect model) Show forest plot | 2 | 114 | Std. Mean Difference (IV, Fixed, 95% CI) | ‐0.40 [‐0.77, ‐0.03] |
| 4 Malaise score (fixed‐effect model) Show forest plot | 2 | 159 | Std. Mean Difference (IV, Fixed, 95% CI) | ‐0.29 [‐0.60, 0.03] |
| 5 Chilliness score (random‐effects model) Show forest plot | 2 | 159 | Std. Mean Difference (IV, Random, 95% CI) | ‐0.03 [‐1.12, 1.06] |
| 6 Nose irritation score Show forest plot | 1 | 80 | Std. Mean Difference (IV, Fixed, 95% CI) | ‐0.04 [‐0.48, 0.40] |
| 7 Score of pain on swallowing Show forest plot | 1 | 80 | Std. Mean Difference (IV, Fixed, 95% CI) | ‐0.07 [‐0.51, 0.37] |
| 8 Eye itching score Show forest plot | 1 | 80 | Std. Mean Difference (IV, Fixed, 95% CI) | ‐0.14 [‐0.58, 0.30] |
| 9 Earache score Show forest plot | 1 | 80 | Std. Mean Difference (IV, Fixed, 95% CI) | ‐0.59 [‐1.04, ‐0.14] |
| Outcome or subgroup title | No. of studies | No. of participants | Statistical method | Effect size |
| 1 Cough score (random‐effects model) Show forest plot | 2 | 159 | Std. Mean Difference (IV, Random, 95% CI) | ‐0.05 [‐0.66, 0.56] |
| 2 Sneezing score (fixed‐effect model) Show forest plot | 2 | 159 | Std. Mean Difference (IV, Fixed, 95% CI) | ‐0.44 [‐0.75, ‐0.12] |
| 3 Total number of sneezes Show forest plot | 1 | 80 | Std. Mean Difference (IV, Fixed, 95% CI) | ‐0.51 [‐0.95, ‐0.06] |
| 4 Rhinorrhoea score (fixed‐effect model) Show forest plot | 3 | 199 | Std. Mean Difference (IV, Fixed, 95% CI) | 0.03 [‐0.25, 0.30] |
| 5 Nasal obstruction score (fixed‐effect model) Show forest plot | 3 | 199 | Std. Mean Difference (IV, Fixed, 95% CI) | ‐0.15 [‐0.43, 0.13] |
| 6 Nasal obstruction score > 5 Show forest plot | 1 | 27 | Risk Ratio (M‐H, Fixed, 95% CI) | 5.36 [0.28, 102.12] |
| 7 Total number of nose blows Show forest plot | 1 | 80 | Std. Mean Difference (IV, Fixed, 95% CI) | 0.17 [‐0.27, 0.61] |
| 8 Total mucus weight Show forest plot | 1 | 40 | Std. Mean Difference (IV, Fixed, 95% CI) | 0.13 [‐0.49, 0.76] |
| 9 Total tissue number count Show forest plot | 1 | 40 | Std. Mean Difference (IV, Fixed, 95% CI) | ‐0.20 [‐0.83, 0.42] |
| 10 Score of dryness in the nose Show forest plot | 1 | 80 | Std. Mean Difference (IV, Fixed, 95% CI) | 0.04 [‐0.40, 0.48] |
| 11 Score of reduced sense of smell Show forest plot | 1 | 80 | Std. Mean Difference (IV, Fixed, 95% CI) | 0.08 [‐0.36, 0.51] |
| 12 Hoarseness score Show forest plot | 1 | 80 | Std. Mean Difference (IV, Fixed, 95% CI) | 0.32 [‐0.12, 0.76] |
| 13 Fatigue score Show forest plot | 1 | 80 | Std. Mean Difference (IV, Fixed, 95% CI) | 0.18 [‐0.26, 0.62] |
| Outcome or subgroup title | No. of studies | No. of participants | Statistical method | Effect size |
| 1 Overall side effects (random‐effects model) Show forest plot | 2 | 220 | Risk Ratio (M‐H, Random, 95% CI) | 2.94 [0.51, 17.03] |
| 2 GI complaint (fixed‐effect model) Show forest plot | 3 | 189 | Risk Ratio (M‐H, Fixed, 95% CI) | 0.76 [0.17, 3.32] |
| 3 Lethargy/drowsiness (fixed‐effect model) Show forest plot | 2 | 110 | Risk Ratio (M‐H, Fixed, 95% CI) | 1.0 [0.14, 6.91] |
| 4 Feeling hyperactive Show forest plot | 1 | 46 | Risk Ratio (M‐H, Fixed, 95% CI) | 3.0 [0.13, 70.02] |
| 5 Feeling more awake Show forest plot | 1 | 46 | Risk Ratio (M‐H, Fixed, 95% CI) | 3.0 [0.13, 70.02] |
| 6 Flushed face Show forest plot | 1 | 46 | Risk Ratio (M‐H, Fixed, 95% CI) | 3.0 [0.13, 70.02] |
| 7 Difficulty sleeping Show forest plot | 1 | 46 | Risk Ratio (M‐H, Fixed, 95% CI) | 0.33 [0.01, 7.78] |
| 8 Light‐headedness Show forest plot | 1 | 46 | Risk Ratio (M‐H, Fixed, 95% CI) | 1.0 [0.15, 6.51] |
| 9 Dry mouth Show forest plot | 1 | 46 | Risk Ratio (M‐H, Fixed, 95% CI) | 3.0 [0.13, 70.02] |
| Outcome or subgroup title | No. of studies | No. of participants | Statistical method | Effect size |
| 1 Global improvement rating, marked improvement (fixed‐effect model) Show forest plot | 2 | 365 | Risk Ratio (M‐H, Fixed, 95% CI) | 1.52 [0.99, 2.34] |
| 2 Global improvement rating, moderate to marked improvement (fixed‐effect model) Show forest plot | 2 | 365 | Risk Ratio (M‐H, Fixed, 95% CI) | 1.20 [1.02, 1.41] |