Agentes antiinflamatorios no esteroides para el resfriado común
Información
- DOI:
- https://doi.org/10.1002/14651858.CD006362.pub4Copiar DOI

- Base de datos:
-
- Cochrane Database of Systematic Reviews
- Versión publicada:
-
- 21 septiembre 2015see what's new
- Tipo:
-
- Intervention
- Etapa:
-
- Review
- Grupo Editorial Cochrane:
-
Grupo Cochrane de Infecciones respiratorias agudas
- Copyright:
-
- Copyright © 2015 The Cochrane Collaboration. Published by John Wiley & Sons, Ltd.
Cifras del artículo
Altmetric:
Citado por:
Autores
Contributions of authors
Soo young Kim (SYK), Yoon‐Jung Chang (YJC), Ye‐won Hwang (YWH) and Yoo Sun Moon (YSM) were responsible for study selection, methodological quality assessment, data extraction and analyses, and writing the review.
Hye Min Cho (HMC) was responsible for the literature search and writing the review.
Declarations of interest
Soo Young Kim: none known.
Yoon‐Jung Chang: none known.
Hye Min Cho: none known.
Ye‐Won Hwang: none known.
Yoo Sun Moon: none known.
Acknowledgements
We would like to acknowledge the helpful comments of the panel of experts who refereed our review. We are grateful to Liz Dooley and Hayley Edmonds, Cochrane ARI Group Managing Editor and former Assistant Managing Editor. We also wish to thank the following people for commenting on the draft review: Tracey Lloyd, Owen Hendley, Rick Shoemaker and Bruce Arroll.
Version history
| Published | Title | Stage | Authors | Version |
| 2015 Sep 21 | Non‐steroidal anti‐inflammatory drugs for the common cold | Review | Soo Young Kim, Yoon‐Jung Chang, Hye Min Cho, Ye‐Won Hwang, Yoo Sun Moon | |
| 2013 Jun 04 | Non‐steroidal anti‐inflammatory drugs for the common cold | Review | Soo Young Kim, Yoon‐Jung Chang, Hye Min Cho, Ye‐Won Hwang, Yoo Sun Moon | |
| 2009 Jul 08 | Non‐steroidal anti‐inflammatory drugs for the common cold | Review | Soo young Kim, Hye Min Cho, Ye‐won Hwang, Yoo Sun Moon, Yoon‐Jung Chang | |
| 2007 Jan 24 | Non‐steroidal anti‐inflammatory drugs for the common cold | Protocol | Soo young Kim, Yoon‐Jung Chang, Yoon‐Seok Chang, Hye Min Cho, Ye‐won Hwang, Yoo Sun Moon, Seung Soo Sheen | |
Keywords
MeSH
Medical Subject Headings (MeSH) Keywords
Medical Subject Headings Check Words
Adult; Child; Humans;
PICO
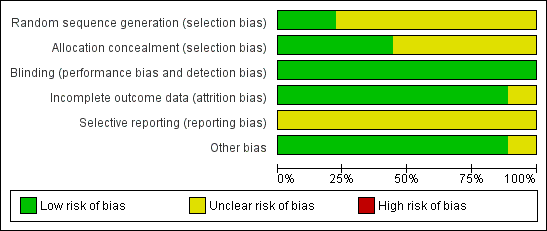
'Risk of bias' graph: review authors' judgements about each methodological quality item presented as percentages across all included studies
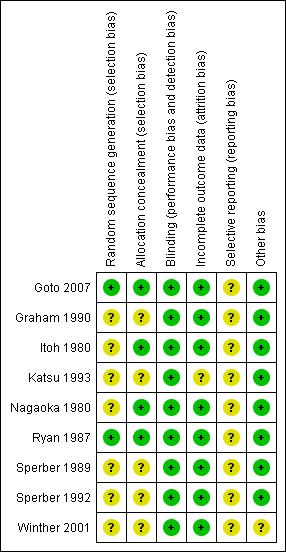
'Risk of bias' summary: review authors' judgements about each methodological quality item for each included study

Comparison 1 NSAIDs versus placebo, global effect, Outcome 1 Sum of overall symptom score (random‐effects model).

Comparison 1 NSAIDs versus placebo, global effect, Outcome 2 Moderate to marked severity.

Comparison 1 NSAIDs versus placebo, global effect, Outcome 3 Duration of colds (random‐effects model).
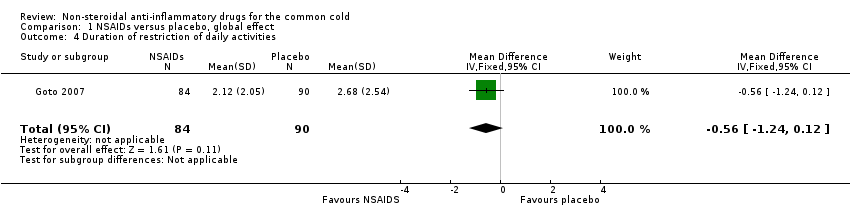
Comparison 1 NSAIDs versus placebo, global effect, Outcome 4 Duration of restriction of daily activities.

Comparison 2 NSAIDs versus placebo, analgesic effect, Outcome 1 Throat irritation score (fixed‐effect model).
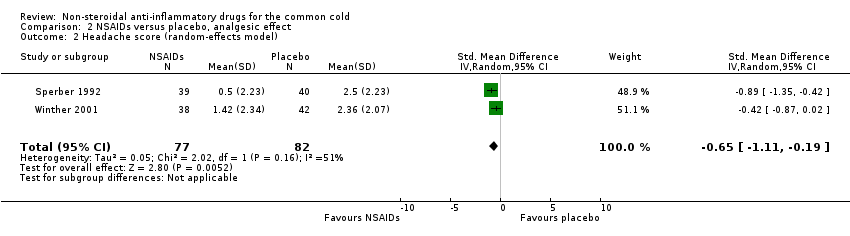
Comparison 2 NSAIDs versus placebo, analgesic effect, Outcome 2 Headache score (random‐effects model).

Comparison 2 NSAIDs versus placebo, analgesic effect, Outcome 3 Score of pain in muscles/joints score (fixed‐effect model).
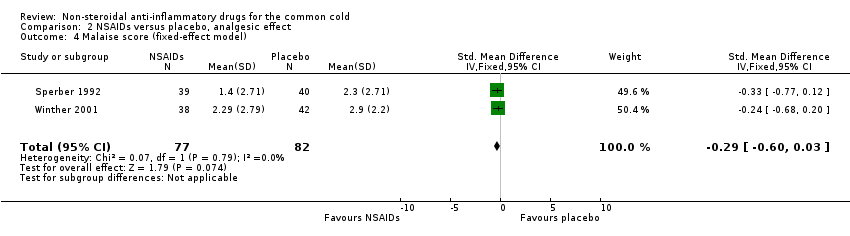
Comparison 2 NSAIDs versus placebo, analgesic effect, Outcome 4 Malaise score (fixed‐effect model).

Comparison 2 NSAIDs versus placebo, analgesic effect, Outcome 5 Chilliness score (random‐effects model).
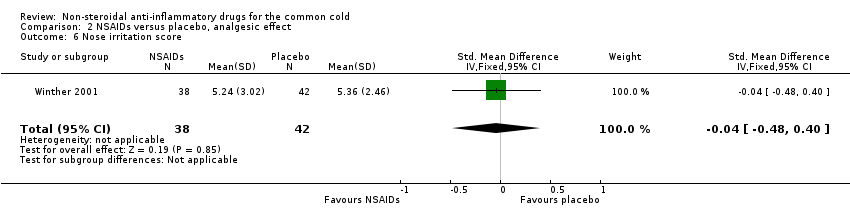
Comparison 2 NSAIDs versus placebo, analgesic effect, Outcome 6 Nose irritation score.

Comparison 2 NSAIDs versus placebo, analgesic effect, Outcome 7 Score of pain on swallowing.
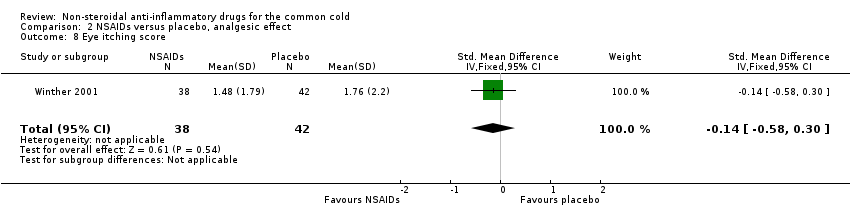
Comparison 2 NSAIDs versus placebo, analgesic effect, Outcome 8 Eye itching score.

Comparison 2 NSAIDs versus placebo, analgesic effect, Outcome 9 Earache score.
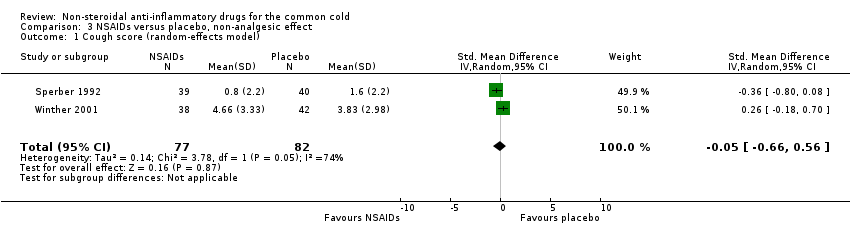
Comparison 3 NSAIDs versus placebo, non‐analgesic effect, Outcome 1 Cough score (random‐effects model).

Comparison 3 NSAIDs versus placebo, non‐analgesic effect, Outcome 2 Sneezing score (fixed‐effect model).

Comparison 3 NSAIDs versus placebo, non‐analgesic effect, Outcome 3 Total number of sneezes.
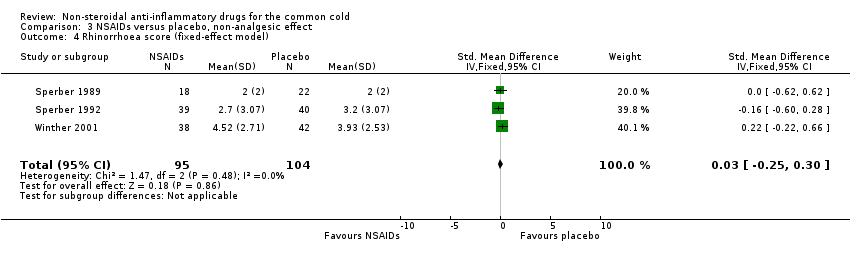
Comparison 3 NSAIDs versus placebo, non‐analgesic effect, Outcome 4 Rhinorrhoea score (fixed‐effect model).

Comparison 3 NSAIDs versus placebo, non‐analgesic effect, Outcome 5 Nasal obstruction score (fixed‐effect model).
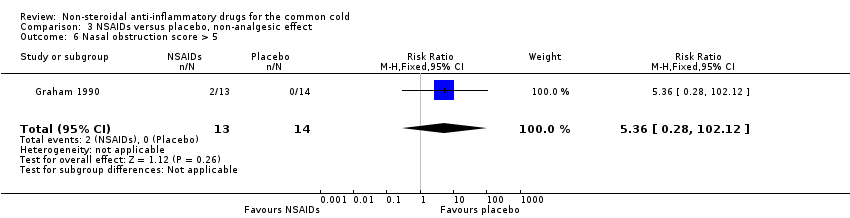
Comparison 3 NSAIDs versus placebo, non‐analgesic effect, Outcome 6 Nasal obstruction score > 5.

Comparison 3 NSAIDs versus placebo, non‐analgesic effect, Outcome 7 Total number of nose blows.

Comparison 3 NSAIDs versus placebo, non‐analgesic effect, Outcome 8 Total mucus weight.

Comparison 3 NSAIDs versus placebo, non‐analgesic effect, Outcome 9 Total tissue number count.

Comparison 3 NSAIDs versus placebo, non‐analgesic effect, Outcome 10 Score of dryness in the nose.
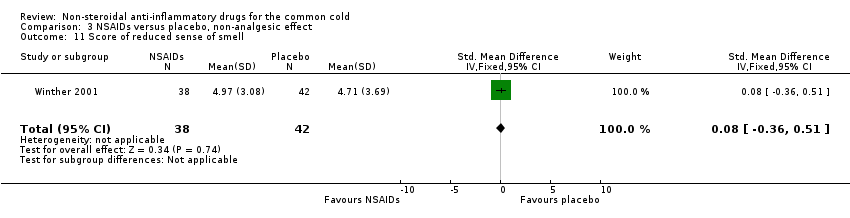
Comparison 3 NSAIDs versus placebo, non‐analgesic effect, Outcome 11 Score of reduced sense of smell.
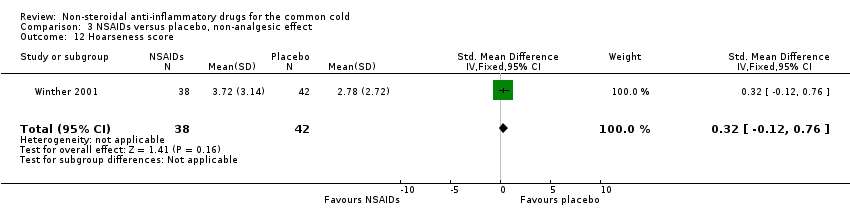
Comparison 3 NSAIDs versus placebo, non‐analgesic effect, Outcome 12 Hoarseness score.

Comparison 3 NSAIDs versus placebo, non‐analgesic effect, Outcome 13 Fatigue score.
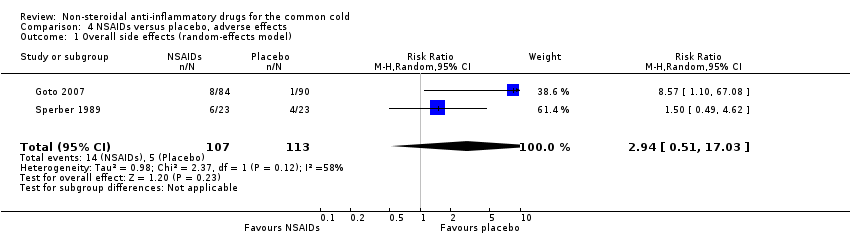
Comparison 4 NSAIDs versus placebo, adverse effects, Outcome 1 Overall side effects (random‐effects model).
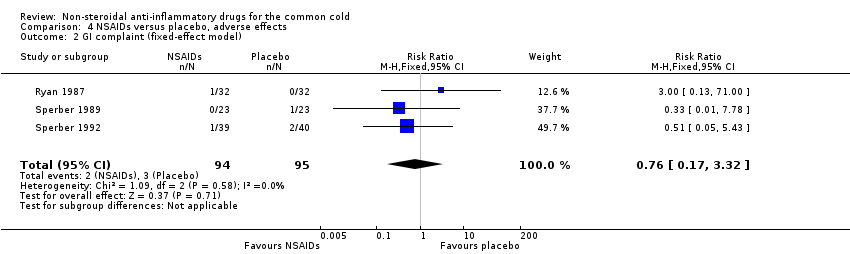
Comparison 4 NSAIDs versus placebo, adverse effects, Outcome 2 GI complaint (fixed‐effect model).
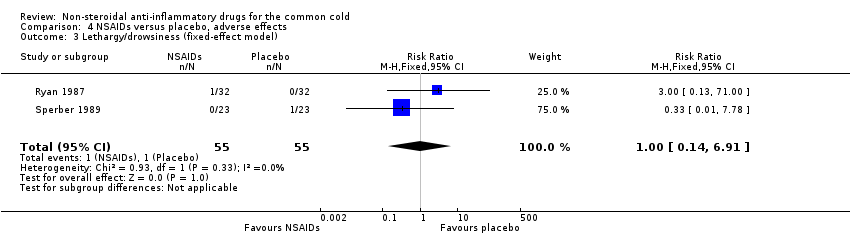
Comparison 4 NSAIDs versus placebo, adverse effects, Outcome 3 Lethargy/drowsiness (fixed‐effect model).
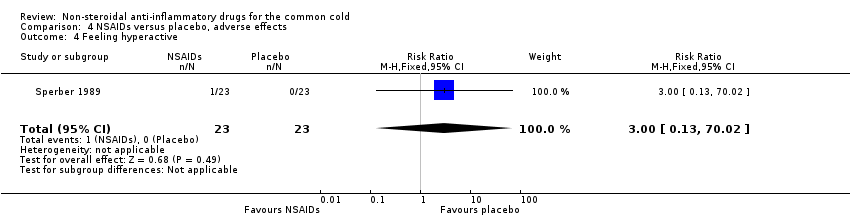
Comparison 4 NSAIDs versus placebo, adverse effects, Outcome 4 Feeling hyperactive.

Comparison 4 NSAIDs versus placebo, adverse effects, Outcome 5 Feeling more awake.
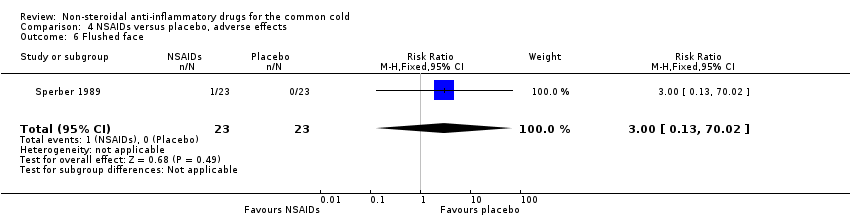
Comparison 4 NSAIDs versus placebo, adverse effects, Outcome 6 Flushed face.

Comparison 4 NSAIDs versus placebo, adverse effects, Outcome 7 Difficulty sleeping.
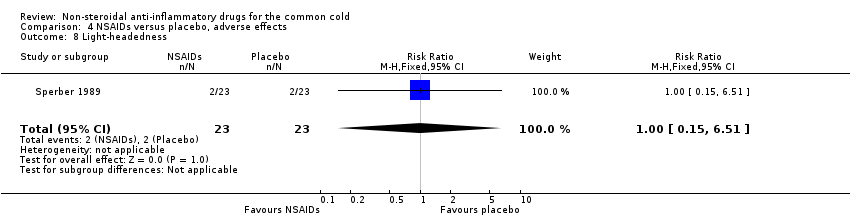
Comparison 4 NSAIDs versus placebo, adverse effects, Outcome 8 Light‐headedness.

Comparison 4 NSAIDs versus placebo, adverse effects, Outcome 9 Dry mouth.
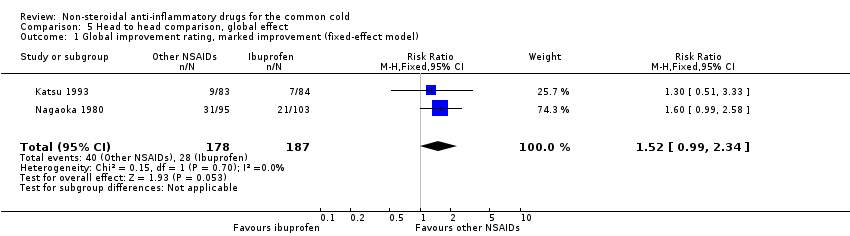
Comparison 5 Head to head comparison, global effect, Outcome 1 Global improvement rating, marked improvement (fixed‐effect model).

Comparison 5 Head to head comparison, global effect, Outcome 2 Global improvement rating, moderate to marked improvement (fixed‐effect model).
| Non‐steroidal anti‐inflammatory drugs for the common cold | ||||||
| Patient or population: patients with common cold | ||||||
| Outcomes | Illustrative comparative risks* (95% CI) | Relative effect | No of participants | Quality of the evidence | Comments | |
| Assumed risk | Corresponding risk | |||||
| Control | Non‐steroidal anti‐inflammatory drugs | |||||
| Sum of overall symptom score | — | The mean sum of overall symptom score in the intervention groups was | — | 293 | ⊕⊕⊕⊝ | — |
| Duration of colds | — | The mean duration of colds in the intervention groups was | — | 214 | ⊕⊕⊕⊝ | — |
| Throat irritation score | — | The mean throat irritation score in the intervention groups was | — | 159 | ⊕⊕⊕⊝ | — |
| Headache score | — | The mean headache score in the intervention groups was | — | 159 | ⊕⊕⊕⊝ | — |
| Score of pain in muscles/joints score | — | The mean pain in muscles/joints score in the intervention groups was | — | 0 | See comment | — |
| Cough score | — | The mean cough score in the intervention groups was | — | 159 | ⊕⊕⊕⊝ | — |
| Rhinorrhoea score | — | The mean rhinorrhoea score in the intervention groups was | — | 199 | ⊕⊕⊕⊝ | — |
| *The basis for the assumed risk (e.g. the median control group risk across studies) is provided in footnotes. The corresponding risk (and its 95% confidence interval) is based on the assumed risk in the comparison group and the relative effect of the intervention (and its 95% CI). | ||||||
| GRADE Working Group grades of evidence | ||||||
| 1# NSAIDs group 141, placebo group 152. | ||||||
| Outcome or subgroup title | No. of studies | No. of participants | Statistical method | Effect size |
| 1 Sum of overall symptom score (random‐effects model) Show forest plot | 3 | 293 | Std. Mean Difference (IV, Random, 95% CI) | ‐0.40 [‐1.03, 0.24] |
| 2 Moderate to marked severity Show forest plot | 1 | 40 | Risk Ratio (M‐H, Fixed, 95% CI) | 0.61 [0.18, 2.11] |
| 3 Duration of colds (random‐effects model) Show forest plot | 2 | 214 | Mean Difference (IV, Random, 95% CI) | ‐0.23 [‐1.75, 1.29] |
| 4 Duration of restriction of daily activities Show forest plot | 1 | 174 | Mean Difference (IV, Fixed, 95% CI) | ‐0.56 [‐1.24, 0.12] |
| Outcome or subgroup title | No. of studies | No. of participants | Statistical method | Effect size |
| 1 Throat irritation score (fixed‐effect model) Show forest plot | 2 | 159 | Std. Mean Difference (IV, Fixed, 95% CI) | ‐0.01 [‐0.33, 0.30] |
| 2 Headache score (random‐effects model) Show forest plot | 2 | 159 | Std. Mean Difference (IV, Random, 95% CI) | ‐0.65 [‐1.11, ‐0.19] |
| 3 Score of pain in muscles/joints score (fixed‐effect model) Show forest plot | 2 | 114 | Std. Mean Difference (IV, Fixed, 95% CI) | ‐0.40 [‐0.77, ‐0.03] |
| 4 Malaise score (fixed‐effect model) Show forest plot | 2 | 159 | Std. Mean Difference (IV, Fixed, 95% CI) | ‐0.29 [‐0.60, 0.03] |
| 5 Chilliness score (random‐effects model) Show forest plot | 2 | 159 | Std. Mean Difference (IV, Random, 95% CI) | ‐0.03 [‐1.12, 1.06] |
| 6 Nose irritation score Show forest plot | 1 | 80 | Std. Mean Difference (IV, Fixed, 95% CI) | ‐0.04 [‐0.48, 0.40] |
| 7 Score of pain on swallowing Show forest plot | 1 | 80 | Std. Mean Difference (IV, Fixed, 95% CI) | ‐0.07 [‐0.51, 0.37] |
| 8 Eye itching score Show forest plot | 1 | 80 | Std. Mean Difference (IV, Fixed, 95% CI) | ‐0.14 [‐0.58, 0.30] |
| 9 Earache score Show forest plot | 1 | 80 | Std. Mean Difference (IV, Fixed, 95% CI) | ‐0.59 [‐1.04, ‐0.14] |
| Outcome or subgroup title | No. of studies | No. of participants | Statistical method | Effect size |
| 1 Cough score (random‐effects model) Show forest plot | 2 | 159 | Std. Mean Difference (IV, Random, 95% CI) | ‐0.05 [‐0.66, 0.56] |
| 2 Sneezing score (fixed‐effect model) Show forest plot | 2 | 159 | Std. Mean Difference (IV, Fixed, 95% CI) | ‐0.44 [‐0.75, ‐0.12] |
| 3 Total number of sneezes Show forest plot | 1 | 80 | Std. Mean Difference (IV, Fixed, 95% CI) | ‐0.51 [‐0.95, ‐0.06] |
| 4 Rhinorrhoea score (fixed‐effect model) Show forest plot | 3 | 199 | Std. Mean Difference (IV, Fixed, 95% CI) | 0.03 [‐0.25, 0.30] |
| 5 Nasal obstruction score (fixed‐effect model) Show forest plot | 3 | 199 | Std. Mean Difference (IV, Fixed, 95% CI) | ‐0.15 [‐0.43, 0.13] |
| 6 Nasal obstruction score > 5 Show forest plot | 1 | 27 | Risk Ratio (M‐H, Fixed, 95% CI) | 5.36 [0.28, 102.12] |
| 7 Total number of nose blows Show forest plot | 1 | 80 | Std. Mean Difference (IV, Fixed, 95% CI) | 0.17 [‐0.27, 0.61] |
| 8 Total mucus weight Show forest plot | 1 | 40 | Std. Mean Difference (IV, Fixed, 95% CI) | 0.13 [‐0.49, 0.76] |
| 9 Total tissue number count Show forest plot | 1 | 40 | Std. Mean Difference (IV, Fixed, 95% CI) | ‐0.20 [‐0.83, 0.42] |
| 10 Score of dryness in the nose Show forest plot | 1 | 80 | Std. Mean Difference (IV, Fixed, 95% CI) | 0.04 [‐0.40, 0.48] |
| 11 Score of reduced sense of smell Show forest plot | 1 | 80 | Std. Mean Difference (IV, Fixed, 95% CI) | 0.08 [‐0.36, 0.51] |
| 12 Hoarseness score Show forest plot | 1 | 80 | Std. Mean Difference (IV, Fixed, 95% CI) | 0.32 [‐0.12, 0.76] |
| 13 Fatigue score Show forest plot | 1 | 80 | Std. Mean Difference (IV, Fixed, 95% CI) | 0.18 [‐0.26, 0.62] |
| Outcome or subgroup title | No. of studies | No. of participants | Statistical method | Effect size |
| 1 Overall side effects (random‐effects model) Show forest plot | 2 | 220 | Risk Ratio (M‐H, Random, 95% CI) | 2.94 [0.51, 17.03] |
| 2 GI complaint (fixed‐effect model) Show forest plot | 3 | 189 | Risk Ratio (M‐H, Fixed, 95% CI) | 0.76 [0.17, 3.32] |
| 3 Lethargy/drowsiness (fixed‐effect model) Show forest plot | 2 | 110 | Risk Ratio (M‐H, Fixed, 95% CI) | 1.0 [0.14, 6.91] |
| 4 Feeling hyperactive Show forest plot | 1 | 46 | Risk Ratio (M‐H, Fixed, 95% CI) | 3.0 [0.13, 70.02] |
| 5 Feeling more awake Show forest plot | 1 | 46 | Risk Ratio (M‐H, Fixed, 95% CI) | 3.0 [0.13, 70.02] |
| 6 Flushed face Show forest plot | 1 | 46 | Risk Ratio (M‐H, Fixed, 95% CI) | 3.0 [0.13, 70.02] |
| 7 Difficulty sleeping Show forest plot | 1 | 46 | Risk Ratio (M‐H, Fixed, 95% CI) | 0.33 [0.01, 7.78] |
| 8 Light‐headedness Show forest plot | 1 | 46 | Risk Ratio (M‐H, Fixed, 95% CI) | 1.0 [0.15, 6.51] |
| 9 Dry mouth Show forest plot | 1 | 46 | Risk Ratio (M‐H, Fixed, 95% CI) | 3.0 [0.13, 70.02] |
| Outcome or subgroup title | No. of studies | No. of participants | Statistical method | Effect size |
| 1 Global improvement rating, marked improvement (fixed‐effect model) Show forest plot | 2 | 365 | Risk Ratio (M‐H, Fixed, 95% CI) | 1.52 [0.99, 2.34] |
| 2 Global improvement rating, moderate to marked improvement (fixed‐effect model) Show forest plot | 2 | 365 | Risk Ratio (M‐H, Fixed, 95% CI) | 1.20 [1.02, 1.41] |