Anti‐inflamatórios não esteroidais para o resfriado comum
Appendices
Appendix 1. EMBASE search strategy
/* COMMON COLD */
#1 'common cold'/exp OR (common cold*):ti,ab
#2 coryza:ti,ab
#3 ('upper respiratory infection'):ti,ab OR ('upper respiratory infections'):ti,ab
#4 ('upper respiratory tract infection'):ti,ab OR ('upper respiratory tract infections'):ti,ab
#5 urti:ti,ab
#6 ((respiratory tract infection:ti,ab) OR (respiratory tract infections:ti,ab)) AND upper:ti,ab
#7 'rhinitis'/exp OR rhinit*:ti,ab
#8 'pharyngitis'/exp OR pharyngit*:ti,ab
#9 'sore throat':ti,ab OR 'sore throats':ti,ab
#10 'rhinopharyngitis'/exp OR nasopharyngit*:ti,ab
#11 'laryngitis'/exp OR laryngit*:ti,ab
#12 'coughing'/exp OR cough*:ti,ab
#13 'nose obstruction'/exp OR 'nasal obstruction':ti,ab
#14 'sneezing'/exp OR sneez*:ti,ab
#15 'rhinovirus'/exp OR rhinovirus:ti,ab
#16 OR/#1‐#15
/* NSAIDS */
#17 'nonsteroid antiinflammatory agent'/exp OR nsaid*:ti,ab OR (((non‐steroid OR nonsteroid OR 'non steroid' OR 'non steroids') AND (anti‐inflammatory OR antiinflammatory OR 'anti inflammatory')):ti,ab)
#18 'azapropazone'/exp OR apazone:ti,ab
#19 'acetylsalicylic acid'/exp OR aspirin:ti,ab
#20 'celecoxib'/exp OR celecoxib:ti,ab
#21 'diclofenac'/exp OR diclofenac:ti,ab
#22 'diflunisal'/exp OR diflunisal:ti,ab
#23 'etodolac'/exp OR etodolac:ti,ab
#24 'fenoprofen'/exp OR fenoprofen:ti,ab
#25 'flurbiprofen'/exp OR flurbiprofen:ti,ab
#26 'ibuprofen'/exp OR ibuprofen:ti,ab
#27 'indometacin'/exp OR indomethacin:ti,ab
#28 'ketoprofen'/exp OR ketoprofen:ti,ab
#29 'ketorolac'/exp OR ketorolac:ti,ab
#30 'meclofenamic acid'/exp OR meclofenamate:ti,ab
#31 'meloxicam'/exp OR meloxicam:ti,ab
#32 'salicylic acid methyl ester'/exp OR methylsalicylate:ti,ab OR 'methyl salicylate':ti,ab
#33 'nabumetone'/exp OR nabumetone:ti,ab
#34 'naproxen'/exp OR naproxen:ti,ab
#35 'nimesulide'/exp OR nimesulide:ti,ab
#36 'oxaprozin'/exp OR oxaprozin:ti,ab
#37 'phenylbutazone'/exp OR phenylbutazone:ti,ab
#38 'piroxicam'/exp OR piroxicam:ti,ab
#39 'salicylic acid'/exp OR salicylate:ti,ab
#40 'sulindac'/exp OR sulindac:ti,ab
#41 'tenoxicam'/exp OR tenoxicam:ti,ab
#42 'tolmetin'/exp OR tolmetin:ti,ab
#43 OR/#17‐#42
/* RCT */
#44 'clinical trial'/exp OR 'clinical trial':ti,ab
#45 'randomized controlled trial'/exp OR 'randomized controlled trial':ti,ab
#46 'randomisation'/exp OR random*:ti,ab
#47 'single blind procedure'/exp OR (singl*:ti,ab AND (mask*:ti,ab OR blind*:ti,ab))
#48 'double blind procedure'/exp OR (doubl*:ti,ab AND (mask*:ti,ab OR blind*:ti,ab))
#49 'triple blind procedure'/exp OR (trip*:ti,ab AND (mask*:ti,ab OR blind*:ti,ab))
#50 'placebo'/exp OR placebo:ti,ab
#51 OR #44‐#50
/* Combine & Limit */
#52 #16 AND #43 AND #51
#53 #16 AND #43 AND [randomized controlled trial]/lim
#54 (#52 OR #53) AND [human]/lim
#55 #54 AND [2009‐2011]/py
Appendix 2. CINAHL search strategy
/* COMMON COLD */
S1 (MH "Common Cold") OR (TX "common cold*")
S2 TX coryza
S3 (MH "Respiratory Tract Infections") or TX "upper respiratory infection*"
S4 TX "upper respiratory tract infection*"
S5 TX URTI
S6 (TX "respiratory tract infection*") AND (TX upper)
S7 (MH "Rhinitis") OR (TX rhinit*)
S8 (MH "Pharyngitis") OR (TX pharyngit*)
S9 TX "sore throat*"
S10 (MH "Nasopharynx") OR (TX nasopharyngit*)
S11 (MH "Laryngitis") OR (TX laryngit*)
S12 (MH "Cough") OR (TX cough*)
S13 (MH "Nasal Obstruction") OR (TX nasal obstruction*)
S14 (MH "Sneezing") OR (TX sneez*)
S15 TX rhinovirus
S16 OR/S1‐S15
/* NSAIDS */
S17 (MH "Antiinflammatory Agents, Non‐Steroidal") OR (TX nsaid*) OR (TX (non‐steroid* OR nonsteroid* OR "non steroid*") AND TX (anti‐inflammator* OR antiinflammator* OR "anti inflammator*"))
S18 TX azapropazone
S19 MH "Aspirin" OR aspirin
S20 MH "Cox‐2 Inhibitors" OR TX celecoxib
S21 MH "Diclofenac" OR TX diclofenac
S22 TX diflunisal
S23 MH "Etodolac" OR TX etodolac
S24 TX fenoprofen
S25 MH "Flurbiprofen" OR TX flurbiprofen
S26 MH "Ibuprofen" OR TX ibuprofen
S27 MH "Indomethacin" OR TX indomethacin
S28 TX ketoprofen
S29 MH "Ketorolac" OR TX ketorolac
S30 TX meclofenamate
S31 TX meloxicam
S32 TX (methylsalicylate OR "methyl salicylate")
S33 TX nabumetone
S34 MH "Naproxen" OR TX naproxen
S35 TX nimesulide
S36 TX oxaprozin
S37 MH "Phenylbutazone" OR TX phenylbutazone
S38 MH "Piroxicam" OR TX piroxicam
S39 MH "Salicylic Acids" OR TX salicylate
S40 MH "Sulindac" OR TX sulindac
S41 TX tenoxicam
S42 MH "Tolmetin" OR TX tolmetin
S43 OR/S11‐S42
/* RCT */
S44 MH "Clinical trial" OR TX "clinical trial"
S45 MH "Randomized Controlled Trials" OR TX "randomized controlled trial"
S46 MH "Random Sample" OR TX random*
S47 MH "Single‐Blind Studies" OR TX (singl* AND (mask* OR blind*))
S48 MH "Double‐Blind Studies" OR TX (doubl* AND (mask* OR blind*))
S49 MH "Triple‐Blind Studies" OR TX (trilp AND (mask* OR blind*))
S50 MH "Placebos" OR TX placebo
S51 OR S44‐S50
/* Combine & Limit */
S52 S16 AND S43 AND S51
S53 S16 AND S43 AND [crinical trial]/lim
S54 S52 OR S53
S55 S54 AND [2009‐2011]/py
Appendix 3. MEDLINE and CENTRAL search strategy
MEDLINE (Ovid)
1 Common Cold/
2 common cold*.tw.
3 coryza.tw.
4 upper respiratory infection*.tw.
5 upper respiratory tract infections*.tw.
6 urti.tw.
7 respiratory tract infections.sh. and upper.tw.
8 Rhinitis/
9 rhinit*.tw.
10 exp Pharyngitis/
11 pharyngit*.tw.
12 sore throat*.tw.
13 exp Nasopharyngitis/
14 nasopharyngit*.tw.
15 exp Laryngitis/
16 laryngit*.tw.
17 Cough/
18 cough*.tw.
19 Nasal Obstruction/
20 nasal obstruction*.tw.
21 Sneezing/
22 sneez*.tw.
23 Rhinovirus/
24 rhinovirus*.tw.
25 or/1‐24
26 exp Anti‐Inflammatory Agents, Non‐Steroidal/
27 nsaid*.tw.
28 ((non‐steroid* or nonsteroid* or non steroid*) and (anti‐inflammator* or antiinflammator* or anti inflammator*)).tw.
29 Apazone.sh. or apazone.tw.
30 Aspirin.sh. or aspirin.tw.
31 celecoxib.nm. or celecoxib.tw.
32 diclofenac.sh. or diclofenac.tw.
33 diflunisal.sh. or diflunisal.tw.
34 etodolac.sh. or etodolac.tw.
35 fenoprofen.sh. or fenoprofen.tw.
36 flurbiprofen.sh. or flurbiprofen.tw.
37 ibuprofen.sh. or ibuprofen.tw.
38 indomethacin.sh. or indomethacin.tw.
39 ketoprofen.sh. or ketoprofen.tw.
40 ketorolac.sh. or ketorolac.tw.
41 Meclofenamic Acid/
42 meclofenamate.tw. or meloxicam.nm. or meloxicam.tw.
43 methyl salicylate.nm. or methylsalicylate.tw. or methyl salicylate.tw.
44 nabumetone.nm. or nabumetone.tw.
45 naproxen.sh. or naproxen.tw.
46 nimesulide.nm. or nimesulide.tw.
47 oxaprozin.nm. or oxaprozin.tw.
48 phenylbutazone.sh. or phenylbutazone.tw.
49 piroxicam.sh. or piroxicam.tw.
50 salicylate.mp.
51 sulindac.sh. or sulindac.tw.
52 tenoxicam.nm. or tenoxicam.tw.
53 tolmetin.sh. or tolmetin.tw.
54 or/26‐53
55 25 and 54
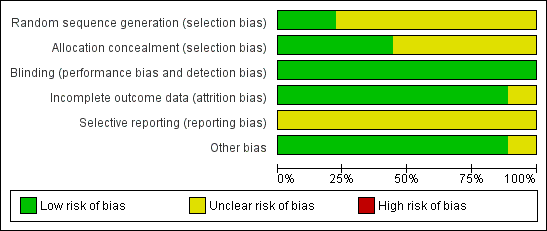
'Risk of bias' graph: review authors' judgements about each methodological quality item presented as percentages across all included studies
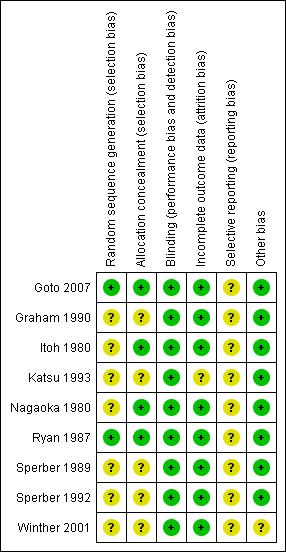
'Risk of bias' summary: review authors' judgements about each methodological quality item for each included study

Comparison 1 NSAIDs versus placebo, global effect, Outcome 1 Sum of overall symptom score (random‐effects model).

Comparison 1 NSAIDs versus placebo, global effect, Outcome 2 Moderate to marked severity.

Comparison 1 NSAIDs versus placebo, global effect, Outcome 3 Duration of colds (random‐effects model).
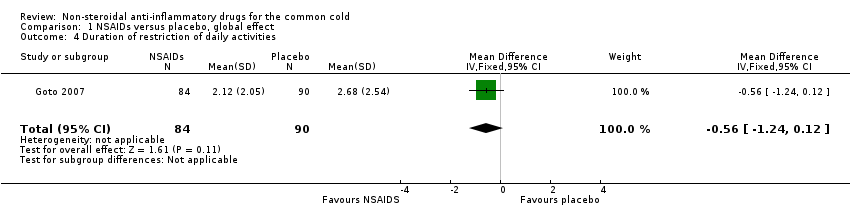
Comparison 1 NSAIDs versus placebo, global effect, Outcome 4 Duration of restriction of daily activities.

Comparison 2 NSAIDs versus placebo, analgesic effect, Outcome 1 Throat irritation score (fixed‐effect model).
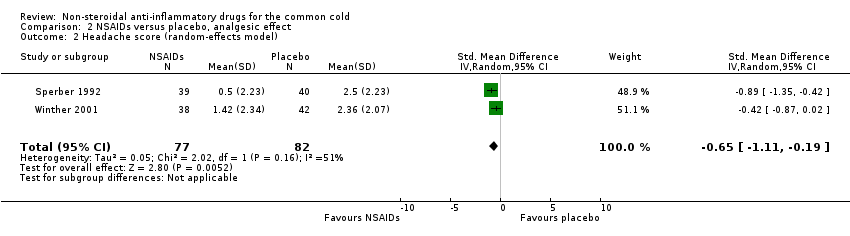
Comparison 2 NSAIDs versus placebo, analgesic effect, Outcome 2 Headache score (random‐effects model).

Comparison 2 NSAIDs versus placebo, analgesic effect, Outcome 3 Score of pain in muscles/joints score (fixed‐effect model).
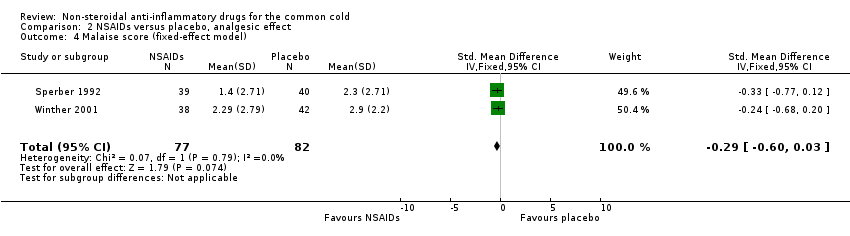
Comparison 2 NSAIDs versus placebo, analgesic effect, Outcome 4 Malaise score (fixed‐effect model).

Comparison 2 NSAIDs versus placebo, analgesic effect, Outcome 5 Chilliness score (random‐effects model).
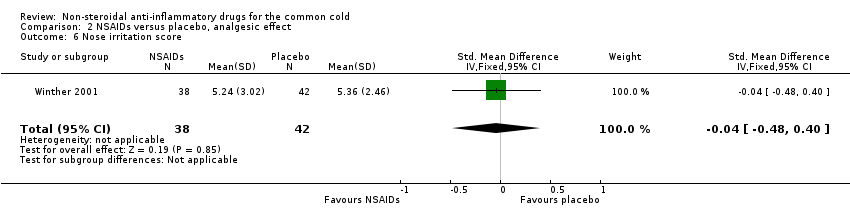
Comparison 2 NSAIDs versus placebo, analgesic effect, Outcome 6 Nose irritation score.

Comparison 2 NSAIDs versus placebo, analgesic effect, Outcome 7 Score of pain on swallowing.
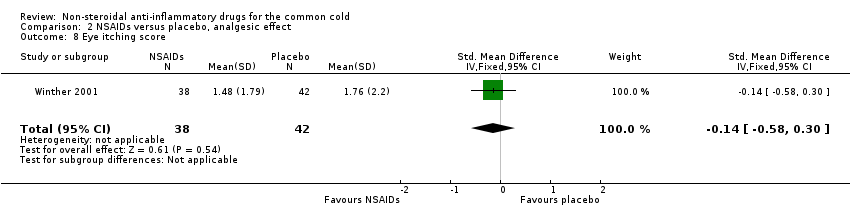
Comparison 2 NSAIDs versus placebo, analgesic effect, Outcome 8 Eye itching score.

Comparison 2 NSAIDs versus placebo, analgesic effect, Outcome 9 Earache score.
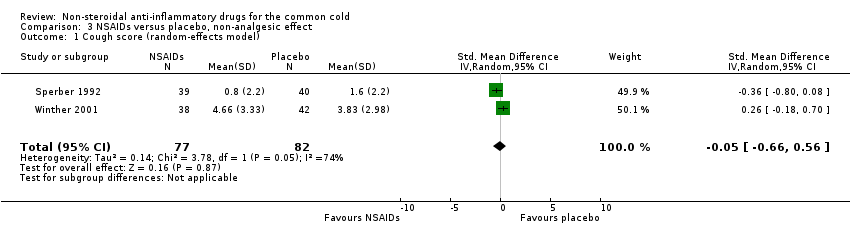
Comparison 3 NSAIDs versus placebo, non‐analgesic effect, Outcome 1 Cough score (random‐effects model).

Comparison 3 NSAIDs versus placebo, non‐analgesic effect, Outcome 2 Sneezing score (fixed‐effect model).

Comparison 3 NSAIDs versus placebo, non‐analgesic effect, Outcome 3 Total number of sneezes.
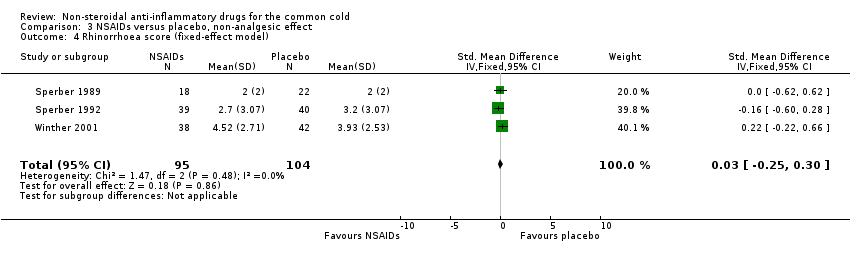
Comparison 3 NSAIDs versus placebo, non‐analgesic effect, Outcome 4 Rhinorrhoea score (fixed‐effect model).

Comparison 3 NSAIDs versus placebo, non‐analgesic effect, Outcome 5 Nasal obstruction score (fixed‐effect model).
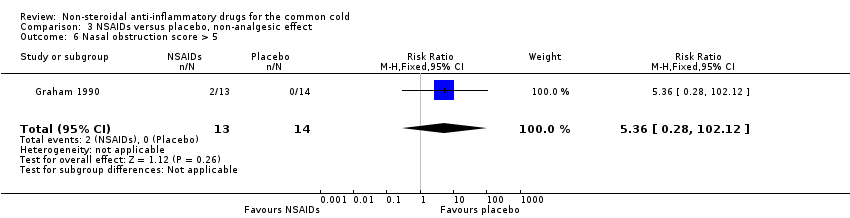
Comparison 3 NSAIDs versus placebo, non‐analgesic effect, Outcome 6 Nasal obstruction score > 5.

Comparison 3 NSAIDs versus placebo, non‐analgesic effect, Outcome 7 Total number of nose blows.

Comparison 3 NSAIDs versus placebo, non‐analgesic effect, Outcome 8 Total mucus weight.

Comparison 3 NSAIDs versus placebo, non‐analgesic effect, Outcome 9 Total tissue number count.

Comparison 3 NSAIDs versus placebo, non‐analgesic effect, Outcome 10 Score of dryness in the nose.
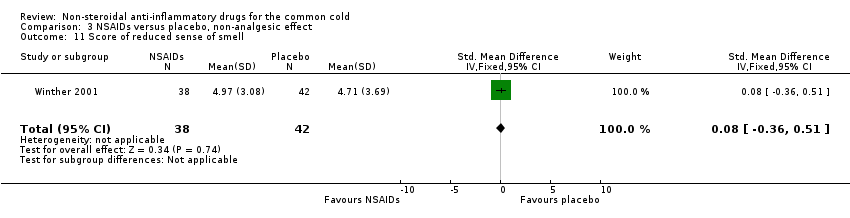
Comparison 3 NSAIDs versus placebo, non‐analgesic effect, Outcome 11 Score of reduced sense of smell.
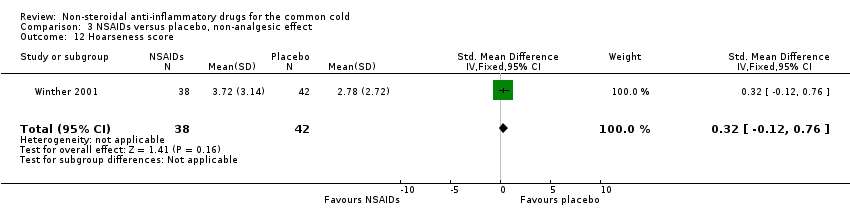
Comparison 3 NSAIDs versus placebo, non‐analgesic effect, Outcome 12 Hoarseness score.

Comparison 3 NSAIDs versus placebo, non‐analgesic effect, Outcome 13 Fatigue score.
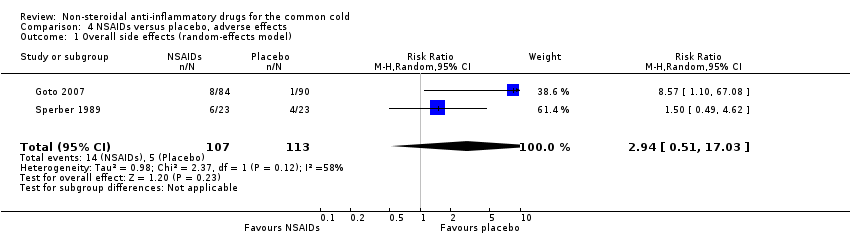
Comparison 4 NSAIDs versus placebo, adverse effects, Outcome 1 Overall side effects (random‐effects model).
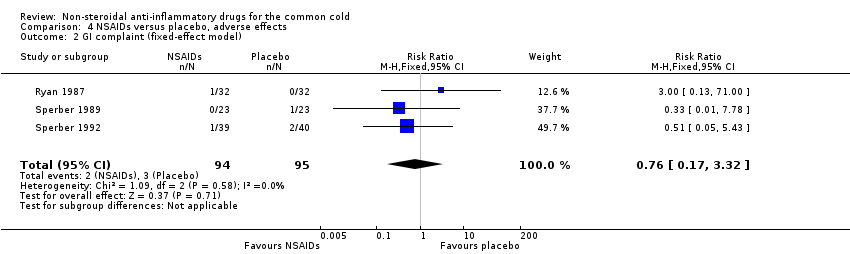
Comparison 4 NSAIDs versus placebo, adverse effects, Outcome 2 GI complaint (fixed‐effect model).
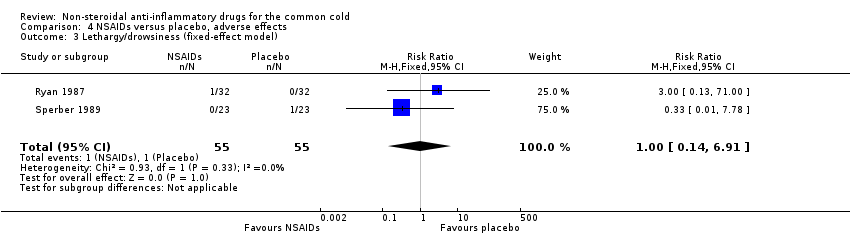
Comparison 4 NSAIDs versus placebo, adverse effects, Outcome 3 Lethargy/drowsiness (fixed‐effect model).
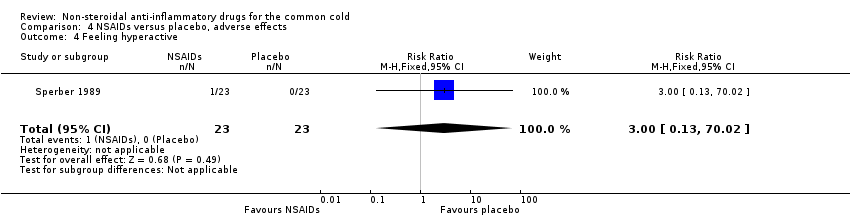
Comparison 4 NSAIDs versus placebo, adverse effects, Outcome 4 Feeling hyperactive.

Comparison 4 NSAIDs versus placebo, adverse effects, Outcome 5 Feeling more awake.
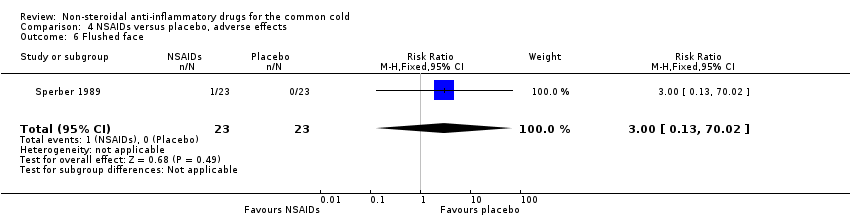
Comparison 4 NSAIDs versus placebo, adverse effects, Outcome 6 Flushed face.

Comparison 4 NSAIDs versus placebo, adverse effects, Outcome 7 Difficulty sleeping.
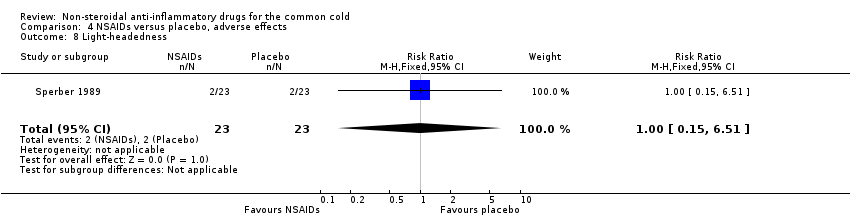
Comparison 4 NSAIDs versus placebo, adverse effects, Outcome 8 Light‐headedness.

Comparison 4 NSAIDs versus placebo, adverse effects, Outcome 9 Dry mouth.
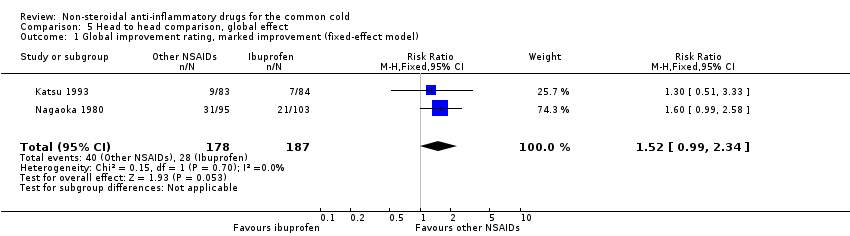
Comparison 5 Head to head comparison, global effect, Outcome 1 Global improvement rating, marked improvement (fixed‐effect model).

Comparison 5 Head to head comparison, global effect, Outcome 2 Global improvement rating, moderate to marked improvement (fixed‐effect model).
| Non‐steroidal anti‐inflammatory drugs for the common cold | ||||||
| Patient or population: patients with common cold | ||||||
| Outcomes | Illustrative comparative risks* (95% CI) | Relative effect | No of participants | Quality of the evidence | Comments | |
| Assumed risk | Corresponding risk | |||||
| Control | Non‐steroidal anti‐inflammatory drugs | |||||
| Sum of overall symptom score | — | The mean sum of overall symptom score in the intervention groups was | — | 293 | ⊕⊕⊕⊝ | — |
| Duration of colds | — | The mean duration of colds in the intervention groups was | — | 214 | ⊕⊕⊕⊝ | — |
| Throat irritation score | — | The mean throat irritation score in the intervention groups was | — | 159 | ⊕⊕⊕⊝ | — |
| Headache score | — | The mean headache score in the intervention groups was | — | 159 | ⊕⊕⊕⊝ | — |
| Score of pain in muscles/joints score | — | The mean pain in muscles/joints score in the intervention groups was | — | 0 | See comment | — |
| Cough score | — | The mean cough score in the intervention groups was | — | 159 | ⊕⊕⊕⊝ | — |
| Rhinorrhoea score | — | The mean rhinorrhoea score in the intervention groups was | — | 199 | ⊕⊕⊕⊝ | — |
| *The basis for the assumed risk (e.g. the median control group risk across studies) is provided in footnotes. The corresponding risk (and its 95% confidence interval) is based on the assumed risk in the comparison group and the relative effect of the intervention (and its 95% CI). | ||||||
| GRADE Working Group grades of evidence | ||||||
| 1# NSAIDs group 141, placebo group 152. | ||||||
| Outcome or subgroup title | No. of studies | No. of participants | Statistical method | Effect size |
| 1 Sum of overall symptom score (random‐effects model) Show forest plot | 3 | 293 | Std. Mean Difference (IV, Random, 95% CI) | ‐0.40 [‐1.03, 0.24] |
| 2 Moderate to marked severity Show forest plot | 1 | 40 | Risk Ratio (M‐H, Fixed, 95% CI) | 0.61 [0.18, 2.11] |
| 3 Duration of colds (random‐effects model) Show forest plot | 2 | 214 | Mean Difference (IV, Random, 95% CI) | ‐0.23 [‐1.75, 1.29] |
| 4 Duration of restriction of daily activities Show forest plot | 1 | 174 | Mean Difference (IV, Fixed, 95% CI) | ‐0.56 [‐1.24, 0.12] |
| Outcome or subgroup title | No. of studies | No. of participants | Statistical method | Effect size |
| 1 Throat irritation score (fixed‐effect model) Show forest plot | 2 | 159 | Std. Mean Difference (IV, Fixed, 95% CI) | ‐0.01 [‐0.33, 0.30] |
| 2 Headache score (random‐effects model) Show forest plot | 2 | 159 | Std. Mean Difference (IV, Random, 95% CI) | ‐0.65 [‐1.11, ‐0.19] |
| 3 Score of pain in muscles/joints score (fixed‐effect model) Show forest plot | 2 | 114 | Std. Mean Difference (IV, Fixed, 95% CI) | ‐0.40 [‐0.77, ‐0.03] |
| 4 Malaise score (fixed‐effect model) Show forest plot | 2 | 159 | Std. Mean Difference (IV, Fixed, 95% CI) | ‐0.29 [‐0.60, 0.03] |
| 5 Chilliness score (random‐effects model) Show forest plot | 2 | 159 | Std. Mean Difference (IV, Random, 95% CI) | ‐0.03 [‐1.12, 1.06] |
| 6 Nose irritation score Show forest plot | 1 | 80 | Std. Mean Difference (IV, Fixed, 95% CI) | ‐0.04 [‐0.48, 0.40] |
| 7 Score of pain on swallowing Show forest plot | 1 | 80 | Std. Mean Difference (IV, Fixed, 95% CI) | ‐0.07 [‐0.51, 0.37] |
| 8 Eye itching score Show forest plot | 1 | 80 | Std. Mean Difference (IV, Fixed, 95% CI) | ‐0.14 [‐0.58, 0.30] |
| 9 Earache score Show forest plot | 1 | 80 | Std. Mean Difference (IV, Fixed, 95% CI) | ‐0.59 [‐1.04, ‐0.14] |
| Outcome or subgroup title | No. of studies | No. of participants | Statistical method | Effect size |
| 1 Cough score (random‐effects model) Show forest plot | 2 | 159 | Std. Mean Difference (IV, Random, 95% CI) | ‐0.05 [‐0.66, 0.56] |
| 2 Sneezing score (fixed‐effect model) Show forest plot | 2 | 159 | Std. Mean Difference (IV, Fixed, 95% CI) | ‐0.44 [‐0.75, ‐0.12] |
| 3 Total number of sneezes Show forest plot | 1 | 80 | Std. Mean Difference (IV, Fixed, 95% CI) | ‐0.51 [‐0.95, ‐0.06] |
| 4 Rhinorrhoea score (fixed‐effect model) Show forest plot | 3 | 199 | Std. Mean Difference (IV, Fixed, 95% CI) | 0.03 [‐0.25, 0.30] |
| 5 Nasal obstruction score (fixed‐effect model) Show forest plot | 3 | 199 | Std. Mean Difference (IV, Fixed, 95% CI) | ‐0.15 [‐0.43, 0.13] |
| 6 Nasal obstruction score > 5 Show forest plot | 1 | 27 | Risk Ratio (M‐H, Fixed, 95% CI) | 5.36 [0.28, 102.12] |
| 7 Total number of nose blows Show forest plot | 1 | 80 | Std. Mean Difference (IV, Fixed, 95% CI) | 0.17 [‐0.27, 0.61] |
| 8 Total mucus weight Show forest plot | 1 | 40 | Std. Mean Difference (IV, Fixed, 95% CI) | 0.13 [‐0.49, 0.76] |
| 9 Total tissue number count Show forest plot | 1 | 40 | Std. Mean Difference (IV, Fixed, 95% CI) | ‐0.20 [‐0.83, 0.42] |
| 10 Score of dryness in the nose Show forest plot | 1 | 80 | Std. Mean Difference (IV, Fixed, 95% CI) | 0.04 [‐0.40, 0.48] |
| 11 Score of reduced sense of smell Show forest plot | 1 | 80 | Std. Mean Difference (IV, Fixed, 95% CI) | 0.08 [‐0.36, 0.51] |
| 12 Hoarseness score Show forest plot | 1 | 80 | Std. Mean Difference (IV, Fixed, 95% CI) | 0.32 [‐0.12, 0.76] |
| 13 Fatigue score Show forest plot | 1 | 80 | Std. Mean Difference (IV, Fixed, 95% CI) | 0.18 [‐0.26, 0.62] |
| Outcome or subgroup title | No. of studies | No. of participants | Statistical method | Effect size |
| 1 Overall side effects (random‐effects model) Show forest plot | 2 | 220 | Risk Ratio (M‐H, Random, 95% CI) | 2.94 [0.51, 17.03] |
| 2 GI complaint (fixed‐effect model) Show forest plot | 3 | 189 | Risk Ratio (M‐H, Fixed, 95% CI) | 0.76 [0.17, 3.32] |
| 3 Lethargy/drowsiness (fixed‐effect model) Show forest plot | 2 | 110 | Risk Ratio (M‐H, Fixed, 95% CI) | 1.0 [0.14, 6.91] |
| 4 Feeling hyperactive Show forest plot | 1 | 46 | Risk Ratio (M‐H, Fixed, 95% CI) | 3.0 [0.13, 70.02] |
| 5 Feeling more awake Show forest plot | 1 | 46 | Risk Ratio (M‐H, Fixed, 95% CI) | 3.0 [0.13, 70.02] |
| 6 Flushed face Show forest plot | 1 | 46 | Risk Ratio (M‐H, Fixed, 95% CI) | 3.0 [0.13, 70.02] |
| 7 Difficulty sleeping Show forest plot | 1 | 46 | Risk Ratio (M‐H, Fixed, 95% CI) | 0.33 [0.01, 7.78] |
| 8 Light‐headedness Show forest plot | 1 | 46 | Risk Ratio (M‐H, Fixed, 95% CI) | 1.0 [0.15, 6.51] |
| 9 Dry mouth Show forest plot | 1 | 46 | Risk Ratio (M‐H, Fixed, 95% CI) | 3.0 [0.13, 70.02] |
| Outcome or subgroup title | No. of studies | No. of participants | Statistical method | Effect size |
| 1 Global improvement rating, marked improvement (fixed‐effect model) Show forest plot | 2 | 365 | Risk Ratio (M‐H, Fixed, 95% CI) | 1.52 [0.99, 2.34] |
| 2 Global improvement rating, moderate to marked improvement (fixed‐effect model) Show forest plot | 2 | 365 | Risk Ratio (M‐H, Fixed, 95% CI) | 1.20 [1.02, 1.41] |