非類固醇類抗發炎藥物用於感冒治療
Abstract
背景
非類固醇類抗發炎藥物(NSAIDs)廣泛使用於治療感冒相關的疼痛和發燒。
目的
評估非類固醇類抗發炎藥物(NSAIDs)相較安慰劑(或是其它治療)於治療感冒病症的功效及安全性。
搜尋策略
搜尋CENTRAL(2015年4月第4期) (1966年至2015年4月的第3週)、EMBASE (1980年1月至2015年4月)、CINAHL (1982年1月至2015年4月)、ProQuest Digital Dissertations (1938年1月至2015年4月)。
選擇標準
納入使用非類固醇類抗發炎藥物治療成人或兒童感冒的隨機對照試驗。
資料收集與分析
由四位作者萃取資料。將試驗區分為以安慰劑作為對照組的研究試驗與非類固醇類抗發炎藥物彼此直接比較(head‐to‐head)的研究試驗。萃取並總結所有鎮痛療效的資料(減少頭痛和肌肉痠痛),非鎮痛療效(減少鼻腔症狀,咳嗽、咳痰及打噴嚏)及副作用。將二分法變項的結果以風險比(risk ratios; RR)與95% 信賴區間(confidence interval; CI)來表示,連續變項的結果以平均差 (mean difference; MD)或標準平均差(standardised mean differences;SMD)來表示。我們採用固定效應模式(fixed‐effect models)和隨機效應模式(random‐effects models)來匯整資料。
主要結果
共收錄了包含1069位受試者的9個非類固醇類抗發炎藥物隨機對照試驗, 37個比較項目:其中6個為非類固醇類抗發炎藥物與安慰劑比較的試驗,另外3個為非類固醇類抗發炎藥物間彼此直接比較的試驗。所納入試驗的總體偏差風險為綜合的。結果分析顯示:使用非類固醇類抗發炎藥物,無法顯著改善感冒的整體症狀(SMD ‐0.40, 95% CI ‐1.03 至 0.24,3個試驗, 隨機效應模式),也不能縮短感冒病程(MD ‐0.23, 95% CI ‐1.75 至 1.29, 2個試驗, 隨機效應模式)。在呼吸症狀方面,能改善打噴嚏症狀(SMD ‐0.44, 95% CI ‐0.75 至 ‐0.12, 2個試驗, 隨機效應模式),卻無法改善咳嗽(SMD ‐0.05, 95% CI ‐0.66 至 0.56, 2個試驗, 隨機效應模式)。在疼痛症狀方面的,使用非類固醇類抗發炎藥對於頭痛、耳朵痛、肌肉與關節疼痛等有顯著的效益。雖然使用非類固醇類抗發炎藥發生不良事件風險並沒有較高(RR 2.94, 95% CI 0.51 至 17.03, 2個試驗, 隨機效應模式),但很難去斷定使用藥物與安慰劑在不良事件產生上沒有差異。由於精確度不夠,證據品質評為“中等”。本次文獻回顧主要的限制為研究結果相當繁雜及針對每一結果的研究數量相當少。
作者結論
非類固醇類抗發炎藥物可以稍微緩解感冒不適,但是沒有明確證據證實可以減輕呼吸道症狀。因此臨床上使用非類固醇類抗發炎藥物治療感冒,仍需謹慎衡量利弊得失。
PICO
Plain language summary
非類固醇類抗發炎藥物用於感冒治療
問題回顧探討使用非類固醇類抗發炎藥物(NSAIDs)治療普通感冒引起的疼痛和相關呼吸道症狀(如咳嗽)成效。
研究背景感冒是人類已知最普遍且常見的疾病。Aspirin、Ibuprofen與Naproxen等非類固醇類抗發炎藥物,具有鎮痛(降低疼痛)與解熱(退燒)的作用。一個多世纪以来,非類固醇類抗發炎藥物被廣泛用來治療普通感冒引起的疼痛和發燒。
研究特色收錄截至2015年4月前使用非類固醇類抗發炎藥物的9個臨床試驗,包括美國、日本、比利時和丹麥等國家,總計1069位受試者(對象有男性女性,同時包括各年齡層如小孩、成人及老年人)。這些研究包含非類固醇類抗發炎藥物彼此直接比較的研究,或非類固醇類抗發炎藥物與沒有活性成分的安慰劑對照比較的研究。
主要研究結果 結果顯示在感冒引起疼痛症狀方面,使用非類固醇類抗發炎藥物可以改善大多數的頭痛、耳朵痛、肌肉與關節疼痛等。但在呼吸症狀方面,卻無明確證據支持使用非類固醇類抗發炎藥物可以改善咳嗽與流鼻水的現象。並有研究指出使用非類固醇類抗發炎藥物後,出現胃腸不適、皮疹與水腫(體液滯留)等副作用。
證據品質 由於精確度不夠,其證據品質評為“中等”。本篇文獻回顧主要的限制為研究的結果相當繁雜,且針對每一結果的研究數量相當少。
結論非類固醇類抗發炎藥物可以稍微緩解感冒不適,但是沒有證據明確證實可以減輕呼吸道症狀。因此臨床上使用非類固醇類抗發炎藥物治療感冒,仍需謹慎衡量利弊得失。
Authors' conclusions
Summary of findings
| Non‐steroidal anti‐inflammatory drugs for the common cold | ||||||
| Patient or population: patients with common cold | ||||||
| Outcomes | Illustrative comparative risks* (95% CI) | Relative effect | No of participants | Quality of the evidence | Comments | |
| Assumed risk | Corresponding risk | |||||
| Control | Non‐steroidal anti‐inflammatory drugs | |||||
| Sum of overall symptom score | — | The mean sum of overall symptom score in the intervention groups was | — | 293 | ⊕⊕⊕⊝ | — |
| Duration of colds | — | The mean duration of colds in the intervention groups was | — | 214 | ⊕⊕⊕⊝ | — |
| Throat irritation score | — | The mean throat irritation score in the intervention groups was | — | 159 | ⊕⊕⊕⊝ | — |
| Headache score | — | The mean headache score in the intervention groups was | — | 159 | ⊕⊕⊕⊝ | — |
| Score of pain in muscles/joints score | — | The mean pain in muscles/joints score in the intervention groups was | — | 0 | See comment | — |
| Cough score | — | The mean cough score in the intervention groups was | — | 159 | ⊕⊕⊕⊝ | — |
| Rhinorrhoea score | — | The mean rhinorrhoea score in the intervention groups was | — | 199 | ⊕⊕⊕⊝ | — |
| *The basis for the assumed risk (e.g. the median control group risk across studies) is provided in footnotes. The corresponding risk (and its 95% confidence interval) is based on the assumed risk in the comparison group and the relative effect of the intervention (and its 95% CI). | ||||||
| GRADE Working Group grades of evidence | ||||||
| 1# NSAIDs group 141, placebo group 152. | ||||||
Background
Description of the condition
The common cold is an acute respiratory tract infection (ARTI) and is the most common and widespread illness known to humans, affecting all age groups. Young children suffer an average of six to eight colds a year, while adults experience approximately two to four colds a year. Although the common cold is usually mild, with symptoms lasting one to two weeks, it is a leading cause of medical visits and days missed from school and work (Heikkinen 2003). Nasal congestion, rhinorrhoea, sneezing and coughing accompanied by general malaise are typical symptoms of the common cold. Over 200 serologically different viral types are responsible for common colds, with the rhinovirus being the most common cause (Eccles 2005).
Description of the intervention
Despite ongoing research into antiviral drugs, there are no effective therapies for the prevention or treatment of the common cold. Therefore, treatment of colds is normally aimed at relieving the symptoms of the illness. Several classes of drugs are currently available, including decongestants, anticholinergics, antihistamines and antitussives. These are effective, to a greater or lesser extent, in treating symptoms of the common cold (AlBalawi 2013; De Sutter 2012; Li 2013; Ostberg 1997; Saraswat 2011; Smith 2014).
How the intervention might work
NSAIDs have been widely used for over a century for the treatment of pain and fever associated with the common cold. Despite their widespread present day use and the long medical history of the use of NSAIDs in relieving pain associated with the common cold, there is a lack of clinical data to support the efficacy of NSAIDs treating this condition. There is some evidence that cold symptoms might be the result of inflammatory mediators such as kinins and prostaglandins, which can be blocked by NSAIDs, rather than the result of the direct cytopathic effects of viruses (Eccles 2005; Gwaltney 2002).
Why it is important to do this review
Several studies have proposed that NSAIDs could be effective in alleviating common cold symptoms, including sneezing and coughing (Sperber 1989; Sperber 1992; Winther 2001). However, no consensus has been reached on this issue. This systematic review is an update of a Cochrane review first published in 2009 (Kim 2009).
Objectives
To determine the effects of NSAIDs versus placebo (and other treatments) on signs and symptoms of the common cold, and to determine any adverse effects of NSAIDs in people with the common cold.
Methods
Criteria for considering studies for this review
Types of studies
We included randomised controlled trials (RCTs) comparing NSAIDs used either alone or in combination with other medications versus placebo and other therapies for the treatment of signs and symptoms of the common cold in adults and children.
Types of participants
We included adults and children with the common cold, who had no other acute illness or severe, chronic conditions. The case definition of the common cold used was: recent onset of symptoms of runny or stuffy nose (or both), and sneezing, with or without symptoms of headache and cough. We excluded participants if they suffered from allergic rhinitis, had a concurrent lower or chronic respiratory infection or another chronic disease, atopic eczema, asthma, fever (> 38 °C), sinusitis or exudative pharyngitis.
Source populations were volunteers from the community, hospital or community outpatient departments, and primary care settings. We accessed additional evidence from studies of healthy volunteers exposed to rhinovirus in experimental conditions.
Types of interventions
NSAIDs versus placebo as a treatment for symptoms of the common cold. We considered variable doses and routes of administration of the NSAID treatments. We included trials that allowed concurrent use of other medications if they permitted equal access for patients in both the NSAIDs and placebo groups (Ta'i 2012).
Types of outcome measures
We did not consider objective assessments such as rhinometry and rhinoscopy.
Primary outcomes
-
Global evaluation of efficacy in the treatment of common cold symptoms.
-
Decrease in the number or duration of individual common cold symptoms. These symptoms were assessed by severity scale.
Secondary outcomes
-
Any reported side effects.
Search methods for identification of studies
Electronic searches
In the previous review we searched the Cochrane Central Register of Controlled Trials (CENTRAL) (2011, Issue 1), which contains the Cochrane Acute Respiratory Infections Group's Specialised Register, MEDLINE (January 1966 to March week 4, 2011), EMBASE (January 1980 to April 2011), CINAHL (January 1982 to April 2011) and ProQuest Digital Dissertations (January 1938 to April 2011).
For 2013 update we searched CENTRAL (2013, Issue 1), which contains the Cochrane Acute Respiratory Infections Group's Specialised Register, MEDLINE (January 2011 to March week 4, 2013), EMBASE (January 2011 to April 2013), CINAHL (January 2011 to April 2013) and ProQuest Digital Dissertations (January 2011 to April 2013).
For this 2015 update, we searched CENTRAL (2015, Issue 4, April), which contains the Cochrane Acute Respiratory Infections Group's Specialised Register, MEDLINE (January 2013 to April week 3, 2015), EMBASE (January 2013 to April 2015), CINAHL (January 2013 to April 2015) and ProQuest Digital Dissertations (January 2013 to April 2015).
See Appendix 1 and Appendix 2 for the EMBASE and CINAHL search strategies and Appendix 3 for the search strategy used for MEDLINE and CENTRAL. We combined the MEDLINE search terms with the highly sensitive search strategy designed by The Cochrane Collaboration for identifying RCTs (Lefebvre 2011). We adapted these search terms to search EMBASE.
We imposed no language or publication restrictions.
Searching other resources
We assessed non‐English language papers and, if necessary and possible, translated them, with the assistance of native language speakers. We searched reference lists of review articles and of all included studies to find other potentially eligible studies. We contacted authors of the included trials to request unpublished studies.
Data collection and analysis
Selection of studies
We used the search strategy detailed above to obtain titles and abstracts of studies that might be relevant to the review. Three review authors (YSM, YJC, YWH) independently screened titles and abstracts and one review author (SYK) collated the results. All review authors participated in resolving discrepancies until a consensus was reached.
Data extraction and management
The same review authors (YSM, YJC, YWH) independently carried out data extraction using standard data extraction forms. We translated studies reported in non‐English language journals before assessment. Where more than one publication of one trial existed, we included only the publication with the most complete data. We resolved disagreements by discussion.
Assessment of risk of bias in included studies
Three review authors (YSM, YJC, YWH) independently assessed the methodological quality of included studies using The Cochrane Collaboration's 'Risk of bias' tool (Higgins 2011). One review author (SYK) collated the results. All review authors participated in resolving discrepancies until a consensus was reached.
Measures of treatment effect
The effect of NSAIDs on common cold signs and symptoms was our primary measure of interest. We expressed results as risk ratios (RRs) with 95% confidence intervals (CIs) for dichotomous outcomes.
We used the standardised mean difference (SMD) where continuous scales of measurement were used to assess the effects of treatment (for example, mean severity scores and time to symptom relief), because different scales were used in most of the trials.
We summarised adverse effects when reported. We calculated the RR with 95% CI for each adverse effect, where possible, either compared to no treatment or to another treatment.
Unit of analysis issues
We split trials including more than two comparisons and analysed them as individual pair‐wise comparisons. By dividing the placebo cases, we ensured that we did not count cases in the placebo group more than once when conducting a meta‐analysis. We had no special issues in the analysis of studies with non‐standard designs.
Dealing with missing data
We attempted to contact the trial authors for additional information if data from the trial reports were unclear or missing. We have excluded data from the meta‐analysis and clearly stated the reason if we judged missing data to render the result uninterpretable.
Assessment of heterogeneity
We assessed heterogeneity amongst trials by using the Chi2 test for heterogeneity (with a 10% level of statistical significance) and the I2 statistic.
We considered other sources of heterogeneity, apart from differences in interventions, namely clinical diversity (children/adults, different classes of NSAIDs and different dosages) and study quality. Heterogeneity in treatments could be related to prior agent(s) used, and the agent, dose and duration of the therapy.
Assessment of reporting biases
There were insufficient trials for us to assess the likelihood of publication bias by examining a funnel plot for asymmetry.
Data synthesis
We pooled data using a fixed‐effect model if there was no significant heterogeneity (I2 statistic < 50%). If there was significant heterogeneity (I2 statistic ≥ 50%), we used the random‐effects model.
Subgroup analysis and investigation of heterogeneity
We intended to conduct subgroup analyses where data were available, for example, by age (adult, child), NSAID class and whether the common cold was artificial or natural.
Sensitivity analysis
We pooled data using the fixed‐effect model but we also analysed the random‐effects model to ensure robustness of the model chosen and susceptibility to outliers.
Results
Description of studies
In the vast majority of studies, the clinical symptoms of the common cold, requirements for inclusion, type and dose of NSAIDs, outcomes of trials and duration of therapy were quite diverse, which caused difficulties in quantitative analysis.
Results of the search
In the previous searches, we identified 60 trials; of these, nine met the inclusion criteria. In this 2015 updated search, we did not identify any potential new trials. All included studies were double‐blinded RCTs. Four of the six trials of community‐acquired colds were multicentre trials.
Included studies
The nine included studies involved 1069 participants suffering from colds. In six studies, 891 participants had community‐acquired colds, and in three studies, 178 participants were experimentally infected with cold viruses. For experimentally infected colds, inoculated populations were analysed. Only 72.5% of experimentally infected participants had cold symptoms. Therefore, we included non‐symptomatic infected participants in this analysis.
Three studies were performed in the USA, four in Japan, and one each in Belgium and Denmark. Trials took place in a total of 154 settings. Most were participants from hospitals, clinics and outpatient departments. One trial involved medical students and university staff. Three trials of experimentally infected colds did not report the trial setting. One trial involved mainly students and two trials reported participants only as volunteers.
Five trials compared NSAIDs with a placebo, three trials compared one NSAID with another, and one trial compared two NSAIDs with a placebo.
Five studies used ibuprofen, two used aspirin and two studies used loxoprofen. Ketoprofen, fenoprofen, fentiazac and naproxen were used in one study. Seven trials used visually identical capsules, one trial used a double‐dummy method and one trial used coded vials. The duration of treatment varied from a single dose to two daily doses for seven days.
Three studies used a general symptom score and five studies used a symptom severity score.
The Characteristics of included studies table includes a summary of the randomisation process, cold acquisition route, inclusion criteria, population, interventions and comparisons, outcome measures, adverse events and methodological quality.
Excluded studies
We excluded 51 trials: four studies were not randomised or the randomisation allocation was unclear; one study included febrile participants; 46 studies included participants with diagnoses other than common colds (see Characteristics of excluded studies table).
Risk of bias in included studies
The overall risk of bias in the included studies was mixed, largely due to missing information regarding randomisation procedures. We assessed two studies as being of high quality (Goto 2007; Ryan 1987).
Allocation
Out of the nine included studies (Goto 2007; Graham 1990; Itoh 1980; Katsu 1993; Nagaoka 1980; Ryan 1987; Sperber 1989; Sperber 1992; Winther 2001), two studies used a computer‐generated random numbers table to generate the allocation sequence (Goto 2007; Ryan 1987). The remaining studies contained insufficient information about the sequence generation process.
In four studies the allocation method was adequately concealed (Goto 2007; Itoh 1980; Nagaoka 1980; Ryan 1987). In two Japanese studies the randomisation process was carried out by two controllers who retained the key codes (Itoh 1980; Nagaoka 1980). In the remaining two studies, treatment was allocated by a third party (Goto 2007), or considered adequately concealed because the single oral dose was administered using a double‐blind method (Ryan 1987).
Blinding
All studies were described as 'double‐blind' and considered 'adequate'; either the active drug and placebo were identical, or an 'identical capsule double‐dummy' method was used.
Incomplete outcome data
Among the included studies, eight adequately addressed incomplete outcome data (Goto 2007; Graham 1990; Itoh 1980; Nagaoka 1980; Ryan 1987; Sperber 1989; Sperber 1992; Winther 2001). Three experimental rhinovirus cold trials excluded participants who were not infected, in which case the reason for exclusion may be justifiable (Graham 1990; Sperber 1989; Sperber 1992). In six studies the number of withdrawals was zero or very small (Itoh 1980; Nagaoka 1980; Ryan 1987; Sperber 1989; Sperber 1992; Winther 2001). One study had insufficient information to permit judgement of 'low risk' or 'high risk' of bias (Katsu 1993).
Selective reporting
We considered all studies as having 'unclear' risk of bias as all trials failed to include the study protocol. They had insufficient information to permit a judgement of either 'low risk' or 'high risk' of bias.
Other potential sources of bias
Amongst the included studies, none were stopped early or had reported claims of fraudulence against them. One study did not contain data to assess the baseline balance (Winther 2001). The overall quality of studies was mixed, largely due to missing information regarding randomisation procedures (Figure 1; Figure 2).

'Risk of bias' graph: review authors' judgements about each methodological quality item presented as percentages across all included studies
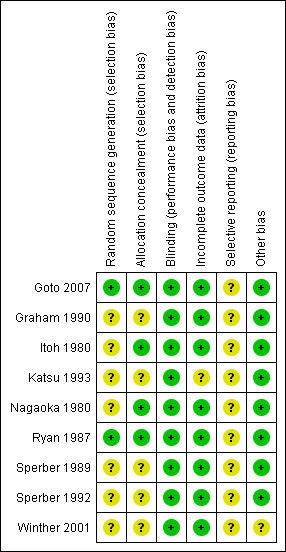
'Risk of bias' summary: review authors' judgements about each methodological quality item for each included study
Effects of interventions
In total, we identified 37 outcomes. Eight studies assessed effectiveness and five studies assessed adverse effects. Twenty‐one (56.7%) of the 37 outcomes were assessed only by a single trial. Among the 16 outcomes assessed by two trials or more, six outcomes had an I2 statistic of ≥ 50% (overall symptom score, duration of colds, cough score, headache score, chills score and overall side effects).
Outcomes included in the meta‐analyses
One trial reported the daily symptom scores during six post‐challenge days and a six‐day cumulative symptom score (Sperber 1992). Other trials reported cumulative symptom scores, therefore we included the cumulative symptom score in the meta‐analysis for comparison.
One trial reported cumulative symptom scores for individual symptoms, such as rhinorrhoea and nasal obstruction, as well as cumulative symptom scores for individual areas (that is, nasal symptom score) (Sperber 1989). To prevent double counting and to compare data, we included only cumulative symptom scores of individual symptoms in the meta‐analysis.
Graham 1990 used aspirin (4 g/day) and ibuprofen (1.2 g/day). The dose of ibuprofen was the usual prescribed dose for the common cold and that of aspirin was not, therefore we chose to use the ibuprofen group in the meta‐analysis.
Primary outcomes
1. Global evaluation of efficacy in the treatment of common cold symptoms
i. Non‐steroidal anti‐inflammatory drugs (NSAIDs) versus placebo
Three trials assessed the total symptom score improvement of NSAIDs on the course of the common cold (Goto 2007; Sperber 1989; Sperber 1992). The first trial included 40 young adults and compared the effect of ibuprofen at a dose of 200 mg/four times a day for five days with that of a placebo (Sperber 1989). During six post‐challenge days, the daily total symptom score was not significantly different between the two groups. The second trial included 79 young adults and compared naproxen at a dose ranging from 3.0 g to 5.0 g for five days with placebo (Sperber 1992). The total five‐day symptom score judged by the modified Jackson criteria was reduced by 29% (95% confidence interval (CI) 16% to 42%) in the naproxen group compared with the placebo group. The third trial included 174 adults and compared the effects of loxoprofen at a dose of 60 mg/twice a day for seven days with placebo (Goto 2007). Duration of illness, number of days with limited daily activities and total symptom score were not significantly different between the two groups. We conducted a meta‐analysis of data from the three trials. The results of the pooled analysis were not significant (standardised mean difference (SMD) ‐0.40, 95% CI ‐1.03 to 0.24, random‐effects model) (Analysis 1.1) and there was heterogeneity (I2 statistic = 83%).
Two trials assessed the duration of colds (Goto 2007; Sperber 1989). The results of the pooled analysis were not significant (mean difference (MD) ‐0.23, 95% CI ‐1.75 to 1.29, random‐effects model) (Analysis 1.3) and there was heterogeneity (I2 statistic = 80%).
One trial assessed the proportion of patients with symptoms of moderate to marked severity; no significant effect was detected (Sperber 1989).
ii. Head‐to‐head comparisons
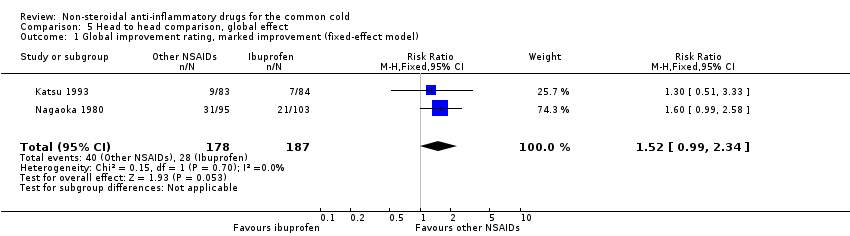
Three trials involving participants with natural colds assessed the effect of one NSAID compared to other NSAID and ranked the severity of global symptoms on a five‐ to seven‐point scale; all three trials were performed in Japan (Itoh 1980; Katsu 1993; Nagaoka 1980).
Nagaoka 1980, which involved 222 participants, compared fentiazac (300 mg/day) with ibuprofen (600 mg/day). Katsu 1993 involved 167 participants and compared loxoprofen (80 mg/day) with ibuprofen (600 mg/day). Itoh 1980 enrolled 184 participants with upper respiratory tract infections and compared aspirin with ketoprofen. Itoh 1980 reported that there was no statistically significant difference between the groups in a subgroup analysis for the population with common colds, but the estimates and the number of participants included in the study population were not reported. Therefore, we could not use this result in a pooled analysis of efficacy.
Marked improvement and moderate to marked improvement (on a global improvement rating) were significant in only one study (Nagaoka 1980).
2. Decrease in the number or duration of individual common cold symptoms
i. NSAIDs versus placebo: analgesic effects
Two trials measured nine outcomes evaluating the analgesic effects of NSAIDs (Sperber 1992; Winther 2001). The types of NSAIDs and the scale of outcomes differed between these studies.
As mentioned above, Sperber 1992 assessed the effect of naproxen in participants with an experimental cold and reported daily symptom scores and total (five‐day) symptom scores. Winther 2001 enrolled 80 participants with natural colds. The effect of ibuprofen at a dose of 400 mg/three times a day for three days was studied and the severity of symptoms was then ranked on a four‐point scale (not present, mild, moderate, severe) and a three‐day cumulative symptom score was reported.
Firstly, the cumulative throat irritation score was used in two trials (Sperber 1992; Winther 2001). In Sperber 1992, total (five‐day) and daily throat scores were not significantly different between the treatment groups. In Winther 2001, the total throat irritation/pain score was not significantly different between the treatment groups. As expected, the results of the pooled analysis were not significant (SMD ‐0.01, 95% CI ‐0.33 to 0.30, fixed‐effect model) (Analysis 2.1) and there was no heterogeneity.
Secondly, cumulative headache scores were reported in the same two trials (Sperber 1992; Winther 2001). All trials reported that headache scores were significantly lower in the NSAIDs groups than in the placebo groups. In a pooled analysis, NSAIDs significantly reduced headache scores (SMD ‐0.65, 95% CI ‐1.11 to ‐0.19, random‐effects model) (Analysis 2.2); there was marginal heterogeneity (I2 statistic = 51%).
Thirdly, cumulative pain scores in the muscles and joints were also reported in these two trials (Sperber 1992; Winther 2001). In Winther 2001, the pain score in muscles and joints did not differ significantly between the treatment groups. In Sperber 1992, the myalgia score was significantly reduced in the naproxen group. In a pooled analysis, NSAIDs significantly reduced the score for pain in muscles and joints (SMD ‐0.40, 95% CI ‐0.77 to ‐0.03, fixed‐effect model) (Analysis 2.3); there was no heterogeneity.
Fourthly, the two studies assessed a cumulative malaise score (Sperber 1992; Winther 2001). All trials reported that the malaise score was not significantly different between the two treatment groups. However, in a pooled analysis there was a trend towards reduction of malaise (SMD ‐0.29, 95% CI ‐0.6 to 0.03, fixed‐effect model) (Analysis 2.4).
Fifthly, the two studies assessed a cumulative chills score; the results were mixed. One trial reported a significant reduction (Sperber 1992) and the other reported a significant increase (Winther 2001). In a pooled analysis, the statistical significance of the difference disappeared and heterogeneity was detected (SMD ‐0.03, 95% CI ‐1.12 to 1.06, I2 statistic = 91.5%, random‐effects model) (Analysis 2.5).
The cumulative earache score was significantly reduced in the ibuprofen group compared to the placebo group (Winther 2001).
ii. NSAIDs versus placebo: non‐analgesic effects
Four trials measured 15 outcomes irrelevant to the analgesic effect (Graham 1990; Sperber 1989; Sperber 1992; Winther 2001). The scales of outcomes were quite diverse. Three trials tested ibuprofen (Graham 1990; Sperber 1989; Winther 2001) and one trial tested naproxen (Sperber 1992).
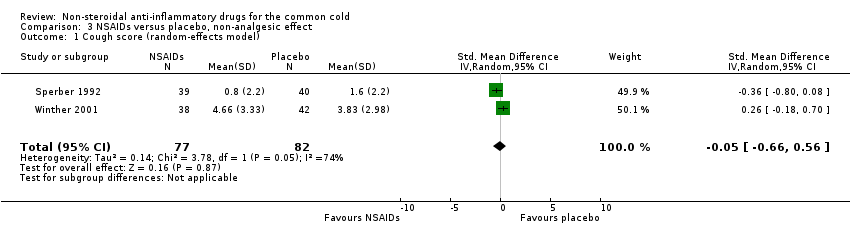
Firstly, two trials reported a cumulative cough score (Sperber 1992; Winther 2001). In Sperber 1992, the cumulative cough score was not significant (0.8 and 1.6, naproxen and placebo, respectively), but the daily score was significantly reduced at four days (P value < 0.01). Winther 2001 evaluated the cumulative cough score, but there was no difference between the groups. The results of a pooled analysis for cumulative cough score were not significant.
Secondly, two trials evaluated a cumulative sneezing score (Sperber 1992; Winther 2001). In Sperber 1992, the cumulative sneezing score was not significant (1.5 and 2.2, naproxen and placebo, respectively) but daily scores were reduced in the naproxen group at one and four days. The statistically insignificant differences between scores were at two and three days. In Winther 2001, the cumulative sneezing score was significantly reduced in the ibuprofen group, and the result of a pooled analysis supported this effect (SMD ‐0.44, 95% CI ‐0.75 to ‐0.12, the P value of the heterogeneity test was 0.44; fixed‐effect model) (Analysis 3.2). Winther also examined the total number of sneezes and the result was significant.
Three trials studied a cumulative rhinorrhoea score and a cumulative nasal obstruction score, and found no differences between the groups (Sperber 1989; Sperber 1992; Winther 2001).
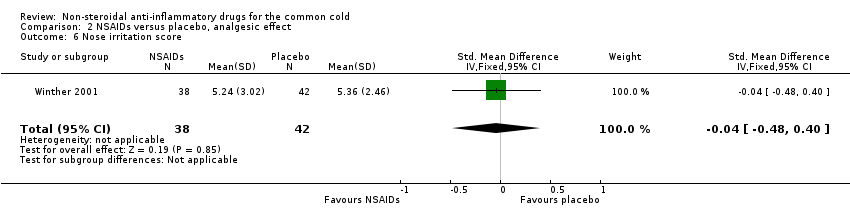
The proportion of nasal obstruction scores greater than five points (Graham 1990), total mucus weight, total tissue count (Sperber 1989), total number of nose blows, cumulative nasal dryness score, cumulative score for reduced sense of smell, cumulative hoarseness score, cumulative fatigue score and cumulative malaise score were quantified in a single study (Winther 2001) and the results were not significantly different between the treatment groups.
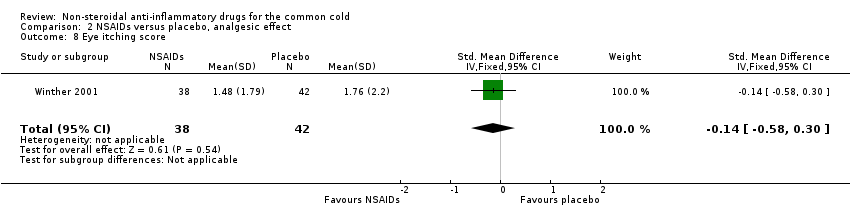
The cumulative nose irritation score, cumulative pain on swallowing score and cumulative eye itching score were also not significantly different between the treatment groups (Winther 2001).
Secondary outcomes
1. Any reported side effects
i. NSAIDs versus placebo: adverse effects
Five trials reported adverse effects. One study reported that adverse effects were more frequent in the loxoprofen group (9.5% versus 1.1%, P value < 0.05) (Goto 2007). Otherwise we could not find any evidence of an increased frequency of adverse effects in the active treatment groups. These outcomes included overall side effects, gastrointestinal complaints and other problems such as rash and oedema.
Two trials assessed the overall side effects of NSAIDs and there was moderate heterogeneity (Goto 2007; Sperber 1989). The results of a pooled analysis for overall side effects was not significant (risk ratio (RR) 2.94, 95% CI 0.51 to 17.03, random‐effects model) (Analysis 4.1). Three trials reported gastrointestinal adverse effects and found no differences between the groups (Ryan 1987; Sperber 1989; Sperber 1992). Lethargy/drowsiness, feeling hyperactive, feeling more awake, flushed face, difficulty sleeping, light‐headedness and dry mouth were reported in one or two trials and the results were not significantly different between the treatment groups.
Discussion
In summary, if non‐steroidal anti‐inflammatory drugs (NSAIDs) are administered to community‐infected or experimentally infected cold patients, their analgesic effect against pain and irritation induced by the cold is relatively effective, but reports on whether they are helpful in relieving respiratory symptoms, such as coughing and sneezing, are not consistent and the evidence is insufficient.
Despite a comprehensive search, only nine studies met the inclusion criteria, six of which were placebo‐controlled randomised controlled trials (RCTs) and three of which were head‐to‐head RCTs. When we evaluated the methodological quality of the included studies using The Cochrane Collaboration's tool for assessing risk of bias (Higgins 2011), the overall quality of studies was mixed, largely due to missing information regarding randomisation procedures. We assessed two studies as being of high quality (Goto 2007; Ryan 1987). Our outcomes were mainly subjective and blinding of participants may be critical. All nine studies were described as 'double‐blind' and considered 'adequate'.
Among the results used to examine the effect of NSAIDs on the common cold, the ones looking at the analgesic effect evaluated headache, throat irritation, muscle and joint pain, ear pain, malaise and chills. Among them, headache, ear pain and muscle and joint pain showed significant results and malaise showed borderline significance. However, throat irritation was not improved, and chills showed mixed results. For some cases where symptoms did not improve, the reasons were uncertain. Whether the cold was community‐acquired or experimentally infected, the trial quality and dose of NSAIDs could not explain the differences. In the case of throat irritation, if the cold was an infection with a rhinovirus, there was the possibility that the treatment was not effective because throat pain disappeared naturally over a short period of time (Heikkinen 2003). There is also the possibility that the mechanism of throat pain may be different from that of headache and muscle pain. In the case of chills, NSAIDs were obviously effective in one trial, but worsened the symptoms in the other trial. Chills are known to happen mainly when the fever has lowered, therefore the measure of improvement may be different from the other symptoms and depend on whether there was a fever before the administration of treatment or not. However, because there was no information on the body temperature before starting the treatment in the two trials, we cannot draw a conclusion on this matter. Apart from these two symptoms, NSAIDs improved most of the analgesia‐related symptoms caused by a cold. Therefore, we recommend the use of NSAIDs for these symptoms.
Three trials studied whether NSAIDs had a comprehensive effect on various symptoms caused by the common cold (Goto 2007; Sperber 1989; Sperber 1992). Two of them were conducted with participants whose cold was experimentally infected by a rhinovirus (Sperber 1989; Sperber 1992). One of those showed a statistically significant difference in the effect of NSAIDs (Sperber 1992), and when we merged the results of the two studies the results were significant. However, one recently published trial reported that the total symptom score showed no significant difference between the two groups (Goto 2007). The results of the pooled analysis were not significant and there was heterogeneity, but the reason for this was unclear.
Among the studies two trials examined whether NSAIDs reduced the duration of a cold (Goto 2007; Sperber 1989). The results of the pooled analysis were not significant and there was heterogeneity. NSAIDs did not have any effect on the severity or duration of a cold. There were only two trials and the number of participants in the studies was small, therefore it is hard to draw a definite conclusion about the effects of NSAIDs on the duration of a cold.
One of the current issues related to the administration of NSAIDs for the common cold is whether NSAIDs are helpful in relieving respiratory symptoms such as cough. Many of the studies on the common cold recommend the administration of NSAIDs to ease coughing caused by a cold (Heikkinen 2003; Irwin 2000). The recently published American College of Chest Physicians (ACCP) guidelines recommend the combined administration of first‐generation antihistamine and nasal decongestant or the administration of naproxen for cough caused by a cold (Pratter 2006). Respiratory symptoms examined in this review were cough, nasal discharge and sneezing. The medication was not effective for cough in two trials and pooled results did not show a significant improvement (Sperber 1992; Winther 2001). None of the three trials showed a significant result for nasal discharge, and pooled results were not significant (Sperber 1989; Sperber 1992; Winther 2001). However, in the case of sneezing, one trial showed a significant improvement and pooled results showed a moderate effect (Winther 2001). Considering these results, which differ from existing guidelines, there is no clear evidence that NSAIDs are effective for coughs caused by a cold, or should be recommended in order to ease cough caused by a cold.
NSAIDs draw attention due to their adverse effects. For some NSAIDs, their long‐term use increases the risk of cardiovascular disease (Matchaba 2004) and may cause gastrointestinal side effects (Ofman 2002). The frequency of gastrointestinal side effects increases in proportion to the dose and period of NSAID medication but the risk of gastrointestinal side effects cannot be excluded with short‐term use (Hernández‐Díaz 2000). In trials included in this review, the risk of side effects was not high but it is difficult to conclude that they are no different from placebo in terms of side effects.
In this review, three trials studied which specific NSAIDs were more effective in treating a cold (Itoh 1980; Katsu 1993; Nagaoka 1980). One study found that fentiazac was more effective than ibuprofen (Nagaoka 1980). However, this is probably because the dose of ibuprofen used in the trial was 600 mg/day, lower than that used in other trials.
The absence of epithelial destruction during rhinovirus infections has led to the idea that the clinical symptoms of the common cold may not be caused by a direct cytopathic effect of the viruses but instead are primarily caused by the inflammatory response of the host by media such as kinins, leukotrienes and histamines (Heikkinen 2003). Accordingly, NSAIDs are believed to ease not only fever and irritation but also respiratory symptoms such as coughing. However, this was not proven in the review. Further research is needed to examine their effects.
For analgesic effects on a cold, acetaminophen was also frequently used along with NSAIDs. However, in this review we did not examine which of the medications was superior in terms of effect and safety. Further research is needed to evaluate this.
Major limitations of this review are that the results of the research are quite diverse and the number of studies for each outcome is quite small. For this reason, it is somewhat difficult to draw clear conclusions.
In conclusion, NSAIDs are recommended for relieving irritation or pain caused by a cold but the notion that NSAIDs are effective in relieving respiratory symptoms such as cough and nasal discharge needs more solid evidence.
Summary of main results
If NSAIDs are administered to community‐infected or experimentally infected cold patients, their analgesic effect against pain and irritation induced by the cold is somewhat effective but reports on whether they are helpful in relieving respiratory symptoms such as coughing and sneezing are not consistent and the evidence is insufficient.
Overall completeness and applicability of evidence
The trials included in the analyses mainly involved young adults of both sexes. Therefore the results of these trials may not be applicable to children and older people.
Quality of the evidence
The quality of evidence was estimated as moderate because of imprecision of the evidence.
Potential biases in the review process
Among the analgesic effect outcomes of NSAIDs, headache, pain in muscles and joints, and earache were statistically significant. However, these findings were mainly based on only two trials.
Agreements and disagreements with other studies or reviews
Two studies (Heikkinen 2003; Irwin 2000) and the ACCP guidelines (Pratter 2006) recommend the administration of NSAIDs for coughs caused by a cold. However, this review concluded that there is no clear evidence that NSAIDs are effective for coughs caused by a cold.
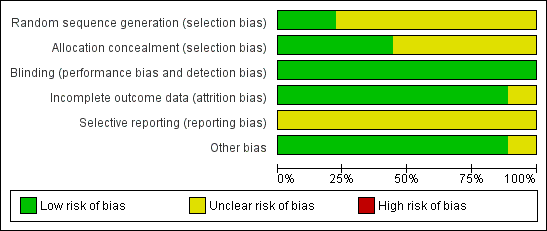
'Risk of bias' graph: review authors' judgements about each methodological quality item presented as percentages across all included studies

'Risk of bias' summary: review authors' judgements about each methodological quality item for each included study

Comparison 1 NSAIDs versus placebo, global effect, Outcome 1 Sum of overall symptom score (random‐effects model).

Comparison 1 NSAIDs versus placebo, global effect, Outcome 2 Moderate to marked severity.

Comparison 1 NSAIDs versus placebo, global effect, Outcome 3 Duration of colds (random‐effects model).
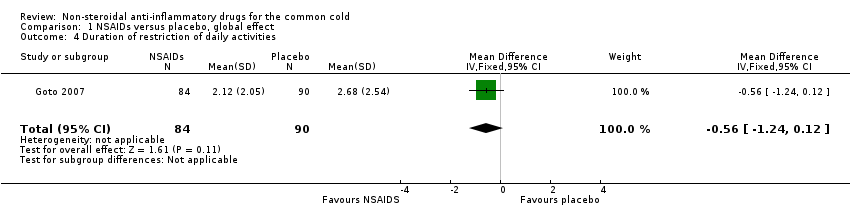
Comparison 1 NSAIDs versus placebo, global effect, Outcome 4 Duration of restriction of daily activities.

Comparison 2 NSAIDs versus placebo, analgesic effect, Outcome 1 Throat irritation score (fixed‐effect model).
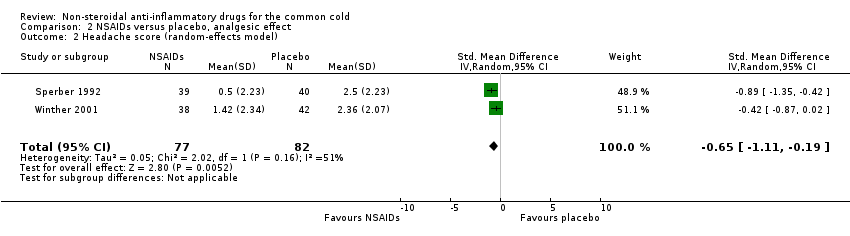
Comparison 2 NSAIDs versus placebo, analgesic effect, Outcome 2 Headache score (random‐effects model).

Comparison 2 NSAIDs versus placebo, analgesic effect, Outcome 3 Score of pain in muscles/joints score (fixed‐effect model).
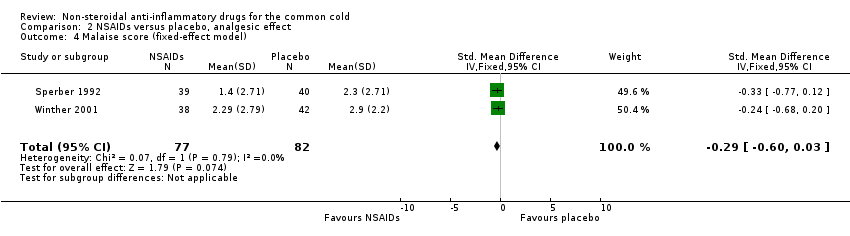
Comparison 2 NSAIDs versus placebo, analgesic effect, Outcome 4 Malaise score (fixed‐effect model).

Comparison 2 NSAIDs versus placebo, analgesic effect, Outcome 5 Chilliness score (random‐effects model).
Comparison 2 NSAIDs versus placebo, analgesic effect, Outcome 6 Nose irritation score.

Comparison 2 NSAIDs versus placebo, analgesic effect, Outcome 7 Score of pain on swallowing.
Comparison 2 NSAIDs versus placebo, analgesic effect, Outcome 8 Eye itching score.

Comparison 2 NSAIDs versus placebo, analgesic effect, Outcome 9 Earache score.
Comparison 3 NSAIDs versus placebo, non‐analgesic effect, Outcome 1 Cough score (random‐effects model).

Comparison 3 NSAIDs versus placebo, non‐analgesic effect, Outcome 2 Sneezing score (fixed‐effect model).

Comparison 3 NSAIDs versus placebo, non‐analgesic effect, Outcome 3 Total number of sneezes.
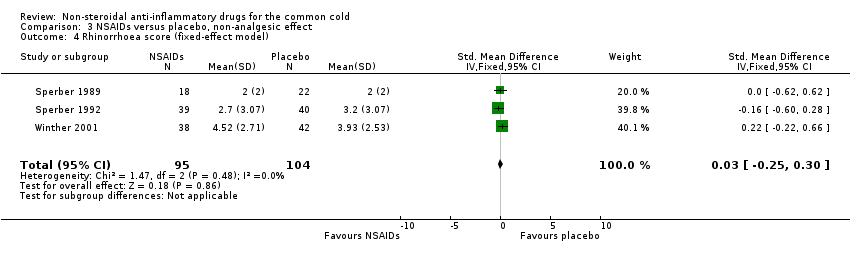
Comparison 3 NSAIDs versus placebo, non‐analgesic effect, Outcome 4 Rhinorrhoea score (fixed‐effect model).

Comparison 3 NSAIDs versus placebo, non‐analgesic effect, Outcome 5 Nasal obstruction score (fixed‐effect model).
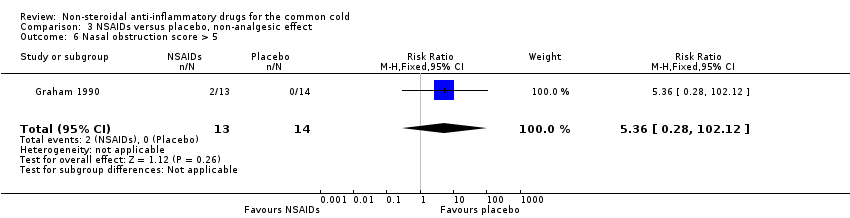
Comparison 3 NSAIDs versus placebo, non‐analgesic effect, Outcome 6 Nasal obstruction score > 5.

Comparison 3 NSAIDs versus placebo, non‐analgesic effect, Outcome 7 Total number of nose blows.

Comparison 3 NSAIDs versus placebo, non‐analgesic effect, Outcome 8 Total mucus weight.

Comparison 3 NSAIDs versus placebo, non‐analgesic effect, Outcome 9 Total tissue number count.

Comparison 3 NSAIDs versus placebo, non‐analgesic effect, Outcome 10 Score of dryness in the nose.
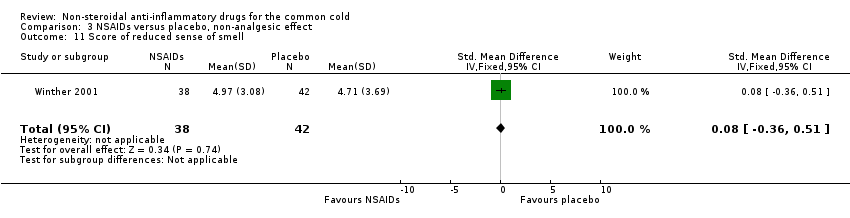
Comparison 3 NSAIDs versus placebo, non‐analgesic effect, Outcome 11 Score of reduced sense of smell.
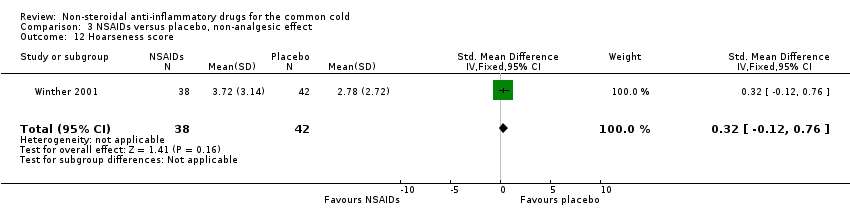
Comparison 3 NSAIDs versus placebo, non‐analgesic effect, Outcome 12 Hoarseness score.

Comparison 3 NSAIDs versus placebo, non‐analgesic effect, Outcome 13 Fatigue score.
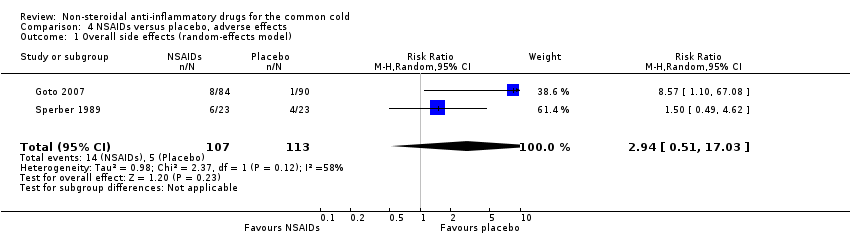
Comparison 4 NSAIDs versus placebo, adverse effects, Outcome 1 Overall side effects (random‐effects model).
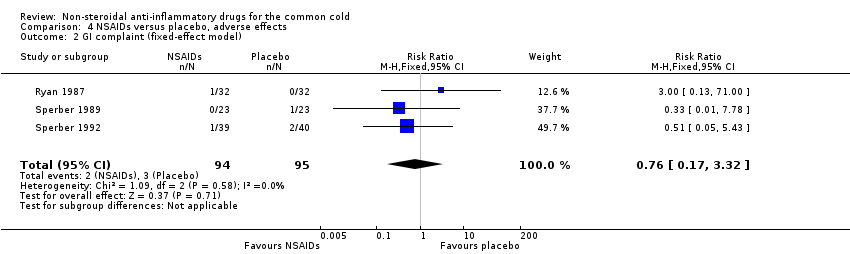
Comparison 4 NSAIDs versus placebo, adverse effects, Outcome 2 GI complaint (fixed‐effect model).
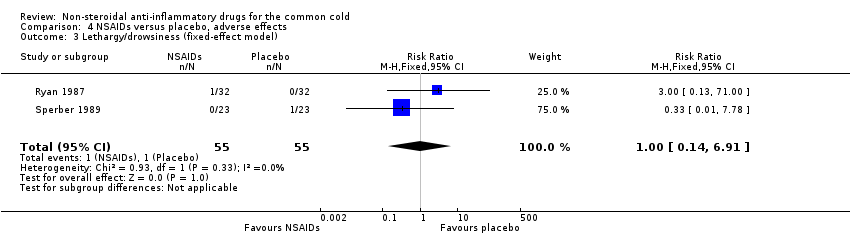
Comparison 4 NSAIDs versus placebo, adverse effects, Outcome 3 Lethargy/drowsiness (fixed‐effect model).
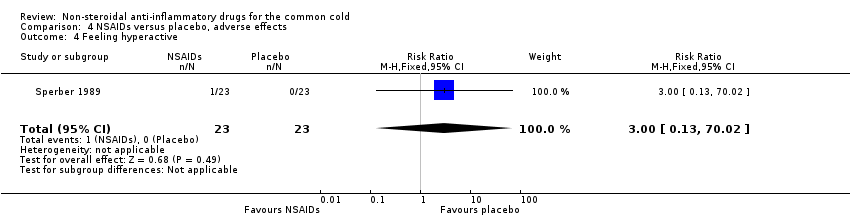
Comparison 4 NSAIDs versus placebo, adverse effects, Outcome 4 Feeling hyperactive.

Comparison 4 NSAIDs versus placebo, adverse effects, Outcome 5 Feeling more awake.
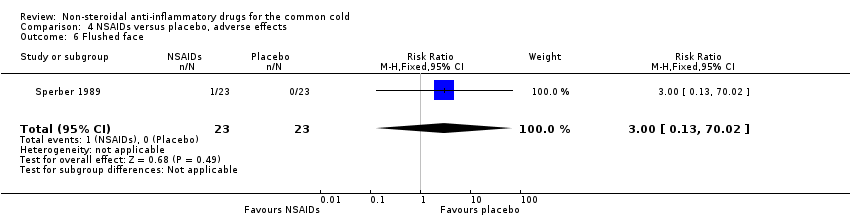
Comparison 4 NSAIDs versus placebo, adverse effects, Outcome 6 Flushed face.

Comparison 4 NSAIDs versus placebo, adverse effects, Outcome 7 Difficulty sleeping.
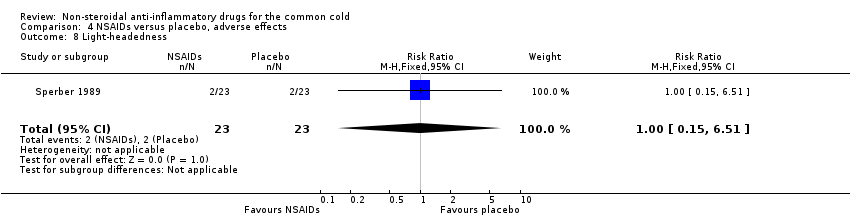
Comparison 4 NSAIDs versus placebo, adverse effects, Outcome 8 Light‐headedness.

Comparison 4 NSAIDs versus placebo, adverse effects, Outcome 9 Dry mouth.
Comparison 5 Head to head comparison, global effect, Outcome 1 Global improvement rating, marked improvement (fixed‐effect model).

Comparison 5 Head to head comparison, global effect, Outcome 2 Global improvement rating, moderate to marked improvement (fixed‐effect model).
| Non‐steroidal anti‐inflammatory drugs for the common cold | ||||||
| Patient or population: patients with common cold | ||||||
| Outcomes | Illustrative comparative risks* (95% CI) | Relative effect | No of participants | Quality of the evidence | Comments | |
| Assumed risk | Corresponding risk | |||||
| Control | Non‐steroidal anti‐inflammatory drugs | |||||
| Sum of overall symptom score | — | The mean sum of overall symptom score in the intervention groups was | — | 293 | ⊕⊕⊕⊝ | — |
| Duration of colds | — | The mean duration of colds in the intervention groups was | — | 214 | ⊕⊕⊕⊝ | — |
| Throat irritation score | — | The mean throat irritation score in the intervention groups was | — | 159 | ⊕⊕⊕⊝ | — |
| Headache score | — | The mean headache score in the intervention groups was | — | 159 | ⊕⊕⊕⊝ | — |
| Score of pain in muscles/joints score | — | The mean pain in muscles/joints score in the intervention groups was | — | 0 | See comment | — |
| Cough score | — | The mean cough score in the intervention groups was | — | 159 | ⊕⊕⊕⊝ | — |
| Rhinorrhoea score | — | The mean rhinorrhoea score in the intervention groups was | — | 199 | ⊕⊕⊕⊝ | — |
| *The basis for the assumed risk (e.g. the median control group risk across studies) is provided in footnotes. The corresponding risk (and its 95% confidence interval) is based on the assumed risk in the comparison group and the relative effect of the intervention (and its 95% CI). | ||||||
| GRADE Working Group grades of evidence | ||||||
| 1# NSAIDs group 141, placebo group 152. | ||||||
| Outcome or subgroup title | No. of studies | No. of participants | Statistical method | Effect size |
| 1 Sum of overall symptom score (random‐effects model) Show forest plot | 3 | 293 | Std. Mean Difference (IV, Random, 95% CI) | ‐0.40 [‐1.03, 0.24] |
| 2 Moderate to marked severity Show forest plot | 1 | 40 | Risk Ratio (M‐H, Fixed, 95% CI) | 0.61 [0.18, 2.11] |
| 3 Duration of colds (random‐effects model) Show forest plot | 2 | 214 | Mean Difference (IV, Random, 95% CI) | ‐0.23 [‐1.75, 1.29] |
| 4 Duration of restriction of daily activities Show forest plot | 1 | 174 | Mean Difference (IV, Fixed, 95% CI) | ‐0.56 [‐1.24, 0.12] |
| Outcome or subgroup title | No. of studies | No. of participants | Statistical method | Effect size |
| 1 Throat irritation score (fixed‐effect model) Show forest plot | 2 | 159 | Std. Mean Difference (IV, Fixed, 95% CI) | ‐0.01 [‐0.33, 0.30] |
| 2 Headache score (random‐effects model) Show forest plot | 2 | 159 | Std. Mean Difference (IV, Random, 95% CI) | ‐0.65 [‐1.11, ‐0.19] |
| 3 Score of pain in muscles/joints score (fixed‐effect model) Show forest plot | 2 | 114 | Std. Mean Difference (IV, Fixed, 95% CI) | ‐0.40 [‐0.77, ‐0.03] |
| 4 Malaise score (fixed‐effect model) Show forest plot | 2 | 159 | Std. Mean Difference (IV, Fixed, 95% CI) | ‐0.29 [‐0.60, 0.03] |
| 5 Chilliness score (random‐effects model) Show forest plot | 2 | 159 | Std. Mean Difference (IV, Random, 95% CI) | ‐0.03 [‐1.12, 1.06] |
| 6 Nose irritation score Show forest plot | 1 | 80 | Std. Mean Difference (IV, Fixed, 95% CI) | ‐0.04 [‐0.48, 0.40] |
| 7 Score of pain on swallowing Show forest plot | 1 | 80 | Std. Mean Difference (IV, Fixed, 95% CI) | ‐0.07 [‐0.51, 0.37] |
| 8 Eye itching score Show forest plot | 1 | 80 | Std. Mean Difference (IV, Fixed, 95% CI) | ‐0.14 [‐0.58, 0.30] |
| 9 Earache score Show forest plot | 1 | 80 | Std. Mean Difference (IV, Fixed, 95% CI) | ‐0.59 [‐1.04, ‐0.14] |
| Outcome or subgroup title | No. of studies | No. of participants | Statistical method | Effect size |
| 1 Cough score (random‐effects model) Show forest plot | 2 | 159 | Std. Mean Difference (IV, Random, 95% CI) | ‐0.05 [‐0.66, 0.56] |
| 2 Sneezing score (fixed‐effect model) Show forest plot | 2 | 159 | Std. Mean Difference (IV, Fixed, 95% CI) | ‐0.44 [‐0.75, ‐0.12] |
| 3 Total number of sneezes Show forest plot | 1 | 80 | Std. Mean Difference (IV, Fixed, 95% CI) | ‐0.51 [‐0.95, ‐0.06] |
| 4 Rhinorrhoea score (fixed‐effect model) Show forest plot | 3 | 199 | Std. Mean Difference (IV, Fixed, 95% CI) | 0.03 [‐0.25, 0.30] |
| 5 Nasal obstruction score (fixed‐effect model) Show forest plot | 3 | 199 | Std. Mean Difference (IV, Fixed, 95% CI) | ‐0.15 [‐0.43, 0.13] |
| 6 Nasal obstruction score > 5 Show forest plot | 1 | 27 | Risk Ratio (M‐H, Fixed, 95% CI) | 5.36 [0.28, 102.12] |
| 7 Total number of nose blows Show forest plot | 1 | 80 | Std. Mean Difference (IV, Fixed, 95% CI) | 0.17 [‐0.27, 0.61] |
| 8 Total mucus weight Show forest plot | 1 | 40 | Std. Mean Difference (IV, Fixed, 95% CI) | 0.13 [‐0.49, 0.76] |
| 9 Total tissue number count Show forest plot | 1 | 40 | Std. Mean Difference (IV, Fixed, 95% CI) | ‐0.20 [‐0.83, 0.42] |
| 10 Score of dryness in the nose Show forest plot | 1 | 80 | Std. Mean Difference (IV, Fixed, 95% CI) | 0.04 [‐0.40, 0.48] |
| 11 Score of reduced sense of smell Show forest plot | 1 | 80 | Std. Mean Difference (IV, Fixed, 95% CI) | 0.08 [‐0.36, 0.51] |
| 12 Hoarseness score Show forest plot | 1 | 80 | Std. Mean Difference (IV, Fixed, 95% CI) | 0.32 [‐0.12, 0.76] |
| 13 Fatigue score Show forest plot | 1 | 80 | Std. Mean Difference (IV, Fixed, 95% CI) | 0.18 [‐0.26, 0.62] |
| Outcome or subgroup title | No. of studies | No. of participants | Statistical method | Effect size |
| 1 Overall side effects (random‐effects model) Show forest plot | 2 | 220 | Risk Ratio (M‐H, Random, 95% CI) | 2.94 [0.51, 17.03] |
| 2 GI complaint (fixed‐effect model) Show forest plot | 3 | 189 | Risk Ratio (M‐H, Fixed, 95% CI) | 0.76 [0.17, 3.32] |
| 3 Lethargy/drowsiness (fixed‐effect model) Show forest plot | 2 | 110 | Risk Ratio (M‐H, Fixed, 95% CI) | 1.0 [0.14, 6.91] |
| 4 Feeling hyperactive Show forest plot | 1 | 46 | Risk Ratio (M‐H, Fixed, 95% CI) | 3.0 [0.13, 70.02] |
| 5 Feeling more awake Show forest plot | 1 | 46 | Risk Ratio (M‐H, Fixed, 95% CI) | 3.0 [0.13, 70.02] |
| 6 Flushed face Show forest plot | 1 | 46 | Risk Ratio (M‐H, Fixed, 95% CI) | 3.0 [0.13, 70.02] |
| 7 Difficulty sleeping Show forest plot | 1 | 46 | Risk Ratio (M‐H, Fixed, 95% CI) | 0.33 [0.01, 7.78] |
| 8 Light‐headedness Show forest plot | 1 | 46 | Risk Ratio (M‐H, Fixed, 95% CI) | 1.0 [0.15, 6.51] |
| 9 Dry mouth Show forest plot | 1 | 46 | Risk Ratio (M‐H, Fixed, 95% CI) | 3.0 [0.13, 70.02] |
| Outcome or subgroup title | No. of studies | No. of participants | Statistical method | Effect size |
| 1 Global improvement rating, marked improvement (fixed‐effect model) Show forest plot | 2 | 365 | Risk Ratio (M‐H, Fixed, 95% CI) | 1.52 [0.99, 2.34] |
| 2 Global improvement rating, moderate to marked improvement (fixed‐effect model) Show forest plot | 2 | 365 | Risk Ratio (M‐H, Fixed, 95% CI) | 1.20 [1.02, 1.41] |