| 1 Leaving the study early: 1. Any reason ‐ by end of therapy Show forest plot | 10 | 761 | Risk Ratio (M‐H, Random, 95% CI) | 1.01 [0.36, 2.84] |
|
| 1.1 short term | 6 | 475 | Risk Ratio (M‐H, Random, 95% CI) | 0.67 [0.11, 3.96] |
| 1.2 medium term | 4 | 286 | Risk Ratio (M‐H, Random, 95% CI) | 1.25 [0.35, 4.43] |
| 2 Leaving the study early: 2. Specific reasons ‐ by end of therapy Show forest plot | 3 | | Risk Ratio (M‐H, Random, 95% CI) | Subtotals only |
|
| 2.1 discharge ‐ short term | 2 | 132 | Risk Ratio (M‐H, Random, 95% CI) | 0.43 [0.07, 2.84] |
| 2.2 discharge ‐ medium term | 1 | 120 | Risk Ratio (M‐H, Random, 95% CI) | 0.33 [0.01, 8.02] |
| 2.3 discharge & lost follow‐up ‐ medium term | 1 | 120 | Risk Ratio (M‐H, Random, 95% CI) | 1.0 [0.15, 6.87] |
| 2.4 relapse ‐ short term | 1 | 82 | Risk Ratio (M‐H, Random, 95% CI) | 3.0 [0.13, 71.56] |
| 2.5 unco‐operative ‐ medium term | 1 | 120 | Risk Ratio (M‐H, Random, 95% CI) | 3.0 [0.32, 28.03] |
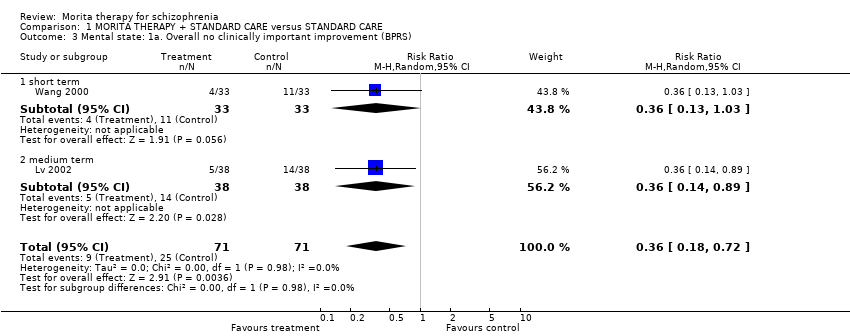
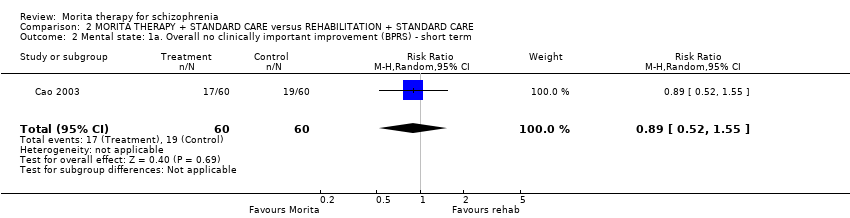
| 3 Mental state: 1a. Overall no clinically important improvement (BPRS) Show forest plot | 2 | 142 | Risk Ratio (M‐H, Random, 95% CI) | 0.36 [0.18, 0.72] |
|
| 3.1 short term | 1 | 66 | Risk Ratio (M‐H, Random, 95% CI) | 0.36 [0.13, 1.03] |
| 3.2 medium term | 1 | 76 | Risk Ratio (M‐H, Random, 95% CI) | 0.36 [0.14, 0.89] |
| 4 Mental state: 1b. Overall average endpoint score (BPRS, high=poor) Show forest plot | 5 | | Mean Difference (IV, Random, 95% CI) | Subtotals only |
|
| 4.1 short term | 3 | 189 | Mean Difference (IV, Random, 95% CI) | ‐4.33 [‐10.28, 1.62] |
| 4.2 medium term | 2 | 124 | Mean Difference (IV, Random, 95% CI) | ‐5.19 [‐9.64, ‐0.74] |
| 5 Mental state: 1c. Overall average endpoint score (BPRS, high=poor, category C studies removed) Show forest plot | 1 | 66 | Mean Difference (IV, Fixed, 95% CI) | ‐1.70 [‐4.21, 0.81] |
|
| 6 Mental state: 1d. Overall average endpoint score change (BPRS, low=poor, data skewed) ‐ short term Show forest plot | | | Other data | No numeric data |
|
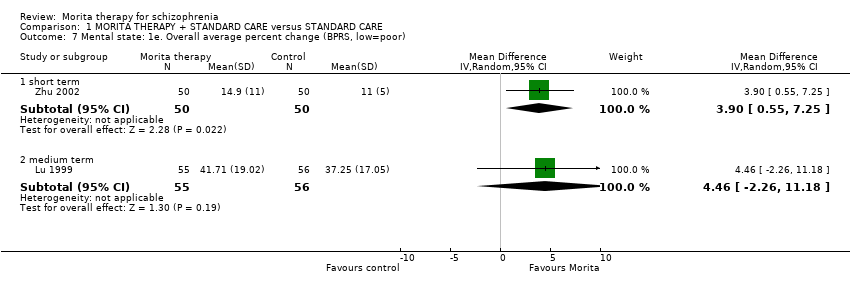
| 7 Mental state: 1e. Overall average percent change (BPRS, low=poor) Show forest plot | 2 | | Mean Difference (IV, Random, 95% CI) | Subtotals only |
|
| 7.1 short term | 1 | 100 | Mean Difference (IV, Random, 95% CI) | 3.90 [0.55, 7.25] |
| 7.2 medium term | 1 | 111 | Mean Difference (IV, Random, 95% CI) | 4.46 [‐2.26, 11.18] |
| 8 Mental state: 1f. Overall average percent change (BPRS, low=poor, data skewed) ‐ short term Show forest plot | | | Other data | No numeric data |
|
| 9 Mental state: 2a. Depressive symptoms ‐ no clinically important improvement (HAMD) ‐ short term Show forest plot | 1 | 104 | Risk Ratio (M‐H, Random, 95% CI) | 0.36 [0.12, 1.07] |
|
| 10 Mental state: 2b. Depression average endpoint score (HAMD, high=poor) ‐ short term Show forest plot | 1 | 104 | Mean Difference (IV, Random, 95% CI) | ‐3.59 [‐5.64, ‐1.54] |
|
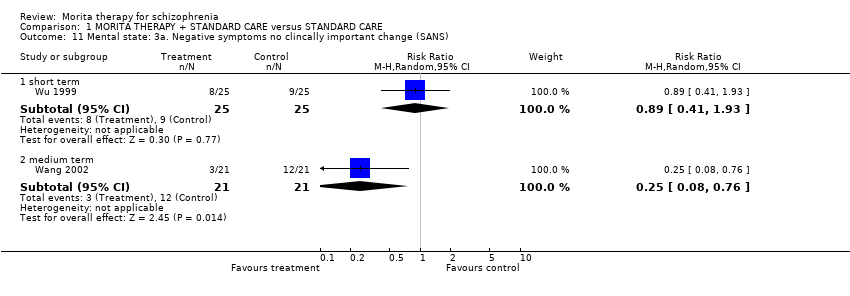
| 11 Mental state: 3a. Negative symptoms no clincally important change (SANS) Show forest plot | 2 | | Risk Ratio (M‐H, Random, 95% CI) | Subtotals only |
|
| 11.1 short term | 1 | 50 | Risk Ratio (M‐H, Random, 95% CI) | 0.89 [0.41, 1.93] |
| 11.2 medium term | 1 | 42 | Risk Ratio (M‐H, Random, 95% CI) | 0.25 [0.08, 0.76] |
| 12 Mental state: 3b. Negative symptoms average endpoint score (SANS, high=poor) Show forest plot | 5 | | Mean Difference (IV, Random, 95% CI) | Subtotals only |
|
| 12.1 short term | 4 | 323 | Mean Difference (IV, Random, 95% CI) | ‐12.94 [‐21.57, ‐4.32] |
| 12.2 medium term | 1 | 76 | Mean Difference (IV, Random, 95% CI) | ‐4.57 [‐8.56, ‐0.58] |
| 13 Mental state: 3c. Negative symptoms average endpoint score (SANS, high=poor, category C study removed) Show forest plot | 2 | | Mean Difference (IV, Fixed, 95% CI) | Subtotals only |
|
| 13.1 short term | 2 | 170 | Mean Difference (IV, Fixed, 95% CI) | ‐4.75 [‐6.45, ‐3.05] |
| 14 Mental state: 3c. Negative symptoms average endpoint score (SANS, high=poor, data skewed) ‐ short term Show forest plot | | | Other data | No numeric data |
|
| 15 Mental state: 3d. Negative symptoms average endpoint score (SANS, high=poor, data skewed) ‐ short term Show forest plot | | | Other data | No numeric data |
|
| 16 Mental state: 3e. Negative symptoms average percent (SANS, low=poor, data skewed) Show forest plot | | | Other data | No numeric data |
|
| 16.1 short term | | | Other data | No numeric data |
| 16.2 medium term | | | Other data | No numeric data |
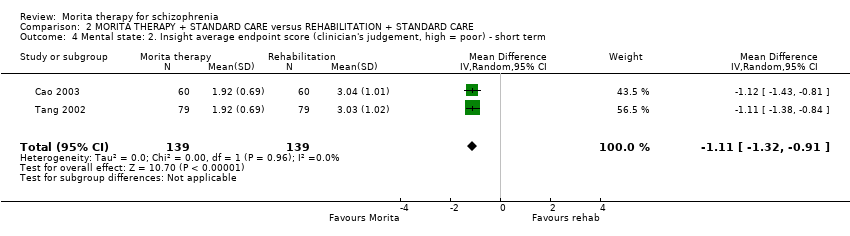
| 17 Mental state: 3f. Insight symptoms average endpoint score (Insight scale, low=poor, data skewed) Show forest plot | | | Other data | No numeric data |
|
| 17.1 short term | | | Other data | No numeric data |
| 18 Quality of life: 1. Overall average percent change (QOLS, low=poor, data skewed) ‐ short term Show forest plot | | | Other data | No numeric data |
|
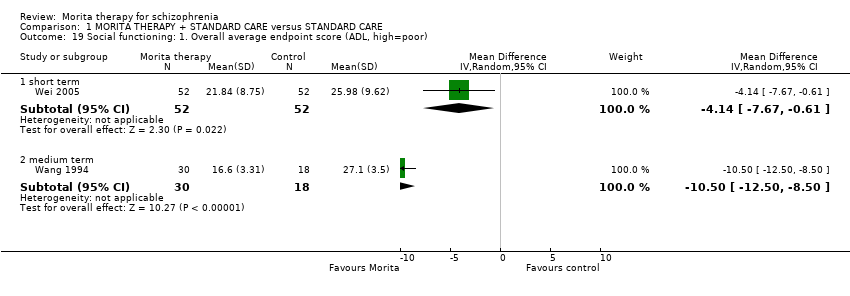
| 19 Social functioning: 1. Overall average endpoint score (ADL, high=poor) Show forest plot | 2 | | Mean Difference (IV, Random, 95% CI) | Subtotals only |
|
| 19.1 short term | 1 | 104 | Mean Difference (IV, Random, 95% CI) | ‐4.14 [‐7.67, ‐0.61] |
| 19.2 medium term | 1 | 48 | Mean Difference (IV, Random, 95% CI) | ‐10.5 [‐12.50, ‐8.50] |
| 20 Social functioning: 2a. Overall average endpoint score (SDSS, high=poor, data skewed) Show forest plot | | | Other data | No numeric data |
|
| 20.1 short term | | | Other data | No numeric data |
| 20.2 medium term | | | Other data | No numeric data |
| 21 Social functioning: 2b. Overall average percent change (SDSS, low=poor) ‐ medium term Show forest plot | 1 | 111 | Mean Difference (IV, Random, 95% CI) | 16.40 [9.71, 23.09] |
|
| 22 Social functioning: 2c. Overall average endpoint score (IPROS, high=poor) ‐ short term Show forest plot | 1 | 80 | Mean Difference (IV, Random, 95% CI) | ‐45.87 [‐50.68, ‐41.06] |
|
| 23 Social functioning: 2d. Overall average percent change (IPROS, low=poor, data skewed) ‐ short term Show forest plot | | | Other data | No numeric data |
|
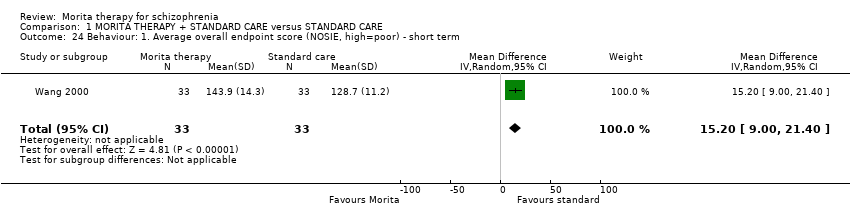
| 24 Behaviour: 1. Average overall endpoint score (NOSIE, high=poor) ‐ short term Show forest plot | 1 | 66 | Mean Difference (IV, Random, 95% CI) | 15.20 [9.00, 21.40] |
|
| 25 Behaviour: 2. Average overall endpoint score (NOSIE, high=poor, data skewed) ‐ short term Show forest plot | | | Other data | No numeric data |
|
| 26 Behaviour: 3. Average change (NOSIE, high=good, data skewed) ‐ short term Show forest plot | | | Other data | No numeric data |
|
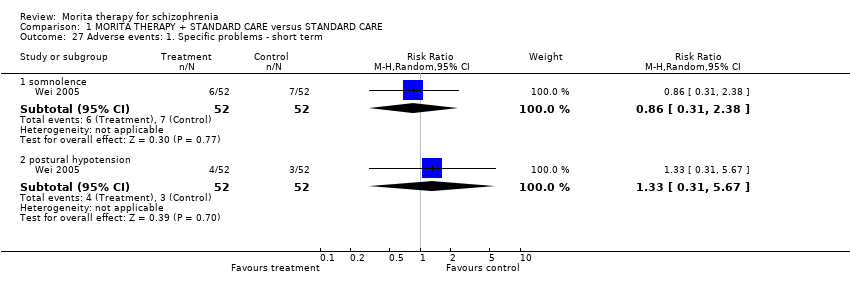
| 27 Adverse events: 1. Specific problems ‐ short term Show forest plot | 1 | | Risk Ratio (M‐H, Random, 95% CI) | Subtotals only |
|
| 27.1 somnolence | 1 | 104 | Risk Ratio (M‐H, Random, 95% CI) | 0.86 [0.31, 2.38] |
| 27.2 postural hypotension | 1 | 104 | Risk Ratio (M‐H, Random, 95% CI) | 1.33 [0.31, 5.67] |
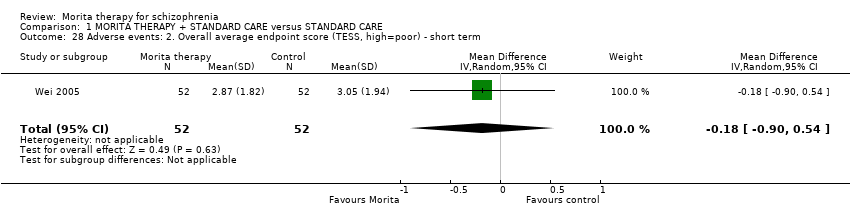
| 28 Adverse events: 2. Overall average endpoint score (TESS, high=poor) ‐ short term Show forest plot | 1 | 104 | Mean Difference (IV, Random, 95% CI) | ‐0.18 [‐0.90, 0.54] |
|