Contenido relacionado
Revisiones y protocolos relacionados
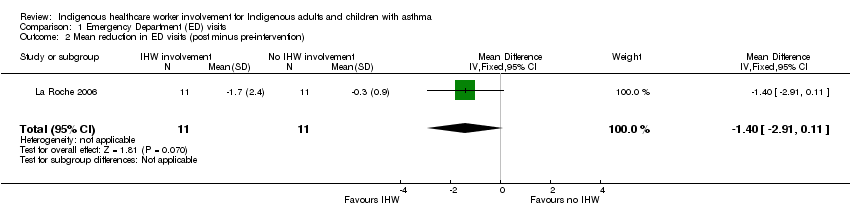
Anne B Chang, Brett Taylor, I Brent Masters, Yancy Laifoo, Alexander DH Brown | 12 mayo 2010
Gabrielle B McCallum, Peter S Morris, Ngiare Brown, Anne B Chang | 22 agosto 2017
Peter G Gibson, Heather Powell, Amanda Wilson, Michael J Abramson, P Haywood, Adrian Bauman, Michael J Hensley, E. Haydn Walters, Jennifer JL Roberts | 22 julio 2002
Timothy L Gatheral, Alison Rushton, David JW Evans, Caroline A Mulvaney, Nathan R Halcovitch, Gemma Whiteley, Fiona JR Eccles, Sally Spencer | 10 abril 2017
Michelle Boyd, Toby J Lasserson, Michael C McKean, Peter G Gibson, Francine M Ducharme, Michelle Haby | 15 abril 2009
Janelle Yorke, Sharon L Fleming, Caroline Shuldham | 25 enero 2006
Brett Toelle, Felix SF Ram | 6 julio 2011
Rebecca Normansell, Kayleigh M Kew, Elizabeth Stovold | 18 abril 2017
Peter G Gibson, Heather Powell, Amanda Wilson, Michael J Hensley, Michael J Abramson, Adrian Bauman, E. Haydn Walters, Jennifer JL Roberts | 21 enero 2002
Fredric Wolf, James P Guevara, Cyril M Grum, Noreen M Clark, Christopher J Cates | 21 octubre 2002