Clozapine digabungkan dengan ubat antipsikotik yang berbeza untuk skizofrenia rintangan rawatan
Appendices
Appendix 1. Methods section of original version (2010)
Criteria for considering studies for this review
Types of studies
We included all relevant randomised controlled trials. We included trials described as 'double‐blind' if it was implied that the study was randomised. For example, if the demographic details of the participants in each group were similar. We excluded quasi‐randomised studies, such as those allocating by using alternate days of the week.
Types of participants
We included people of both sexes, aged 18 years or more, with a diagnosis of treatment‐resistant schizophrenia or related disorders (e.g. schizoaffective disorder, schizophreniform disorder), however diagnosed. There is no clear evidence that the schizophrenia‐like psychoses are caused by fundamentally different disease processes or require different treatment approaches (Carpenter 1994).
Types of interventions
-
Clozapine plus another antipsychotic drug.
-
Clozapine plus a different other antipsychotic drug.
Any dose and means of administration was acceptable.
Types of outcome measures
Primary outcomes
We divided outcomes into short term (less than three months) medium term (three to 12 months), and long term (over one year).
The primary measure of efficacy was clinical improvement on psychotic symptoms, measured either as a dichotomous outcome (proportions of participants with treatment response as defined by each of the studies), or as a continuous outcome (reported either as endpoint score or change from baseline to endpoint).
1. Clinical response.
1.1. No clinically significant response in global state (dichotomous outcome) ‐ as defined by each of the studies.
1.2. Mean score/change in global state (continuous outcome).
1.3. No clinically significant response on positive symptoms (dichotomous outcome) ‐ as defined by each of the studies.
1.4. Mean score/change in positive symptoms (continuous outcome).
1.5. No clinically significant response on negative symptoms (dichotomous outcome) ‐ as defined by each of the studies.
1.6. Mean score/change in negative symptoms (continuous outcome).
1.7. Use of additional medication (other than anticholinergic drugs) for psychiatric symptoms.
Secondary outcomes
1. Death: suicide or any causes.
2. Leaving the study early (acceptability of treatment), as measured by completion of trial.
3. Extrapyramidal adverse effects.
3.1. Incidence of use of antiparkinson drugs (i.e. anticholinergic drugs).
3.2. Clinically significant extrapyramidal adverse effects ‐ as defined by each of the studies.
3.3. Mean score/change in extrapyramidal adverse effects.
4. Blood adverse affects.
4.1. Blood dyscrasias such as agranulocytosis.
5. Other adverse effects, general and specific.
5.1. Hypersalivation.
5.2. Weight gain.
5.3. Other adverse effects.
6. Service utilisation outcomes.
6.1. Hospital admission.
6.2. Days in hospital.
7. Economic outcomes.
8. Quality of life/satisfaction with care for either recipients of care or carers.
8.1. Significant change in quality of life/satisfaction ‐ as defined by each of the studies.
8.2. Mean score/change in quality of life/satisfaction.
Data collection and analysis
Selection of studies
Material downloaded from electronic sources included details of author, institution, or journal of publication. Two review authors (MB and AC) independently inspected all reports of identified studies. We resolved any disagreement by consensus; however, where doubt remained, we acquired the full article. Two review authors (MB and AC) independently decided whether these then met the review criteria. There was no blinding to the names of authors, institutions, and journal of publication. We resolved any further disagreements by consensus with a third review author (CB) and if disagreement could not be resolved by discussion, we sought further information and added these trials to the list of those awaiting assessment.
Data extraction and management
1. Data extraction
Two review authors (MB and AC) independently extracted data and resolved disagreement by discussion with a third review author (CB). When this was not possible, we sought further information from trial authors.
To facilitate comparison between trials, we converted variables (such as days in hospital) that could be reported in different metrics (mean days per year, per week or per month) to a common metric (e.g. mean days per month).
When insufficient data were provided to identify the original group size (prior to dropouts), we contacted the authors. Where possible, we converted continuous scores into dichotomous data.
2. Management
We extracted the data onto standard, simple forms. Where possible, data were entered into Review Manager 5 in such a way that the area to the left of the 'line of no effect' indicated a 'favourable' outcome for clozapine.
3. Scale‐derived data
Many rating scales are available to measure outcomes in mental health trials (Marshall 2000). These scales vary in quality and many are poorly validated. It is generally accepted that measuring instruments should have the properties of reliability (the extent to which a test effectively measures anything at all) and validity (the extent to which a test measures that which it is supposed to measure) (Rust 1989). Before publication of an instrument, most scientific journals insist that its reliability and validity be demonstrated to the satisfaction of referees. As a minimum standard, data were excluded from unpublished rating scales. In addition, the rating scale should be either: a self report; or completed by an independent rater or relative. We presented rating scale data that were provided by the treating physician but marked them with an (*) to indicate potential bias. More stringent standards for instruments may be set in future editions of this review.
Assessment of risk of bias in included studies
We used the latest version of the Cochrane 'Risk of bias' tool to assess the risk of bias in the included studies. This instrument consists of six items. Two of the items assess the strength of the randomisation process in preventing selection bias in the assignment of participants to interventions: adequacy of sequence generation and allocation concealment. The third item (blinding) assesses the influence of performance bias on the study results. The fourth item assesses the likelihood of incomplete outcome data, which raises the possibility of bias in effect estimates. The fifth item assesses selective reporting, the tendency to preferentially report statistically significant outcomes. It requires a comparison of published data with trial protocols, when such are available. The sixth item refers to other sources of bias that are relevant in certain circumstances, for example, in relation to trial design (methodological issues such as those related to cross‐over designs and early trial termination) or setting. Two review authors independently assessed trial quality in accordance with the Cochrane Handbook for Systematic Reviews of Interventions (Higgins 2008). Where inadequate details of allocation concealment and other characteristics of trials were provided, we contacted the trial authors in order to obtain further information. If the raters disagreed, we made the final rating by consensus with the involvement, if necessary, of another review author.
Measures of treatment effect
1. Binary data
When summation was appropriate with binary outcomes such as improved/not improved, we calculated the risk ratio (RR) statistic with a 95% confidence interval (CI) using a random‐effects model. In addition, as a measure of efficiency, we estimated the number needed to treat for an additional beneficial outcome (NNTB) or harmful outcome (NNTH) from the pooled totals. We calculated the NNTB/NNTH as the inverse of the risk difference.
2. Continuous data
2.1. Summary statistic
For continuous outcomes, we estimated a mean difference (MD) with 95% CI. This analysis was based on the random‐effects model as this takes into account any differences between studies even if there was no statistically significant heterogeneity. If standard deviations were not recorded, we asked authors to supply the data. In the absence of data from the authors, we used the mean standard deviation from other studies (Furukawa 2006). Continuous data may be presented from different scales, rating the same outcome. In this event, we presented all data without summation and inspected the general direction of effect.
2.2. Skewed data
Continuous data on clinical and social outcomes are often not normally distributed. To avoid the pitfall of applying parametric tests to non‐parametric data, we applied the following standards to all data before inclusion:
-
standard deviations and means reported in the paper or obtainable from the authors;
-
when a scale starts from the finite number zero, the standard deviation, when multiplied by two, is less than the mean (as otherwise the mean is unlikely to be an appropriate measure of the centre of the distribution (Altman 1996);
-
if a scale starts from a positive value (such as Positive and Negative Syndrome Scale (PANSS) which can have values from 30 to 210) the calculation described above was modified to take the scale starting point into account. In these cases skew was presented if 2SD > (S ‐ Smin), where S is the mean score and Smin is the minimum score.
Endpoint scores on scales often have a finite start and end point and these rules can be applied to them. When continuous data are presented on a scale which includes a possibility of negative values (such as change on a scale), it is difficult to tell whether data are non‐normally distributed (skewed) or not. We presented skewed data in the 'Other data' tables rather than included in the analysis.
2.3. Endpoint versus change data
For change data (endpoint minus baseline), the situation is even more problematic. In the absence of individual participant data it is impossible to know if data are skewed, though this is likely. According to a previous published review of the Cochrane Schizophrenia Group (Duggan 2005), we presented change data in order to summarise available information. In doing this, it was assumed either that data were not skewed or that the analyses could cope with the unknown degree of skew. Again, without individual participant data it is impossible to test this assumption. Where both change and endpoint data were available for the same outcome category, we presented only endpoint data. We acknowledge that by doing this, much of the published change data could have been excluded, but argue that endpoint data is more clinically relevant and that if change data were to be presented along with endpoint data, it would be given undeserved equal prominence. We contacted authors of studies that only reported change for endpoint figures.
Unit of analysis issues
1. Cluster trials
Studies increasingly employ 'cluster randomisation' (such as randomisation by clinician or practice) but analysis and pooling of clustered data poses problems. Authors often fail to account for intraclass correlation in clustered studies, leading to a 'unit of analysis' error (Divine 1992), whereby P values are spuriously low, CIs unduly narrow and statistical significance overestimated. This causes type I errors (Bland 1997; Gulliford 1999).
Where clustering was not accounted for in primary studies, we presented the data in a table, with a (*) symbol to indicate the presence of a probable unit of analysis error. In subsequent versions of this review, we will seek to contact first authors of studies to obtain intraclass correlation coefficients of their clustered data and to adjust for this by using accepted methods (Gulliford 1999). When clustering was incorporated into the analysis of primary studies, we presented these data as if from a non‐cluster randomised study, but adjusted for the clustering effect.
2. Cross‐over trials
A major concern of cross‐over trials is the carry‐over effect. It occurs if an effect (e.g. pharmacological, physiological, or psychological) of the treatment in the first phase is carried over to the second phase. As a consequence, on entry to the second phase the participants can differ systematically from their initial state despite a washout phase. For the same reason, cross‐over trials are not appropriate if the condition of interest is unstable (Elbourne 2002). As both effects are very likely in schizophrenia, we intended to use data of the first phase of cross‐over studies.
3. Studies with multiple treatment groups
Where a study involved more than two treatment arms, if relevant, the additional treatment arms were presented in comparisons. Where the additional treatment arms were not relevant, these data were not reproduced.
Dealing with missing data
1. Overall loss of credibility
At some degree of loss to follow‐up data must lose credibility (Xia 2009). Since there is no evidence as to the degree of attrition which makes a reasonable analysis of the data possible, we included all trials in the main analysis. If, for a given outcome, more than 50% of the total numbers randomised were not accounted for, we did not present results as such data will be impossible to interpret with authority. However, if more than 50% of those in one arm of a study were lost but the total loss was less than 50%, data were marked with a (*) to indicate the result may be prone to bias.
2. Missing data
When data were missing and the method of 'last observation carried forward' (LOCF) had been used to do an intention‐to‐treat analysis, then we used the LOCF data with due consideration of the potential bias and uncertainty introduced. For studies that did not specify the reasons for people leaving the study early (dropouts), we assumed that these people had no change in clinical outcome variables.
Assessment of heterogeneity
1. Clinical heterogeneity
We considered all the included studies within any comparison to judge clinical heterogeneity.
2. Statistical heterogeneity
2.1. Visual inspection
We visually inspected the graphs to investigate the possibility of statistical heterogeneity.
2.2. Employing the I2 statistic
We investigated heterogeneity between studies by the I2 statistic. This provides an estimate of the percentage of variability due to heterogeneity rather than chance alone. Where the I2 estimate was 50% or greater, we interpreted this as indicating the presence of significant heterogeneity (Higgins 2008). If inconsistency was high, data were not summated, but presented separately.
Assessment of reporting biases
Reporting biases arise when the dissemination of research findings is influenced by the nature and direction of results. We entered data from all identified and selected trials into a funnel graph (trial effect against trial size) in an attempt to investigate the likelihood of overt publication bias (Egger 1997).
Data synthesis
We employed a random‐effects model for analyses throughout. We understand that there is no closed argument for preference for use of fixed‐effect or random‐effects models. The random‐effects method incorporates an assumption that the different studies are estimating different, yet related, intervention effects. This does seem true to us and as a result significant between trial heterogeneity is implemented in the pooled estimate the random‐effects model is usually more conservative in terms of statistical significance. The disadvantage of the random‐effects model is that it puts added weight onto the smaller of the studies ‐ those trials that are most vulnerable to bias.
Subgroup analysis and investigation of heterogeneity
1. Subgroup analysis
No subgroup analysis was planned.
2. Investigation of heterogeneity
If data were clearly heterogeneous we checked that data were correctly extracted and entered and that we had made no unit of analysis errors. If the high levels of heterogeneity remained, we did not undertake a meta‐analysis at this point for if there is considerable variation in results, and particularly if there is inconsistency in the direction of effect, it may be misleading to quote a mean value for the intervention effect. We would have wanted to explore heterogeneity. We prespecified no characteristics of studies that may have been associated with heterogeneity except quality of trial method. If no clear association could be shown by sorting studies by quality of methods, we performed a random‐effects meta‐analysis. Should another characteristic of the studies be highlighted by the investigation of heterogeneity, perhaps some clinical heterogeneity not hitherto predicted but plausible causes of heterogeneity, we discussed these post‐hoc reasons and analysed and presented the data. However, should the heterogeneity be substantially unaffected by use of random‐effects meta‐analysis and no other reasons for the heterogeneity be clear, we presented the final data without a meta‐analysis.
Sensitivity analysis
No sensitivity analysis was planned.
Appendix 2. Previous versions
Plain language summary
Schizophrenia is a severe mental illness affecting 1% of the population throughout the world. The symptoms of schizophrenia are perceptions without cause (hallucinations), fixed false beliefs (delusions) with or without apathy, and slowing of movement or thought. In most Western countries, people who do not respond to the majority of common antipsychotic medicines (called treatment‐resistant people) are tried on the atypical antipsychotic clozapine. If they do not respond to clozapine alone, then another antipsychotic medicine is usually recommended. This review looks at clinical trials which compare the response to a second antipsychotic medicine in people who are treatment resistant, and on clozapine.
In the present review, we looked at 48 studies, only four fulfilled the criteria to be included, the total number of people randomised was 246. Two studies lasted 52 weeks and the other two studies lasted eight weeks, and all compared different second antipsychotic medicines with clozapine (aripiprazole versus haloperidol, risperidone versus sulpiride, risperidone versus ziprasidone, and amisulpride versus quetiapine).
When specific symptoms of schizophrenia were studied, there was change for the better in all groups but no second antipsychotic was significantly better than the one it was compared to. When looking at side effects, people taking sulpiride were slightly more likely to have excessive salivation and weight gain than those taking risperidone. The people in the aripiprazole group showed an advantage in the perception of side effects, when people on clozapine plus aripiprazole were compared to those on clozapine plus haloperidol.
These four trials contained small numbers of people and the results were often not well recorded. Although there is a suggestion that adding a second antipsychotic medicine may improve general functioning and decrease the symptoms of schizophrenia, it is still not possible to say which antipsychotic medicine would help the most. A large, longer and independent trial should be done on people who have not responded completely to clozapine to find the most effective treatment.
(Plain language summary prepared for this review by Janey Antoniou of RETHINK, UK; www.rethink.org)
Appendix 3. Previous searches
Search in 2008
Electronic searches
Cochrane Schizophrenia Group Trials Register
Search methods for identification of studies Electronic searches We searched the Cochrane Schizophrenia Group Trials Register (March 2008) using the phrase:
[((clozapin* or clozaril* or leponex* or denzapin* or zaponex*) in title, abstract and index fields in REFERENCE) OR ((clozapin* or clozaril* or leponex* or denzapin* or zaponex*) in interventions field in STUDY]
This register is compiled by systematic searches of major databases, handsearches, and conference proceedings (see Cochrane Schizophrenia Group module).
MEDLINE
MEDLINE search carried out independently by review authors in November 2008. The MEDLINE (OvidSP) search strategy is below.
| # | Searches | Results | Search type |
| 1 | clozapine.mp. and Clozapine/ | 5550 | Advanced |
| 2 | Schizophrenia/ and schizophrenia.mp | 65799 | Advanced |
| 3 | 1 and 2 | 2388 | Advanced |
| 4 | limit 3 to clinical trial, all | 462 | Advanced |
Searching other resources
1. Reference checking
We checked reference lists of all identified randomised controlled trials.
2. Handsearching
If we found any appropriate journals and conference proceedings relating to clozapine combination strategies for treatment‐resistant schizophrenia, we manually searched these periodicals.
3. Personal communication
We attempted to contact the corresponding author of each included study for information regarding supplemental data and unpublished trials. We contacted a defined list of experts in the field and asked of their knowledge of other studies, published or unpublished, relevant to the review article.
4. Industry
We requested that pharmaceutical companies marketing investigational products provided relevant published and unpublished data.
Search in 2011 and 2012
Electronic searches
1. Cochrane Schizophrenia Group Trials Register
We searched the Cochrane Schizophrenia Group Trials Register (January 2011 and 19 July 2012) using the phrase:
[((*clozapin* or *clozaril* or *leponex* or *denzapin* or *zaponex*) in title, abstract and index fields in REFERENCE) OR ((*clozapin* or *clozaril* or *leponex* or *denzapin* or *zaponex*) in interventions field in STUDY]
This register is compiled by systematic searches of major databases, handsearches, and conference proceedings (see group module).
Searching other resources
1. Reference searching
We checked reference lists of all identified studies for further relevant studies.
2. Personal contact
When appropriate, the first author of each included papers was contacted and additional published and unpublished trials were requested.
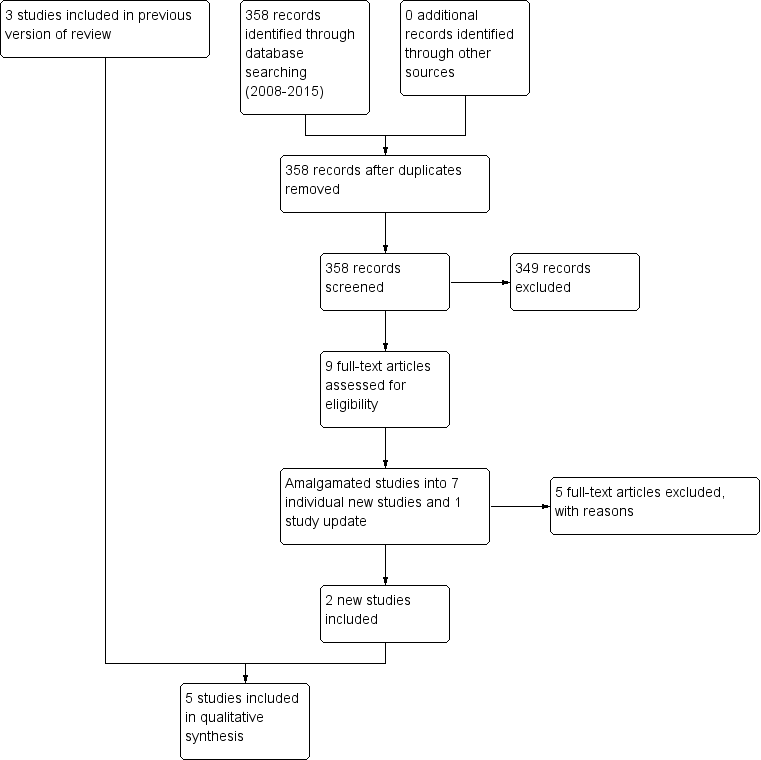
Study flow diagram (2015 update).

Methodological quality graph: review authors' judgements about each methodological quality item presented as percentages across all included studies.

Methodological quality summary: review authors' judgements about each methodological quality item for each included study.

Comparison 1 CLOZAPINE + ARIPIPRAZOLE versus CLOZAPINE + HALOPERIDOL, Outcome 1 Clinical response: mean score/change in mental state: mean change in BPRS score from baseline (high = good).
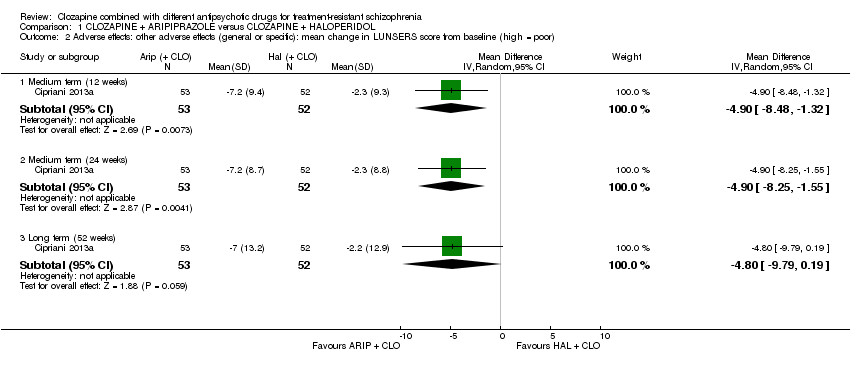
Comparison 1 CLOZAPINE + ARIPIPRAZOLE versus CLOZAPINE + HALOPERIDOL, Outcome 2 Adverse effects: other adverse effects (general or specific): mean change in LUNSERS score from baseline (high = poor).

Comparison 1 CLOZAPINE + ARIPIPRAZOLE versus CLOZAPINE + HALOPERIDOL, Outcome 3 Leaving the study early: acceptability of treatment ‐ as measured by completion of trial.

Comparison 2 CLOZAPINE + AMISULPRIDE versus CLOZAPINE + QUETIAPINE, Outcome 1 Clinical response: 1 mean score/change in global state: mean CGI score (high = poor).
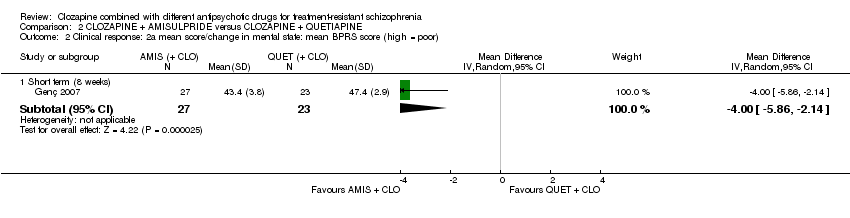
Comparison 2 CLOZAPINE + AMISULPRIDE versus CLOZAPINE + QUETIAPINE, Outcome 2 Clinical response: 2a mean score/change in mental state: mean BPRS score (high = poor).
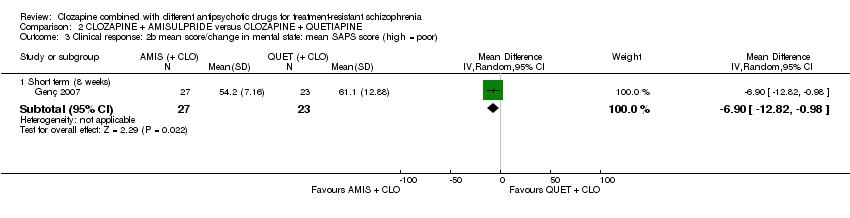
Comparison 2 CLOZAPINE + AMISULPRIDE versus CLOZAPINE + QUETIAPINE, Outcome 3 Clinical response: 2b mean score/change in mental state: mean SAPS score (high = poor).
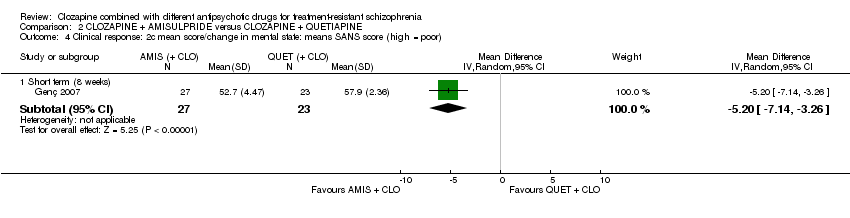
Comparison 2 CLOZAPINE + AMISULPRIDE versus CLOZAPINE + QUETIAPINE, Outcome 4 Clinical response: 2c mean score/change in mental state: means SANS score (high = poor).

Comparison 2 CLOZAPINE + AMISULPRIDE versus CLOZAPINE + QUETIAPINE, Outcome 5 Leaving the study early: acceptability of treatment ‐ as measured by completion of trial.

Comparison 3 CLOZAPINE + RISPERIDONE versus CLOZAPINE + SULPIRIDE, Outcome 1 Clinical response: no clinically significant response in mental state: 20% to 50% reduction in PANSS total score.
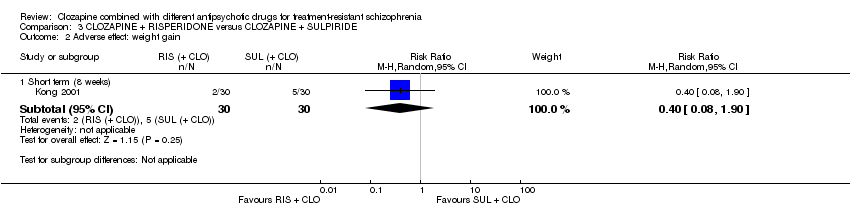
Comparison 3 CLOZAPINE + RISPERIDONE versus CLOZAPINE + SULPIRIDE, Outcome 2 Adverse effect: weight gain.

Comparison 3 CLOZAPINE + RISPERIDONE versus CLOZAPINE + SULPIRIDE, Outcome 3 Clinical response: 2a mean score/change in mental state: mean PANSS total score at endpoint (high = poor).
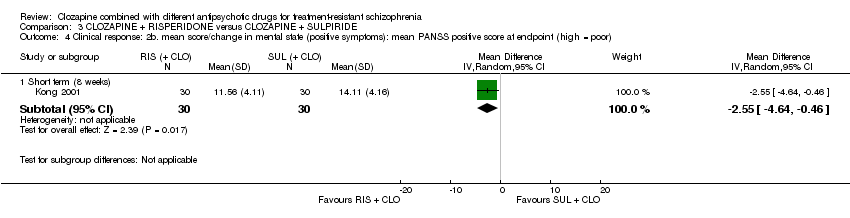
Comparison 3 CLOZAPINE + RISPERIDONE versus CLOZAPINE + SULPIRIDE, Outcome 4 Clinical response: 2b. mean score/change in mental state (positive symptoms): mean PANSS positive score at endpoint (high = poor).
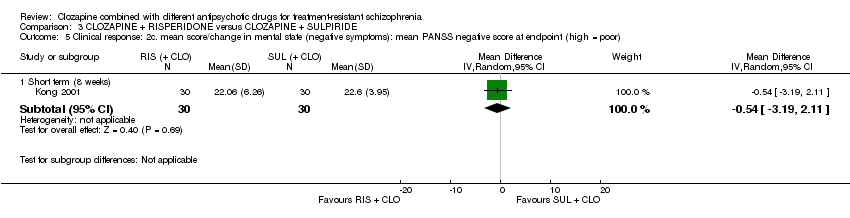
Comparison 3 CLOZAPINE + RISPERIDONE versus CLOZAPINE + SULPIRIDE, Outcome 5 Clinical response: 2c. mean score/change in mental state (negative symptoms): mean PANSS negative score at endpoint (high = poor).

Comparison 3 CLOZAPINE + RISPERIDONE versus CLOZAPINE + SULPIRIDE, Outcome 6 Adverse effects: specific adverse effects: hypersalivation.
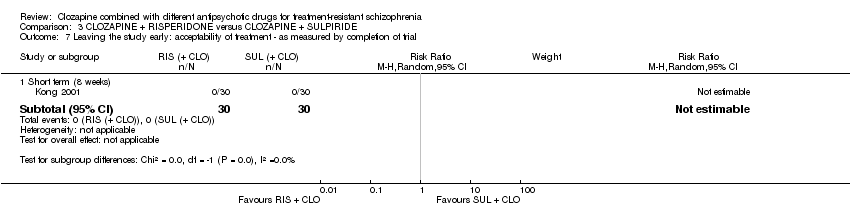
Comparison 3 CLOZAPINE + RISPERIDONE versus CLOZAPINE + SULPIRIDE, Outcome 7 Leaving the study early: acceptability of treatment ‐ as measured by completion of trial.
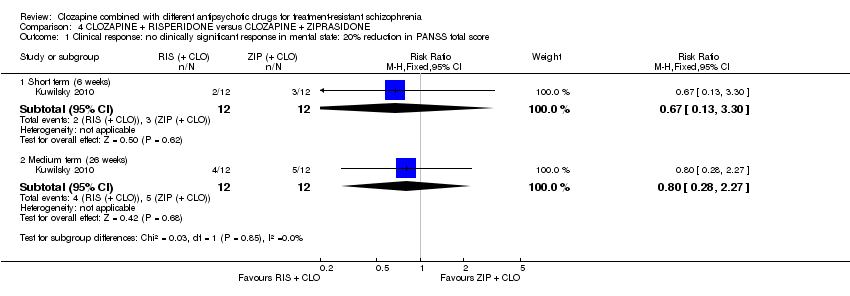
Comparison 4 CLOZAPINE + RISPERIDONE versus CLOZAPINE + ZIPRASIDONE, Outcome 1 Clinical response: no clinically significant response in mental state: 20% reduction in PANSS total score.

Comparison 4 CLOZAPINE + RISPERIDONE versus CLOZAPINE + ZIPRASIDONE, Outcome 2 Clinical response: no clinically significant response in mental state (positive symptoms) 20% reduction in PANSS positive subscore.

Comparison 4 CLOZAPINE + RISPERIDONE versus CLOZAPINE + ZIPRASIDONE, Outcome 3 Clinical response: 1a mean score/change global state: mean CGI subscale score (high = poor).
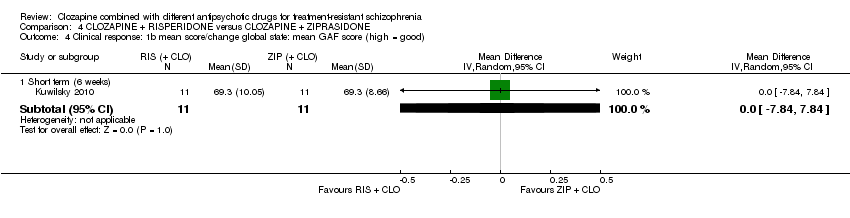
Comparison 4 CLOZAPINE + RISPERIDONE versus CLOZAPINE + ZIPRASIDONE, Outcome 4 Clinical response: 1b mean score/change global state: mean GAF score (high = good).
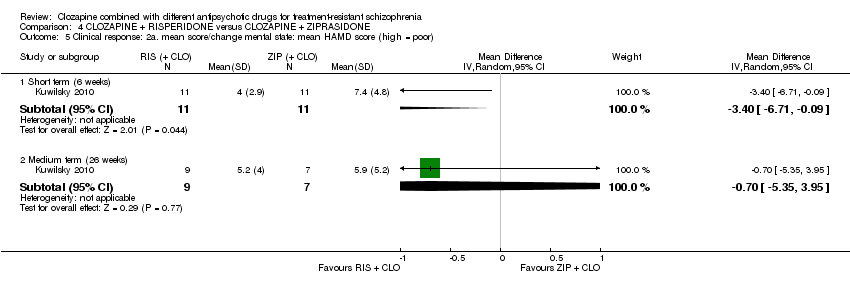
Comparison 4 CLOZAPINE + RISPERIDONE versus CLOZAPINE + ZIPRASIDONE, Outcome 5 Clinical response: 2a. mean score/change mental state: mean HAMD score (high = poor).

Comparison 4 CLOZAPINE + RISPERIDONE versus CLOZAPINE + ZIPRASIDONE, Outcome 6 Clinical response: 2b mean score/change mental state: mean PANSS total score (high = poor).

Comparison 4 CLOZAPINE + RISPERIDONE versus CLOZAPINE + ZIPRASIDONE, Outcome 7 Clinical response: 2c mean score/change in mental state (positive symptoms) mean PANSS positive score (high = poor).
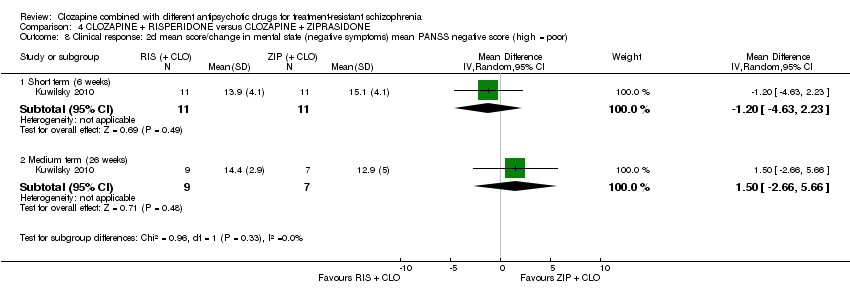
Comparison 4 CLOZAPINE + RISPERIDONE versus CLOZAPINE + ZIPRASIDONE, Outcome 8 Clinical response: 2d mean score/change in mental state (negative symptoms) mean PANSS negative score (high = poor).
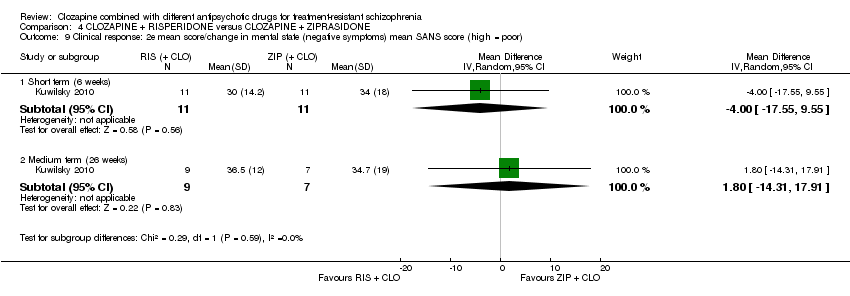
Comparison 4 CLOZAPINE + RISPERIDONE versus CLOZAPINE + ZIPRASIDONE, Outcome 9 Clinical response: 2e mean score/change in mental state (negative symptoms) mean SANS score (high = poor).
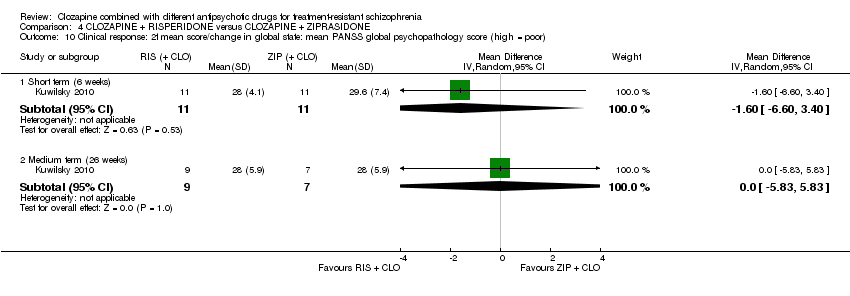
Comparison 4 CLOZAPINE + RISPERIDONE versus CLOZAPINE + ZIPRASIDONE, Outcome 10 Clinical response: 2f mean score/change in global state: mean PANSS global psychopathology score (high = poor).

Comparison 4 CLOZAPINE + RISPERIDONE versus CLOZAPINE + ZIPRASIDONE, Outcome 11 Adverse effects: specific adverse effects: mean score/change in extrapyramidal adverse effects: mean EPS score (high = poor).

Comparison 4 CLOZAPINE + RISPERIDONE versus CLOZAPINE + ZIPRASIDONE, Outcome 12 Adverse effects: other adverse effects (general or specific): mean CGI adverse effect scores (high = poor).

Comparison 4 CLOZAPINE + RISPERIDONE versus CLOZAPINE + ZIPRASIDONE, Outcome 13 Leaving the study early: acceptability of treatment ‐ as measured by completion of trial.

Comparison 5 CLOZAPINE + ZIPRASIDONE versus CLOZAPINE + QUETIAPINE, Outcome 1 Clinical response: 1a. no clinically significant response in mental state: PANSS reduction ≥ 50%.

Comparison 5 CLOZAPINE + ZIPRASIDONE versus CLOZAPINE + QUETIAPINE, Outcome 2 Clinical response: 1b. no clinically significant response in mental state: PANSS reduction ≥ 25%.
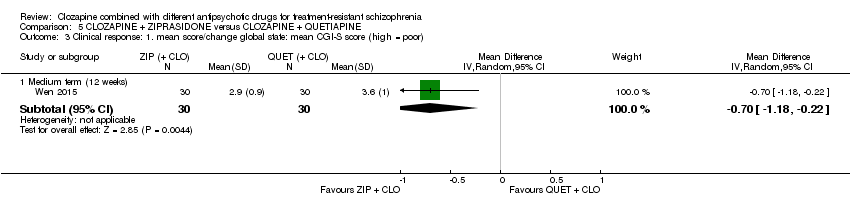
Comparison 5 CLOZAPINE + ZIPRASIDONE versus CLOZAPINE + QUETIAPINE, Outcome 3 Clinical response: 1. mean score/change global state: mean CGI‐S score (high = poor).

Comparison 5 CLOZAPINE + ZIPRASIDONE versus CLOZAPINE + QUETIAPINE, Outcome 4 Clinical response: 2a. mean score/change mental state: mean PANSS total score (high = poor).
Comparison 5 CLOZAPINE + ZIPRASIDONE versus CLOZAPINE + QUETIAPINE, Outcome 5 Clinical response: 2b. mean score/change in mental state (positive symptoms): mean PANSS positive score (high = poor).

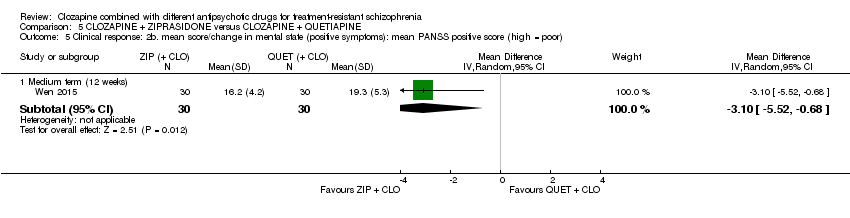
Comparison 5 CLOZAPINE + ZIPRASIDONE versus CLOZAPINE + QUETIAPINE, Outcome 6 Clinical response: 2b. mean score/change in mental state (negative symptoms): mean PANSS negative score (high = poor).

Comparison 5 CLOZAPINE + ZIPRASIDONE versus CLOZAPINE + QUETIAPINE, Outcome 7 Adverse effects: specific adverse effects: mean score/change in extrapyramidal adverse effects: reported extrapyramidal adverse effects.
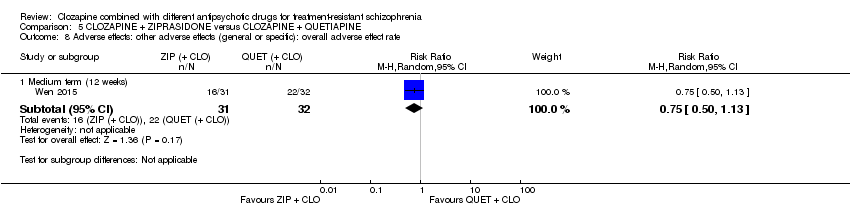
Comparison 5 CLOZAPINE + ZIPRASIDONE versus CLOZAPINE + QUETIAPINE, Outcome 8 Adverse effects: other adverse effects (general or specific): overall adverse effect rate.
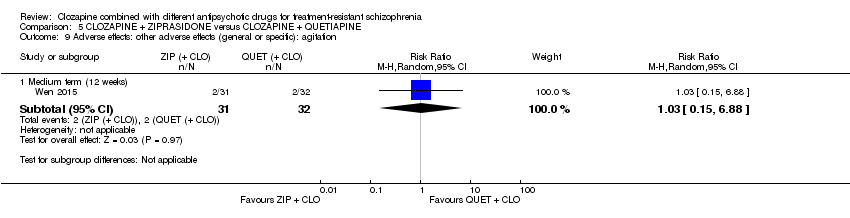
Comparison 5 CLOZAPINE + ZIPRASIDONE versus CLOZAPINE + QUETIAPINE, Outcome 9 Adverse effects: other adverse effects (general or specific): agitation.

Comparison 5 CLOZAPINE + ZIPRASIDONE versus CLOZAPINE + QUETIAPINE, Outcome 10 Adverse effects: other adverse effects (general or specific): constipation.
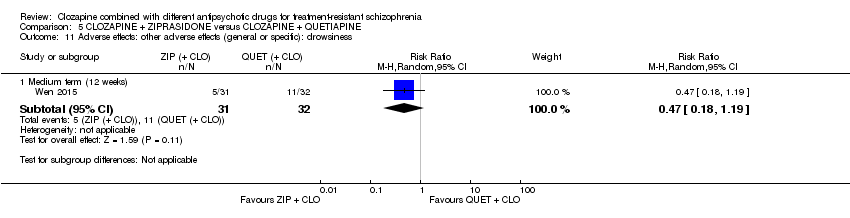
Comparison 5 CLOZAPINE + ZIPRASIDONE versus CLOZAPINE + QUETIAPINE, Outcome 11 Adverse effects: other adverse effects (general or specific): drowsiness.

Comparison 5 CLOZAPINE + ZIPRASIDONE versus CLOZAPINE + QUETIAPINE, Outcome 12 Adverse effects: other adverse effects (general or specific): dry mouth.
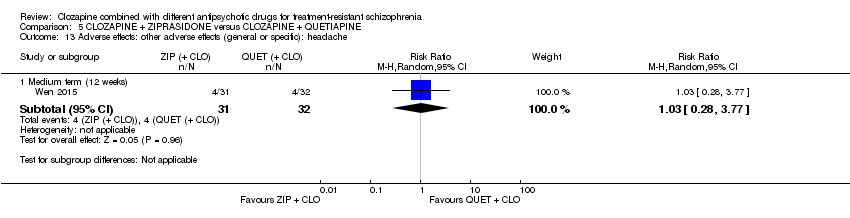
Comparison 5 CLOZAPINE + ZIPRASIDONE versus CLOZAPINE + QUETIAPINE, Outcome 13 Adverse effects: other adverse effects (general or specific): headache.
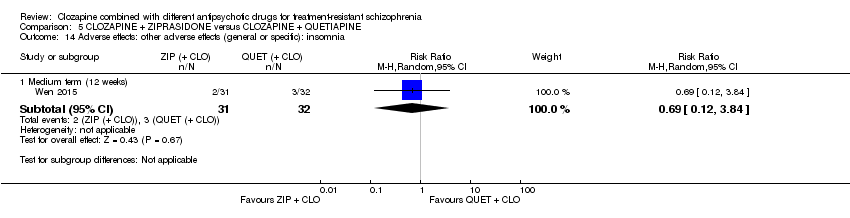
Comparison 5 CLOZAPINE + ZIPRASIDONE versus CLOZAPINE + QUETIAPINE, Outcome 14 Adverse effects: other adverse effects (general or specific): insomnia.

Comparison 5 CLOZAPINE + ZIPRASIDONE versus CLOZAPINE + QUETIAPINE, Outcome 15 Adverse effects: other adverse effects (general or specific): orthostatic hypotension.

Comparison 5 CLOZAPINE + ZIPRASIDONE versus CLOZAPINE + QUETIAPINE, Outcome 16 Adverse effects: other adverse effects (general or specific): tachycardia.

Comparison 5 CLOZAPINE + ZIPRASIDONE versus CLOZAPINE + QUETIAPINE, Outcome 17 Adverse effects: other adverse effects (general or specific): vertigo.
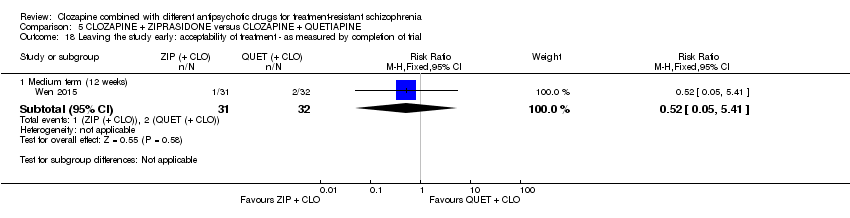
Comparison 5 CLOZAPINE + ZIPRASIDONE versus CLOZAPINE + QUETIAPINE, Outcome 18 Leaving the study early: acceptability of treatment ‐ as measured by completion of trial.
| Methods | Allocation: proper randomisation (e.g. by computer‐generated number sequence) and adequate allocation concealment (e.g. by central randomisation by a third party). Blinding: ideally double blind, but pragmatically blinding the participant and the outcome assessor is adequate. Setting: inpatients and outpatients. Duration: short‐term primary outcome (at 12 weeks), and then medium‐ to long‐term follow‐up (up to 52 week). |
| Participants | Diagnosis: treatment‐resistant schizophrenia, defined by persistent positive symptoms despite at least 6 months of treatment with clozapine ≥ 400 mg/day. N = 200. Sex: men and women. Age: > 18 years. |
| Interventions | 1. Clozapine plus risperidone (or paliperidone). 2. Clozapine plus aripiprazole (or amisulpride). |
| Outcomes | Measure of clinical response to include both dichotomous measures of global (e.g. CGI score) and mental state (e.g. BPRS score). Adverse effects to include weight gain, extrapyramidal symptoms, haematological problems, and hypersalivation. Acceptability assessed by leaving the study early. Service utilisation (e.g. hospital admission). Quality of life/satisfaction measure. |
| Notes | The study should be funded by an independent funding body, such as the National Institute for Health Research or Wellcome Trust. |
| BPRS: Brief Psychiatric Rating Scale; CGI: Clinical Global Impression; n: number of participants. | |
| Clozapine + aripi prazole versus clozapine + haloperidol for treatment‐resistant schizophrenia | ||||||
| Patient or population: people with treatment‐resistant schizophrenia Setting: inpatients and outpatients Intervention: aripiprazole (+ CLO) Comparison: haloperidol (+ CLO) | ||||||
| Outcomes | Anticipated absolute effects* (95% CI) | Relative effect | No of participants | Quality of the evidence | Comments | |
| Risk with haloperidol (+ CLO) | Risk with aripiprazole (+ CLO) | |||||
| Clinical response: no clinically significant response in mental state | See comment | See comment | Not estimable | ‐ | ‐ | No data reported. |
| Adverse effects: weight gain | See comment | See comment | Not estimable | ‐ | ‐ | No data reported. |
| Clinical response: mean score/change in global state | See comment | See comment | ‐ | ‐ | ‐ | No data reported. |
| Clinical response: mean score/change in mental state: change in BPRS score from baseline (high = good), Long term (12 months) | The mean score/change in mental state (change in BPRS from baseline) ‐ long term (12 months) was 0 | The mean score/change in mental state ‐ defined by change in BPRS from baseline ‐ long term (12 months) in the intervention group was 0.9 more (4.38 fewer to 6.18 more) | ‐ | 105 | ⊕⊕⊝⊝ | ‐ |
| Leaving the study early: acceptability of treatment ‐ as measured by completion of trial Long term (12 months) | Study population | RR 1.27 | 106 | ⊕⊝⊝⊝ | ‐ | |
| 283 per 1000 | 359 per 1000 | |||||
| Moderate | ||||||
| 283 per 1000 | 359 per 1000 | |||||
| Service utilisation outcomes: hospital admission or days in hospital | See comment | See comment | Not estimable | ‐ | ‐ | No data reported. |
| Quality of life/satisfaction with care for either recipients of care or carers: significant change in quality of life/satisfaction | See comment | See comment | Not estimable | ‐ | ‐ | No data reported. |
| *The risk in the intervention group (and its 95% confidence interval) is based on the assumed risk in the comparison group and the relative effect of the intervention (and its 95% CI). BPRS: Brief Psychiatric Rating Scale; CI: confidence interval; CLO: clozapine; RCT: randomised controlled trial; RR: risk ratio. | ||||||
| GRADE Working Group grades of evidence | ||||||
| 1 Risk of bias: downgraded by 1 level because high risk for performance bias (open label), but low risk for other biases (selection, detection, attrition, reporting). 2 Inconsistency and publication bias: not applicable (no meta‐analysis). 3 Indirectness: not downgraded because good applicability in terms of participants and interventions and rating scale measures participant‐important outcome (mental state). 4 Imprecision: downgraded by 1 level because underpowered to detect difference. Not downgraded by 2 levels because CI around mean difference did not include appreciable benefit and appreciable harm (total score on BPRS = 126). 5 Indirectness: downgraded by 1 level because leaving the study early a surrogate measure of acceptability of treatment. 6 Imprecision: downgraded by 2 level because underpowered to detect difference and CI around relative effect included appreciable benefit and harm (from less likely to leave study early to over two times more likely to leave study early). | ||||||
| Clozapine + amisulpride versus clozapine + quetiapine for treatment‐resistant schizophrenia | ||||||
| Patient or population: people with treatment‐resistant schizophrenia Setting: inpatients and outpatients Intervention: amisulpride (+ CLO) Comparison: quetiapine (+ CLO) | ||||||
| Outcomes | Anticipated absolute effects* (95% CI) | Relative effect | No of participants | Quality of the evidence | Comments | |
| Risk with quetiapine (+ CLO) | Risk with amisulpride (+ CLO) | |||||
| Clinical response: no clinically significant response in mental state | See comment | See comment | Not estimable | (1 RCT) | ‐ | No data reported. |
| Adverse effects: weight gain | See comment | See comment | Not estimable | (1 RCT) | ‐ | No data reported. |
| Clinical response: mean score/change in global state: mean CGI score (high = poor) Short term (8 weeks) | The mean score/change in global state (CGI) ‐ short term (8 weeks) was 0 | The mean score/change in global state (CGI) ‐ short term (8 weeks) in the intervention group was 0.9 fewer (1.38 fewer to 0.42 fewer) | ‐ | 50 | ⊕⊝⊝⊝ | ‐ |
| Clinical response: mean score/change in mental state: mean BPRS score (high = poor) Short term (8 weeks) | The mean score/change in mental state (BPRS) ‐ short term (8 weeks) was 0 | The mean score/change in mental state (BPRS) ‐ short term (8 weeks) in the intervention group was 4 fewer (5.86 fewer to 2.14 fewer) | ‐ | 50 | ⊕⊕⊝⊝ | ‐ |
| Leaving the study early: acceptability of treatment ‐ as measured by completion of trial | Study population | RR 0.20 | 56 | ⊕⊝⊝⊝ | ‐ | |
| 179 per 1000 | 36 per 1000 | |||||
| Moderate | ||||||
| 179 per 1000 | 36 per 1000 | |||||
| Service utilisation outcomes: hospital admission or days in hospital | See comment | See comment | Not estimable | (1 RCT) | ‐ | No data reported. |
| Quality of life/satisfaction with care for either recipients of care or carers: significant change in quality of life/satisfaction | See comment | See comment | Not estimable | (1 RCT) | ‐ | No data reported. |
| *The risk in the intervention group (and its 95% confidence interval) is based on the assumed risk in the comparison group and the relative effect of the intervention (and its 95% CI). BPRS: Brief Psychiatric Rating Scale; CGI: Clinical Global Impression; CI: confidence interval; CLO: clozapine; RCT: randomised controlled trial; RR: risk ratio. | ||||||
| GRADE Working Group grades of evidence | ||||||
| 1 Risk of bias: downgraded by 2 levels because high risk of reporting bias and unclear (so potentially high) risk of other biases (selection, performance, attrition). 2 Inconsistency and publication bias: not applicable (no meta‐analysis). 3 Indirectness: not downgraded because good applicability in terms of participants and interventions and rating score measures a participant‐important outcome (global state). 4 Imprecision: downgraded by 1 level because underpowered to detect difference. Not downgraded by 2 levels because CI around mean difference did not include appreciable benefit and appreciable harm (total score on CGI = 7). 5 Indirectness: not downgraded because good applicability in terms of participants and interventions and rating score measures a participant‐important outcome (mental state). 6 Imprecision: not downgraded because powered to detect difference and narrow CI. 7 Indirectness: downgraded by 1 level because leaving study early surrogate measure of participant‐important outcome (acceptability of treatment). | ||||||
| Clozapine + risperidone versus clozapine + sulpiride for treatment‐resistant schizophrenia | ||||||
| Patient or population: people with treatment‐resistant schizophrenia Setting: inpatients Intervention: risperidone (+ CLO) Comparison: sulpiride (+ CLO) | ||||||
| Outcomes | Anticipated absolute effects* (95% CI) | Relative effect | No of participants | Quality of the evidence | Comments | |
| Risk with Sulpiride (+ CLO) | Risk with Risperidone (+ CLO) | |||||
| Clinical response: no clinically significant response in mental state: 20% to 50% reduction in PANSS total score | Study population | RR 0.82 | 60 | ⊕⊝⊝⊝ | ‐ | |
| 367 per 1000 | 301 per 1000 | |||||
| Moderate | ||||||
| 367 per 1000 | 301 per 1000 | |||||
| Adverse effects: weight gain | Study population | RR 0.40 | 60 | ⊕⊝⊝⊝ | ‐ | |
| 167 per 1000 | 67 per 1000 | |||||
| Moderate | ||||||
| 167 per 1000 | 67 per 1000 | |||||
| Clinical response: mean score/change in global state | See comment | See comment | ‐ | (1 RCT) | ‐ | No data reported. |
| Clinical response: mean score/change in mental state: mean PANSS total score (high = poor) | The mean score/change in mental state (PANSS total) was 0 | The mean score/change in mental state (PANSS total) in the intervention group was 2.28 undefined fewer (7.41 fewer to 2.85 more) | ‐ | 60 | ⊕⊝⊝⊝ | ‐ |
| Leaving the study early: acceptability of treatment ‐ as measured by completion of trial | Study population | Not estimable | 60 | ⊕⊝⊝⊝ | ‐ | |
| 0 per 1000 | 0 per 1000 | |||||
| Service utilisation outcomes: hospital admission or days in hospital | See comment | See comment | Not estimable | ‐ | ‐ | No data reported. |
| Quality of life/satisfaction with care for either recipients of care or carers: significant change in quality of life/satisfaction | See comment | See comment | Not estimable | ‐ | ‐ | No data reported. |
| *The risk in the intervention group (and its 95% confidence interval) is based on the assumed risk in the comparison group and the relative effect of the intervention (and its 95% CI). CI: confidence interval; CLO: clozapine; PANSS: Positive and Negative Syndrome Scale; RCT: randomised controlled trial; RR: risk ratio. | ||||||
| GRADE Working Group grades of evidence | ||||||
| 1 Risk of bias: downgraded by 2 levels because unclear (so potentially high) risk of biases (selection, performance, detection, reporting). 2 Inconsistency and publication bias: not applicable (no meta‐analysis). 3 Indirectness: downgraded by 1 level because unclear population applicability (inclusion criteria not clearly specified). Not downgraded by 2 levels because rating scale measures participant‐important outcome (mental state). 4 Imprecision: downgraded by 2 levels because underpowered to detect difference and CI around relative effect includes appreciable benefit and harm. 5 Indirectness: downgraded by 1 level because unclear population applicability (inclusion criteria not clearly specified). Not downgraded by 2 levels because weight gain a direct measure of a participant‐important outcome. 6 Indirectness: downgraded by 1 level because unclear population applicability (inclusion criteria not clearly specified). Not downgraded by 2 levels because rating scale measures participant‐important outcome (mental state). 7 Imprecision: downgraded by 1 level because underpowered to detect difference. Not downgraded by 2 levels because CI around mean difference did not include appreciable benefit and appreciable harm (total score on PANSS = 120). 8 Indirectness: downgraded by 2 levels because unclear population applicability (inclusion criteria not clearly specified) and leaving the study early a surrogate measure of acceptability of treatment. 9 Imprecision: downgraded by 1 level because underpowered to detect difference. Not downgraded by 2 levels because no CI. | ||||||
| Clozapine + risperidone versus clozapine + ziprasidone for treatment‐resistant schizophrenia | ||||||
| Patient or population: people with treatment‐resistant schizophrenia Setting: inpatients and outpatients Intervention: risperidone (+ CLO) Comparison: ziprasidone (+ CLO) | ||||||
| Outcomes | Anticipated absolute effects* (95% CI) | Relative effect | No of participants | Quality of the evidence | Comments | |
| Risk with ziprasidone (+ CLO) | Risk with risperidone (+ CLO) | |||||
| Clinical response: no clinically significant response in mental state: 20% reduction in PANSS total score | Study population | RR 0.80 | 24 | ⊕⊝⊝⊝ | ‐ | |
| 417 per 1000 | 333 per 1000 | |||||
| Moderate | ||||||
| 417 per 1000 | 333 per 1000 | |||||
| Adverse effects: weight gain | See comment | See comment | Not estimable | ‐ | ‐ | No SDs reported. |
| Clinical response: mean score/change in global state: mean CGI‐II Global improvement score (high = poor) Short term (6 weeks) | The mean score/change in global state (CGI‐II Global improvement) ‐ short term (6 weeks) was 0 | The mean score/change in global state (CGI‐II global improvement) ‐ short term (6 weeks) in the intervention group was 0.3 fewer (0.82 fewer to 0.22 more) | ‐ | 22 | ⊕⊝⊝⊝ | ‐ |
| Clinical response: mean score/change in mental state: mean PANSS total score (high = poor) Medium term (26 weeks) | The mean score/change in mental state (PANSS total) ‐ medium term (26 weeks) was 0 | The mean score/change in mental state (PANSS total) ‐ medium term (26 weeks) in the intervention group was 1 more (7.91 fewer to 9.91 more) | ‐ | 16 | ⊕⊝⊝⊝ | ‐ |
| Leaving the study early: acceptability of treatment ‐ as measured by completion of trial Long term (52 weeks) | Study population | RR 1.60 | 24 | ⊕⊝⊝⊝ | ‐ | |
| 417 per 1000 | 667 per 1000 | |||||
| Moderate | ||||||
| 417 per 1000 | 667 per 1000 | |||||
| Service utilisation outcomes: hospital admission or days in hospital | See comment | See comment | Not estimable | ‐ | ‐ | No data reported. |
| Quality of life/satisfaction with care for either recipients of care or carers: significant change in quality of life/satisfaction | See comment | See comment | Not estimable | ‐ | ‐ | No data reported. |
| *The risk in the intervention group (and its 95% confidence interval) is based on the assumed risk in the comparison group and the relative effect of the intervention (and its 95% CI). CI: confidence interval; CLO: clozapine; PANSS: Positive and Negative Syndrome Scale; RCT: randomised controlled trial; RR: risk ratio. | ||||||
| GRADE Working Group grades of evidence | ||||||
| 1 Risk of bias: downgraded by 2 levels because high risk of performance bias, detection bias, attrition bias, and reporting bias. 2 Inconsistency and publication bias: not applicable (no meta‐analysis). 3 Indirectness: not downgraded because good applicability in terms of participants and interventions and rating score measures a participant‐important outcome (mental state). 4 Imprecision: downgraded by 2 levels because underpowered to detect difference and CI around relative effect includes appreciable benefit and harm (from less likely to over two times more likely to have no clinical response in mental state defined by PANSS 20% reduction). 5 Indirectness: not downgraded because good applicability (participants and interventions), and rating score measures a participant‐important outcome (global state). 6 Imprecision: downgraded by 1 level because underpowered to detect difference. Not downgraded by 2 levels because CI around mean difference does not include appreciable benefit and appreciable harm (total score on CGI = 7). 7 Imprecision: downgraded by 1 level because underpowered to detect difference. Not downgraded by 2 levels because CI around mean difference does not include appreciable benefit and appreciable harm (total score on PANSS = 120). 8 Indirectness: downgraded by 1 level because leaving the study early a surrogate for participant‐important outcome (acceptability of treatment). 9 Indirectness: downgraded by 2 levels because underpowered to detect difference and CI around relative effect includes appreciable benefit and harm (from less likely to over three times more likely to leave the study early). | ||||||
| Clozapine + ziprasidone versus clozapine + quetiapine for treatment‐resistant schizophrenia | ||||||
| Patient or population: people with treatment‐resistant schizophrenia Setting: inpatients and outpatients Intervention: ziprasidone (+ CLO) Comparison: quetiapine (+ CLO) | ||||||
| Outcomes | Anticipated absolute effects* (95% CI) | Relative effect | No of participants | Quality of the evidence | Comments | |
| Risk with quetiapine (+ CLO) | Risk with ziprasidone (+ CLO) | |||||
| Clinical response: no clinically significant response in mental state: ≥ 50% reduction in PANSS total score Medium term (12 weeks) | Study population | RR 0.54 | 63 | ⊕⊕⊝⊝ | ‐ | |
| 844 per 1000 | 456 per 1000 | |||||
| Moderate | ||||||
| 844 per 1000 | 456 per 1000 | |||||
| Adverse effects: weight gain | See comment | See comment | Not estimable | ‐ | ‐ | No data reported. |
| Clinical response: mean score/change in global state: mean CGI‐S score (high = poor) Medium term (12 weeks) | The mean score/change in global state (CGI‐S) ‐ medium term (12 weeks) was 0 | The mean score/change in global state (CGI‐S) ‐ medium term (12 weeks) in the intervention group was 0.7 fewer (1.18 fewer to 0.22 fewer) | ‐ | 60 | ⊕⊕⊝⊝ | ‐ |
| Clinical response: mean score/change in mental state: mean PANSS total score (high = poor) Medium term (12 weeks) | The mean score/change in mental state (PANSS total) ‐ medium term (12 weeks) was 0 | The mean score/change in mental state (PANSS total) ‐ medium term (12 weeks) in the intervention group was 12.3 fewer (22.43 fewer to 2.17 fewer) | ‐ | 60 | ⊕⊕⊝⊝ | ‐ |
| Leaving the study early: acceptability of treatment ‐ as measured by completion of trial | Study population | RR 0.52 | 63 | ⊕⊝⊝⊝ | ‐ | |
| 63 per 1000 | 33 per 1000 | |||||
| Moderate | ||||||
| 63 per 1000 | 33 per 1000 | |||||
| Service utilisation outcomes: hospital admission or days in hospital | See comment | See comment | Not estimable | ‐ | ‐ | No data reported. |
| Quality of life/satisfaction with care for either recipients of care or carers: significant change in quality of life/satisfaction | See comment | See comment | Not estimable | ‐ | ‐ | No data reported. |
| *The risk in the intervention group (and its 95% confidence interval) is based on the assumed risk in the comparison group and the relative effect of the intervention (and its 95% CI). CGI ‐S: Clinical Global Impression – Severity; CI: confidence interval; CLO: clozapine; PANSS: Positive and Negative Syndrome Scale; RCT: randomised controlled trial; RR: risk ratio; SD: standard deviation. | ||||||
| GRADE Working Group grades of evidence | ||||||
| 1 Risk of bias: downgraded by 2 levels because unclear (so potentially high) risk of biases (selection, performance, reporting). 2 Inconsistency and publication bias: not applicable (no meta‐analysis). 3 Indirectness: not downgraded because good applicability in terms of participants and interventions and rating scale measures a participant‐important outcome (mental state). 4 Imprecision: not downgraded because powered to detect difference and narrow CI. 5 Indirectness: not downgraded because good applicability (participants and interventions) and rating scale measures a participant‐important outcome (global state). 6 Indirectness: downgraded by 1 level because leaving the study early surrogate measure for participant‐important outcome (acceptability of treatment). 7 Imprecision: downgraded by 2 levels because underpowered to detect difference and CI around relative effect includes appreciable benefit and harm (from less likely to leave study early to five times more likely to leave study early). | ||||||
| Outcome or subgroup title | No. of studies | No. of participants | Statistical method | Effect size |
| 1 Clinical response: mean score/change in mental state: mean change in BPRS score from baseline (high = good) Show forest plot | 1 | Mean Difference (IV, Random, 95% CI) | Subtotals only | |
| 1.1 Medium term (12 weeks) | 1 | 105 | Mean Difference (IV, Random, 95% CI) | ‐1.40 [‐5.59, 2.79] |
| 1.2 Medium term (24 weeks) | 1 | 105 | Mean Difference (IV, Random, 95% CI) | ‐0.70 [‐4.81, 3.41] |
| 1.3 Long term (52 weeks) | 1 | 105 | Mean Difference (IV, Random, 95% CI) | 0.90 [‐4.38, 6.18] |
| 2 Adverse effects: other adverse effects (general or specific): mean change in LUNSERS score from baseline (high = poor) Show forest plot | 1 | Mean Difference (IV, Random, 95% CI) | Subtotals only | |
| 2.1 Medium term (12 weeks) | 1 | 105 | Mean Difference (IV, Random, 95% CI) | ‐4.9 [‐8.48, ‐1.32] |
| 2.2 Medium term (24 weeks) | 1 | 105 | Mean Difference (IV, Random, 95% CI) | ‐4.9 [‐8.25, ‐1.55] |
| 2.3 Long term (52 weeks) | 1 | 105 | Mean Difference (IV, Random, 95% CI) | ‐4.8 [‐9.79, 0.19] |
| 3 Leaving the study early: acceptability of treatment ‐ as measured by completion of trial Show forest plot | 1 | Risk Ratio (M‐H, Random, 95% CI) | Subtotals only | |
| 3.1 Medium term (12 weeks) | 1 | 106 | Risk Ratio (M‐H, Random, 95% CI) | 0.88 [0.34, 2.24] |
| 3.2 Medium term (24 weeks) | 1 | 106 | Risk Ratio (M‐H, Random, 95% CI) | 1.17 [0.60, 2.28] |
| 3.3 Long term (52 weeks) | 1 | 106 | Risk Ratio (M‐H, Random, 95% CI) | 1.27 [0.72, 2.22] |
| Outcome or subgroup title | No. of studies | No. of participants | Statistical method | Effect size |
| 1 Clinical response: 1 mean score/change in global state: mean CGI score (high = poor) Show forest plot | 1 | Mean Difference (IV, Random, 95% CI) | Subtotals only | |
| 1.1 Short term (8 weeks) | 1 | 50 | Mean Difference (IV, Random, 95% CI) | ‐0.90 [‐1.38, ‐0.42] |
| 2 Clinical response: 2a mean score/change in mental state: mean BPRS score (high = poor) Show forest plot | 1 | Mean Difference (IV, Random, 95% CI) | Subtotals only | |
| 2.1 Short term (8 weeks) | 1 | 50 | Mean Difference (IV, Random, 95% CI) | ‐4.0 [‐5.86, ‐2.14] |
| 3 Clinical response: 2b mean score/change in mental state: mean SAPS score (high = poor) Show forest plot | 1 | Mean Difference (IV, Random, 95% CI) | Subtotals only | |
| 3.1 Short term (8 weeks) | 1 | 50 | Mean Difference (IV, Random, 95% CI) | ‐6.90 [‐12.82, ‐0.98] |
| 4 Clinical response: 2c mean score/change in mental state: means SANS score (high = poor) Show forest plot | 1 | Mean Difference (IV, Random, 95% CI) | Subtotals only | |
| 4.1 Short term (8 weeks) | 1 | 50 | Mean Difference (IV, Random, 95% CI) | ‐5.20 [‐7.14, ‐3.26] |
| 5 Leaving the study early: acceptability of treatment ‐ as measured by completion of trial Show forest plot | 1 | 56 | Risk Ratio (M‐H, Fixed, 95% CI) | 0.2 [0.02, 1.60] |
| Outcome or subgroup title | No. of studies | No. of participants | Statistical method | Effect size |
| 1 Clinical response: no clinically significant response in mental state: 20% to 50% reduction in PANSS total score Show forest plot | 1 | Risk Ratio (M‐H, Random, 95% CI) | Subtotals only | |
| 1.1 Short term (8 weeks) | 1 | 60 | Risk Ratio (M‐H, Random, 95% CI) | 0.82 [0.40, 1.68] |
| 2 Adverse effect: weight gain Show forest plot | 1 | Risk Ratio (M‐H, Random, 95% CI) | Subtotals only | |
| 2.1 Short term (8 weeks) | 1 | 60 | Risk Ratio (M‐H, Random, 95% CI) | 0.4 [0.08, 1.90] |
| 3 Clinical response: 2a mean score/change in mental state: mean PANSS total score at endpoint (high = poor) Show forest plot | 1 | Mean Difference (IV, Random, 95% CI) | Subtotals only | |
| 3.1 Short term (8 weeks) | 1 | 60 | Mean Difference (IV, Random, 95% CI) | ‐2.28 [‐7.41, 2.85] |
| 4 Clinical response: 2b. mean score/change in mental state (positive symptoms): mean PANSS positive score at endpoint (high = poor) Show forest plot | 1 | Mean Difference (IV, Random, 95% CI) | Subtotals only | |
| 4.1 Short term (8 weeks) | 1 | 60 | Mean Difference (IV, Random, 95% CI) | ‐2.55 [‐4.64, ‐0.46] |
| 5 Clinical response: 2c. mean score/change in mental state (negative symptoms): mean PANSS negative score at endpoint (high = poor) Show forest plot | 1 | Mean Difference (IV, Random, 95% CI) | Subtotals only | |
| 5.1 Short term (8 weeks) | 1 | 60 | Mean Difference (IV, Random, 95% CI) | ‐0.54 [‐3.19, 2.11] |
| 6 Adverse effects: specific adverse effects: hypersalivation Show forest plot | 1 | Risk Ratio (M‐H, Random, 95% CI) | Subtotals only | |
| 6.1 Short term (8 weeks) | 1 | 60 | Risk Ratio (M‐H, Random, 95% CI) | 0.33 [0.04, 3.03] |
| 7 Leaving the study early: acceptability of treatment ‐ as measured by completion of trial Show forest plot | 1 | Risk Ratio (M‐H, Random, 95% CI) | Subtotals only | |
| 7.1 Short term (8 weeks) | 1 | 60 | Risk Ratio (M‐H, Random, 95% CI) | 0.0 [0.0, 0.0] |
| Outcome or subgroup title | No. of studies | No. of participants | Statistical method | Effect size |
| 1 Clinical response: no clinically significant response in mental state: 20% reduction in PANSS total score Show forest plot | 1 | Risk Ratio (M‐H, Fixed, 95% CI) | Subtotals only | |
| 1.1 Short term (6 weeks) | 1 | 24 | Risk Ratio (M‐H, Fixed, 95% CI) | 0.67 [0.13, 3.30] |
| 1.2 Medium term (26 weeks) | 1 | 24 | Risk Ratio (M‐H, Fixed, 95% CI) | 0.8 [0.28, 2.27] |
| 2 Clinical response: no clinically significant response in mental state (positive symptoms) 20% reduction in PANSS positive subscore Show forest plot | 1 | Risk Ratio (M‐H, Random, 95% CI) | Subtotals only | |
| 2.1 Short term (6 weeks) | 1 | 24 | Risk Ratio (M‐H, Random, 95% CI) | 3.0 [0.36, 24.92] |
| 3 Clinical response: 1a mean score/change global state: mean CGI subscale score (high = poor) Show forest plot | 1 | Mean Difference (IV, Random, 95% CI) | Subtotals only | |
| 3.1 Severity of illness | 1 | 22 | Mean Difference (IV, Random, 95% CI) | 0.20 [‐0.32, 0.72] |
| 3.2 Global improvement | 1 | 22 | Mean Difference (IV, Random, 95% CI) | ‐0.30 [‐0.82, 0.22] |
| 3.3 Therapeutic efficacy | 1 | 22 | Mean Difference (IV, Random, 95% CI) | ‐0.30 [‐0.79, 0.19] |
| 4 Clinical response: 1b mean score/change global state: mean GAF score (high = good) Show forest plot | 1 | Mean Difference (IV, Random, 95% CI) | Subtotals only | |
| 4.1 Short term (6 weeks) | 1 | 22 | Mean Difference (IV, Random, 95% CI) | 0.0 [‐7.84, 7.84] |
| 5 Clinical response: 2a. mean score/change mental state: mean HAMD score (high = poor) Show forest plot | 1 | Mean Difference (IV, Random, 95% CI) | Subtotals only | |
| 5.1 Short term (6 weeks) | 1 | 22 | Mean Difference (IV, Random, 95% CI) | ‐3.40 [‐6.71, ‐0.09] |
| 5.2 Medium term (26 weeks) | 1 | 16 | Mean Difference (IV, Random, 95% CI) | ‐0.70 [‐5.35, 3.95] |
| 6 Clinical response: 2b mean score/change mental state: mean PANSS total score (high = poor) Show forest plot | 1 | Mean Difference (IV, Random, 95% CI) | Subtotals only | |
| 6.1 Short term (6 weeks) | 1 | 22 | Mean Difference (IV, Random, 95% CI) | ‐3.10 [‐11.38, 5.18] |
| 6.2 Medium term (26 weeks) | 1 | 16 | Mean Difference (IV, Random, 95% CI) | 1.0 [‐7.91, 9.91] |
| 7 Clinical response: 2c mean score/change in mental state (positive symptoms) mean PANSS positive score (high = poor) Show forest plot | 1 | Mean Difference (IV, Random, 95% CI) | Subtotals only | |
| 7.1 Short term (6 weeks) | 1 | 22 | Mean Difference (IV, Random, 95% CI) | ‐0.20 [‐1.84, 1.44] |
| 7.2 Medium term (26 weeks) | 1 | 16 | Mean Difference (IV, Random, 95% CI) | ‐0.20 [‐2.58, 2.18] |
| 8 Clinical response: 2d mean score/change in mental state (negative symptoms) mean PANSS negative score (high = poor) Show forest plot | 1 | Mean Difference (IV, Random, 95% CI) | Subtotals only | |
| 8.1 Short term (6 weeks) | 1 | 22 | Mean Difference (IV, Random, 95% CI) | ‐1.20 [‐4.63, 2.23] |
| 8.2 Medium term (26 weeks) | 1 | 16 | Mean Difference (IV, Random, 95% CI) | 1.5 [‐2.66, 5.66] |
| 9 Clinical response: 2e mean score/change in mental state (negative symptoms) mean SANS score (high = poor) Show forest plot | 1 | Mean Difference (IV, Random, 95% CI) | Subtotals only | |
| 9.1 Short term (6 weeks) | 1 | 22 | Mean Difference (IV, Random, 95% CI) | ‐4.0 [‐17.55, 9.55] |
| 9.2 Medium term (26 weeks) | 1 | 16 | Mean Difference (IV, Random, 95% CI) | 1.80 [‐14.31, 17.91] |
| 10 Clinical response: 2f mean score/change in global state: mean PANSS global psychopathology score (high = poor) Show forest plot | 1 | Mean Difference (IV, Random, 95% CI) | Subtotals only | |
| 10.1 Short term (6 weeks) | 1 | 22 | Mean Difference (IV, Random, 95% CI) | ‐1.60 [‐6.60, 3.40] |
| 10.2 Medium term (26 weeks) | 1 | 16 | Mean Difference (IV, Random, 95% CI) | 0.0 [‐5.83, 5.83] |
| 11 Adverse effects: specific adverse effects: mean score/change in extrapyramidal adverse effects: mean EPS score (high = poor) Show forest plot | 1 | Mean Difference (IV, Random, 95% CI) | Subtotals only | |
| 11.1 Short term (6 weeks) | 1 | 22 | Mean Difference (IV, Random, 95% CI) | 0.60 [‐0.67, 1.87] |
| 11.2 Medium term (26 weeks) | 1 | 16 | Mean Difference (IV, Random, 95% CI) | 0.30 [‐0.63, 1.23] |
| 12 Adverse effects: other adverse effects (general or specific): mean CGI adverse effect scores (high = poor) Show forest plot | 1 | Mean Difference (IV, Random, 95% CI) | Subtotals only | |
| 12.1 Short term (6 weeks) | 1 | 22 | Mean Difference (IV, Random, 95% CI) | ‐0.10 [‐0.53, 0.33] |
| 13 Leaving the study early: acceptability of treatment ‐ as measured by completion of trial Show forest plot | 1 | Risk Ratio (M‐H, Random, 95% CI) | Subtotals only | |
| 13.1 Short term (6 weeks) | 1 | 24 | Risk Ratio (M‐H, Random, 95% CI) | 1.0 [0.07, 14.21] |
| 13.2 Medium term (26 weeks) | 1 | 24 | Risk Ratio (M‐H, Random, 95% CI) | 0.6 [0.18, 1.97] |
| 13.3 Long term (52 weeks) | 1 | 24 | Risk Ratio (M‐H, Random, 95% CI) | 1.6 [0.73, 3.49] |
| Outcome or subgroup title | No. of studies | No. of participants | Statistical method | Effect size |
| 1 Clinical response: 1a. no clinically significant response in mental state: PANSS reduction ≥ 50% Show forest plot | 1 | Risk Ratio (M‐H, Random, 95% CI) | Subtotals only | |
| 1.1 Medium term (12 weeks) | 1 | 63 | Risk Ratio (M‐H, Random, 95% CI) | 0.54 [0.35, 0.81] |
| 2 Clinical response: 1b. no clinically significant response in mental state: PANSS reduction ≥ 25% Show forest plot | 1 | Risk Ratio (M‐H, Random, 95% CI) | Subtotals only | |
| 2.1 Medium term (12 weeks) | 1 | 63 | Risk Ratio (M‐H, Random, 95% CI) | 0.65 [0.38, 1.10] |
| 3 Clinical response: 1. mean score/change global state: mean CGI‐S score (high = poor) Show forest plot | 1 | Mean Difference (IV, Random, 95% CI) | Subtotals only | |
| 3.1 Medium term (12 weeks) | 1 | 60 | Mean Difference (IV, Random, 95% CI) | ‐0.70 [‐1.18, ‐0.22] |
| 4 Clinical response: 2a. mean score/change mental state: mean PANSS total score (high = poor) Show forest plot | 1 | Mean Difference (IV, Random, 95% CI) | Subtotals only | |
| 4.1 Medium term (12 weeks) | 1 | 60 | Mean Difference (IV, Random, 95% CI) | ‐12.30 [‐22.43, ‐2.17] |
| 5 Clinical response: 2b. mean score/change in mental state (positive symptoms): mean PANSS positive score (high = poor) Show forest plot | 1 | Mean Difference (IV, Random, 95% CI) | Subtotals only | |
| 5.1 Medium term (12 weeks) | 1 | 60 | Mean Difference (IV, Random, 95% CI) | ‐3.10 [‐5.52, ‐0.68] |
| 6 Clinical response: 2b. mean score/change in mental state (negative symptoms): mean PANSS negative score (high = poor) Show forest plot | 1 | Mean Difference (IV, Random, 95% CI) | Subtotals only | |
| 6.1 Medium term (12 weeks) | 1 | 60 | Mean Difference (IV, Random, 95% CI) | 0.80 [‐1.99, 3.59] |
| 7 Adverse effects: specific adverse effects: mean score/change in extrapyramidal adverse effects: reported extrapyramidal adverse effects Show forest plot | 1 | Risk Ratio (M‐H, Random, 95% CI) | Subtotals only | |
| 7.1 Medium term (12 weeks) | 1 | 63 | Risk Ratio (M‐H, Random, 95% CI) | 2.06 [0.41, 10.47] |
| 8 Adverse effects: other adverse effects (general or specific): overall adverse effect rate Show forest plot | 1 | Risk Ratio (M‐H, Random, 95% CI) | Subtotals only | |
| 8.1 Medium term (12 weeks) | 1 | 63 | Risk Ratio (M‐H, Random, 95% CI) | 0.75 [0.50, 1.13] |
| 9 Adverse effects: other adverse effects (general or specific): agitation Show forest plot | 1 | Risk Ratio (M‐H, Random, 95% CI) | Subtotals only | |
| 9.1 Medium term (12 weeks) | 1 | 63 | Risk Ratio (M‐H, Random, 95% CI) | 1.03 [0.15, 6.88] |
| 10 Adverse effects: other adverse effects (general or specific): constipation Show forest plot | 1 | Risk Ratio (M‐H, Random, 95% CI) | Subtotals only | |
| 10.1 Medium term (12 weeks) | 1 | 63 | Risk Ratio (M‐H, Random, 95% CI) | 0.15 [0.01, 2.74] |
| 11 Adverse effects: other adverse effects (general or specific): drowsiness Show forest plot | 1 | Risk Ratio (M‐H, Random, 95% CI) | Subtotals only | |
| 11.1 Medium term (12 weeks) | 1 | 63 | Risk Ratio (M‐H, Random, 95% CI) | 0.47 [0.18, 1.19] |
| 12 Adverse effects: other adverse effects (general or specific): dry mouth Show forest plot | 1 | Risk Ratio (M‐H, Random, 95% CI) | Subtotals only | |
| 12.1 Medium term (12 weeks) | 1 | 63 | Risk Ratio (M‐H, Random, 95% CI) | 0.17 [0.02, 1.35] |
| 13 Adverse effects: other adverse effects (general or specific): headache Show forest plot | 1 | Risk Ratio (M‐H, Random, 95% CI) | Subtotals only | |
| 13.1 Medium term (12 weeks) | 1 | 63 | Risk Ratio (M‐H, Random, 95% CI) | 1.03 [0.28, 3.77] |
| 14 Adverse effects: other adverse effects (general or specific): insomnia Show forest plot | 1 | Risk Ratio (M‐H, Random, 95% CI) | Subtotals only | |
| 14.1 Medium term (12 weeks) | 1 | 63 | Risk Ratio (M‐H, Random, 95% CI) | 0.69 [0.12, 3.84] |
| 15 Adverse effects: other adverse effects (general or specific): orthostatic hypotension Show forest plot | 1 | Risk Ratio (M‐H, Random, 95% CI) | Subtotals only | |
| 15.1 Medium term (12 weeks) | 1 | 63 | Risk Ratio (M‐H, Random, 95% CI) | 0.21 [0.01, 4.13] |
| 16 Adverse effects: other adverse effects (general or specific): tachycardia Show forest plot | 1 | Risk Ratio (M‐H, Random, 95% CI) | Subtotals only | |
| 16.1 Medium term (12 weeks) | 1 | 63 | Risk Ratio (M‐H, Random, 95% CI) | 0.69 [0.12, 3.84] |
| 17 Adverse effects: other adverse effects (general or specific): vertigo Show forest plot | 1 | Risk Ratio (M‐H, Random, 95% CI) | Subtotals only | |
| 17.1 Medium term (12 weeks) | 1 | 63 | Risk Ratio (M‐H, Random, 95% CI) | 0.21 [0.03, 1.67] |
| 18 Leaving the study early: acceptability of treatment ‐ as measured by completion of trial Show forest plot | 1 | Risk Ratio (M‐H, Fixed, 95% CI) | Subtotals only | |
| 18.1 Medium term (12 weeks) | 1 | 63 | Risk Ratio (M‐H, Fixed, 95% CI) | 0.52 [0.05, 5.41] |