نقش کلوزاپین در ترکیب با داروهای آنتیسایکوتیک مختلف برای اسکیزوفرنی مقاوم به درمان
چکیده
پیشینه
بین 40% تا 70% از افراد مبتلا به اسکیزوفرنی مقاوم به درمان (treatment‐resistant schizophrenia)، علیرغم سطوح کافی دارو در خون، به کلوزاپین (clozapine) پاسخ نمیدهند. برای این افراد، تعدادی استراتژی درمانی معرفی شده، از جمله تجویز داروی دوم آنتیسایکوتیک در ترکیب با کلوزاپین.
اهداف
تعیین تاثیرات بالینی استراتژیهای مختلف ترکیبی کلوزاپین با داروهای آنتیسایکوتیک در افراد مبتلا به اسکیزوفرنی مقاوم به درمان هم از لحاظ اثربخشی و هم از لحاظ تحملپذیری.
روشهای جستوجو
ما پایگاه ثبت کارآزماییهای مطالعه‐محور گروه اسکیزوفرنی در کاکرین (تا 28 آگوست 2015) و MEDLINE (نوامبر 2008) را جستوجو کردیم. فهرست منابع تمام کارآزماییهای تصادفیسازی و کنترل شده (randomised controlled trials; RCTs) و شناسایی شده را بررسی کردیم. برای شناسایی کارآزماییهای بیشتر برای اولین نسخه این مرور، با شرکتهای داروسازی نیز تماس گرفتیم.
معیارهای انتخاب
فقط RCTهایی را وارد کردیم که افراد هر دو جنس، 18 ساله و بالاتر، با تشخیص اسکیزوفرنی مقاوم به درمان (یا اختلالات مرتبط) را بررسی کردند و به مقایسه کلوزاپین به همراه داروی آنتیسایکوتیک دیگر با کلوزاپین به همراه داروی آنتیسایکوتیک مختلف پرداختند.
گردآوری و تجزیهوتحلیل دادهها
دادهها را بهطور مستقل از هم استخراج کردیم. برای دادههای دو‐حالتی، با استفاده از متاآنالیز اثرات‐تصادفی، خطرات نسبی (RRs) و 95% فواصل اطمینان (CI) را بر مبنای قصد درمان (intention‐to‐treat) محاسبه کردیم. برای دادههای پیوسته، تفاوتهای میانگین (MD) و 95% CIهای آنها را محاسبه کردیم. برای ایجاد جداول «خلاصهای از یافتهها» و ارزیابی خطر سوگیری (bias) برای مطالعات وارد شده از روش درجهبندی توصیه، ارزیابی، توسعه و ارزشیابی (GRADE) استفاده کردیم.
نتایج اصلی
دو مطالعه دیگر را با 169 شرکتکننده شناسایی کردیم که معیارهای ورود ما را داشتند. این مرور اکنون پنج مطالعه را با 309 شرکتکننده وارد کرده است. کیفیت شواهد پائین بود، و با توجه به درجه بالای ناهمگونی بین مطالعات، قادر به انجام متاآنالیز رسمی برای افزایش قدرت آماری نبودیم.
برای این نسخه بهروز، هفت پیامد اصلی مطلوب را مشخص کردیم: پاسخ بالینی در شرایط روانی (پاسخ بالینی قابل توجه، میانگین نمره/تغییر در شرایط روانی)، پاسخ بالینی در شرایط کلی (میانگین نمره/تغییر در شرایط کلی)، افزایش وزن، ترک زودهنگام مطالعه (مقبولیت درمان)، پیامدهای استفاده از خدمات (روزهای بستری شده در بیمارستان یا پذیرش در بیمارستان) و کیفیت زندگی.
تفاوت معنیدار کمی میان استراتژیهای ترکیبی کلوزاپین برای شرایط کلی و روانی یافتیم (پاسخ و تغییر مهم بالینی)، و دادههای مربوط به خروج از مطالعه و افزایش وزن وجود داشت. هیچ دادهای در مورد استفاده از خدمات و کیفیت زندگی نیافتیم.
کلوزاپین به علاوه آریپیپرازول (aripiprazole) در برابر کلوزاپین به همراه هالوپریدول (haloperidol)
تفاوت طولانیمدت معنیداری بین استراتژیهای ترکیبی آریپیپرازول و هالوپریدول در تغییر حالت روانی وجود نداشت (1 RCT؛ 105 = n؛ MD: 0.90؛ 95% CI؛ 4.38‐ تا 6.18؛ شواهد با کیفیت پائین). هیچ دادهای مربوط به عوارض جانبی افزایش وزن وجود نداشت اما برای عوارض جانبی اندازهگیری شده با LUNSERS در 12 هفته (1 RCT؛ 105 = n؛ MD: ‐4.90؛ 95% CI؛ 8.48‐ تا 1.32‐) و 24 هفته (1 RCT؛ 105 = n؛ MD: ‐4.90؛ 95% CI؛ 8.25‐ تا 1.55‐) برای آریپیپرازول یک مزیت وجود داشت اما در 52 هفته مزیتی وجود نداشت (1 RCT؛ 105 = n؛ MD: ‐4.80؛ 95% CI؛ 9.79‐ تا 0.19). تعداد مشابهی از شرکتکنندگان در هر گروه در همان ابتدا از مطالعه خارج شدند (1 RCT؛ 106 = n؛ RR: 1.27؛ 95% CI؛ 0.72 تا 2.22؛ شواهد با کیفیت بسیار پائین).
کلوزاپین به علاوه آمیسولپراید (amisulpride) در برابر کلوزاپین به همراه کوئتیاپین (quetiapine)
یک مطالعه مزیت معنیداری را برای تجویز آمیسولپراید نسبت به کوئتیاپین در کوتاه‐مدت برای هر دو تغییر در شرایط کلی (برداشت بالینی کلی (Clinical Global Impression; CGI): 1 RCT؛ 50 = n؛ MD: ‐0.90؛ 95% CI؛ 1.38‐ تا 0.42‐؛ شواهد با کیفیت بسیار پائین) و شرایط روانی (مقیاس رتبهبندی روانپزشکی کوتاه (Brief Psychiatric Rating Scale; BPRS): 1 RCT؛ 50 = n؛ MD: ‐4.00؛ 95% CI؛ 5.86‐ تا 2.14‐؛ شواهد با کیفیت پائین) نشان داد. تعداد مشابهی از شرکتکنندگان در هر گروه در ابتدا مطالعه را ترک کردند (1 RCT؛ 56 = n؛ RR: 0.20؛ 95% CI؛ 0.02 تا 1.60؛ شواهد با کیفیت بسیار پائین).
کلوزاپین به علاوه ریسپریدون (risperidone) در برابر کلوزاپین به علاوه سولپیرید (sulpiride)
تفاوتی بین ریسپریدون و سولپیرید برای پاسخ بالینی معنیدار وجود نداشت، که در این مطالعه 20% تا 50% کاهش در مقیاس سندرم مثبت و منفی (Positive and Negative Syndrome Scale; PANSS) شناسایی شد (1 RCT؛ 60 = n؛ RR: 0.82؛ 95% CI؛ 0.40 تا 1.68؛ شواهد با کیفیت بسیار پائین). نتایج دوپهلوی مشابهی برای افزایش وزن (1 RCT؛ 60 = n؛ RR: 0.40؛ 95% CI: 0.08 تا 1.90؛ شواهد با کیفیت بسیار پائین) و شرایط روانی (PANSS کلی: 1 RCT؛ 60 = n؛ MD: ‐2.28؛ 95% CI؛ 7.41‐ تا 2.85؛ شواهد با کیفیت بسیار پائین) وجود داشت. هیچ کس مطالعه را در ابتدای آن ترک نکرد.
کلوزاپین به علاوه ریسپریدون در برابر کلوزاپین به علاوه زیپراسیدون (ziprasidone)
هیچ تفاوتی بین ریسپریدون و زیپراسیدون برای پاسخ بالینی معنیدار (1 RCT؛ 24 = n؛ RR: 0.80؛ 95% CI؛ 0.28 تا 2.27؛ شواهد با کیفیت بسیار پائین)، تغییر در نمره CGI‐II در حالت کلی (1 RCT؛ 22 = n؛ MD: ‐0.30؛ 95% CI؛ 0.82‐ تا 0.22؛ شواهد با کیفیت بسیار پائین)، تغییر در نمره کل PANSS؛ (1 RCT؛ 16 = n؛ MD: 1.00؛ 95% CI؛ 7.91‐ تا 9.91؛ شواهد با کیفیت بسیار پائین) یا ترک در ابتدای مطالعه (1 RCT؛ 24 = n؛ RR: 1.60؛ 95% CI؛ 0.73 تا 3.49؛ شواهد با کیفیت بسیار پائین) وجود نداشت.
کلوزاپین به همراه زیپراسیدون در برابر کلوزاپین به همراه کوئتیاپین
یک مطالعه در میان‐مدت، یک تاثیر عالی برای زیپراسیدون ترکیبی در مقایسه با کوئتیاپین ترکیبی برای پاسخ بالینی معنیدار در وضعیت روانی (بیش از 50% کاهش در PANSS کلی: 1 RCT؛ 63 = n؛ RR: 0.54؛ 95% CI؛ 0.35 تا 0.81؛ شواهد با کیفیت پائین)، شرایط کلی (نمره شدت CGI: 1 RCT؛ 60 = n؛ MD: ‐0.70؛ 95% CI؛ 1.18‐ تا 0.22‐؛ شواهد با کیفیت پائین) و شرایط روانی (PANSS کلی: 1 RCT؛ 60 = n؛ MD: ‐12.30؛ 95% CI؛ 22.43‐ تا 2.17‐ ؛ شواهد با کیفیت پائین) یافت. هیچ تاثیری برای ترک در اوایل مطالعه وجود نداشت (1 RCT؛ 63 = n؛ RR: 0.52؛ CI؛ 0.05 تا 5.41؛ شواهد با کیفیت بسیار پائین).
نتیجهگیریهای نویسندگان
قابلیت اطمینان نتایج به دست آمده از این مرور محدود بوده و کیفیت شواهد پائین یا بسیار پائین است. علاوه بر این، با توجه به تعداد محدود مطالعات وارد شده، قادر به انجام متاآنالیز (meta‐analysis) رسمی نبودیم. در نتیجه، هرگونه نتیجهگیری بر اساس این یافتهها، بر اساس تک RCTهای کوچک با خطر بالای خطای نوع II استوار است. انجام RCTهای به درستی انجام شده با توان آزمون کافی مورد نیاز هستند. نویسندگان کارآزماییهای آینده باید تلاش کنند تا پیامدهای مهم بیمار را مانند کیفیت زندگی، همچنین پاسخ بالینی و عوارض جانبی اندازهگیری کنند.
PICO
خلاصه به زبان ساده
نقش کلوزاپین در ترکیب با داروهای آنتیسایکوتیک مختلف برای اسکیزوفرنی مقاوم به درمان
پیشینه
اسکیزوفرنی schizophrenia) یک بیماری شدید روانی است که شامل نشانههای توهم (احساساتی که به نظر واقعی میآیند اما توسط ذهن فرد ایجاد میشود (hallucinations))، هذیان (باورهای غیر‐واقعی (delusions)) و بیتفاوتی (عدم علاقه (apathy)) است که میتواند اثر قابل توجهی بر زندگی افراد داشته باشد. درمان اصلی این وضعیت، داروهای آنتیسایکوتیک است؛ با این حال، برخی از افراد مبتلا به اسکیزوفرنی به داروهای آنتیسایکوتیک پاسخ نمیدهند (مقاوم به درمان نامیده میشوند)، که این موضوع یک چالش عمده در مدیریت اسکیزوفرنی است. در صورتی که مقاومت به درمان رخ دهد، کلوزاپین (clozapine) به عنوان یک داروی آنتیسایکوتیک، داروی موثری برای استفاده خواهد بود؛ با این حال، ممکن است منجر به عوارض جانبی ناخواستهای شود از جمله خوابآلودگی، سرگیجه، سردرد، ترمور (لرزش)، و بزاق بیش از حد (جاری شدن آب دهان). یکی از عوارض جانبی بسیار جدی کاهش تعداد گلبولهای سفید خون است، که میتواند منجر به افزایش خطر عفونت شود. کلوزاپین اغلب در ترکیب با سایر داروهای آنتیسایکوتیک برای اسکیزوفرنی مقاوم به درمان استفاده میشود، و این مرور تاثیرات بالینی و ایمنی ترکیبات مختلف کلوزاپین را مورد بررسی قرار داد.
ویژگیهای مطالعه
ما پایگاه ثبت کارآزماییهای گروه اسکیزوفرنی در کاکرین را در آگوست 2015 و ژانویه 2016 جستوجو کردیم و پنج مطالعه بالینی را شامل 309 فرد بزرگسال تشخیص داده شده با اسکیزوفرنی یا بیماریهای مرتبط با آن یافتیم که نسبت به درمان مقاوم بودند اما به کلوزاپین کمی واکنش نشان دادند. این مطالعات کلوزاپین ترکیبی را با داروهای آنتیسایکوتیک مقایسه کردند (هالوپریدول (haloperidol)، آریپیپرازول (aripiprazole)، آمیسولپراید (amisulpride)، کوئتیاپین (quetiapine)، سولپیرید (sulpiride)، زیپراسیدون (ziprasidone) و ریسپریدون (risperidone)).
نتایج کلیدی
انجام تجزیهوتحلیل کلی امکانپذیر نبود زیرا این پنج مطالعه بسیار متفاوت بودند. بنابراین، تمام نتایج بر اساس دادههای به دست آمده از یک مطالعه در هر مقایسه بود.
ترکیب آریپیپرازول در برابر هالوپریدول: در اثربخشی این دو ترکیب درمانی تفاوت کلی وجود نداشت، با این حال، ترکیب آریپیپرازول منجر به عوارض جانبی کمتری شد.
ترکیب آمیسولپراید در برابر کوئتیاپین: ترکیب آمیسولپراید در مقایسه با ترکیب کوئتیاپین در درمان اسکیزوفرنی موثرتر بود.
ترکیب ریسپریدون در برابر سولپیرید: در اثربخشی بالینی بین این ترکیبات تفاوت کلی وجود نداشت.
ترکیب ریسپریدون در برابر زیپراسیدون: در بهبود نشانههای اسکیزوفرنی هیچ یک از این ترکیبات نسبت به دیگری برتری نشان نداد.
ترکیب زیپراسیدون در برابر کوئتیاپن: ترکیب زیپراسیدون در بهبود شرایط روانی و کلی موثرتر از ترکیب کوئتیاپن بود.
کیفیت شواهد
قابلیت اطمینان شواهد قابل بحث بوده و با کیفیت پائین یا بسیار پائین ذکر شده است. فقط مطالعاتی اندک، با دادههای محدود در دسترس بود. هیچ دادهای برای معیارهای مهم مانند کیفیت زندگی و استفاده از خدمات موجود نیست و نمیتوان در این مورد نتیجهگیری کرد. شواهد با کیفیت بالای بیشتری مورد نیاز است.
Authors' conclusions
Summary of findings
| Clozapine + aripi prazole versus clozapine + haloperidol for treatment‐resistant schizophrenia | ||||||
| Patient or population: people with treatment‐resistant schizophrenia Setting: inpatients and outpatients Intervention: aripiprazole (+ CLO) Comparison: haloperidol (+ CLO) | ||||||
| Outcomes | Anticipated absolute effects* (95% CI) | Relative effect | No of participants | Quality of the evidence | Comments | |
| Risk with haloperidol (+ CLO) | Risk with aripiprazole (+ CLO) | |||||
| Clinical response: no clinically significant response in mental state | See comment | See comment | Not estimable | ‐ | ‐ | No data reported. |
| Adverse effects: weight gain | See comment | See comment | Not estimable | ‐ | ‐ | No data reported. |
| Clinical response: mean score/change in global state | See comment | See comment | ‐ | ‐ | ‐ | No data reported. |
| Clinical response: mean score/change in mental state: change in BPRS score from baseline (high = good), Long term (12 months) | The mean score/change in mental state (change in BPRS from baseline) ‐ long term (12 months) was 0 | The mean score/change in mental state ‐ defined by change in BPRS from baseline ‐ long term (12 months) in the intervention group was 0.9 more (4.38 fewer to 6.18 more) | ‐ | 105 | ⊕⊕⊝⊝ | ‐ |
| Leaving the study early: acceptability of treatment ‐ as measured by completion of trial Long term (12 months) | Study population | RR 1.27 | 106 | ⊕⊝⊝⊝ | ‐ | |
| 283 per 1000 | 359 per 1000 | |||||
| Moderate | ||||||
| 283 per 1000 | 359 per 1000 | |||||
| Service utilisation outcomes: hospital admission or days in hospital | See comment | See comment | Not estimable | ‐ | ‐ | No data reported. |
| Quality of life/satisfaction with care for either recipients of care or carers: significant change in quality of life/satisfaction | See comment | See comment | Not estimable | ‐ | ‐ | No data reported. |
| *The risk in the intervention group (and its 95% confidence interval) is based on the assumed risk in the comparison group and the relative effect of the intervention (and its 95% CI). BPRS: Brief Psychiatric Rating Scale; CI: confidence interval; CLO: clozapine; RCT: randomised controlled trial; RR: risk ratio. | ||||||
| GRADE Working Group grades of evidence | ||||||
| 1 Risk of bias: downgraded by 1 level because high risk for performance bias (open label), but low risk for other biases (selection, detection, attrition, reporting). 2 Inconsistency and publication bias: not applicable (no meta‐analysis). 3 Indirectness: not downgraded because good applicability in terms of participants and interventions and rating scale measures participant‐important outcome (mental state). 4 Imprecision: downgraded by 1 level because underpowered to detect difference. Not downgraded by 2 levels because CI around mean difference did not include appreciable benefit and appreciable harm (total score on BPRS = 126). 5 Indirectness: downgraded by 1 level because leaving the study early a surrogate measure of acceptability of treatment. 6 Imprecision: downgraded by 2 level because underpowered to detect difference and CI around relative effect included appreciable benefit and harm (from less likely to leave study early to over two times more likely to leave study early). | ||||||
| Clozapine + amisulpride versus clozapine + quetiapine for treatment‐resistant schizophrenia | ||||||
| Patient or population: people with treatment‐resistant schizophrenia Setting: inpatients and outpatients Intervention: amisulpride (+ CLO) Comparison: quetiapine (+ CLO) | ||||||
| Outcomes | Anticipated absolute effects* (95% CI) | Relative effect | No of participants | Quality of the evidence | Comments | |
| Risk with quetiapine (+ CLO) | Risk with amisulpride (+ CLO) | |||||
| Clinical response: no clinically significant response in mental state | See comment | See comment | Not estimable | (1 RCT) | ‐ | No data reported. |
| Adverse effects: weight gain | See comment | See comment | Not estimable | (1 RCT) | ‐ | No data reported. |
| Clinical response: mean score/change in global state: mean CGI score (high = poor) Short term (8 weeks) | The mean score/change in global state (CGI) ‐ short term (8 weeks) was 0 | The mean score/change in global state (CGI) ‐ short term (8 weeks) in the intervention group was 0.9 fewer (1.38 fewer to 0.42 fewer) | ‐ | 50 | ⊕⊝⊝⊝ | ‐ |
| Clinical response: mean score/change in mental state: mean BPRS score (high = poor) Short term (8 weeks) | The mean score/change in mental state (BPRS) ‐ short term (8 weeks) was 0 | The mean score/change in mental state (BPRS) ‐ short term (8 weeks) in the intervention group was 4 fewer (5.86 fewer to 2.14 fewer) | ‐ | 50 | ⊕⊕⊝⊝ | ‐ |
| Leaving the study early: acceptability of treatment ‐ as measured by completion of trial | Study population | RR 0.20 | 56 | ⊕⊝⊝⊝ | ‐ | |
| 179 per 1000 | 36 per 1000 | |||||
| Moderate | ||||||
| 179 per 1000 | 36 per 1000 | |||||
| Service utilisation outcomes: hospital admission or days in hospital | See comment | See comment | Not estimable | (1 RCT) | ‐ | No data reported. |
| Quality of life/satisfaction with care for either recipients of care or carers: significant change in quality of life/satisfaction | See comment | See comment | Not estimable | (1 RCT) | ‐ | No data reported. |
| *The risk in the intervention group (and its 95% confidence interval) is based on the assumed risk in the comparison group and the relative effect of the intervention (and its 95% CI). BPRS: Brief Psychiatric Rating Scale; CGI: Clinical Global Impression; CI: confidence interval; CLO: clozapine; RCT: randomised controlled trial; RR: risk ratio. | ||||||
| GRADE Working Group grades of evidence | ||||||
| 1 Risk of bias: downgraded by 2 levels because high risk of reporting bias and unclear (so potentially high) risk of other biases (selection, performance, attrition). 2 Inconsistency and publication bias: not applicable (no meta‐analysis). 3 Indirectness: not downgraded because good applicability in terms of participants and interventions and rating score measures a participant‐important outcome (global state). 4 Imprecision: downgraded by 1 level because underpowered to detect difference. Not downgraded by 2 levels because CI around mean difference did not include appreciable benefit and appreciable harm (total score on CGI = 7). 5 Indirectness: not downgraded because good applicability in terms of participants and interventions and rating score measures a participant‐important outcome (mental state). 6 Imprecision: not downgraded because powered to detect difference and narrow CI. 7 Indirectness: downgraded by 1 level because leaving study early surrogate measure of participant‐important outcome (acceptability of treatment). | ||||||
| Clozapine + risperidone versus clozapine + sulpiride for treatment‐resistant schizophrenia | ||||||
| Patient or population: people with treatment‐resistant schizophrenia Setting: inpatients Intervention: risperidone (+ CLO) Comparison: sulpiride (+ CLO) | ||||||
| Outcomes | Anticipated absolute effects* (95% CI) | Relative effect | No of participants | Quality of the evidence | Comments | |
| Risk with Sulpiride (+ CLO) | Risk with Risperidone (+ CLO) | |||||
| Clinical response: no clinically significant response in mental state: 20% to 50% reduction in PANSS total score | Study population | RR 0.82 | 60 | ⊕⊝⊝⊝ | ‐ | |
| 367 per 1000 | 301 per 1000 | |||||
| Moderate | ||||||
| 367 per 1000 | 301 per 1000 | |||||
| Adverse effects: weight gain | Study population | RR 0.40 | 60 | ⊕⊝⊝⊝ | ‐ | |
| 167 per 1000 | 67 per 1000 | |||||
| Moderate | ||||||
| 167 per 1000 | 67 per 1000 | |||||
| Clinical response: mean score/change in global state | See comment | See comment | ‐ | (1 RCT) | ‐ | No data reported. |
| Clinical response: mean score/change in mental state: mean PANSS total score (high = poor) | The mean score/change in mental state (PANSS total) was 0 | The mean score/change in mental state (PANSS total) in the intervention group was 2.28 undefined fewer (7.41 fewer to 2.85 more) | ‐ | 60 | ⊕⊝⊝⊝ | ‐ |
| Leaving the study early: acceptability of treatment ‐ as measured by completion of trial | Study population | Not estimable | 60 | ⊕⊝⊝⊝ | ‐ | |
| 0 per 1000 | 0 per 1000 | |||||
| Service utilisation outcomes: hospital admission or days in hospital | See comment | See comment | Not estimable | ‐ | ‐ | No data reported. |
| Quality of life/satisfaction with care for either recipients of care or carers: significant change in quality of life/satisfaction | See comment | See comment | Not estimable | ‐ | ‐ | No data reported. |
| *The risk in the intervention group (and its 95% confidence interval) is based on the assumed risk in the comparison group and the relative effect of the intervention (and its 95% CI). CI: confidence interval; CLO: clozapine; PANSS: Positive and Negative Syndrome Scale; RCT: randomised controlled trial; RR: risk ratio. | ||||||
| GRADE Working Group grades of evidence | ||||||
| 1 Risk of bias: downgraded by 2 levels because unclear (so potentially high) risk of biases (selection, performance, detection, reporting). 2 Inconsistency and publication bias: not applicable (no meta‐analysis). 3 Indirectness: downgraded by 1 level because unclear population applicability (inclusion criteria not clearly specified). Not downgraded by 2 levels because rating scale measures participant‐important outcome (mental state). 4 Imprecision: downgraded by 2 levels because underpowered to detect difference and CI around relative effect includes appreciable benefit and harm. 5 Indirectness: downgraded by 1 level because unclear population applicability (inclusion criteria not clearly specified). Not downgraded by 2 levels because weight gain a direct measure of a participant‐important outcome. 6 Indirectness: downgraded by 1 level because unclear population applicability (inclusion criteria not clearly specified). Not downgraded by 2 levels because rating scale measures participant‐important outcome (mental state). 7 Imprecision: downgraded by 1 level because underpowered to detect difference. Not downgraded by 2 levels because CI around mean difference did not include appreciable benefit and appreciable harm (total score on PANSS = 120). 8 Indirectness: downgraded by 2 levels because unclear population applicability (inclusion criteria not clearly specified) and leaving the study early a surrogate measure of acceptability of treatment. 9 Imprecision: downgraded by 1 level because underpowered to detect difference. Not downgraded by 2 levels because no CI. | ||||||
| Clozapine + risperidone versus clozapine + ziprasidone for treatment‐resistant schizophrenia | ||||||
| Patient or population: people with treatment‐resistant schizophrenia Setting: inpatients and outpatients Intervention: risperidone (+ CLO) Comparison: ziprasidone (+ CLO) | ||||||
| Outcomes | Anticipated absolute effects* (95% CI) | Relative effect | No of participants | Quality of the evidence | Comments | |
| Risk with ziprasidone (+ CLO) | Risk with risperidone (+ CLO) | |||||
| Clinical response: no clinically significant response in mental state: 20% reduction in PANSS total score | Study population | RR 0.80 | 24 | ⊕⊝⊝⊝ | ‐ | |
| 417 per 1000 | 333 per 1000 | |||||
| Moderate | ||||||
| 417 per 1000 | 333 per 1000 | |||||
| Adverse effects: weight gain | See comment | See comment | Not estimable | ‐ | ‐ | No SDs reported. |
| Clinical response: mean score/change in global state: mean CGI‐II Global improvement score (high = poor) Short term (6 weeks) | The mean score/change in global state (CGI‐II Global improvement) ‐ short term (6 weeks) was 0 | The mean score/change in global state (CGI‐II global improvement) ‐ short term (6 weeks) in the intervention group was 0.3 fewer (0.82 fewer to 0.22 more) | ‐ | 22 | ⊕⊝⊝⊝ | ‐ |
| Clinical response: mean score/change in mental state: mean PANSS total score (high = poor) Medium term (26 weeks) | The mean score/change in mental state (PANSS total) ‐ medium term (26 weeks) was 0 | The mean score/change in mental state (PANSS total) ‐ medium term (26 weeks) in the intervention group was 1 more (7.91 fewer to 9.91 more) | ‐ | 16 | ⊕⊝⊝⊝ | ‐ |
| Leaving the study early: acceptability of treatment ‐ as measured by completion of trial Long term (52 weeks) | Study population | RR 1.60 | 24 | ⊕⊝⊝⊝ | ‐ | |
| 417 per 1000 | 667 per 1000 | |||||
| Moderate | ||||||
| 417 per 1000 | 667 per 1000 | |||||
| Service utilisation outcomes: hospital admission or days in hospital | See comment | See comment | Not estimable | ‐ | ‐ | No data reported. |
| Quality of life/satisfaction with care for either recipients of care or carers: significant change in quality of life/satisfaction | See comment | See comment | Not estimable | ‐ | ‐ | No data reported. |
| *The risk in the intervention group (and its 95% confidence interval) is based on the assumed risk in the comparison group and the relative effect of the intervention (and its 95% CI). CI: confidence interval; CLO: clozapine; PANSS: Positive and Negative Syndrome Scale; RCT: randomised controlled trial; RR: risk ratio. | ||||||
| GRADE Working Group grades of evidence | ||||||
| 1 Risk of bias: downgraded by 2 levels because high risk of performance bias, detection bias, attrition bias, and reporting bias. 2 Inconsistency and publication bias: not applicable (no meta‐analysis). 3 Indirectness: not downgraded because good applicability in terms of participants and interventions and rating score measures a participant‐important outcome (mental state). 4 Imprecision: downgraded by 2 levels because underpowered to detect difference and CI around relative effect includes appreciable benefit and harm (from less likely to over two times more likely to have no clinical response in mental state defined by PANSS 20% reduction). 5 Indirectness: not downgraded because good applicability (participants and interventions), and rating score measures a participant‐important outcome (global state). 6 Imprecision: downgraded by 1 level because underpowered to detect difference. Not downgraded by 2 levels because CI around mean difference does not include appreciable benefit and appreciable harm (total score on CGI = 7). 7 Imprecision: downgraded by 1 level because underpowered to detect difference. Not downgraded by 2 levels because CI around mean difference does not include appreciable benefit and appreciable harm (total score on PANSS = 120). 8 Indirectness: downgraded by 1 level because leaving the study early a surrogate for participant‐important outcome (acceptability of treatment). 9 Indirectness: downgraded by 2 levels because underpowered to detect difference and CI around relative effect includes appreciable benefit and harm (from less likely to over three times more likely to leave the study early). | ||||||
| Clozapine + ziprasidone versus clozapine + quetiapine for treatment‐resistant schizophrenia | ||||||
| Patient or population: people with treatment‐resistant schizophrenia Setting: inpatients and outpatients Intervention: ziprasidone (+ CLO) Comparison: quetiapine (+ CLO) | ||||||
| Outcomes | Anticipated absolute effects* (95% CI) | Relative effect | No of participants | Quality of the evidence | Comments | |
| Risk with quetiapine (+ CLO) | Risk with ziprasidone (+ CLO) | |||||
| Clinical response: no clinically significant response in mental state: ≥ 50% reduction in PANSS total score Medium term (12 weeks) | Study population | RR 0.54 | 63 | ⊕⊕⊝⊝ | ‐ | |
| 844 per 1000 | 456 per 1000 | |||||
| Moderate | ||||||
| 844 per 1000 | 456 per 1000 | |||||
| Adverse effects: weight gain | See comment | See comment | Not estimable | ‐ | ‐ | No data reported. |
| Clinical response: mean score/change in global state: mean CGI‐S score (high = poor) Medium term (12 weeks) | The mean score/change in global state (CGI‐S) ‐ medium term (12 weeks) was 0 | The mean score/change in global state (CGI‐S) ‐ medium term (12 weeks) in the intervention group was 0.7 fewer (1.18 fewer to 0.22 fewer) | ‐ | 60 | ⊕⊕⊝⊝ | ‐ |
| Clinical response: mean score/change in mental state: mean PANSS total score (high = poor) Medium term (12 weeks) | The mean score/change in mental state (PANSS total) ‐ medium term (12 weeks) was 0 | The mean score/change in mental state (PANSS total) ‐ medium term (12 weeks) in the intervention group was 12.3 fewer (22.43 fewer to 2.17 fewer) | ‐ | 60 | ⊕⊕⊝⊝ | ‐ |
| Leaving the study early: acceptability of treatment ‐ as measured by completion of trial | Study population | RR 0.52 | 63 | ⊕⊝⊝⊝ | ‐ | |
| 63 per 1000 | 33 per 1000 | |||||
| Moderate | ||||||
| 63 per 1000 | 33 per 1000 | |||||
| Service utilisation outcomes: hospital admission or days in hospital | See comment | See comment | Not estimable | ‐ | ‐ | No data reported. |
| Quality of life/satisfaction with care for either recipients of care or carers: significant change in quality of life/satisfaction | See comment | See comment | Not estimable | ‐ | ‐ | No data reported. |
| *The risk in the intervention group (and its 95% confidence interval) is based on the assumed risk in the comparison group and the relative effect of the intervention (and its 95% CI). CGI ‐S: Clinical Global Impression – Severity; CI: confidence interval; CLO: clozapine; PANSS: Positive and Negative Syndrome Scale; RCT: randomised controlled trial; RR: risk ratio; SD: standard deviation. | ||||||
| GRADE Working Group grades of evidence | ||||||
| 1 Risk of bias: downgraded by 2 levels because unclear (so potentially high) risk of biases (selection, performance, reporting). 2 Inconsistency and publication bias: not applicable (no meta‐analysis). 3 Indirectness: not downgraded because good applicability in terms of participants and interventions and rating scale measures a participant‐important outcome (mental state). 4 Imprecision: not downgraded because powered to detect difference and narrow CI. 5 Indirectness: not downgraded because good applicability (participants and interventions) and rating scale measures a participant‐important outcome (global state). 6 Indirectness: downgraded by 1 level because leaving the study early surrogate measure for participant‐important outcome (acceptability of treatment). 7 Imprecision: downgraded by 2 levels because underpowered to detect difference and CI around relative effect includes appreciable benefit and harm (from less likely to leave study early to five times more likely to leave study early). | ||||||
Background
Description of the condition
Treatment resistance is one of the most important clinical challenges in the management of schizophrenia (Dold 2014). There is no uniform definition of treatment resistance, however a review by Suzuki 2011 found that the majority of trials stipulated non‐response to at least two previous antipsychotic drugs for at least six weeks. For people with treatment‐resistant schizophrenia, clozapine is considered first‐line (NICE 2014). A large number of randomised trials have demonstrated the superior antipsychotic efficacy of clozapine in both treatment non‐resistant (Leucht 2013) and resistant participants (Samara 2016). However, due the risk of agranulocytosis, clozapine is only recommended for treatment‐resistant people.
Description of the intervention
Between 40% and 70% of people with treatment‐resistant schizophrenia do not respond to clozapine (Taylor 2000). As a result, a number of approaches to clozapine‐resistant schizophrenia have emerged. These include pharmacological and non‐pharmacological methods. For pharmacological methods, Dold 2014 distinguish combination strategies, the simultaneous administration of two different antipsychotic drugs, from augmentation strategies, the addition of a drug of a different class, such as an antidepressant or mood stabiliser. Unfortunately, the terms combination and augmentation are often interchanged.
How the intervention might work
Clozapine is a polyvalent drug that lacks high potency dopamine receptor blockade. It is thought that adding on an antipsychotic drug with strong anti‐dopaminergic activity produces an additive effect and improve clinical response. A number of meta‐analyses have been carried out to determine the efficacy of clozapine combination treatment, with inconsistent results. Barbui 2009 identified 21 studies comparing clozapine combination treatment to clozapine monotherapy or placebo. They found a significant benefit of combination treatment when all studies were included, but no significant effect when the data from the six double‐blind studies were extracted and analysed separately. In comparison, Taylor 2012 conducted a meta‐analysis on 14 double‐blind, randomised, placebo‐controlled trials including 734 participants and found a small but significant benefit of combination treatment over placebo.
Why it is important to do this review
The original version of this review highlighted the paucity of studies comparing different clozapine combination treatment strategies, and the methodological shortcomings of the included trials. In 2015, treatment‐resistant schizophrenia remained a big challenge in clinical practice. One review on the pharmacotherapy of treatment‐resistant schizophrenia concluded that there is no sufficient convincing evidence to recommend combination strategies generally (Dold 2014). However, on the basis of scientific reasoning, the authors suggested choosing two antipsychotic drugs with a different receptor binding profile, for example a multi‐receptor antagonist such as clozapine and a potent D2 antagonist. This pragmatic view is incorporated into treatment guidelines (NICE 2014). This review is needed to provide an evidence base for recommendations on combination treatment in people with schizophrenia who are clozapine resistant.
Objectives
To determine the clinical effects of various clozapine combination strategies with antipsychotic drugs in people with treatment‐resistant schizophrenia both in terms of efficacy and tolerability.
Methods
Criteria for considering studies for this review
Types of studies
We included all relevant randomised controlled trials (RCT). We planned to include 'double‐blind' trials if it was implied that the study was randomised, but none were described as such. We excluded quasi‐randomised studies, such as those allocating by using alternate days of the week.
Types of participants
We included people of both sexes, aged 18 years or more, with a diagnosis of treatment‐resistant schizophrenia or related disorders (e.g. schizoaffective disorder, schizophreniform disorder), however diagnosed. There is no clear evidence that the schizophrenia‐like psychoses are caused by fundamentally different disease processes or require different treatment approaches (Carpenter 1994).
Types of interventions
-
Clozapine plus another antipsychotic drug versus
-
clozapine plus a different other antipsychotic drug.
Any dose and means of administration was acceptable.
Types of outcome measures
We divided outcomes into short term (less than 12 weeks), medium term (12 weeks up to but not including 52 weeks), and long term (52 weeks and longer).
Primary outcomes
1. Clinical response.
1.1. No clinically significant response in global state ‐ as defined by each of the studies.
1.2. No clinically significant response in mental state ‐ as defined by each of the studies.
2. Adverse effect.
2.1. Weight gain.
Secondary outcomes
1. Clinical response.
1.1. Mean score/change in global state ‐ as defined by each of the studies.
1.2. Mean score/change in mental state ‐ as defined by each of the studies.
1.3. No clinically significant response in mental state (positive symptoms) ‐ as defined by each of the studies.
1.4. Mean score/change in mental state (positive symptoms) ‐ as defined by each of the studies.
1.5. No clinically significant response in mental state (negative symptoms) ‐ as defined by each of the studies.
1.6. Mean score/change in mental state (negative symptoms).
1.7. Use of additional medication (other than anticholinergic drugs) for psychiatric symptoms.
2. Adverse effects.
2.1. General adverse events.
2.1.1. Death: suicide or any causes.
2.2. Specific adverse events.
2.2.1. Clinically significant extrapyramidal adverse effects ‐ as defined by each of the studies.
2.2.2. Mean score/change in extrapyramidal adverse effects.
2.2.3. Use of antiparkinsonian drugs (i.e. anticholinergic drugs).
2.2.4. Blood dyscrasias such as agranulocytosis.
2.2.5. Hypersalivation.
2.3. Other adverse effects (general or specific).
3. Leaving the study early.
3.1. Acceptability of treatment ‐ as measured by completion of trial.
4. Service utilisation outcomes.
4.1. Hospital admission.
4.2. Days in hospital.
5. Economic outcomes.
6. Quality of life/satisfaction with care for either recipients of care or carers.
6.1. Clinically important change in quality of life/satisfaction ‐ as defined by each of the studies.
6.2. Mean score/change in quality of life/satisfaction scale.
'Summary of findings' table
We used the GRADE approach to interpret findings (Schünemann 2011) and used GRADE profiler (GRADEpro) to import data from Review Manager 5 (RevMan 2011) to create 'Summary of findings' tables. These tables provide outcome‐specific information concerning the overall quality of evidence from each included study in the comparison, the magnitude of effect of the interventions examined and the sum of available data on all outcomes we rated as important to patient care and decision making. We selected the following main outcomes for inclusion in the 'Summary of findings' table.
-
Clinical response ‐ no clinically significant response in mental state ‐ as defined by each of the studies.
-
Adverse effect ‐ weight gain.
-
Clinical response ‐ mean score/change in global state ‐ as defined by each of the studies.
-
Clinical response ‐ mean score/change in mental state ‐ as defined by each of the studies.
-
Leaving the study early ‐ acceptability of treatment ‐ as measured by completion of trial.
-
Service utilisation outcomes ‐ hospital admission or days in hospital.
-
Quality of life/satisfaction with care for either recipients of care or carers ‐ significant change in quality of life/satisfaction ‐ as defined by each of the studies ‐ or mean score/change in quality of life/satisfaction.
Search methods for identification of studies
We have updated the methods section of this review in line with latest Cochrane Schizophrenia recommendations. The methods section of the previous versions of this review can be found in Appendix 1.
Electronic searches
Cochrane Schizophrenia Group's Study‐Based Register of Trials
On 28 August 2015, the Information Specialist searched the Register using the following search strategy:
(*Clozapine*) in Title, Abstract, OR Index Terms of REFERENCE OR in Intervention of STUDY
In such a study‐based register, searching the major concept retrieves all the synonyms and relevant studies because all the studies have already been organised based on their interventions and linked to the relevant topics.
This register is compiled by systematic searches of major resources (including MEDLINE, Embase, AMED, BIOSIS, CINAHL, PsycINFO, PubMed, and registries of clinical trials) and their monthly updates, handsearches, grey literature, and conference proceedings (see Group's Module). There is no language, date, document type, or publication status limitations for inclusion of records into the register.
For previous searches, see Appendix 3.
Searching other resources
1. Reference searching
We checked reference lists of all identified studies for further relevant studies.
2. Personal contact
For the original search, we contacted the first author of each included study for information regarding unpublished trials and additional information. However, this was not done in this update.
Data collection and analysis
Selection of studies
The review authors (SB, OU, and MC) independently inspected all English language citations from the searches to identify relevant abstracts. The Chinese translators, Jun Xia and Juan Juan Ren did the same for the Chinese language citations. We obtained the full reports of the papers for more detailed inspection, before deciding whether the paper met the review criteria. We resolved any disagreement by consensus. There was no blinding to the names of authors, institutions, and journal of publication.
Data extraction and management
1. Extraction
Two review authors (SB and MC) independently extracted data from the newly included studies in English and resolved any disagreement by discussion with another review author (AC or UO). For the new Chinese language paper, translators Jun Xia and Juan Juan Ren extracted the data. Thus, double extraction was possible for all studies.
Where data were presented only in figures, we contacted the authors requesting the raw data. When there was no reply, two review authors (SB and MC) independently made estimations from the figures. Where estimations were within 0.2, they were averaged and rounded to one decimal point. Where there was greater than 0.2 discrepancy, we re‐examined the figure and obtained a third estimate. We felt imprecision was preferable to not including data in the analyses.
2. Management
2.1. Forms
We extracted data onto standard, simple forms.
2.2. Scale‐derived data
We included continuous data from rating scales only if:
-
the psychometric properties of the measuring instrument had been described in a peer‐reviewed journal (Marshall 2000);
-
the measuring instrument had not been written or modified by one of the trialists for that particular trial.
Ideally, the measuring instrument should have been either a self‐report or completed by an independent rater or relative (not the therapist).
2.3. Endpoint versus change data
There are advantages of both endpoint and change data. Change data can remove a component of between‐person variability from the analysis. However, calculation of change needs two assessments (baseline and endpoint) which can be difficult in unstable and difficult‐to‐measure conditions such as schizophrenia. We decided to primarily use endpoint data and only use change data if endpoint data were not available. We combined endpoint and change data in the analysis as we used mean differences (MD) rather than standardised mean differences (Higgins 2011, Chapter 9.4.5.2)
2.4. Skewed data
Continuous data on clinical and social outcomes are often not normally distributed. To avoid the pitfall of applying parametric tests to non‐parametric data, we aimed to apply the following standards to all data before inclusion:
-
standard deviations (SD) and means are reported in the paper or obtainable from the authors; but see Dealing with missing data;
-
when a scale starts from the finite number zero, the SD, when multiplied by two, is less than the mean (as otherwise the mean is unlikely to be an appropriate measure of the centre of the distribution (Altman 1996);
-
if a scale started from a positive value (such as Positive and Negative Syndrome Scale (PANSS) which can have values from 30 to 210) the calculation described above was modified to take the scale starting point into account. In these cases, skew is present if 2SD > (S ‐ Smin), where S is the mean score and Smin is the minimum score.
Endpoint scores on scales often have a finite start and end point and these rules can be applied. When continuous data are presented on a scale that includes a possibility of negative values (such as change data), it is difficult to tell whether data are skewed or not.
We planned to enter skewed data from studies of less than 200 participants into additional tables rather than an analysis. This was not required as no meta‐analysis was performed.
2.5. Common measure
To facilitate comparison between trials, we intended to convert variables that could be reported in different metrics, such as days in hospital (mean days per year, per week or per month) to a common metric (e.g. mean days per month). However, this was not required.
2.6. Conversion of continuous to binary
Where possible, we planned to convert outcome measures to dichotomous data. This can be done by identifying cut‐off points on rating scales and dividing participants accordingly into 'clinically improved' or 'not clinically improved'. It was generally assumed that if there had been a 50% reduction in a scale‐derived score such as the Brief Psychiatric Rating Scale (BPRS, Overall 1962) or the PANSS (Kay 1986), this could be considered as a clinically significant response (Leucht 2005a; Leucht 2005b). Where data based on these thresholds were not available, we used the primary cut‐off presented by the original authors.
Assessment of risk of bias in included studies
Two review authors (SB and MC) independently assessed the risk of bias for the new studies using the criteria described in the Cochrane Handbook for Systematic Reviews of Interventions to assess trial quality (Higgins 2011). This set of criteria is based on evidence of associations between overestimate of effect and high risk of bias of the article, such as sequence generation, allocation concealment, blinding, incomplete outcome data, and selective reporting. It was decided that where there were no or inadequate details, the risk of bias would be labelled as "unclear". We acknowledge that the risk of bias could alternatively have been labelled "high" in these cases. Indeed, when rating risk of bias as serious or very serious in the 'Summary of Findings' tables, it was decided where the risk of bias was predominantly unclear, this would correspond to a very serious rating, because of the high potential for bias. One review author (SB) updated the assessments made for the original studies to comply with the new format. AC supervised SB and MC in this process. We noted the level of risk of bias in both the text of the review (Risk of bias in included studies) and in the Characteristics of included studies table.
Measures of treatment effect
1. Binary data
For binary outcomes, we calculated a standard estimation of the risk ratio (RR) and its 95% confidence interval (CI). It has been shown that RR is more intuitive (Boissel 1999) than odds ratios and that odds ratios tend to be interpreted as RR by clinicians (Deeks 2000).
2. Continuous data
For continuous outcomes, we estimated mean difference (MD) between groups. We preferred not to calculate effect size measures (standardised mean difference SMD). However, had scales of very considerable similarity been used, we would have presumed there was a small difference in measurement, and we would have calculated effect size and transformed the effect back to the units of one or more of the specific instruments.
Unit of analysis issues
1. Cluster trials
Studies increasingly employ 'cluster randomisation' (such as randomisation by clinician or practice) but analysis and pooling of clustered data poses problems. Authors often fail to account for intraclass correlation in clustered studies, leading to a 'unit of analysis' error (Divine 1992), whereby P values are spuriously low, CIs unduly narrow and statistical significance overestimated. This causes type I errors (Bland 1997; Gulliford 1999).
We identified no cluster trials. However, had clustering not been accounted for in primary studies, we would have presented data in a table, with a (*) symbol to indicate the presence of a probable unit of analysis error. In subsequent versions of this review, we will seek to contact first authors of studies to obtain intraclass correlation coefficients (ICC) for their clustered data and to adjust for this by using accepted methods (Gulliford 1999). If clustering has been incorporated into the analysis of primary studies, we would present these data as if from a non‐cluster randomised study, but adjusted for the clustering effect.
We have sought statistical advice and have been advised that the binary data as presented in a report should be divided by a 'design effect'. This is calculated using the mean number of participants per cluster (m) and the ICC (design effect = 1 + (m ‐ 1) × ICC) (Donner 2002). If the ICC was not reported, we assumed it to be 0.1 (Ukoumunne 1999).
If cluster studies have been appropriately analysed taking into account ICCs and relevant data documented in the report, synthesis with other studies would have been possible using the generic inverse variance technique.
2. Cross‐over trials
A major concern of cross‐over trials is the carry‐over effect. It occurs if an effect (e.g. pharmacological, physiological, or psychological) of the treatment in the first phase is carried over to the second phase. As a consequence, on entry to the second phase the participants can differ systematically from their initial state despite a washout phase. For the same reason, cross‐over trials are not appropriate if the condition of interest is unstable (Elbourne 2002). As both effects are very likely in severe mental illness, we intended to only use data of the first phase of cross‐over studies. However, we identified no cross‐over trials.
3. Studies with multiple treatment groups
We identified no studies with more than two treatment arms. However, had this been the case, the additional treatment arms would be presented in comparisons if relevant. The binary data would be simply added and combined within the two‐by‐two table, and the continuous data combined following the formula in Section 7.7.3.8 (Combining groups) of the Cochrane Handbook for Systematic Reviews of Interventions. Where the additional treatment arms were not relevant, these data would not have been reproduced.
Dealing with missing data
1. Overall loss of credibility
At some degree of loss of follow‐up, the findings of a trial must lose credibility (Xia 2009). We decided that, for any particular outcome, should more than 50% of data be unaccounted for, we would not reproduce these data or use them within the analyses. However, if more than 50% of those in one arm of a study were lost, but the total loss was less than 50%, we marked such data with (*) to indicate that such a result may well be prone to bias.
2. Binary
If attrition for a binary outcome was between 0% and 50% and where these data were not clearly described, we presented data on an intention‐to‐treat basis. Those leaving the study early are all assumed to have the same rates of negative outcome as those who completed, with the exception of the outcome of death and adverse effects. If any data were identified for these outcomes, we used the rate of those who stayed in the study ‐ in that particular arm of the trial ‐ for those who did not. We planned to undertake a sensitivity analysis testing how prone the primary outcomes were to change when 'completer' data only were compared to the intention‐to‐treat analysis using the above assumptions.
If attrition for a binary outcome was between 0% and 50% and outcomes of these people were described, we included these data as reported. Where these data were not clearly described, for the primary outcome we assumed the worst for each person who was lost, and for adverse effects we assumed rates similar to those among participants who did continue to have their data recorded.
3. Continuous data
3.1. Attrition
In the case where attrition for a continuous outcome was between 0% and 50% and completer‐only data were reported, we have reproduced these.
3.2. Standard deviations
SDs were not reported in one study, and presented only in figures in another. We planned to obtain the missing values from the authors. When this failed, and there were missing measures of variance for continuous data, but an exact standard error (SE) and CIs available for group means, and either P value or 't' value available for differences in mean, we calculated SDs according to the rules described in the Cochrane Handbook for Systematic Reviews of Interventions (Higgins 2011): when only the SE is reported, SDs are calculated by the formula SD = SE × square root (n). Chapters 7.7.3 and 16.1.3 of the Cochrane Handbook for Systematic Reviews of Interventions present detailed formula for estimating SDs from P values, t or F values, CIs, ranges or other statistics (Higgins 2011). If these formulae did not apply, we planned to calculate the SDs according to a validated imputation method which is based on the SDs of the other included studies (Furukawa 2006). Although some of these imputation strategies can introduce error, the alternative would be to exclude a given study's outcome and thus to lose information. We planned to examine the validity of the imputations in a sensitivity analysis excluding imputed values.
3.3. Last observation carried forward
We anticipated that some studies would use the method of last observation carried forward (LOCF) within the study report. As with all methods of imputation to deal with missing data, LOCF introduces uncertainty about the reliability of the results (Leucht 2007). Therefore, where LOCF data were used in the trial, if less than 50% of the data were assumed, we reproduced these data and indicated that they were the product of LOCF assumptions.
Assessment of heterogeneity
No formal meta‐analysis was possible. As such, assessment of heterogeneity between trials was not required. The following outlines the methods we would have taken.
1. Clinical heterogeneity
We would have considered all included studies initially, without seeing comparison data, to judge clinical heterogeneity. We would have inspected all studies for clearly outlying situations or people which we had not predicted would arise. Should such outliers have arisen, we would have discussed them.
2. Methodological heterogeneity
We would have considered all included studies initially, without seeing comparison data, to judge methodological heterogeneity. We would have inspected all studies for clearly outlying methods which we had not predicted would arise. Should such outliers have arisen, we would have discussed them.
3. Statistical heterogeneity
3.1. Visual inspection
We would have visually inspected graphs to investigate the possibility of statistical heterogeneity.
3.2. Employing the I2 statistic
Heterogeneity between studies could have been investigated by considering the I2 method alongside the Chi2 P value. The I2 statistic provides an estimate of the percentage of inconsistency thought to be due to chance (Higgins 2003). The importance of the observed I2 statistic depends on magnitude and direction of effects and strength of evidence for heterogeneity (e.g. P value from the Chi2 test, or a CI for the I2 statistic). We interpreted an I2 statistic estimate of 50% of greater accompanied by a statistically significant Chi2 statistic as evidence of substantial levels of heterogeneity (Section 9.5.2 of the Cochrane Handbook for Systematic Reviews of Interventions; Higgins 2011). If we had found substantial levels of heterogeneity in the primary outcome, we would have explored reasons for heterogeneity (Subgroup analysis and investigation of heterogeneity).
Assessment of reporting biases
1. Protocol versus full study
Reporting biases arise when the dissemination of research findings is influenced by the nature and direction of results (Egger 1997). These are described in Section 10 of the Cochrane Handbook for Systematic Reviews of Interventions (Higgins 2011). We tried to locate protocols of the included RCTs and compared outcomes in the protocol and the published report. This was possible for two out of five studies.
2. Funnel plot
We are aware that funnel plots may be useful in investigating reporting biases but are of limited power to detect small‐study effects. We intended not to used funnel plots for outcomes where there were 10 or fewer studies, hence we have not included any.
Data synthesis
We understand that there is no closed argument for preference for use of fixed‐effect or random‐effects models. The random‐effects method incorporates an assumption that the different studies are estimating different, yet related, intervention effects. The random‐effects model takes into account differences between studies even if there is no statistically significant heterogeneity. However, there is a disadvantage to the random‐effects model as it puts added weight onto small studies which often are the most biased ones. Depending on the direction of effect these studies can either inflate or deflate the effect size. We chose the random‐effects model for all analyses.
Subgroup analysis and investigation of heterogeneity
1. Subgroup analyses
No subgroup analysis was planned.
2. Investigation of heterogeneity
We planned to report if inconsistency between studies was high. First, we planned to check data had been entered correctly. Second, we planned to visually inspect the graph and successively remove outlying studies to see if heterogeneity was restored. Should this have occurred with no more than 10% of the data being excluded, we planned to present data. If not, we would not have pooled data and would have discussed issues.
Should unanticipated clinical or methodological heterogeneity have been obvious, we would have simply stated hypotheses regarding these for future reviews or versions of this review. We did not anticipate undertaking analyses relating to these.
Sensitivity analysis
No sensitivity analyses were performed. The following describes the procedures we planned to follow.
1. Implication of randomisation
We aimed to include trials in a sensitivity analysis if they were described in some way as to imply randomisation. For the primary outcomes, we planned to include these studies and if there was no substantive difference when the implied randomised studies were added to those with better description of randomisation, then we planned to use all data from these studies.
2. Assumptions for lost binary data
Where assumptions have to be made regarding people lost to follow‐up, we planned to compare the findings of the primary outcomes when we used our assumption compared with completer data only. If there was a substantial difference, we planned to report results and discuss them but continue to employ our assumption.
Where assumptions had to be made regarding missing SD data, we planned to compare the findings on primary outcomes when we used our assumption compared with completer data only. We planned to undertake a sensitivity analysis testing how prone results were to change when 'completer' data only were compared to the imputed data using the above assumption. If there was a substantial difference, we planned to report results and discuss them but continue to employ our assumption.
3. Risk of bias
We planned to analyse the effects of excluding trials that were at high risk of bias across one or more of the domains of randomisation (implied as randomised with no further details available) allocation concealment, blinding and outcome reporting for the meta‐analysis of the primary outcomes. If the exclusion of trials at high risk of bias did not substantially alter the direction of effect or the precision of the effect estimates, then we planned to include data from these trials in the analysis.
4. Imputed values
If required, we planned to undertake a sensitivity analysis to assess the effects of including data from trials where we used imputed values for ICC in calculating the design effect in cluster‐randomised trials. If there were substantial differences in the direction or precision of effect estimates in any of the sensitivity analyses listed above, we would not have pooled data from the excluded trials with the other trials contributing to the outcome, but presented them separately.
5. Fixed and random effects
We used a random‐effects model to synthesis all data; however, we planned to also synthesise data for the primary outcomes using a fixed‐effect model to evaluate whether the greater weights assigned to larger trials with greater event rates altered the significance of the results compared to the more evenly distributed weights in the random‐effects model.
Results
Description of studies
For substantive descriptions of studies see the Characteristics of included studies and Characteristics of excluded studies tables.
Results of the search
The original search for this review (March and November 2008) yielded 1331 references of potentially eligible studies, of which we obtained 68 full‐text papers for a second assessment after checking titles and abstracts. After exclusion of papers not meeting the inclusion criteria (four studies not randomised, 14 did not include participants with treatment‐resistant schizophrenia, 50 did not meet the intervention criteria e.g. no combination treatment arm comparison), the original review included three RCTs (Genç 2007; Kong 2001; Zink 2009).
The search update (August 2015) yielded 358 additional references. We obtained nine full‐text articles for a second assessment of seven individual new studies, four of which were English language and reviewed by SB, MC and OU, and three of which were Chinese language and reviewed by translators Jun Xia and Juan Juan Ren. After exclusion of papers not meeting the inclusion criteria (two did not include people with treatment‐resistant schizophrenia, three did not meet the intervention criteria, e.g. no combination treatment arm), we added two additional RCTs to the review (Cipriani 2013a; Wen 2015). Cipriani 2013a reported the long‐term data from a study with an earlier reference (Barbui 2011). In addition, an update to Zink 2009 was identified with medium‐term and long‐term data (Kuwilsky 2010).
See Figure 1 which presents the PRISMA flow diagram of the updated version of review.

Study flow diagram (2015 update).
Included studies
The current version of the review includes five studies.
1. Study design
All studies used a parallel group design.
2. Length of trials
Genç 2007 and Kong 2001 were short‐term studies with a duration of eight weeks. Wen 2015 was a medium‐term study with a duration of 12 weeks. Both Cipriani 2013a and Kuwilsky 2010 were long‐term studies with a duration of 52 weeks.
3. Participants
All the participants had a diagnosis of schizophrenia or related disorders. Cipriani 2013a, Genç 2007, Kuwilsky 2010, and Wen 2015 used Diagnostic and Statistical Manual of Mental Disorders Fourth Edition (DSM‐IV) to provide diagnostic criteria. Kong 2001 used Chinese criteria (Chinese Classification of Mental Disorders, Second Edition, Revised; CCMD‐2‐R). In addition, the participants were all described as treatment‐resistant with partial response to clozapine.
The definition of partial response varied. Cipriani 2013a used persistent positive symptoms despite at least six months of treatment with clozapine 400 mg/day or greater. Genç 2007 used a score of greater than 45 on the BPRS or a rating of greater than 4 on at least two of the four BPRS positive symptom items, despite at least 12 weeks of clozapine 400 mg/day to 600 mg/day. Kuwilsky 2010 defined partial response as a PANSS total score of 65 or greater despite at least 12 weeks of clozapine 300 mg/day, and Wen 2015 used a PANSS score of 80 or greater and Clinical Global Impression ‐ Severity (CGI‐S) score of 4 or greater after at least 12 weeks of clozapine 400 mg/day or greater. Kong 2001 did not provide details of their definition.
Only Cipriani 2013a and Kuwilsky 2010 reported mean number of hospital admissions prior to randomisation by group, which ranged between three and seven. Most studies included both inpatients and outpatients. Only Kong 2001 included only inpatients. Three studies clearly reported inclusion and exclusion criteria (Genç 2007; Kuwilsky 2010; Wen 2015). All three excluded people with substance abuse. Cipriani 2013a reported only inclusion criteria and Kong 2001 reported neither inclusion or exclusion criteria.
4. Study size
All studies were small. The number of participants in each study were 106 (Cipriani 2013a), 56 (Genç 2007), 60 (Kong 2001), 24 (Kuwilsky 2010), and 63 (Wen 2015). In total, 309 participants participated in the five trials.
5. Interventions
No two studies compared the same two combination treatment strategies. Cipriani 2013a compared clozapine plus haloperidol to clozapine plus aripiprazole. Genç 2007 compared clozapine plus amisulpride to clozapine plus quetiapine. Kong 2001 compared clozapine plus risperidone to clozapine plus sulpiride. Kuwilsky 2010 compared clozapine plus ziprasidone to clozapine plus risperidone. Wen 2015 compared clozapine plus ziprasidone to clozapine plus quetiapine.
6. Dosing
In Cipriani 2013a, clinicians were allowed to prescribe the allocated pharmacological treatments (starting dose and dose changes) according to clinical status and circumstances. The mean baseline dose of clozapine was 413 mg/day (SD 157) for the haloperidol group and 418 mg/day (SD 141) for the aripiprazole group. The mean baseline dose of haloperidol was 2.1 mg/day (SD 1.3) and of aripiprazole was 8.7 mg/day (SD 3.9). Twelve week but not endpoint (52 week) mean doses were reported.
In Genç 2007, the mean baseline dose of clozapine was 550 mg/day (SD 127.09) in the amisulpride group and 536.95 mg/day (SD 125.42) in the quetiapine group. These doses remained stable throughout the study. The mean dose of amisulpride added was 437.03 mg/day (SD 104.32), and the maximum was 600 mg/day. The mean dose of quetiapine added was 595.65 mg/day (SD 125.21), and the maximum was 900 mg/day. Participants judged to be unable to tolerate the dose escalation schedule because of adverse effects were maintained at their maximum tolerated dose for the remainder of the study. No endpoint mean doses were reported.
Kong 2001 did not report the baseline clozapine dose, only the maximum, which was 400 mg/day in the risperidone group and 500 mg/day in the sulpiride group. Risperidone was started at 4 mg/day and the final dose was 6 mg/day; sulpiride was started at 800 mg/day and the final dose was 1200 mg/day. No endpoint mean doses were reported.
In Kuwilsky 2010, the mean baseline dose of clozapine was 437.5 mg/day (SD 140.4) in the risperidone group and 370.8 mg/day (SD 150.0) in the ziprasidone group. Risperidone and ziprasidone were titrated starting with doses of 1 mg and 20 mg respectively. The final doses followed clinical requirements, with the mean dose of risperidone 3.82 mg/day (SD 1.8) and ziprasidone 134 mg/day (SD 34.4). During the trial, reductions of clozapine by 50 mg per week were allowed, and the mean dose of clozapine at the end point (52 weeks) was 325 mg/day (SD 185.4) in the ziprasidone group and 450 mg/day (SD 168.3) in the risperidone group.
In Wen 2015, the baseline mean dose of clozapine was 479 mg/day (SD 56.5) in the ziprasidone group, and 481.3 mg/day (SD 51.7) in the quetiapine group. Ziprasidone and quetiapine were added during the first week. The dose of ziprasidone was titrated from 80 mg/day finishing at 120 mg/day to 160 mg/day, and the dose of quetiapine from 200 mg/day finishing at 400 mg/day to 750 mg/day. One week after ziprasidone or quetiapine was added, the dose of clozapine was reduced accordingly. No end point mean doses were reported.
7. Leaving the study early
In Cipriani 2013a, 19 participants in the aripiprazole group and 15 participants in the haloperidol group left early during the 12‐month follow‐up period. Reasons for leaving by 12 weeks were given and included lack of efficacy, acceptability problems, and lack of adherence. All randomised participants who received at least one dose of the investigational drugs were included in the intention‐to‐treat analysis (except one participant for whom rating scores were not completed at three months and who was subsequently excluded from analysis of these variables).
In Genç 2007, five participants in the quetiapine group discontinued the study within the first two weeks for reasons of exacerbation of psychotic symptoms (four participants) and lack of efficacy (one participant). One participant in the amisulpride group was missed in follow‐up after the second week. These six participants were excluded both from the analysis and from reporting of baseline characteristics.
In Kong 2001 all participants completed the study (no‐one left early).
In Kuwilsky 2010, more than 50% of participants had left by 52 weeks. Seven out of 12 remained in the ziprasidone group and four out of 12 remained in the risperidone group. Reasons for leaving early included akathisia, feelings of agitation and insufficient treatment response. Four participants withdrew their consent with no further explanation given. Participants who left the study early were excluded from further assessment.
In Wen 2015, one participant in the ziprasidone group and two participants in the quetiapine group left early due to adverse effects. These participants were excluded from the analyses of global and mental state outcomes, but included in the analyses of adverse events.
8. Outcomes scales
A variety of scales were used to assess clinical response and adverse events. We present details of the scales that provided useable data below.
8.1. Global state
8.1.1. Clinical Global Impression Scale (CGI)
The CGI is a collection of rating scales commonly used in studies of schizophrenia that enable clinicians to quantify severity of illness, global improvement, therapeutic effect, and adverse effects during therapy (Guy 1976). These mostly 7‐point scales, from 'normal' (1 point) to 'extremely ill' (7 points), require the clinician to compare the person to typical people in their clinical experience.
8.2. Mental state
8.2.1. Brief Psychiatric Rating Scale (BPRS)
The BPRS is used to assess the severity of a range of psychiatric symptoms, including psychotic symptoms (Overall 1962). The scale has 18 items, and each item can be defined on a 7‐point scale varying from 'not present' (1 point) to 'extremely severe' (7 points). Scoring is from 18 to 126.
8.2.2. Positive and Negative Syndrome Scale (PANSS)
The PANSS scale was developed to evaluate the positive, negative, and general symptoms in schizophrenia (Kay 1986). The scale has 30 items and each item can be defined on a 7‐point scoring system varying from 'absent' (1 point) to 'extreme' (7 points). This scale can be divided into subscales for measuring the severity of general psychopathology, positive symptoms, negative symptoms, mania (excited component), and aggression (Supplemental Aggression Risk Profile). Total PANSS score is from 30 to 210. Higher scores indicate more pronounced symptomatology.
8.2.3. Hamilton Rating Scale for Depression (HAMD)
The HAMD instrument is designed to be used only on people already diagnosed as having an affective disorder of depressive type (Hamilton 1960). It is used for quantifying the results of an interview, and its value depends entirely on the skill of the interviewer in eliciting the necessary information. The scale contains 17 variables measured on either a 5‐point, from 'absent' (0 points) to 'very severe' (4 points), or a 3‐point rating scale, the latter being used where quantification of the variable is either difficult or impossible. Among the variables are depressed mood, suicide, work and loss of interest, retardation, agitation, gastrointestinal symptoms, general somatic symptoms, hypochondriasis, loss of insight, and loss of weight. It is useful to have two raters independently scoring a person at the same interview. The scores of the person are obtained by summing the scores of the two raters.
8.2.4. Global Assessment of Functioning (GAF)
GAF is a rating scale for a person's overall capacity of psychosocial functioning scoring from 1 to 100 (APA 2004). Higher scores indicate a higher level of functioning.
8.2.5. Scale for the Assessment of Positive Symptoms (SAPS)
The SAPS measures positive symptoms in schizophrenia (Andreasen 1984a). It has 35 items split into four domains (hallucinations, delusions, bizarre behaviour, and positive formal thought disorder), each rated from 'absent' (0 points) to severe (5 points).
8.2.6. Scale for the Assessment of Negative Symptoms (SANS)
The SANS measures negative symptoms in schizophrenia (Andreasen 1984b). It has 26 items split into five domains (affective flattening or blunting, alogia, avolition, anhedonia, and attention), each rated from 'absent' (0 points) to 'severe' (5 points).
8.3. Adverse effects scales
8.3.1. Simpson Angus Scale (SAS)
The SAS is a 10‐item scale, with a scoring system of 0 points to 4 points for each item, measures drug‐induced parkinsonism, a short‐term drug‐induced movement disorder (Simpson 1970). A low score indicates low levels of parkinsonism.
8.3.2. Extrapyramidal Symptom Rating Scale (EPS)
The EPS consists of a questionnaire relating to parkinsonism, akathisia, dystonia, and dyskinesia, with seven items scored on a 4‐point scale from 'absent' (0 points) to 'severe' (3 points) symptoms, and a physician's examination for parkinsonism and akathisia (seven items), dystonia (one item), and dyskinetic movement (seven items), all scored on a 7‐point scale from 0 to 6 depending on severity and frequency (Chouinard 1980). The clinician also completes four clinical global impression scores for the severity of dyskinesia, parkinsonism, dystonia, and akathisia. High scores indicate severe levels of movement disorder.
8.3.3. Hillside Akathisia Scale (HAS)
The HAS consists of two subjective and three objective items which the assessor rates on a 5‐point scale from 'absent' (0 points) to 'present and not controllable' (4 points) (Fleischhacker 1989). There is also a rating from 0 to 7 of severity of akathisia according to clinical experience, and improvement in condition compared to admission.
8.3.4. Liverpool University Neuroleptic Side Effect Rating Scale (LUNSERS)
The LUNSERS is a self‐assessment tool for measuring the adverse effects of antipsychotic medications (Day 1995). There are 41 questions covering extrapyramidal, psychic, anticholinergic, other autonomic, hormonal, allergic, and miscellaneous adverse effects. In addition, there are 10 'red‐herrings' (questions which are intended to be misleading or distracting) designed to test for over‐rating. It is a check‐box format with a 5‐point scale from 'not at all' (0 points) to 'very much' (4 points). A high score indicates a high adverse‐effect rating.
8.3.5. Udvalg for Kliniske Undersgelser (UKU) Side Effects Rating Scale
The UKU is a clinician‐rated score based on 48 items covering psychic, neurological, autonomic, and miscellaneous adverse effects, scored from 0 points to 3 points in severity over the last three days (Lingjærde 1987). In addition, there is a 4‐point scale for effect on daily performance from 'no side effects' (0 points) to 'side effects that interfere markedly with the participant's performance' (3 points).
9. Missing outcomes
No studies reported data on service utilisation outcomes, economic outcomes, or quality of life/satisfaction with care for either recipients of care or carers.
Excluded studies
In the original review, we obtained 24 full‐text papers for a second assessment, of which 21 studies did not meet inclusion/exclusion criteria. In the update, we obtained nine full‐text papers for a second assessment, two of which were publications of the same study. We excluded five studies (see Characteristics of excluded studies table for details).
Awaiting classification
There are no trials awaiting classification.
Ongoing studies
There are no ongoing studies we are aware of.
Risk of bias in included studies
For graphical representations of our judgements of risk of bias, refer to Figure 2 and Figure 3. For full details of judgements see 'Risk of bias' tables.

Methodological quality graph: review authors' judgements about each methodological quality item presented as percentages across all included studies.
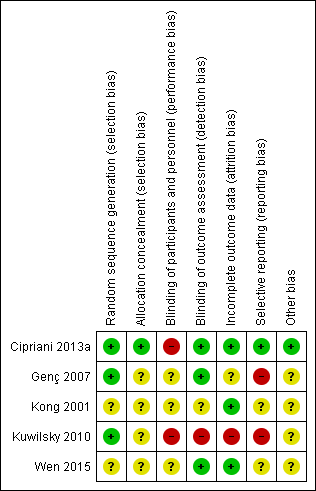
Methodological quality summary: review authors' judgements about each methodological quality item for each included study.
Allocation
Four out of five studies were described as randomised, but only Cipriani 2013a and Kuwilsky 2010 provided adequate details to be rated low risk for random sequence generation. In both of these studies, a trial biostatistician was responsible for randomisation using a computer‐based method. Kong 2001 provided insufficient information to comment on allocation.
The remainder were rated as unclear. It was noted that in Kong 2001, the baseline characteristics of participants in the two groups (duration of illness, mean score on PANSS) were very similar. Considering that this study recruited only 30 participants per arm, it is difficult to explain this scenario by means of a proper randomisation or by chance alone.
Only Cipriani 2013a provided details of allocation concealment. In this study, recruiting physicians were asked to contact an administrator at the co‐ordinating site by telephone, who accessed a computerised system that provided the participant's allocated treatment. The administrator had no access to the randomisation lists, and the site investigators did not know the randomisation block size. This way, the treatment allocation was fully concealed, and this study was rated low risk. All other studies were rated as unclear.
Blinding
Both Cipriani 2013a and Kuwilsky 2010 had a naturalistic, open‐label design. The limitation of this study design is a high risk of performance bias, although this may be less problematic in head‐to‐head trials as compared to placebo controlled. Even though not clearly reported in the paper, it seems that Genç 2007 was an open study (participants and providers were probably aware of the allocated treatment) and thus also at high risk of performance bias. Wen 2015 was described as single blind, so rated as unclear risk for performance bias.
Evaluation of outcomes in Cipriani 2013a, Genç 2007, and Wen 2015 was carried out by blinded assessors. As a result, these studies had a low risk of detection bias. This was not the case for Kuwilsky 2010, where assessors were aware of the allocated treatment.
Kong 2001 did not report on blinding, so the risk of both performance and detection bias was rated unclear.
Incomplete outcome data
In Cipriani 2013a, 19 participants in the aripiprazole group and 15 participants in the haloperidol group dropped out during the 12‐month follow‐up period. Reasons for leaving early by 12 weeks were given and were balanced between groups. All randomised participants who received at least one dose of investigation drugs were included in the intention‐to‐treat analysis of their primary outcome (leaving the study early). Only one participant was not included in the analysis of the BPRS and LUNSERS continuous outcomes due to failure to complete these rating scales at three months. Therefore, this study was rated as low risk of attrition bias.
In Genç 2007, five participants in the quetiapine group dropped out and one participant in the amisulpride group was missed at follow‐up at two weeks. These six participants were excluded from the analysis and from the reporting of baseline characteristics. There was no significant difference between groups, but this did not confirm the absence of bias, especially because this is a small study (n = 56). Moreover, reasons for incomplete data are not balanced between groups. Therefore, this study was rated as unclear risk for attrition bias.
In Kong 2001, all participants randomised completed the trial, so was rated low risk for attrition bias.
In Kuwilsky 2010, more than 50% of participants had dropped out by 52 weeks. There was no intention‐to‐treat analysis. As a result, this study is rated high risk for attrition bias. Moreover, the 52‐week data has not been included in our analyses, as per our protocol.
In Wen 2015, the three participants who dropped out were excluded from the analyses of global and mental state outcomes, but included in the analyses of adverse events. Since the attrition rate was less than 5%, and reasons were balanced between groups, the study was rated as low risk.
Selective reporting
All primary outcomes in Cipriani 2013a were prespecified in the trial protocol (Nosè 2009), and so it was rated low risk for reporting bias. However, it was noted that some secondary outcomes (mean dose of clozapine, prolactin, QTc interval) were only reported at 12 weeks.
No protocol was available for Genç 2007. Alone this would lead to an unclear risk. However, because no SDs were given for various scales (BPRS, SAPS, SANS, CGI), this study was rated high risk for reporting bias.
The protocol for Kuwilsky 2010 (NCT00224315) detailed six primary outcome measures (PANSS, SANS, HAMD, GAF, CGI, and QTc) and six secondary outcome measures (bodyweight, extrapyramidal motor symptom, akathisia, prolactin, blood pressure, and heart rate). It is not clear from the protocol that the authors intended to report PANSS total, PANSS positive, PANSS negative, and PANSS global psychopathology separately. In addition, there were no SDs reported for some outcomes, such as CGI and GAF at 26 and 52 weeks, and weight gain. As a result, Kuwilsky 2010 was rated as high risk for reporting bias.
For Kong 2001 and Wen 2015, no protocol was available, so these studies were rated as unclear risk for reporting bias.
Other potential sources of bias
We did not identify any other potential sources of bias in one out of five of the included studies (Cipriani 2013a). We judged the remaining four studies as unclear in this respect (for various reasons).
Effects of interventions
See: Summary of findings for the main comparison CLOZAPINE + ARIPIPRAZOLE versus CLOZAPINE + HALOPERIDOL (Cipriani 2013); Summary of findings 2 CLOZAPINE + AMISULPIRIDE versus CLOZAPINE + QUETIAPINE (Genc 2007); Summary of findings 3 CLOZAPINE + RISPERIDONE versus CLOZAPINE + SULPIRIDE (Kong 2001); Summary of findings 4 CLOZAPINE + RISPERIDONE versus CLOZAPINE + ZIPRASIDONE (Kuwilsky 2010); Summary of findings 5 CLOZAPINE + ZIPRASIDONE versus CLOZAPINE + QUETIAPINE (Wen 2015)
The results of the analyses are presented below. Where there were no data available for the primary outcomes, we have highlighted this. However, we have chosen not to list the missing secondary outcomes, and the reader is referred to the Secondary outcomes section to see the full list. No studies reported data on service utilisation outcomes, economic outcomes, or quality of life/satisfaction with care for either recipients of care or carers.
Two studies reported data on clozapine dose during the follow‐up period. This was not an outcome specified in our protocol, but it has clinical relevance as combination treatment might have the benefit of reducing clozapine dose. In Cipriani 2013a, the mean dose of clozapine in the haloperidol group was 413 mg/day (SD 157) at baseline and 395 mg/day (SD 161) at 12 weeks. In the aripiprazole group, the mean dose was 418 mg/day (SD 141) at baseline and 421 mg/day (SD 142) at 12 weeks. There was no significant difference between groups at 12 weeks. In Kuwilsky 2010, the dose of clozapine was reported at baseline, six weeks, 26 weeks, and 52 weeks. In the risperidone group, the doses were 437.5 mg/day (SD 140.4), 406.8 mg/day (no SD reported), 422.2 mg/day (SD 128.4), and 450 mg/day (SD 168.3), respectively. In the ziprasidone group, the doses were 370.8 mg/day (SD 150.0), 361.4 mg/day (no SD reported), 307.1 mg/day (SD 171.8), and 325 mg/day (SD 185.4), respectively. The dose reduction of clozapine was significant in the ziprasidone group.
1. Comparison 1: CLOZAPINE + ARIPIRAZOLE versus CLOZAPINE + HALOPERIDOL
One study provided data (n = 106) (Cipriani 2013a).
1.1. Clinical response: mean score/change in mental state ‐ mean change in BPRS score from baseline (high = good)
The study reported change data for BPRS score. There was no difference in change in BPRS score between groups at 12 weeks (1 RCT, n = 105, MD ‐1.40, 95% CI ‐5.59 to 2.79), or 52 weeks (1 RCT, n = 105, MD 0.90, 95% CI ‐4.38 to 6.18) (Analysis 1.1).
1.2. Adverse effects: other adverse effects (general or specific) ‐ mean change in LUNSERS score from baseline (high = poor)
The study presented LUNSERS total score as a measure of subjective tolerability and reported mean change in score and SDs. There was a significant difference between groups in change of LUNSERS total score at 12 weeks favouring aripiprazole (1 RCT, n = 105, MD ‐4.90, 95% CI ‐8.48 to ‐1.32). However, at 52 weeks there was no significant difference between groups (1 RCT, n = 105, MD ‐4.80, 95% CI ‐9.79 to 0.19) (Analysis 1.2).
1.3. Leaving the study early: acceptability of treatment ‐ as measured by completion of trial
There was no significant difference between groups in number of participants withdrawing from allocated treatment at 12 weeks (1 RCT, n = 106, RR 0.88, 95% CI 0.34 to 2.24), or 52 weeks (1 RCT, n = 106, RR 1.27, 95% CI 0.72 to 2.22) (Analysis 1.3).
1.4. Missing outcomes
There were no usable data available for any other prespecified outcomes.
2. Comparison 2: CLOZAPINE + AMISULPRIDE versus CLOZAPINE + QUETIAPINE
One study provided data (n = 56) (Genç 2007).
2.1. Clinical response: 1. mean score/change in global state ‐ mean CGI score (high = poor)
Mean CGI scores were estimated from the figures, and SDs calculated from MDs and t values. There was a significant difference between groups at eight weeks favouring amisulpride (1 RCT, n = 50, MD ‐0.90, 95% CI ‐1.38 to ‐0.42) (Analysis 2.1).
2.2. Clinical response: 2a. mean score/change in mental state ‐ mean BPRS score (high = poor)
Mean scores were estimated from the figures, and SDs calculated from MDs and t value. There was a significant difference between groups for BPRS at eight weeks favouring amisulpride (1 RCT, n = 50, MD ‐4.00, 95% CI ‐5.86 to ‐2.14) (Analysis 2.2).
2.3. Clinical response: 2b. mean score/change in mental state ‐ mean SAPS score (high = poor)
Mean scores were estimated from the figures, and SDs calculated from MDs and t value. There was a significant difference between groups for SAPS at eight weeks favouring amisulpride (1 RCT, n = 50, MD ‐6.90, 95% CI ‐12.82 to ‐0.98) (Analysis 2.3).
2.4. Clinical response: 2c. mean score/change in mental state ‐ means SANS score (high = poor)
Mean scores were estimated from the figures, and SDs calculated from MDs and t values. There was a significant difference between groups for SANS at eight weeks favouring amisulpride (1 RCT, n = 50, MD ‐5.20, 95% CI ‐7.14 to ‐3.26) (Analysis 2.4).
2.5. Leaving the study early: acceptability of treatment ‐ as measured by completion of trial
There was no significant difference between groups in number of participants leaving the study early (1 RCT, n = 56, RR 0.20, 95% CI 0.02 to 1.60) (Analysis 2.5).
2.6. Missing outcomes
There were no usable data available for any other prespecified outcomes.
3. Comparison 3: CLOZAPINE + RISPERIDONE versus CLOZAPINE + SULPIRIDE
3.1. Clinical response: no clinically significant response in mental state ‐ reduction in PANSS total score of 20% to 50%
Kong 2001 defined clinical improvement as a 20% to 50% reduction on PANSS total score. There was no significant difference between groups (1 RCT, n = 60, RR 0.82, 95% CI 0.40 to 1.68) (Analysis 3.1).
3.2. Adverse effect: weight gain
There was no significant difference between groups in weight gain (1 RCT, n = 60, RR 0.40, 95% CI 0.08 to 1.90) (Analysis 3.2).
3.3. Clinical response: 2a. mean score/change in mental state ‐ mean PANSS total score at endpoint (high = poor)
The mean PANSS total score was reported at the endpoint. There was no significant difference between groups (1 RCT, n = 60, MD ‐2.28, 95% CI ‐7.41 to 2.85) (Analysis 3.3).
3.4. Clinical response: 2b. mean score/change in mental state (positive symptoms) ‐ mean PANSS positive score at endpoint (high = poor)
The mean PANSS positive score was reported at the endpoint. This difference was significant, favouring risperidone (1 RCT, n = 60, MD ‐2.55, 95% CI ‐4.64 to ‐0.46) (Analysis 3.4).
3.5. Clinical response: 2c. mean score/change in mental state (negative symptoms) ‐ mean PANSS negative score at endpoint (high = poor)
The mean PANSS negative score was reported at the endpoint. There was no significant difference between groups (1 RCT, n = 60, MD ‐0.54, 95% CI ‐3.19 to 2.11) (Analysis 3.5).
3.6. Adverse effects: specific adverse effects: hypersalivation
There was no significant difference between groups in hypersalivation (1 RCT, n = 60, RR 0.33, 95% CI 0.04 to 3.03) (Analysis 3.6).
3.7. Leaving the study early: acceptability of treatment ‐ as measured by completion of trial
No‐one left early in either group.
3.8. Missing outcomes
There were no usable data available for any other prespecified outcomes.
4. Comparison 4: CLOZAPINE + RISPERIDONE versus CLOZAPINE + ZIPRASIDONE
4.1. Clinical response: no clinically significant response in mental state ‐ reduction in PANSS total score of 20%
Kuwilsky 2010 defined a treatment response as a reduction of the PANSS total score by 20%. There was no significant difference between groups at six weeks (1 RCT, n = 24, RR 0.67, 95% CI 0.13 to 3.30) or 26 weeks (1 RCT, n = 24, RR 0.80, 95% CI 0.28 to 2.27) (Analysis 4.1). Since at 52 weeks more than 50% of the total numbers randomised were not accounted for, we did not include these data.
4.2. Clinical response: no clinically significant response in mental state (positive symptoms) ‐ reduction in PANSS positive subscore of 20%
Kuwilsky 2010 defined a significant response as a 20% decrease in PANSS positive subscore. Only six‐week data were available. There was no significant difference between groups at six weeks (1 RCT, n = 24, RR 3.00, 95% CI 0.36 to 24.92) (Analysis 4.2).
4.3. Clinical response: 1a. mean score/change global state ‐ mean CGI subscale score (high = poor)
Kuwilsky 2010 reported mean CGI subscale scores (severity of illness, global improvement, therapeutic efficacy) at six, 26, and 52 weeks. However, SDs were only reported for the six‐week data. There was no significant difference between groups at six weeks (severity of illness: 1 RCT, n = 22, MD 0.20, 95% CI ‐0.32 to 0.72; global improvement: 1 RCT, n = 22, MD ‐0.30, 95% CI ‐0.82 to 0.22; therapeutic efficacy: 1 RCT, n = 22, MD ‐0.30, 95% CI ‐0.79 to 0.19) (Analysis 4.3).
4.4. Clinical response: 1b. mean score/change global state ‐ mean GAF score (high = good)
Kuwilsky 2010 reported mean GAF scores at six, 26 and 52 weeks. However, SDs were only reported for the six‐week data. There was no significant difference between groups at six weeks (1 RCT, n = 22, MD 0.00, 95% CI ‐7.84 to 7.84) (Analysis 4.4).
4.5. Clinical response: 2a. mean score/change mental state ‐ mean HAMD score (high = poor)
For the HAMD scale, means and SDs were estimated from figures. There was a significant difference between groups at six weeks favouring risperidone (1 RCT, n = 22, MD ‐3.40, 95% CI ‐6.71 to ‐0.09). There was no significant difference at 26 weeks (1 RCT, n = 16, MD ‐0.70, 95% CI ‐5.35 to 3.95) (Analysis 4.5). Due to attrition of more than 50%, 52‐week data were not included.
4.6. Clinical response: 2b. mean score/change mental state ‐ mean PANSS total score (high = poor)
For PANSS total, means and SDs were estimated from the figures. There was no significant difference in PANSS total score between groups at six weeks (1 RCT, n = 22, MD ‐3.10, 95% CI ‐11.38 to 5.18) and 26 weeks (1 RCT, n = 16, MD 1.00, 95% CI ‐7.91 to 9.91) (Analysis 4.6). Due to attrition of more than 50%, 52‐week data were not included.
4.7. Clinical response: 2c. mean score/change in mental state (positive symptoms) ‐ mean PANSS positive score (high = poor)
For PANSS positive scores, means and SDs were estimated from the figures. There was no significant difference in PANSS positive score between groups at six weeks (1 RCT, n = 22, MD ‐0.20, 95% CI ‐1.84 to 1.44) or 26 weeks (1 RCT, n = 16, MD ‐0.20, 95% CI ‐2.58 to 2.18) (Analysis 4.7). Due to attrition of more than 50%, 52‐week data were not included.
4.8. Clinical response: 2d. mean score/change in mental state (negative symptoms) ‐ mean PANSS negative score (high = poor)
For PANSS negative scores, means and SDs were estimated from the figures. There was no significant difference in PANSS negative score between groups at six weeks (1 RCT, n = 22, MD ‐1.20, 95% CI ‐4.63 to 2.23) or 26 weeks (1 RCT, n = 16, MD 1.50, 95% CI ‐2.66 to 5.66) (Analysis 4.8). Due to attrition of more than 50%, 52‐week data were not included.
4.9. Clinical response: 2e. mean score/change in mental state (negative symptoms) ‐ mean SANS score (high = poor)
For SANS, there was no significant difference between groups at six weeks (1 RCT, n = 22, MD ‐4.00, 95% CI ‐17.55 to 9.55) or 26 weeks (1 RCT, n = 16, MD 1.80, 95% CI ‐14.31 to 17.91) (Analysis 4.9). Due to attrition of more than 50%, 52‐week data were not included.
4.10. Clinical response: 2f. mean score/change in global state ‐ mean PANSS global psychopathology score (high = poor)
For PANSS global psychopathology, there was no significant difference between groups at six weeks (1 RCT, n = 22, MD ‐1.60, 95% CI ‐6.60 to 3.40) or 26 weeks (1 RCT, n = 16, MD 0.00, 95% CI ‐5.83 to 5.83) (Analysis 4.10). Due to attrition of more than 50%, 52‐week data were not analysed.
4.11. Adverse effects: specific adverse effects: mean score/change in extrapyramidal adverse effects ‐ mean EPS score (high = poor)
Mean EPS scores and SDs were estimated from the figures. There was no significant difference between groups at six weeks (1 RCT, n = 22, MD 0.60, 95% CI ‐0.67 to 1.87) or 26 weeks (1 RCT, n = 16, MD 0.30, 95% CI ‐0.63 to 1.23) (Analysis 4.11). Due to attrition of more than 50%, 52‐week data were not analysed.
We were not able to estimate the means and SDs of the HAS from the figures.
4.12. Adverse effects: other adverse effects (general or specific) ‐ mean CGI adverse effect scores (high = poor)
Kuwilsky 2010 reported mean CGI adverse effect scores at six, 26, and 52 weeks. However, SDs are only available for the six‐week data. There was no difference between groups for this adverse‐effect rating at six weeks (1 RCT, n = 22, MD ‐0.10, 95% CI ‐0.53 to 0.33) (Analysis 4.12).
The authors also reported that clozapine adverse effects, such as hypersalivation, sedation, and weight gain, were evaluated on an observer‐based visual analogue scale between 1 (no adverse effects) and 10 (severe and intolerable adverse effects). There were no data available for this scale.
4.13. Leaving the study early: acceptability of treatment ‐ as measured by completion of trial
The sample study changed significantly during the trial. There was no significant difference between groups at six weeks (1 RCT, n = 24, RR 1.00, 95% CI 0.07 to 14.21), 26 weeks (1 RCT, n = 24, RR 0.60, 95% CI 0.18 to 1.97), or 52 weeks (1 RCT, n = 24, RR 1.60, 95% CI 0.73 to 3.49) (Analysis 4.13).
4.14. Missing outcomes
There were no usable data available for any other prespecified outcomes.
5. Comparison 5: CLOZAPINE + ZIPRASIDONE versus CLOZAPINE + QUETIAPINE
5.1. Clinical response: 1a. no clinically significant response in mental state ‐ PANSS reduction 50% or greater
There was a significant difference between groups in the number of participants not achieving a 50% reduction or greater in PANSS total by 12 weeks favouring ziprasidone (1 RCT, n = 63, RR 0.54, 95% CI 0.35 to 0.81) (Analysis 5.1).
5.2. Clinical response: 1b. no clinically significant response in mental state ‐ PANSS reduction 25% or greater
There was no difference between groups for number not achieving a 25% reduction or greater in PANSS (1 RCT, n = 63, RR 0.65, 95% CI 0.38 to 1.10) (Analysis 5.2).
5.3. Clinical response: 2a. mean score/change global state ‐ mean CGI‐S score (high = poor)
Wen 2015 reported mean CGI severity of illness scores and SDs for all participants who completed the 12‐week follow‐up period. There was a significant difference between groups on CGI‐S favouring ziprasidone (1 RCT, n = 60, MD ‐0.70, 95% CI ‐1.18 to ‐0.22) (Analysis 5.3).
5.4. Clinical response: 2b. mean score/change mental state ‐ mean PANSS total score (high = poor)
PANSS total means and SDs were reported at 12 weeks. There was a significant difference between groups favouring ziprasidone (1 RCT, n = 60, MD ‐12.30, 95% CI ‐22.43 to ‐2.17) (Analysis 5.4).
5.5. Clinical response: 2c. mean score/change in mental state (positive symptoms) ‐ mean PANSS positive score (high = poor)
There was a significant difference between groups on PANSS positive subscores at 12 weeks favouring ziprasidone (1 RCT, n = 60, MD ‐3.10, 95% CI ‐5.52 to ‐0.68) (Analysis 5.5).
5.6. Clinical response: 2d. mean score/change in mental state (negative symptoms) ‐ mean PANSS negative score (high = poor)
There was no significant difference between groups on PANSS negative subscores at 12 weeks (1 RCT, n = 60, MD 0.80, 95% CI ‐1.99 to 3.59) (Analysis 5.6).
5.7. Adverse effects: specific adverse effects ‐ mean score/change in extrapyramidal adverse effects ‐ reported extrapyramidal adverse effects
There was no significant difference between groups for reported extrapyramidal adverse effects (1 RCT, n = 63, RR 2.06, 95% CI 0.41 to 10.47) (Analysis 5.7).
5.8. Adverse effects: other adverse effects (general or specific) ‐ overall adverse effect rate
There was no significant difference between groups for overall adverse effect rate (1 RCT, n = 63, RR 0.75, 95% CI 0.50 to 1.13) (Analysis 5.8).
5.9. to 5.17. Adverse effects: other adverse effects (general or specific) ‐ various
Wen 2015 reported binary data for a number of other adverse effects, and found no significant effects.
Agitation (1 RCT, n = 63, RR 1.03, 95% CI 0.15 to 6.88) (Analysis 5.9), constipation (1 RCT, n = 63, RR 0.15, 95% CI 0.01 to 2.74) (Analysis 5.10), drowsiness (1 RCT, n = 63, RR 0.47, 95% CI 0.18 to 1.19) (Analysis 5.11), dry mouth (1 RCT, n = 63, RR 0.17, 95% CI 0.02 to 1.35) (Analysis 5.12), headache (1 RCT, n = 63, RR 1.03, 95% CI 0.28 to 3.77) (Analysis 5.13), insomnia (1 RCT, n = 63, RR 0.69, 95% CI 0.12 to 3.84) (Analysis 5.14), orthostatic hypotension (1 RCT, n = 63, RR 0.21, 95% CI 0.01 to 4.13) (Analysis 5.15), tachycardia (1 RCT, n = 63, RR 0.69, 95% CI 0.12 to 3.84) (Analysis 5.16), vertigo (1 RCT, n = 63, RR 0.21, 95% CI 0.03 to 1.67) (Analysis 5.17).
5.18. Leaving the study early: acceptability of treatment ‐ as measured by completion of trial
There was no significant difference between groups for leaving the study early at 12 weeks (1 RCT, n = 63, RR 0.52, 95% CI 0.05 to 5.41) (Analysis 5.18).
5.19. Missing outcomes
There were no usable data available for any other prespecified outcomes.
Discussion
Summary of main results
Combination treatment strategies are commonly used for people with an incomplete response to clozapine. However, only a small number of studies have compared one combination treatment to another. The original review identified three RCTs, but the methodological rigour of these studies was felt to be too poor for analysis. In this update, we have analysed the data from these studies and two new RCTs, but we have made clear our judgements on the quality of the data. No formal meta‐analysis was possible.
Comparison 1: CLOZAPINE + ARIPIRAZOLE versus CLOZAPINE + HALOPERIDOL (Cipriani 2013)
There was a significant difference in adverse effects in terms of the LUNSERS total score at three months and six months, favouring aripiprazole. However, at 12 months there was no significant difference between combination treatments. For all other outcomes reported, there was no significant difference (Cipriani 2013a).
Comparison 2: CLOZAPINE + AMISULPRIDE versus CLOZAPINE + QUETIAPINE (Genc 2007)
In all measures of clinical response reported (CGI, BPRS, SAPS, and SANS), there was a significant benefit of amisulpride over quetiapine. However, there was no significant difference in acceptability of treatment as measured by completion of the trial. Adverse effect data were not presented in a useable format (Genç 2007).
Comparison 3: CLOZAPINE + RISPERIDONE versus CLOZAPINE + SULPIRIDE (Kong 2001)
There was a significant difference in PANSS positive score at the end point, favouring risperidone. For all other outcomes reported, there was no significant difference (Kong 2001).
Comparison 4: CLOZAPINE + RISPERIDONE versus CLOZAPINE + ZIPRASIDONE (Kuwilsky 2010)
There was a significant difference between combination treatments in HAMD score at six weeks favouring risperidone, but not at 26 weeks. There was no significant difference between groups in any other outcome (Kuwilsky 2010).
Comparison 5: CLOZAPINE + ZIPRASIDONE versus CLOZAPINE + QUETIAPINE (Wen 2015)
There was a significant benefit of ziprasidone in four outcomes measured: number of participants with 50% or greater PANSS total reduction, CGI severity of illness score, PANSS total, and PANSS positive score at 12 weeks (Wen 2015).
Overall completeness and applicability of evidence
The aim of this review was to investigate the comparative clinical effects of various clozapine combination strategies in people with treatment‐resistant schizophrenia and partial response to clozapine. We identified five RCTs which included seven different combination treatment strategies (clozapine plus aripiprazole, haloperidol, amisulpiride, quetiapine, sulpiride, risperidone or ziprasidone). Of course, possible combination strategies exist that are not included in this review. Moreover, there is no unique definition of partial responsiveness, with each study stipulating their own criteria (with the exception of one study which provided no detailed information). The outcomes investigated varied across studies. All included measures of mental state, using a variety of rating scales including BPRS, PANSS, SAPS, and SANS, and three out of five studies reported change in global state, using the CGI scale. Few outcomes using rating scales were reported with dichotomous data. All studies investigated adverse effects, either with event rates or rating scales, but results were poorly reported and in some cases unusable. Only one study, Kong 2001, reported data on weight gain that we could analyse. The primary outcome in Cipriani 2013a was leaving the study early. Although not a named outcome in the other studies, all reported on number of withdrawals, which we analysed as a surrogate marker for acceptability of treatment, as in Cipriani 2013a. There were a number of outcomes that were not reported in any study. These included service utilisation outcomes (such as hospital admissions or number of days in hospital), and quality of life measured (for both recipients of care and carers), which have been included in the 'Summary of findings' tables to highlight the need for data on these patient‐important outcomes in future trials. An outcome that was not included in our protocol but reported in two studies was clozapine dose (Cipriani 2013a; Kuwilsky 2010). A third study describes clozapine dose being reduced "accordingly" after introducing a second antipsychotic, but provided no data (Wen 2015). Clozapine dose is certainly an outcome of interest as reduction in dose may decrease the burden of clozapine adverse effects. This in itself may be a reason to initiate combination treatment.
Overall, the completeness and acceptability of the evidence relating to clozapine combination treatments versus other clozapine combination treatments was poor. There were insufficient data to make any recommendations for combination treatment strategy.
Quality of the evidence
We systematically assessed the quality of evidence using the GRADE approach for each outcome presented in the 'Summary of findings' tables. The GRADE approach takes into account study design, study limitation, inconsistency of results, indirectness of evidence, imprecision, and publication bias. As it was not possible to carry out a meta‐analysis, inconsistency and publication bias do not apply to our comparisons. Overall, the quality of evidence assessed in this study was low or very low. All included studies purported to be RCTs, although only two provided detailed information on the means of randomisation. There was generally good applicability in terms of populations and interventions, with all studies including only participants with treatment‐resistant schizophrenia or related disorders, and comparing two different clozapine combination strategies. However, some indirectness was introduced where attrition was used as a surrogate marker for acceptability of treatment. The degree of imprecision is assessed on an outcome‐by‐outcome basis, but it should be noted that for two studies rating scale data were estimated from figures in the table.
Comparison 1: CLOZAPINE + ARIPIPRAZOLE versus CLOZAPINE + HALOPERIDOL (Cipriani 2013)
This study was methodologically rigorous, clearly reported, and contained the largest study sample (Cipriani 2013a). Moreover, this was the only study with useable long‐term data. The authors undertook an intention‐to‐treat analysis resulting in a low risk of attrition bias. However, the quality of evidence was limited by the naturalistic, open‐label study design. As a result, the quality of evidence was rated low on all outcomes assessed using the GRADE approach.
Comparison 2: CLOZAPINE + AMISULPIRIDE versus CLOZAPINE + QUETIAPINE (Genc 2007)
In this study, participants who withdrew from allocated treatment were excluded from reporting on baseline characteristics and the analyses, preventing a true comparison of those randomised to each group (Genç 2007). The quality of evidence was rated very low on the outcomes assessed using the GRADE approach, with the exception of BPRS because it was powered to detect a difference. Moreover, the rating scale data were presented in figures without SDs, and so means were estimated and SDs calculated using the t scores provided in the text. Therefore, the data in the analyses will be imprecise.
Comparison 3: CLOZAPINE + RISPERIDONE versus CLOZAPINE + SULPIRIDE (Kong 2001)
There was insufficient information to assess the risk of selection, performance, and detection bias (Kong 2001). In addition, the authors did not provide a working definition of partial response to clozapine, so the applicability in terms of population was unclear. As a result, the quality of evidence was rated very low on all outcomes assessed using the GRADE approach.
Comparison 4: CLOZAPINE + RISPERIDONE versus CLOZAPINE + ZIPRASIDONE (Kuwilsky 2010)
The study was limited by the naturalistic, open‐label design (Kuwilsky 2010). In addition, this was the only study rated as high risk for detection bias, as the rating scale assessors were not blinded to the treatment allocation. This study had the smallest sample size and the highest attrition rate. There was no intention‐to‐treat analysis resulting in a high risk of attrition bias. Indeed, the 52‐week data were not analysable as per our protocol. The quality of evidence was rated very low on all outcomes assessed using the GRADE approach. It should also be noted that means and SDs were estimated from the figures for many continuous outcomes, and will therefore be imprecise.
Comparison 5: CLOZAPINE + ZIPRASIDONE versus CLOZAPINE + QUETIAPINE (Wen 2015)
The study was described as randomised, but no details about the method or allocation concealment were provided (Wen 2015). Since there was low risk of detection bias and the study was powered to detect a difference for a number of outcomes, this quality of evidence was rated low, rather than very low, for the majority of outcomes assessed using the GRADE approach.
Potential biases in the review process
Some relevant data were presented in the text without SDs, and was therefore unusable. All our attempts to obtain this data from the relevant authors were unsuccessful. It should be noted that one of the review authors is the author of an included study (Cipriani 2013a). This author did not extract data from their trial.
Agreements and disagreements with other studies or reviews
We are aware of other meta‐analyses of comparisons of clozapine combination with other anti‐psychotic drugs versus placebo, but we know of no other reviews comparing two different combination strategies.
Unlike in the previous version of this review, we have extracted the data from the trials were possible, and presented the analyses. The previous version called for new, properly conducted RCTs comparing different combination treatments. Two new studies have been conducted since, and additional long‐term data from another have been published. However, sample sizes remain small. Larger studies are still required to detect small effect sizes.
Recently, two important contributions in the field of schizophrenia and clozapine treatment have been published (Samara 2016; Stroup 2016). In a network meta‐analysis including 40 blinded RCTs with 5172 unique participants a pattern of superiority for olanzapine, clozapine, and risperidone was seen in other efficacy outcomes, but results were not consistent and effect sizes were usually small (primary outcome was efficacy as measured by overall change in symptoms of schizophrenia; secondary outcomes included change in positive and negative symptoms of schizophrenia, categorical response to treatment, withdrawals for any reason and for inefficacy of treatment, and important adverse events) (Samara 2016). Therefore, the authors concluded that insufficient evidence exists on which antipsychotic drug is more efficacious for people with treatment‐resistant schizophrenia, and blinded RCTs ‐ in contrast to unblinded, randomised effectiveness studies ‐ provide little evidence of the superiority of clozapine compared with other second‐generation antipsychotic drugs. Network meta‐analysis is very helpful in comparing the relative effectiveness and acceptability of competing treatments (Cipriani 2013b), also in treatment guidelines (Leucht 2016; Rouse 2016). However, several issues still need to be addressed when conducting a network meta‐analysis for the results to be valid and correctly interpreted, especially in mental health (Mavridis 2015).
Slightly different results were found in the second paper, where the authors compared the effectiveness of initiating treatment with either clozapine or a standard antipsychotic drug among adults with evidence of treatment‐resistant schizophrenia in routine clinical practice (Stroup 2016). US national Medicaid data from 2001 to 2009 were used to examine treatment outcomes in a cohort of people with schizophrenia and evidence of treatment resistance that initiated clozapine (n = 3123) or a standard antipsychotic drug (n = 3123). The primary outcome was hospital admission for a mental disorder, while secondary outcomes included discontinuation of the index antipsychotic drug, use of an additional antipsychotic drug, incidence of serious medical conditions, and mortality. Initiation of clozapine was associated with a significantly decreased rate of psychiatric hospital admission (hazard ratio (HR) 0.78, 95% CI 0.69 to 0.88), index antipsychotic discontinuation (HR 0.60, 95% CI 0.55 to 0.65), and use of an additional antipsychotic drug (HR 0.76, 95% CI 0.70 to 0.82). By contrast, clozapine was associated with a non statistically significant increase of incidence of diabetes mellitus (HR 1.63, 95% CI 0.98 to 2.70), hyperlipidaemia (HR 1.40, 95% CI 1.09 to 1.78), and intestinal obstruction (HR 2.50, 95% CI 0.97 to 6.44). According to this study, in adults with schizophrenia and evidence of treatment resistance, initiating clozapine compared with initiating a standard antipsychotic drug was associated with greater effectiveness on several important outcomes, so increasing the judicious use of clozapine should be warranted (together with vigilance to prevent and detect serious medical adverse effects).
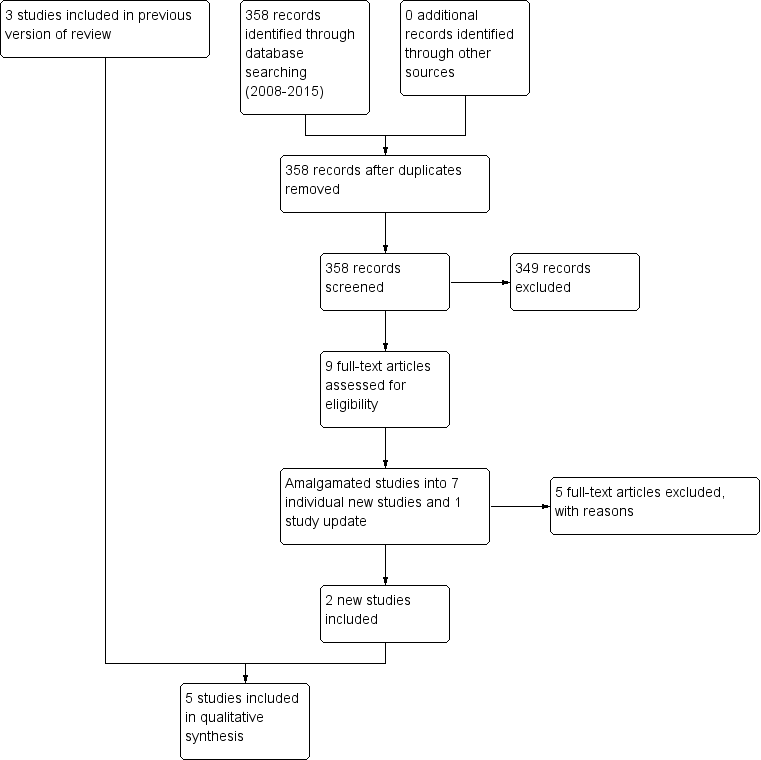
Study flow diagram (2015 update).

Methodological quality graph: review authors' judgements about each methodological quality item presented as percentages across all included studies.

Methodological quality summary: review authors' judgements about each methodological quality item for each included study.

Comparison 1 CLOZAPINE + ARIPIPRAZOLE versus CLOZAPINE + HALOPERIDOL, Outcome 1 Clinical response: mean score/change in mental state: mean change in BPRS score from baseline (high = good).
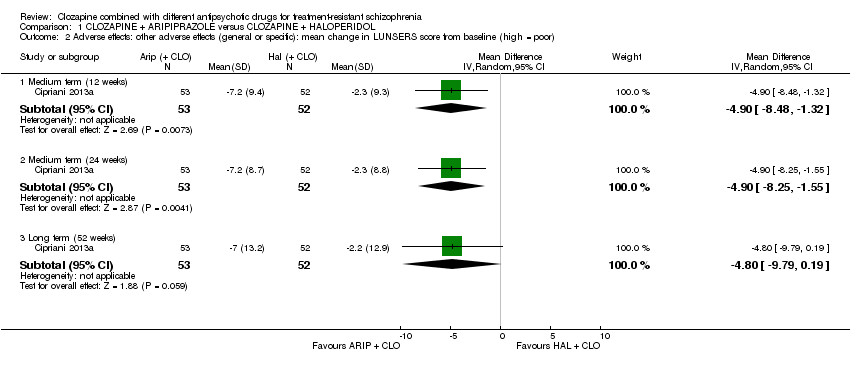
Comparison 1 CLOZAPINE + ARIPIPRAZOLE versus CLOZAPINE + HALOPERIDOL, Outcome 2 Adverse effects: other adverse effects (general or specific): mean change in LUNSERS score from baseline (high = poor).

Comparison 1 CLOZAPINE + ARIPIPRAZOLE versus CLOZAPINE + HALOPERIDOL, Outcome 3 Leaving the study early: acceptability of treatment ‐ as measured by completion of trial.

Comparison 2 CLOZAPINE + AMISULPRIDE versus CLOZAPINE + QUETIAPINE, Outcome 1 Clinical response: 1 mean score/change in global state: mean CGI score (high = poor).
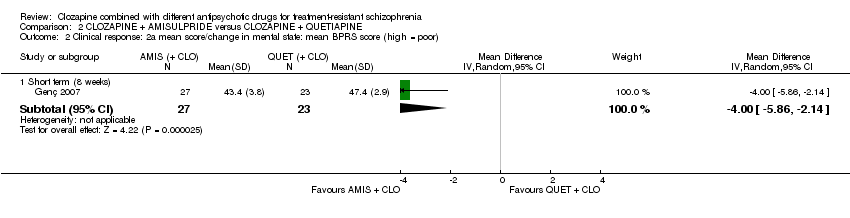
Comparison 2 CLOZAPINE + AMISULPRIDE versus CLOZAPINE + QUETIAPINE, Outcome 2 Clinical response: 2a mean score/change in mental state: mean BPRS score (high = poor).
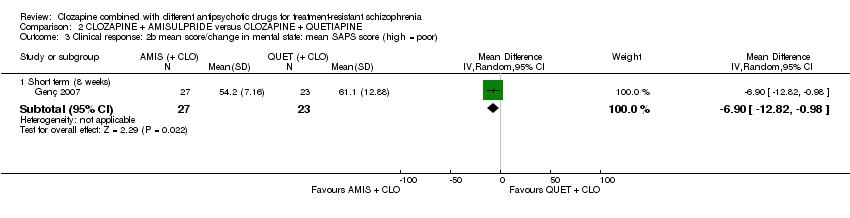
Comparison 2 CLOZAPINE + AMISULPRIDE versus CLOZAPINE + QUETIAPINE, Outcome 3 Clinical response: 2b mean score/change in mental state: mean SAPS score (high = poor).
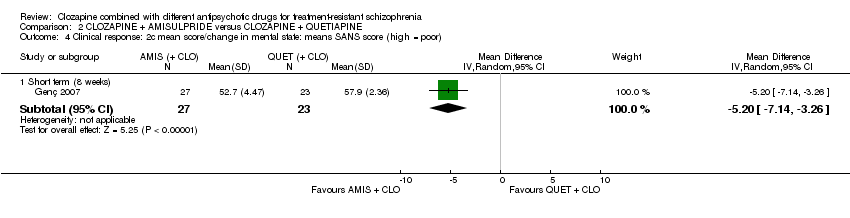
Comparison 2 CLOZAPINE + AMISULPRIDE versus CLOZAPINE + QUETIAPINE, Outcome 4 Clinical response: 2c mean score/change in mental state: means SANS score (high = poor).

Comparison 2 CLOZAPINE + AMISULPRIDE versus CLOZAPINE + QUETIAPINE, Outcome 5 Leaving the study early: acceptability of treatment ‐ as measured by completion of trial.

Comparison 3 CLOZAPINE + RISPERIDONE versus CLOZAPINE + SULPIRIDE, Outcome 1 Clinical response: no clinically significant response in mental state: 20% to 50% reduction in PANSS total score.
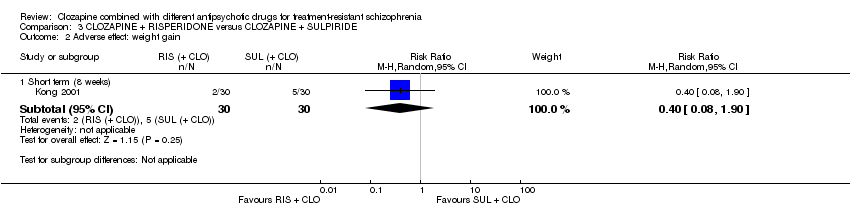
Comparison 3 CLOZAPINE + RISPERIDONE versus CLOZAPINE + SULPIRIDE, Outcome 2 Adverse effect: weight gain.

Comparison 3 CLOZAPINE + RISPERIDONE versus CLOZAPINE + SULPIRIDE, Outcome 3 Clinical response: 2a mean score/change in mental state: mean PANSS total score at endpoint (high = poor).
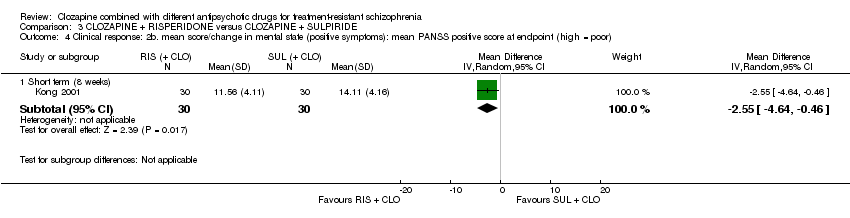
Comparison 3 CLOZAPINE + RISPERIDONE versus CLOZAPINE + SULPIRIDE, Outcome 4 Clinical response: 2b. mean score/change in mental state (positive symptoms): mean PANSS positive score at endpoint (high = poor).
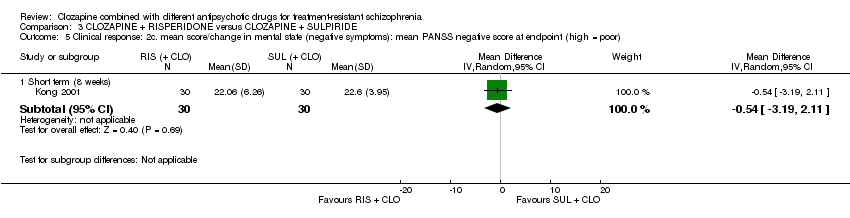
Comparison 3 CLOZAPINE + RISPERIDONE versus CLOZAPINE + SULPIRIDE, Outcome 5 Clinical response: 2c. mean score/change in mental state (negative symptoms): mean PANSS negative score at endpoint (high = poor).

Comparison 3 CLOZAPINE + RISPERIDONE versus CLOZAPINE + SULPIRIDE, Outcome 6 Adverse effects: specific adverse effects: hypersalivation.
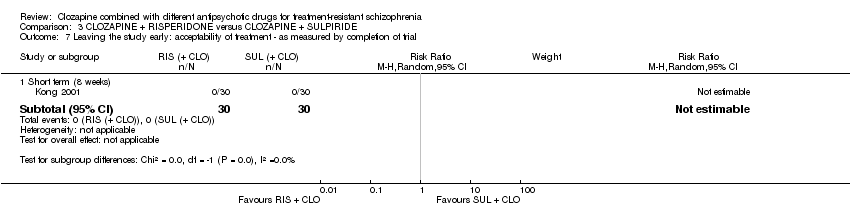
Comparison 3 CLOZAPINE + RISPERIDONE versus CLOZAPINE + SULPIRIDE, Outcome 7 Leaving the study early: acceptability of treatment ‐ as measured by completion of trial.
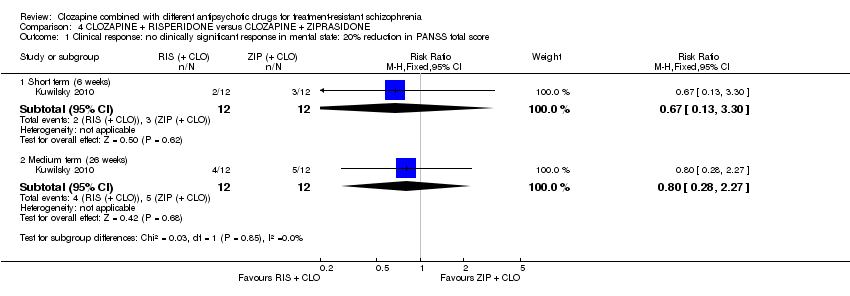
Comparison 4 CLOZAPINE + RISPERIDONE versus CLOZAPINE + ZIPRASIDONE, Outcome 1 Clinical response: no clinically significant response in mental state: 20% reduction in PANSS total score.

Comparison 4 CLOZAPINE + RISPERIDONE versus CLOZAPINE + ZIPRASIDONE, Outcome 2 Clinical response: no clinically significant response in mental state (positive symptoms) 20% reduction in PANSS positive subscore.

Comparison 4 CLOZAPINE + RISPERIDONE versus CLOZAPINE + ZIPRASIDONE, Outcome 3 Clinical response: 1a mean score/change global state: mean CGI subscale score (high = poor).
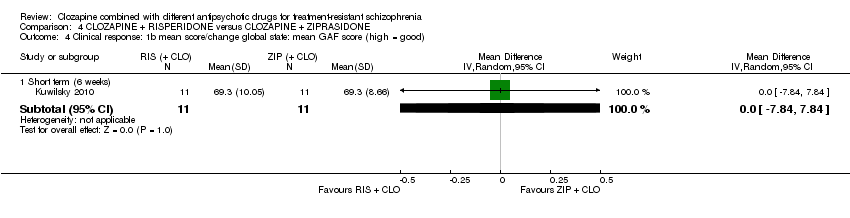
Comparison 4 CLOZAPINE + RISPERIDONE versus CLOZAPINE + ZIPRASIDONE, Outcome 4 Clinical response: 1b mean score/change global state: mean GAF score (high = good).
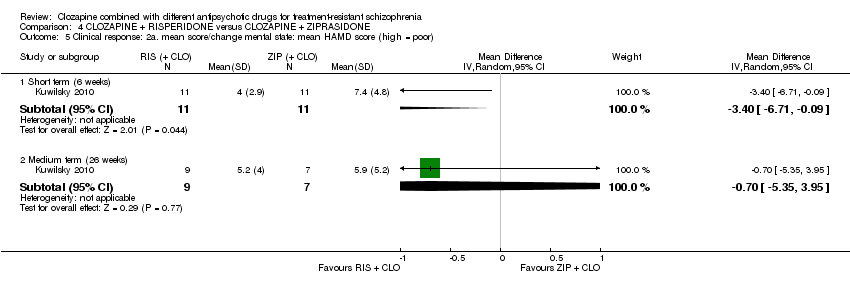
Comparison 4 CLOZAPINE + RISPERIDONE versus CLOZAPINE + ZIPRASIDONE, Outcome 5 Clinical response: 2a. mean score/change mental state: mean HAMD score (high = poor).

Comparison 4 CLOZAPINE + RISPERIDONE versus CLOZAPINE + ZIPRASIDONE, Outcome 6 Clinical response: 2b mean score/change mental state: mean PANSS total score (high = poor).

Comparison 4 CLOZAPINE + RISPERIDONE versus CLOZAPINE + ZIPRASIDONE, Outcome 7 Clinical response: 2c mean score/change in mental state (positive symptoms) mean PANSS positive score (high = poor).
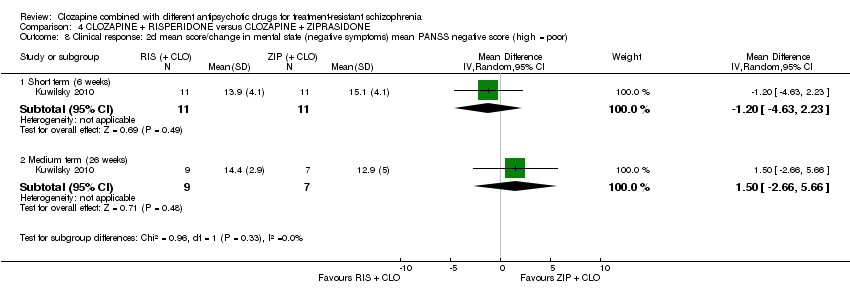
Comparison 4 CLOZAPINE + RISPERIDONE versus CLOZAPINE + ZIPRASIDONE, Outcome 8 Clinical response: 2d mean score/change in mental state (negative symptoms) mean PANSS negative score (high = poor).
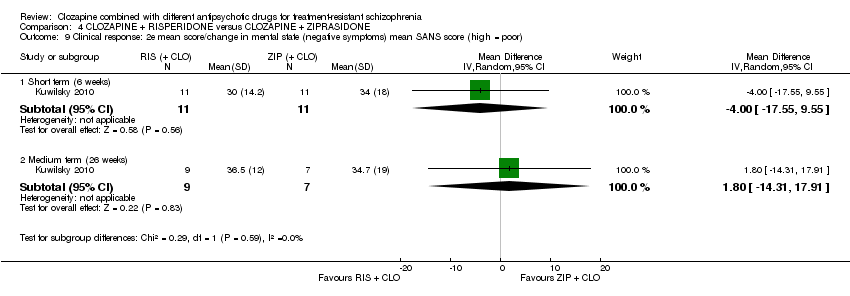
Comparison 4 CLOZAPINE + RISPERIDONE versus CLOZAPINE + ZIPRASIDONE, Outcome 9 Clinical response: 2e mean score/change in mental state (negative symptoms) mean SANS score (high = poor).
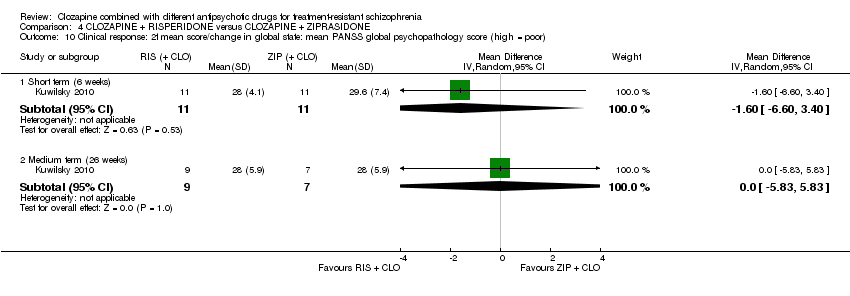
Comparison 4 CLOZAPINE + RISPERIDONE versus CLOZAPINE + ZIPRASIDONE, Outcome 10 Clinical response: 2f mean score/change in global state: mean PANSS global psychopathology score (high = poor).

Comparison 4 CLOZAPINE + RISPERIDONE versus CLOZAPINE + ZIPRASIDONE, Outcome 11 Adverse effects: specific adverse effects: mean score/change in extrapyramidal adverse effects: mean EPS score (high = poor).

Comparison 4 CLOZAPINE + RISPERIDONE versus CLOZAPINE + ZIPRASIDONE, Outcome 12 Adverse effects: other adverse effects (general or specific): mean CGI adverse effect scores (high = poor).

Comparison 4 CLOZAPINE + RISPERIDONE versus CLOZAPINE + ZIPRASIDONE, Outcome 13 Leaving the study early: acceptability of treatment ‐ as measured by completion of trial.

Comparison 5 CLOZAPINE + ZIPRASIDONE versus CLOZAPINE + QUETIAPINE, Outcome 1 Clinical response: 1a. no clinically significant response in mental state: PANSS reduction ≥ 50%.

Comparison 5 CLOZAPINE + ZIPRASIDONE versus CLOZAPINE + QUETIAPINE, Outcome 2 Clinical response: 1b. no clinically significant response in mental state: PANSS reduction ≥ 25%.
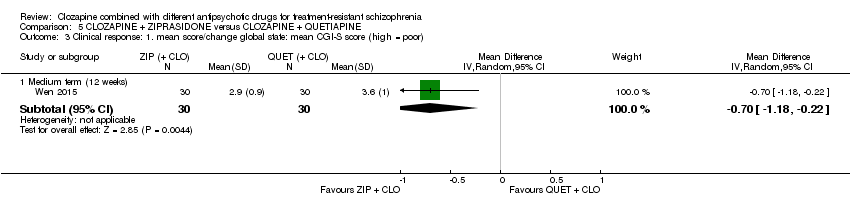
Comparison 5 CLOZAPINE + ZIPRASIDONE versus CLOZAPINE + QUETIAPINE, Outcome 3 Clinical response: 1. mean score/change global state: mean CGI‐S score (high = poor).

Comparison 5 CLOZAPINE + ZIPRASIDONE versus CLOZAPINE + QUETIAPINE, Outcome 4 Clinical response: 2a. mean score/change mental state: mean PANSS total score (high = poor).
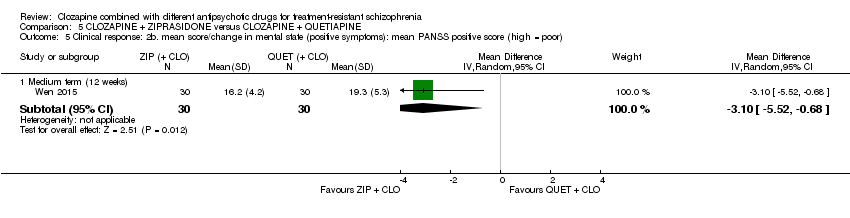
Comparison 5 CLOZAPINE + ZIPRASIDONE versus CLOZAPINE + QUETIAPINE, Outcome 5 Clinical response: 2b. mean score/change in mental state (positive symptoms): mean PANSS positive score (high = poor).

Comparison 5 CLOZAPINE + ZIPRASIDONE versus CLOZAPINE + QUETIAPINE, Outcome 6 Clinical response: 2b. mean score/change in mental state (negative symptoms): mean PANSS negative score (high = poor).

Comparison 5 CLOZAPINE + ZIPRASIDONE versus CLOZAPINE + QUETIAPINE, Outcome 7 Adverse effects: specific adverse effects: mean score/change in extrapyramidal adverse effects: reported extrapyramidal adverse effects.
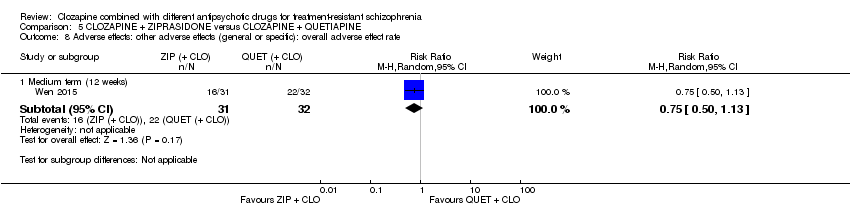
Comparison 5 CLOZAPINE + ZIPRASIDONE versus CLOZAPINE + QUETIAPINE, Outcome 8 Adverse effects: other adverse effects (general or specific): overall adverse effect rate.
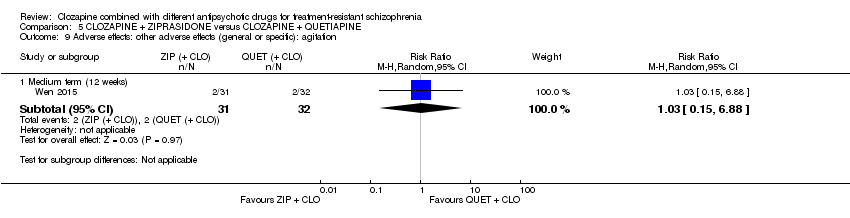
Comparison 5 CLOZAPINE + ZIPRASIDONE versus CLOZAPINE + QUETIAPINE, Outcome 9 Adverse effects: other adverse effects (general or specific): agitation.

Comparison 5 CLOZAPINE + ZIPRASIDONE versus CLOZAPINE + QUETIAPINE, Outcome 10 Adverse effects: other adverse effects (general or specific): constipation.
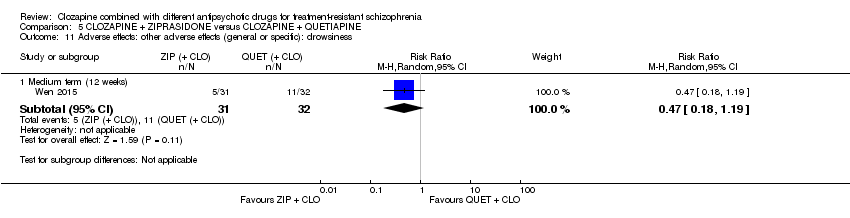
Comparison 5 CLOZAPINE + ZIPRASIDONE versus CLOZAPINE + QUETIAPINE, Outcome 11 Adverse effects: other adverse effects (general or specific): drowsiness.

Comparison 5 CLOZAPINE + ZIPRASIDONE versus CLOZAPINE + QUETIAPINE, Outcome 12 Adverse effects: other adverse effects (general or specific): dry mouth.
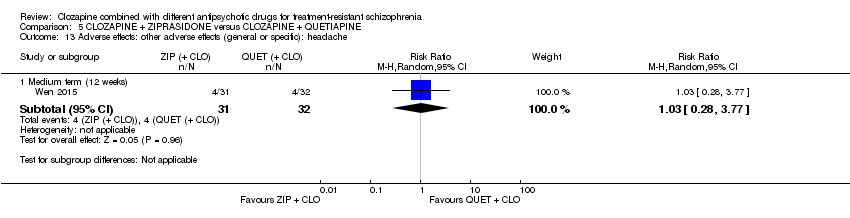
Comparison 5 CLOZAPINE + ZIPRASIDONE versus CLOZAPINE + QUETIAPINE, Outcome 13 Adverse effects: other adverse effects (general or specific): headache.
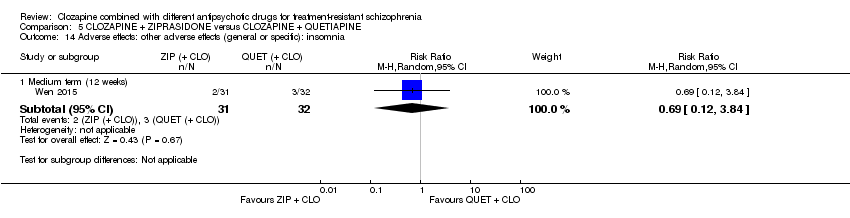
Comparison 5 CLOZAPINE + ZIPRASIDONE versus CLOZAPINE + QUETIAPINE, Outcome 14 Adverse effects: other adverse effects (general or specific): insomnia.

Comparison 5 CLOZAPINE + ZIPRASIDONE versus CLOZAPINE + QUETIAPINE, Outcome 15 Adverse effects: other adverse effects (general or specific): orthostatic hypotension.

Comparison 5 CLOZAPINE + ZIPRASIDONE versus CLOZAPINE + QUETIAPINE, Outcome 16 Adverse effects: other adverse effects (general or specific): tachycardia.

Comparison 5 CLOZAPINE + ZIPRASIDONE versus CLOZAPINE + QUETIAPINE, Outcome 17 Adverse effects: other adverse effects (general or specific): vertigo.
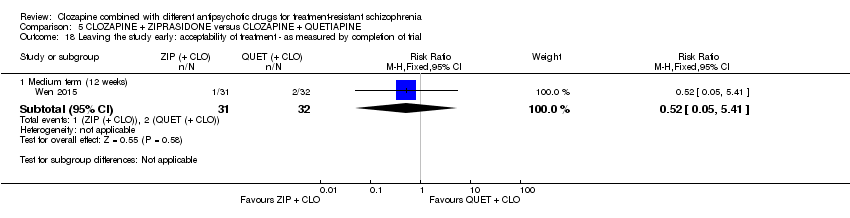
Comparison 5 CLOZAPINE + ZIPRASIDONE versus CLOZAPINE + QUETIAPINE, Outcome 18 Leaving the study early: acceptability of treatment ‐ as measured by completion of trial.
| Methods | Allocation: proper randomisation (e.g. by computer‐generated number sequence) and adequate allocation concealment (e.g. by central randomisation by a third party). Blinding: ideally double blind, but pragmatically blinding the participant and the outcome assessor is adequate. Setting: inpatients and outpatients. Duration: short‐term primary outcome (at 12 weeks), and then medium‐ to long‐term follow‐up (up to 52 week). |
| Participants | Diagnosis: treatment‐resistant schizophrenia, defined by persistent positive symptoms despite at least 6 months of treatment with clozapine ≥ 400 mg/day. N = 200. Sex: men and women. Age: > 18 years. |
| Interventions | 1. Clozapine plus risperidone (or paliperidone). 2. Clozapine plus aripiprazole (or amisulpride). |
| Outcomes | Measure of clinical response to include both dichotomous measures of global (e.g. CGI score) and mental state (e.g. BPRS score). Adverse effects to include weight gain, extrapyramidal symptoms, haematological problems, and hypersalivation. Acceptability assessed by leaving the study early. Service utilisation (e.g. hospital admission). Quality of life/satisfaction measure. |
| Notes | The study should be funded by an independent funding body, such as the National Institute for Health Research or Wellcome Trust. |
| BPRS: Brief Psychiatric Rating Scale; CGI: Clinical Global Impression; n: number of participants. | |
| Clozapine + aripi prazole versus clozapine + haloperidol for treatment‐resistant schizophrenia | ||||||
| Patient or population: people with treatment‐resistant schizophrenia Setting: inpatients and outpatients Intervention: aripiprazole (+ CLO) Comparison: haloperidol (+ CLO) | ||||||
| Outcomes | Anticipated absolute effects* (95% CI) | Relative effect | No of participants | Quality of the evidence | Comments | |
| Risk with haloperidol (+ CLO) | Risk with aripiprazole (+ CLO) | |||||
| Clinical response: no clinically significant response in mental state | See comment | See comment | Not estimable | ‐ | ‐ | No data reported. |
| Adverse effects: weight gain | See comment | See comment | Not estimable | ‐ | ‐ | No data reported. |
| Clinical response: mean score/change in global state | See comment | See comment | ‐ | ‐ | ‐ | No data reported. |
| Clinical response: mean score/change in mental state: change in BPRS score from baseline (high = good), Long term (12 months) | The mean score/change in mental state (change in BPRS from baseline) ‐ long term (12 months) was 0 | The mean score/change in mental state ‐ defined by change in BPRS from baseline ‐ long term (12 months) in the intervention group was 0.9 more (4.38 fewer to 6.18 more) | ‐ | 105 | ⊕⊕⊝⊝ | ‐ |
| Leaving the study early: acceptability of treatment ‐ as measured by completion of trial Long term (12 months) | Study population | RR 1.27 | 106 | ⊕⊝⊝⊝ | ‐ | |
| 283 per 1000 | 359 per 1000 | |||||
| Moderate | ||||||
| 283 per 1000 | 359 per 1000 | |||||
| Service utilisation outcomes: hospital admission or days in hospital | See comment | See comment | Not estimable | ‐ | ‐ | No data reported. |
| Quality of life/satisfaction with care for either recipients of care or carers: significant change in quality of life/satisfaction | See comment | See comment | Not estimable | ‐ | ‐ | No data reported. |
| *The risk in the intervention group (and its 95% confidence interval) is based on the assumed risk in the comparison group and the relative effect of the intervention (and its 95% CI). BPRS: Brief Psychiatric Rating Scale; CI: confidence interval; CLO: clozapine; RCT: randomised controlled trial; RR: risk ratio. | ||||||
| GRADE Working Group grades of evidence | ||||||
| 1 Risk of bias: downgraded by 1 level because high risk for performance bias (open label), but low risk for other biases (selection, detection, attrition, reporting). 2 Inconsistency and publication bias: not applicable (no meta‐analysis). 3 Indirectness: not downgraded because good applicability in terms of participants and interventions and rating scale measures participant‐important outcome (mental state). 4 Imprecision: downgraded by 1 level because underpowered to detect difference. Not downgraded by 2 levels because CI around mean difference did not include appreciable benefit and appreciable harm (total score on BPRS = 126). 5 Indirectness: downgraded by 1 level because leaving the study early a surrogate measure of acceptability of treatment. 6 Imprecision: downgraded by 2 level because underpowered to detect difference and CI around relative effect included appreciable benefit and harm (from less likely to leave study early to over two times more likely to leave study early). | ||||||
| Clozapine + amisulpride versus clozapine + quetiapine for treatment‐resistant schizophrenia | ||||||
| Patient or population: people with treatment‐resistant schizophrenia Setting: inpatients and outpatients Intervention: amisulpride (+ CLO) Comparison: quetiapine (+ CLO) | ||||||
| Outcomes | Anticipated absolute effects* (95% CI) | Relative effect | No of participants | Quality of the evidence | Comments | |
| Risk with quetiapine (+ CLO) | Risk with amisulpride (+ CLO) | |||||
| Clinical response: no clinically significant response in mental state | See comment | See comment | Not estimable | (1 RCT) | ‐ | No data reported. |
| Adverse effects: weight gain | See comment | See comment | Not estimable | (1 RCT) | ‐ | No data reported. |
| Clinical response: mean score/change in global state: mean CGI score (high = poor) Short term (8 weeks) | The mean score/change in global state (CGI) ‐ short term (8 weeks) was 0 | The mean score/change in global state (CGI) ‐ short term (8 weeks) in the intervention group was 0.9 fewer (1.38 fewer to 0.42 fewer) | ‐ | 50 | ⊕⊝⊝⊝ | ‐ |
| Clinical response: mean score/change in mental state: mean BPRS score (high = poor) Short term (8 weeks) | The mean score/change in mental state (BPRS) ‐ short term (8 weeks) was 0 | The mean score/change in mental state (BPRS) ‐ short term (8 weeks) in the intervention group was 4 fewer (5.86 fewer to 2.14 fewer) | ‐ | 50 | ⊕⊕⊝⊝ | ‐ |
| Leaving the study early: acceptability of treatment ‐ as measured by completion of trial | Study population | RR 0.20 | 56 | ⊕⊝⊝⊝ | ‐ | |
| 179 per 1000 | 36 per 1000 | |||||
| Moderate | ||||||
| 179 per 1000 | 36 per 1000 | |||||
| Service utilisation outcomes: hospital admission or days in hospital | See comment | See comment | Not estimable | (1 RCT) | ‐ | No data reported. |
| Quality of life/satisfaction with care for either recipients of care or carers: significant change in quality of life/satisfaction | See comment | See comment | Not estimable | (1 RCT) | ‐ | No data reported. |
| *The risk in the intervention group (and its 95% confidence interval) is based on the assumed risk in the comparison group and the relative effect of the intervention (and its 95% CI). BPRS: Brief Psychiatric Rating Scale; CGI: Clinical Global Impression; CI: confidence interval; CLO: clozapine; RCT: randomised controlled trial; RR: risk ratio. | ||||||
| GRADE Working Group grades of evidence | ||||||
| 1 Risk of bias: downgraded by 2 levels because high risk of reporting bias and unclear (so potentially high) risk of other biases (selection, performance, attrition). 2 Inconsistency and publication bias: not applicable (no meta‐analysis). 3 Indirectness: not downgraded because good applicability in terms of participants and interventions and rating score measures a participant‐important outcome (global state). 4 Imprecision: downgraded by 1 level because underpowered to detect difference. Not downgraded by 2 levels because CI around mean difference did not include appreciable benefit and appreciable harm (total score on CGI = 7). 5 Indirectness: not downgraded because good applicability in terms of participants and interventions and rating score measures a participant‐important outcome (mental state). 6 Imprecision: not downgraded because powered to detect difference and narrow CI. 7 Indirectness: downgraded by 1 level because leaving study early surrogate measure of participant‐important outcome (acceptability of treatment). | ||||||
| Clozapine + risperidone versus clozapine + sulpiride for treatment‐resistant schizophrenia | ||||||
| Patient or population: people with treatment‐resistant schizophrenia Setting: inpatients Intervention: risperidone (+ CLO) Comparison: sulpiride (+ CLO) | ||||||
| Outcomes | Anticipated absolute effects* (95% CI) | Relative effect | No of participants | Quality of the evidence | Comments | |
| Risk with Sulpiride (+ CLO) | Risk with Risperidone (+ CLO) | |||||
| Clinical response: no clinically significant response in mental state: 20% to 50% reduction in PANSS total score | Study population | RR 0.82 | 60 | ⊕⊝⊝⊝ | ‐ | |
| 367 per 1000 | 301 per 1000 | |||||
| Moderate | ||||||
| 367 per 1000 | 301 per 1000 | |||||
| Adverse effects: weight gain | Study population | RR 0.40 | 60 | ⊕⊝⊝⊝ | ‐ | |
| 167 per 1000 | 67 per 1000 | |||||
| Moderate | ||||||
| 167 per 1000 | 67 per 1000 | |||||
| Clinical response: mean score/change in global state | See comment | See comment | ‐ | (1 RCT) | ‐ | No data reported. |
| Clinical response: mean score/change in mental state: mean PANSS total score (high = poor) | The mean score/change in mental state (PANSS total) was 0 | The mean score/change in mental state (PANSS total) in the intervention group was 2.28 undefined fewer (7.41 fewer to 2.85 more) | ‐ | 60 | ⊕⊝⊝⊝ | ‐ |
| Leaving the study early: acceptability of treatment ‐ as measured by completion of trial | Study population | Not estimable | 60 | ⊕⊝⊝⊝ | ‐ | |
| 0 per 1000 | 0 per 1000 | |||||
| Service utilisation outcomes: hospital admission or days in hospital | See comment | See comment | Not estimable | ‐ | ‐ | No data reported. |
| Quality of life/satisfaction with care for either recipients of care or carers: significant change in quality of life/satisfaction | See comment | See comment | Not estimable | ‐ | ‐ | No data reported. |
| *The risk in the intervention group (and its 95% confidence interval) is based on the assumed risk in the comparison group and the relative effect of the intervention (and its 95% CI). CI: confidence interval; CLO: clozapine; PANSS: Positive and Negative Syndrome Scale; RCT: randomised controlled trial; RR: risk ratio. | ||||||
| GRADE Working Group grades of evidence | ||||||
| 1 Risk of bias: downgraded by 2 levels because unclear (so potentially high) risk of biases (selection, performance, detection, reporting). 2 Inconsistency and publication bias: not applicable (no meta‐analysis). 3 Indirectness: downgraded by 1 level because unclear population applicability (inclusion criteria not clearly specified). Not downgraded by 2 levels because rating scale measures participant‐important outcome (mental state). 4 Imprecision: downgraded by 2 levels because underpowered to detect difference and CI around relative effect includes appreciable benefit and harm. 5 Indirectness: downgraded by 1 level because unclear population applicability (inclusion criteria not clearly specified). Not downgraded by 2 levels because weight gain a direct measure of a participant‐important outcome. 6 Indirectness: downgraded by 1 level because unclear population applicability (inclusion criteria not clearly specified). Not downgraded by 2 levels because rating scale measures participant‐important outcome (mental state). 7 Imprecision: downgraded by 1 level because underpowered to detect difference. Not downgraded by 2 levels because CI around mean difference did not include appreciable benefit and appreciable harm (total score on PANSS = 120). 8 Indirectness: downgraded by 2 levels because unclear population applicability (inclusion criteria not clearly specified) and leaving the study early a surrogate measure of acceptability of treatment. 9 Imprecision: downgraded by 1 level because underpowered to detect difference. Not downgraded by 2 levels because no CI. | ||||||
| Clozapine + risperidone versus clozapine + ziprasidone for treatment‐resistant schizophrenia | ||||||
| Patient or population: people with treatment‐resistant schizophrenia Setting: inpatients and outpatients Intervention: risperidone (+ CLO) Comparison: ziprasidone (+ CLO) | ||||||
| Outcomes | Anticipated absolute effects* (95% CI) | Relative effect | No of participants | Quality of the evidence | Comments | |
| Risk with ziprasidone (+ CLO) | Risk with risperidone (+ CLO) | |||||
| Clinical response: no clinically significant response in mental state: 20% reduction in PANSS total score | Study population | RR 0.80 | 24 | ⊕⊝⊝⊝ | ‐ | |
| 417 per 1000 | 333 per 1000 | |||||
| Moderate | ||||||
| 417 per 1000 | 333 per 1000 | |||||
| Adverse effects: weight gain | See comment | See comment | Not estimable | ‐ | ‐ | No SDs reported. |
| Clinical response: mean score/change in global state: mean CGI‐II Global improvement score (high = poor) Short term (6 weeks) | The mean score/change in global state (CGI‐II Global improvement) ‐ short term (6 weeks) was 0 | The mean score/change in global state (CGI‐II global improvement) ‐ short term (6 weeks) in the intervention group was 0.3 fewer (0.82 fewer to 0.22 more) | ‐ | 22 | ⊕⊝⊝⊝ | ‐ |
| Clinical response: mean score/change in mental state: mean PANSS total score (high = poor) Medium term (26 weeks) | The mean score/change in mental state (PANSS total) ‐ medium term (26 weeks) was 0 | The mean score/change in mental state (PANSS total) ‐ medium term (26 weeks) in the intervention group was 1 more (7.91 fewer to 9.91 more) | ‐ | 16 | ⊕⊝⊝⊝ | ‐ |
| Leaving the study early: acceptability of treatment ‐ as measured by completion of trial Long term (52 weeks) | Study population | RR 1.60 | 24 | ⊕⊝⊝⊝ | ‐ | |
| 417 per 1000 | 667 per 1000 | |||||
| Moderate | ||||||
| 417 per 1000 | 667 per 1000 | |||||
| Service utilisation outcomes: hospital admission or days in hospital | See comment | See comment | Not estimable | ‐ | ‐ | No data reported. |
| Quality of life/satisfaction with care for either recipients of care or carers: significant change in quality of life/satisfaction | See comment | See comment | Not estimable | ‐ | ‐ | No data reported. |
| *The risk in the intervention group (and its 95% confidence interval) is based on the assumed risk in the comparison group and the relative effect of the intervention (and its 95% CI). CI: confidence interval; CLO: clozapine; PANSS: Positive and Negative Syndrome Scale; RCT: randomised controlled trial; RR: risk ratio. | ||||||
| GRADE Working Group grades of evidence | ||||||
| 1 Risk of bias: downgraded by 2 levels because high risk of performance bias, detection bias, attrition bias, and reporting bias. 2 Inconsistency and publication bias: not applicable (no meta‐analysis). 3 Indirectness: not downgraded because good applicability in terms of participants and interventions and rating score measures a participant‐important outcome (mental state). 4 Imprecision: downgraded by 2 levels because underpowered to detect difference and CI around relative effect includes appreciable benefit and harm (from less likely to over two times more likely to have no clinical response in mental state defined by PANSS 20% reduction). 5 Indirectness: not downgraded because good applicability (participants and interventions), and rating score measures a participant‐important outcome (global state). 6 Imprecision: downgraded by 1 level because underpowered to detect difference. Not downgraded by 2 levels because CI around mean difference does not include appreciable benefit and appreciable harm (total score on CGI = 7). 7 Imprecision: downgraded by 1 level because underpowered to detect difference. Not downgraded by 2 levels because CI around mean difference does not include appreciable benefit and appreciable harm (total score on PANSS = 120). 8 Indirectness: downgraded by 1 level because leaving the study early a surrogate for participant‐important outcome (acceptability of treatment). 9 Indirectness: downgraded by 2 levels because underpowered to detect difference and CI around relative effect includes appreciable benefit and harm (from less likely to over three times more likely to leave the study early). | ||||||
| Clozapine + ziprasidone versus clozapine + quetiapine for treatment‐resistant schizophrenia | ||||||
| Patient or population: people with treatment‐resistant schizophrenia Setting: inpatients and outpatients Intervention: ziprasidone (+ CLO) Comparison: quetiapine (+ CLO) | ||||||
| Outcomes | Anticipated absolute effects* (95% CI) | Relative effect | No of participants | Quality of the evidence | Comments | |
| Risk with quetiapine (+ CLO) | Risk with ziprasidone (+ CLO) | |||||
| Clinical response: no clinically significant response in mental state: ≥ 50% reduction in PANSS total score Medium term (12 weeks) | Study population | RR 0.54 | 63 | ⊕⊕⊝⊝ | ‐ | |
| 844 per 1000 | 456 per 1000 | |||||
| Moderate | ||||||
| 844 per 1000 | 456 per 1000 | |||||
| Adverse effects: weight gain | See comment | See comment | Not estimable | ‐ | ‐ | No data reported. |
| Clinical response: mean score/change in global state: mean CGI‐S score (high = poor) Medium term (12 weeks) | The mean score/change in global state (CGI‐S) ‐ medium term (12 weeks) was 0 | The mean score/change in global state (CGI‐S) ‐ medium term (12 weeks) in the intervention group was 0.7 fewer (1.18 fewer to 0.22 fewer) | ‐ | 60 | ⊕⊕⊝⊝ | ‐ |
| Clinical response: mean score/change in mental state: mean PANSS total score (high = poor) Medium term (12 weeks) | The mean score/change in mental state (PANSS total) ‐ medium term (12 weeks) was 0 | The mean score/change in mental state (PANSS total) ‐ medium term (12 weeks) in the intervention group was 12.3 fewer (22.43 fewer to 2.17 fewer) | ‐ | 60 | ⊕⊕⊝⊝ | ‐ |
| Leaving the study early: acceptability of treatment ‐ as measured by completion of trial | Study population | RR 0.52 | 63 | ⊕⊝⊝⊝ | ‐ | |
| 63 per 1000 | 33 per 1000 | |||||
| Moderate | ||||||
| 63 per 1000 | 33 per 1000 | |||||
| Service utilisation outcomes: hospital admission or days in hospital | See comment | See comment | Not estimable | ‐ | ‐ | No data reported. |
| Quality of life/satisfaction with care for either recipients of care or carers: significant change in quality of life/satisfaction | See comment | See comment | Not estimable | ‐ | ‐ | No data reported. |
| *The risk in the intervention group (and its 95% confidence interval) is based on the assumed risk in the comparison group and the relative effect of the intervention (and its 95% CI). CGI ‐S: Clinical Global Impression – Severity; CI: confidence interval; CLO: clozapine; PANSS: Positive and Negative Syndrome Scale; RCT: randomised controlled trial; RR: risk ratio; SD: standard deviation. | ||||||
| GRADE Working Group grades of evidence | ||||||
| 1 Risk of bias: downgraded by 2 levels because unclear (so potentially high) risk of biases (selection, performance, reporting). 2 Inconsistency and publication bias: not applicable (no meta‐analysis). 3 Indirectness: not downgraded because good applicability in terms of participants and interventions and rating scale measures a participant‐important outcome (mental state). 4 Imprecision: not downgraded because powered to detect difference and narrow CI. 5 Indirectness: not downgraded because good applicability (participants and interventions) and rating scale measures a participant‐important outcome (global state). 6 Indirectness: downgraded by 1 level because leaving the study early surrogate measure for participant‐important outcome (acceptability of treatment). 7 Imprecision: downgraded by 2 levels because underpowered to detect difference and CI around relative effect includes appreciable benefit and harm (from less likely to leave study early to five times more likely to leave study early). | ||||||
| Outcome or subgroup title | No. of studies | No. of participants | Statistical method | Effect size |
| 1 Clinical response: mean score/change in mental state: mean change in BPRS score from baseline (high = good) Show forest plot | 1 | Mean Difference (IV, Random, 95% CI) | Subtotals only | |
| 1.1 Medium term (12 weeks) | 1 | 105 | Mean Difference (IV, Random, 95% CI) | ‐1.40 [‐5.59, 2.79] |
| 1.2 Medium term (24 weeks) | 1 | 105 | Mean Difference (IV, Random, 95% CI) | ‐0.70 [‐4.81, 3.41] |
| 1.3 Long term (52 weeks) | 1 | 105 | Mean Difference (IV, Random, 95% CI) | 0.90 [‐4.38, 6.18] |
| 2 Adverse effects: other adverse effects (general or specific): mean change in LUNSERS score from baseline (high = poor) Show forest plot | 1 | Mean Difference (IV, Random, 95% CI) | Subtotals only | |
| 2.1 Medium term (12 weeks) | 1 | 105 | Mean Difference (IV, Random, 95% CI) | ‐4.9 [‐8.48, ‐1.32] |
| 2.2 Medium term (24 weeks) | 1 | 105 | Mean Difference (IV, Random, 95% CI) | ‐4.9 [‐8.25, ‐1.55] |
| 2.3 Long term (52 weeks) | 1 | 105 | Mean Difference (IV, Random, 95% CI) | ‐4.8 [‐9.79, 0.19] |
| 3 Leaving the study early: acceptability of treatment ‐ as measured by completion of trial Show forest plot | 1 | Risk Ratio (M‐H, Random, 95% CI) | Subtotals only | |
| 3.1 Medium term (12 weeks) | 1 | 106 | Risk Ratio (M‐H, Random, 95% CI) | 0.88 [0.34, 2.24] |
| 3.2 Medium term (24 weeks) | 1 | 106 | Risk Ratio (M‐H, Random, 95% CI) | 1.17 [0.60, 2.28] |
| 3.3 Long term (52 weeks) | 1 | 106 | Risk Ratio (M‐H, Random, 95% CI) | 1.27 [0.72, 2.22] |
| Outcome or subgroup title | No. of studies | No. of participants | Statistical method | Effect size |
| 1 Clinical response: 1 mean score/change in global state: mean CGI score (high = poor) Show forest plot | 1 | Mean Difference (IV, Random, 95% CI) | Subtotals only | |
| 1.1 Short term (8 weeks) | 1 | 50 | Mean Difference (IV, Random, 95% CI) | ‐0.90 [‐1.38, ‐0.42] |
| 2 Clinical response: 2a mean score/change in mental state: mean BPRS score (high = poor) Show forest plot | 1 | Mean Difference (IV, Random, 95% CI) | Subtotals only | |
| 2.1 Short term (8 weeks) | 1 | 50 | Mean Difference (IV, Random, 95% CI) | ‐4.0 [‐5.86, ‐2.14] |
| 3 Clinical response: 2b mean score/change in mental state: mean SAPS score (high = poor) Show forest plot | 1 | Mean Difference (IV, Random, 95% CI) | Subtotals only | |
| 3.1 Short term (8 weeks) | 1 | 50 | Mean Difference (IV, Random, 95% CI) | ‐6.90 [‐12.82, ‐0.98] |
| 4 Clinical response: 2c mean score/change in mental state: means SANS score (high = poor) Show forest plot | 1 | Mean Difference (IV, Random, 95% CI) | Subtotals only | |
| 4.1 Short term (8 weeks) | 1 | 50 | Mean Difference (IV, Random, 95% CI) | ‐5.20 [‐7.14, ‐3.26] |
| 5 Leaving the study early: acceptability of treatment ‐ as measured by completion of trial Show forest plot | 1 | 56 | Risk Ratio (M‐H, Fixed, 95% CI) | 0.2 [0.02, 1.60] |
| Outcome or subgroup title | No. of studies | No. of participants | Statistical method | Effect size |
| 1 Clinical response: no clinically significant response in mental state: 20% to 50% reduction in PANSS total score Show forest plot | 1 | Risk Ratio (M‐H, Random, 95% CI) | Subtotals only | |
| 1.1 Short term (8 weeks) | 1 | 60 | Risk Ratio (M‐H, Random, 95% CI) | 0.82 [0.40, 1.68] |
| 2 Adverse effect: weight gain Show forest plot | 1 | Risk Ratio (M‐H, Random, 95% CI) | Subtotals only | |
| 2.1 Short term (8 weeks) | 1 | 60 | Risk Ratio (M‐H, Random, 95% CI) | 0.4 [0.08, 1.90] |
| 3 Clinical response: 2a mean score/change in mental state: mean PANSS total score at endpoint (high = poor) Show forest plot | 1 | Mean Difference (IV, Random, 95% CI) | Subtotals only | |
| 3.1 Short term (8 weeks) | 1 | 60 | Mean Difference (IV, Random, 95% CI) | ‐2.28 [‐7.41, 2.85] |
| 4 Clinical response: 2b. mean score/change in mental state (positive symptoms): mean PANSS positive score at endpoint (high = poor) Show forest plot | 1 | Mean Difference (IV, Random, 95% CI) | Subtotals only | |
| 4.1 Short term (8 weeks) | 1 | 60 | Mean Difference (IV, Random, 95% CI) | ‐2.55 [‐4.64, ‐0.46] |
| 5 Clinical response: 2c. mean score/change in mental state (negative symptoms): mean PANSS negative score at endpoint (high = poor) Show forest plot | 1 | Mean Difference (IV, Random, 95% CI) | Subtotals only | |
| 5.1 Short term (8 weeks) | 1 | 60 | Mean Difference (IV, Random, 95% CI) | ‐0.54 [‐3.19, 2.11] |
| 6 Adverse effects: specific adverse effects: hypersalivation Show forest plot | 1 | Risk Ratio (M‐H, Random, 95% CI) | Subtotals only | |
| 6.1 Short term (8 weeks) | 1 | 60 | Risk Ratio (M‐H, Random, 95% CI) | 0.33 [0.04, 3.03] |
| 7 Leaving the study early: acceptability of treatment ‐ as measured by completion of trial Show forest plot | 1 | Risk Ratio (M‐H, Random, 95% CI) | Subtotals only | |
| 7.1 Short term (8 weeks) | 1 | 60 | Risk Ratio (M‐H, Random, 95% CI) | 0.0 [0.0, 0.0] |
| Outcome or subgroup title | No. of studies | No. of participants | Statistical method | Effect size |
| 1 Clinical response: no clinically significant response in mental state: 20% reduction in PANSS total score Show forest plot | 1 | Risk Ratio (M‐H, Fixed, 95% CI) | Subtotals only | |
| 1.1 Short term (6 weeks) | 1 | 24 | Risk Ratio (M‐H, Fixed, 95% CI) | 0.67 [0.13, 3.30] |
| 1.2 Medium term (26 weeks) | 1 | 24 | Risk Ratio (M‐H, Fixed, 95% CI) | 0.8 [0.28, 2.27] |
| 2 Clinical response: no clinically significant response in mental state (positive symptoms) 20% reduction in PANSS positive subscore Show forest plot | 1 | Risk Ratio (M‐H, Random, 95% CI) | Subtotals only | |
| 2.1 Short term (6 weeks) | 1 | 24 | Risk Ratio (M‐H, Random, 95% CI) | 3.0 [0.36, 24.92] |
| 3 Clinical response: 1a mean score/change global state: mean CGI subscale score (high = poor) Show forest plot | 1 | Mean Difference (IV, Random, 95% CI) | Subtotals only | |
| 3.1 Severity of illness | 1 | 22 | Mean Difference (IV, Random, 95% CI) | 0.20 [‐0.32, 0.72] |
| 3.2 Global improvement | 1 | 22 | Mean Difference (IV, Random, 95% CI) | ‐0.30 [‐0.82, 0.22] |
| 3.3 Therapeutic efficacy | 1 | 22 | Mean Difference (IV, Random, 95% CI) | ‐0.30 [‐0.79, 0.19] |
| 4 Clinical response: 1b mean score/change global state: mean GAF score (high = good) Show forest plot | 1 | Mean Difference (IV, Random, 95% CI) | Subtotals only | |
| 4.1 Short term (6 weeks) | 1 | 22 | Mean Difference (IV, Random, 95% CI) | 0.0 [‐7.84, 7.84] |
| 5 Clinical response: 2a. mean score/change mental state: mean HAMD score (high = poor) Show forest plot | 1 | Mean Difference (IV, Random, 95% CI) | Subtotals only | |
| 5.1 Short term (6 weeks) | 1 | 22 | Mean Difference (IV, Random, 95% CI) | ‐3.40 [‐6.71, ‐0.09] |
| 5.2 Medium term (26 weeks) | 1 | 16 | Mean Difference (IV, Random, 95% CI) | ‐0.70 [‐5.35, 3.95] |
| 6 Clinical response: 2b mean score/change mental state: mean PANSS total score (high = poor) Show forest plot | 1 | Mean Difference (IV, Random, 95% CI) | Subtotals only | |
| 6.1 Short term (6 weeks) | 1 | 22 | Mean Difference (IV, Random, 95% CI) | ‐3.10 [‐11.38, 5.18] |
| 6.2 Medium term (26 weeks) | 1 | 16 | Mean Difference (IV, Random, 95% CI) | 1.0 [‐7.91, 9.91] |
| 7 Clinical response: 2c mean score/change in mental state (positive symptoms) mean PANSS positive score (high = poor) Show forest plot | 1 | Mean Difference (IV, Random, 95% CI) | Subtotals only | |
| 7.1 Short term (6 weeks) | 1 | 22 | Mean Difference (IV, Random, 95% CI) | ‐0.20 [‐1.84, 1.44] |
| 7.2 Medium term (26 weeks) | 1 | 16 | Mean Difference (IV, Random, 95% CI) | ‐0.20 [‐2.58, 2.18] |
| 8 Clinical response: 2d mean score/change in mental state (negative symptoms) mean PANSS negative score (high = poor) Show forest plot | 1 | Mean Difference (IV, Random, 95% CI) | Subtotals only | |
| 8.1 Short term (6 weeks) | 1 | 22 | Mean Difference (IV, Random, 95% CI) | ‐1.20 [‐4.63, 2.23] |
| 8.2 Medium term (26 weeks) | 1 | 16 | Mean Difference (IV, Random, 95% CI) | 1.5 [‐2.66, 5.66] |
| 9 Clinical response: 2e mean score/change in mental state (negative symptoms) mean SANS score (high = poor) Show forest plot | 1 | Mean Difference (IV, Random, 95% CI) | Subtotals only | |
| 9.1 Short term (6 weeks) | 1 | 22 | Mean Difference (IV, Random, 95% CI) | ‐4.0 [‐17.55, 9.55] |
| 9.2 Medium term (26 weeks) | 1 | 16 | Mean Difference (IV, Random, 95% CI) | 1.80 [‐14.31, 17.91] |
| 10 Clinical response: 2f mean score/change in global state: mean PANSS global psychopathology score (high = poor) Show forest plot | 1 | Mean Difference (IV, Random, 95% CI) | Subtotals only | |
| 10.1 Short term (6 weeks) | 1 | 22 | Mean Difference (IV, Random, 95% CI) | ‐1.60 [‐6.60, 3.40] |
| 10.2 Medium term (26 weeks) | 1 | 16 | Mean Difference (IV, Random, 95% CI) | 0.0 [‐5.83, 5.83] |
| 11 Adverse effects: specific adverse effects: mean score/change in extrapyramidal adverse effects: mean EPS score (high = poor) Show forest plot | 1 | Mean Difference (IV, Random, 95% CI) | Subtotals only | |
| 11.1 Short term (6 weeks) | 1 | 22 | Mean Difference (IV, Random, 95% CI) | 0.60 [‐0.67, 1.87] |
| 11.2 Medium term (26 weeks) | 1 | 16 | Mean Difference (IV, Random, 95% CI) | 0.30 [‐0.63, 1.23] |
| 12 Adverse effects: other adverse effects (general or specific): mean CGI adverse effect scores (high = poor) Show forest plot | 1 | Mean Difference (IV, Random, 95% CI) | Subtotals only | |
| 12.1 Short term (6 weeks) | 1 | 22 | Mean Difference (IV, Random, 95% CI) | ‐0.10 [‐0.53, 0.33] |
| 13 Leaving the study early: acceptability of treatment ‐ as measured by completion of trial Show forest plot | 1 | Risk Ratio (M‐H, Random, 95% CI) | Subtotals only | |
| 13.1 Short term (6 weeks) | 1 | 24 | Risk Ratio (M‐H, Random, 95% CI) | 1.0 [0.07, 14.21] |
| 13.2 Medium term (26 weeks) | 1 | 24 | Risk Ratio (M‐H, Random, 95% CI) | 0.6 [0.18, 1.97] |
| 13.3 Long term (52 weeks) | 1 | 24 | Risk Ratio (M‐H, Random, 95% CI) | 1.6 [0.73, 3.49] |
| Outcome or subgroup title | No. of studies | No. of participants | Statistical method | Effect size |
| 1 Clinical response: 1a. no clinically significant response in mental state: PANSS reduction ≥ 50% Show forest plot | 1 | Risk Ratio (M‐H, Random, 95% CI) | Subtotals only | |
| 1.1 Medium term (12 weeks) | 1 | 63 | Risk Ratio (M‐H, Random, 95% CI) | 0.54 [0.35, 0.81] |
| 2 Clinical response: 1b. no clinically significant response in mental state: PANSS reduction ≥ 25% Show forest plot | 1 | Risk Ratio (M‐H, Random, 95% CI) | Subtotals only | |
| 2.1 Medium term (12 weeks) | 1 | 63 | Risk Ratio (M‐H, Random, 95% CI) | 0.65 [0.38, 1.10] |
| 3 Clinical response: 1. mean score/change global state: mean CGI‐S score (high = poor) Show forest plot | 1 | Mean Difference (IV, Random, 95% CI) | Subtotals only | |
| 3.1 Medium term (12 weeks) | 1 | 60 | Mean Difference (IV, Random, 95% CI) | ‐0.70 [‐1.18, ‐0.22] |
| 4 Clinical response: 2a. mean score/change mental state: mean PANSS total score (high = poor) Show forest plot | 1 | Mean Difference (IV, Random, 95% CI) | Subtotals only | |
| 4.1 Medium term (12 weeks) | 1 | 60 | Mean Difference (IV, Random, 95% CI) | ‐12.30 [‐22.43, ‐2.17] |
| 5 Clinical response: 2b. mean score/change in mental state (positive symptoms): mean PANSS positive score (high = poor) Show forest plot | 1 | Mean Difference (IV, Random, 95% CI) | Subtotals only | |
| 5.1 Medium term (12 weeks) | 1 | 60 | Mean Difference (IV, Random, 95% CI) | ‐3.10 [‐5.52, ‐0.68] |
| 6 Clinical response: 2b. mean score/change in mental state (negative symptoms): mean PANSS negative score (high = poor) Show forest plot | 1 | Mean Difference (IV, Random, 95% CI) | Subtotals only | |
| 6.1 Medium term (12 weeks) | 1 | 60 | Mean Difference (IV, Random, 95% CI) | 0.80 [‐1.99, 3.59] |
| 7 Adverse effects: specific adverse effects: mean score/change in extrapyramidal adverse effects: reported extrapyramidal adverse effects Show forest plot | 1 | Risk Ratio (M‐H, Random, 95% CI) | Subtotals only | |
| 7.1 Medium term (12 weeks) | 1 | 63 | Risk Ratio (M‐H, Random, 95% CI) | 2.06 [0.41, 10.47] |
| 8 Adverse effects: other adverse effects (general or specific): overall adverse effect rate Show forest plot | 1 | Risk Ratio (M‐H, Random, 95% CI) | Subtotals only | |
| 8.1 Medium term (12 weeks) | 1 | 63 | Risk Ratio (M‐H, Random, 95% CI) | 0.75 [0.50, 1.13] |
| 9 Adverse effects: other adverse effects (general or specific): agitation Show forest plot | 1 | Risk Ratio (M‐H, Random, 95% CI) | Subtotals only | |
| 9.1 Medium term (12 weeks) | 1 | 63 | Risk Ratio (M‐H, Random, 95% CI) | 1.03 [0.15, 6.88] |
| 10 Adverse effects: other adverse effects (general or specific): constipation Show forest plot | 1 | Risk Ratio (M‐H, Random, 95% CI) | Subtotals only | |
| 10.1 Medium term (12 weeks) | 1 | 63 | Risk Ratio (M‐H, Random, 95% CI) | 0.15 [0.01, 2.74] |
| 11 Adverse effects: other adverse effects (general or specific): drowsiness Show forest plot | 1 | Risk Ratio (M‐H, Random, 95% CI) | Subtotals only | |
| 11.1 Medium term (12 weeks) | 1 | 63 | Risk Ratio (M‐H, Random, 95% CI) | 0.47 [0.18, 1.19] |
| 12 Adverse effects: other adverse effects (general or specific): dry mouth Show forest plot | 1 | Risk Ratio (M‐H, Random, 95% CI) | Subtotals only | |
| 12.1 Medium term (12 weeks) | 1 | 63 | Risk Ratio (M‐H, Random, 95% CI) | 0.17 [0.02, 1.35] |
| 13 Adverse effects: other adverse effects (general or specific): headache Show forest plot | 1 | Risk Ratio (M‐H, Random, 95% CI) | Subtotals only | |
| 13.1 Medium term (12 weeks) | 1 | 63 | Risk Ratio (M‐H, Random, 95% CI) | 1.03 [0.28, 3.77] |
| 14 Adverse effects: other adverse effects (general or specific): insomnia Show forest plot | 1 | Risk Ratio (M‐H, Random, 95% CI) | Subtotals only | |
| 14.1 Medium term (12 weeks) | 1 | 63 | Risk Ratio (M‐H, Random, 95% CI) | 0.69 [0.12, 3.84] |
| 15 Adverse effects: other adverse effects (general or specific): orthostatic hypotension Show forest plot | 1 | Risk Ratio (M‐H, Random, 95% CI) | Subtotals only | |
| 15.1 Medium term (12 weeks) | 1 | 63 | Risk Ratio (M‐H, Random, 95% CI) | 0.21 [0.01, 4.13] |
| 16 Adverse effects: other adverse effects (general or specific): tachycardia Show forest plot | 1 | Risk Ratio (M‐H, Random, 95% CI) | Subtotals only | |
| 16.1 Medium term (12 weeks) | 1 | 63 | Risk Ratio (M‐H, Random, 95% CI) | 0.69 [0.12, 3.84] |
| 17 Adverse effects: other adverse effects (general or specific): vertigo Show forest plot | 1 | Risk Ratio (M‐H, Random, 95% CI) | Subtotals only | |
| 17.1 Medium term (12 weeks) | 1 | 63 | Risk Ratio (M‐H, Random, 95% CI) | 0.21 [0.03, 1.67] |
| 18 Leaving the study early: acceptability of treatment ‐ as measured by completion of trial Show forest plot | 1 | Risk Ratio (M‐H, Fixed, 95% CI) | Subtotals only | |
| 18.1 Medium term (12 weeks) | 1 | 63 | Risk Ratio (M‐H, Fixed, 95% CI) | 0.52 [0.05, 5.41] |