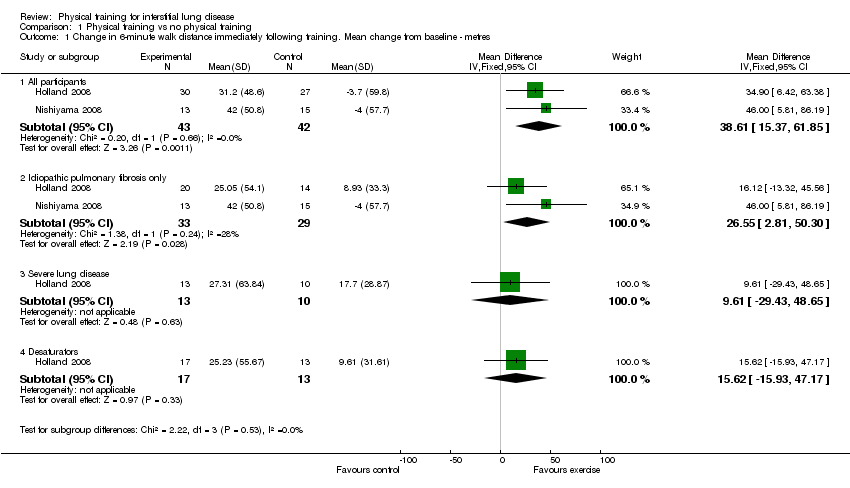
| 1 Change in 6‐minute walk distance immediately following training. Mean change from baseline ‐ metres Show forest plot | 2 | | Mean Difference (IV, Fixed, 95% CI) | Subtotals only |
|
| 1.1 All participants | 2 | 85 | Mean Difference (IV, Fixed, 95% CI) | 38.61 [15.37, 61.85] |
| 1.2 Idiopathic pulmonary fibrosis only | 2 | 62 | Mean Difference (IV, Fixed, 95% CI) | 26.55 [2.81, 50.30] |
| 1.3 Severe lung disease | 1 | 23 | Mean Difference (IV, Fixed, 95% CI) | 9.61 [‐29.43, 48.65] |
| 1.4 Desaturators | 1 | 30 | Mean Difference (IV, Fixed, 95% CI) | 15.62 [‐15.93, 47.17] |
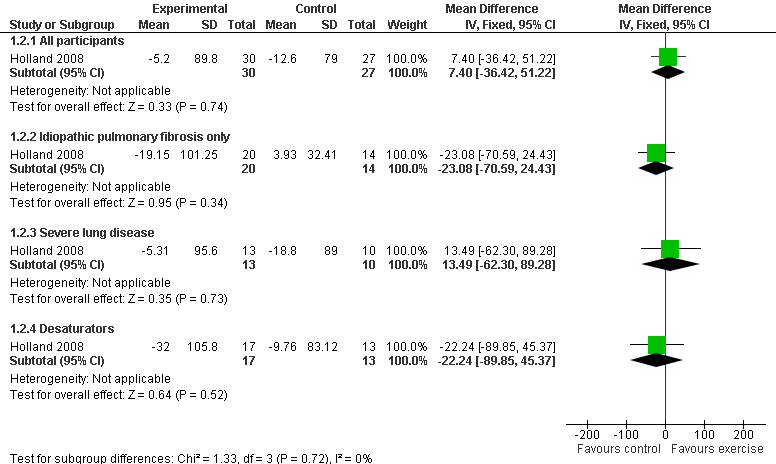
| 2 Change in 6‐minute walk test at long‐term follow‐up. Mean change from baseline ‐ metres Show forest plot | 1 | | Mean Difference (IV, Fixed, 95% CI) | Subtotals only |
|
| 2.1 All participants | 1 | 57 | Mean Difference (IV, Fixed, 95% CI) | 7.40 [‐36.42, 51.22] |
| 2.2 Idiopathic pulmonary fibrosis only | 1 | 34 | Mean Difference (IV, Fixed, 95% CI) | ‐23.08 [‐70.59, 24.43] |
| 2.3 Severe lung disease | 1 | 23 | Mean Difference (IV, Fixed, 95% CI) | 13.49 [‐62.30, 89.28] |
| 2.4 Desaturators | 1 | 30 | Mean Difference (IV, Fixed, 95% CI) | ‐22.24 [‐89.85, 45.37] |
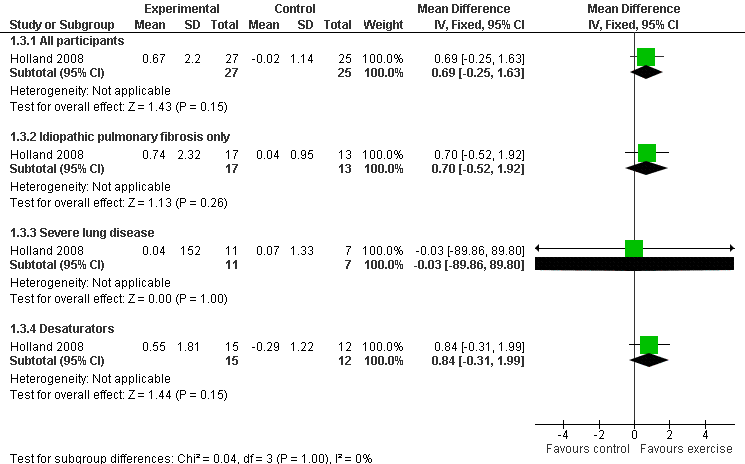
| 3 Change in VO2peak immediately following training ‐ ml.kg.min Show forest plot | 1 | | Mean Difference (IV, Fixed, 95% CI) | Subtotals only |
|
| 3.1 All participants | 1 | 52 | Mean Difference (IV, Fixed, 95% CI) | 0.69 [‐0.25, 1.63] |
| 3.2 Idiopathic pulmonary fibrosis only | 1 | 30 | Mean Difference (IV, Fixed, 95% CI) | 0.7 [‐0.52, 1.92] |
| 3.3 Severe lung disease | 1 | 18 | Mean Difference (IV, Fixed, 95% CI) | ‐0.03 [‐89.86, 89.80] |
| 3.4 Desaturators | 1 | 27 | Mean Difference (IV, Fixed, 95% CI) | 0.84 [‐0.31, 1.99] |
| 4 Change in VEmax immediately following training ‐ Litres.min Show forest plot | 1 | | Mean Difference (IV, Fixed, 95% CI) | Subtotals only |
|
| 4.1 All participants | 1 | 52 | Mean Difference (IV, Fixed, 95% CI) | 4.71 [0.10, 9.32] |
| 4.2 Idiopathic pulmonary fibrosis only | 1 | 30 | Mean Difference (IV, Fixed, 95% CI) | 6.97 [0.87, 13.07] |
| 4.3 Severe lung disease | 1 | 20 | Mean Difference (IV, Fixed, 95% CI) | 4.16 [‐3.34, 11.66] |
| 4.4 Desaturators | 1 | 27 | Mean Difference (IV, Fixed, 95% CI) | 6.95 [0.03, 13.87] |
| 5 Change in maximum heart rate immediately following training ‐ beats per minute Show forest plot | 1 | | Mean Difference (IV, Fixed, 95% CI) | Subtotals only |
|
| 5.1 All participants | 1 | 52 | Mean Difference (IV, Fixed, 95% CI) | ‐1.84 [‐6.26, 2.58] |
| 5.2 Idiopathic pulmonary fibrosis only | 1 | 30 | Mean Difference (IV, Fixed, 95% CI) | ‐1.91 [‐5.92, 2.10] |
| 5.3 Severe lung disease | 1 | 20 | Mean Difference (IV, Fixed, 95% CI) | ‐5.38 [‐11.46, 0.70] |
| 5.4 Desaturators | 1 | 27 | Mean Difference (IV, Fixed, 95% CI) | ‐0.45 [‐6.07, 5.17] |
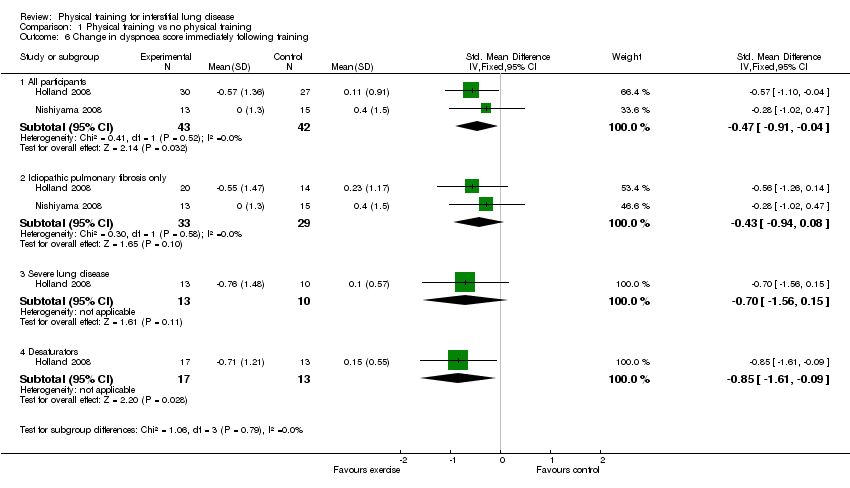
| 6 Change in dyspnoea score immediately following training Show forest plot | 2 | | Std. Mean Difference (IV, Fixed, 95% CI) | Subtotals only |
|
| 6.1 All participants | 2 | 85 | Std. Mean Difference (IV, Fixed, 95% CI) | ‐0.47 [‐0.91, ‐0.04] |
| 6.2 Idiopathic pulmonary fibrosis only | 2 | 62 | Std. Mean Difference (IV, Fixed, 95% CI) | ‐0.43 [‐0.94, 0.08] |
| 6.3 Severe lung disease | 1 | 23 | Std. Mean Difference (IV, Fixed, 95% CI) | ‐0.70 [‐1.56, 0.15] |
| 6.4 Desaturators | 1 | 30 | Std. Mean Difference (IV, Fixed, 95% CI) | ‐0.85 [‐1.61, ‐0.09] |
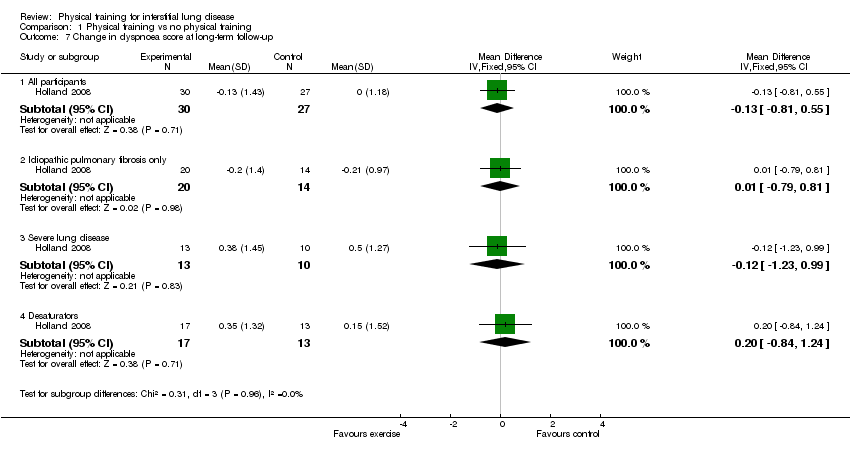
| 7 Change in dyspnoea score at long‐term follow‐up Show forest plot | 1 | | Mean Difference (IV, Fixed, 95% CI) | Subtotals only |
|
| 7.1 All participants | 1 | 57 | Mean Difference (IV, Fixed, 95% CI) | ‐0.13 [‐0.81, 0.55] |
| 7.2 Idiopathic pulmonary fibrosis only | 1 | 34 | Mean Difference (IV, Fixed, 95% CI) | 0.01 [‐0.79, 0.81] |
| 7.3 Severe lung disease | 1 | 23 | Mean Difference (IV, Fixed, 95% CI) | ‐0.12 [‐1.23, 0.99] |
| 7.4 Desaturators | 1 | 30 | Mean Difference (IV, Fixed, 95% CI) | 0.20 [‐0.84, 1.24] |
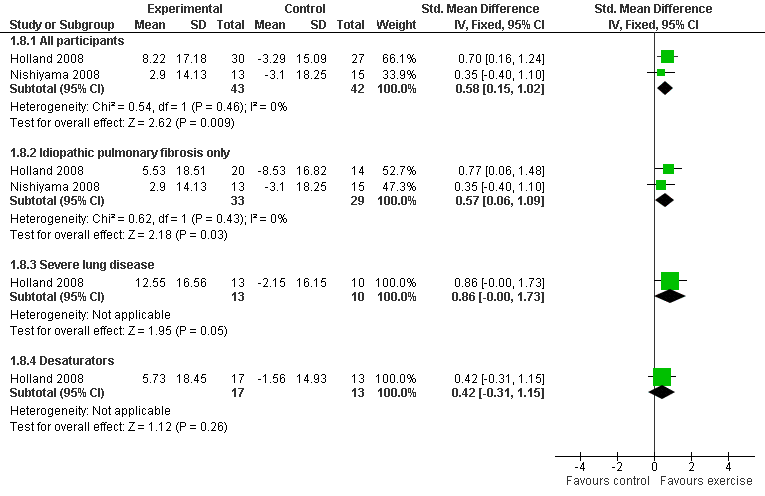
| 8 Change in quality of life immediately following training Show forest plot | 2 | | Std. Mean Difference (IV, Fixed, 95% CI) | Subtotals only |
|
| 8.1 All participants | 2 | 85 | Std. Mean Difference (IV, Fixed, 95% CI) | 0.58 [0.15, 1.02] |
| 8.2 Idiopathic pulmonary fibrosis only | 2 | 62 | Std. Mean Difference (IV, Fixed, 95% CI) | 0.57 [0.06, 1.09] |
| 8.3 Severe lung disease | 1 | 23 | Std. Mean Difference (IV, Fixed, 95% CI) | 0.86 [‐0.00, 1.73] |
| 8.4 Desaturators | 1 | 30 | Std. Mean Difference (IV, Fixed, 95% CI) | 0.42 [‐0.31, 1.15] |
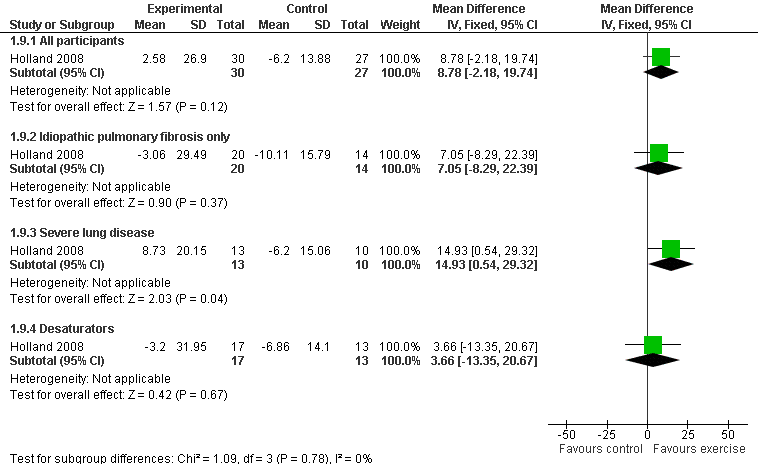
| 9 Change in quality of life at long‐term follow‐up Show forest plot | 1 | | Mean Difference (IV, Fixed, 95% CI) | Subtotals only |
|
| 9.1 All participants | 1 | 57 | Mean Difference (IV, Fixed, 95% CI) | 8.78 [‐2.18, 19.74] |
| 9.2 Idiopathic pulmonary fibrosis only | 1 | 34 | Mean Difference (IV, Fixed, 95% CI) | 7.05 [‐8.29, 22.39] |
| 9.3 Severe lung disease | 1 | 23 | Mean Difference (IV, Fixed, 95% CI) | 14.93 [0.54, 29.32] |
| 9.4 Desaturators | 1 | 30 | Mean Difference (IV, Fixed, 95% CI) | 3.66 [‐13.35, 20.67] |
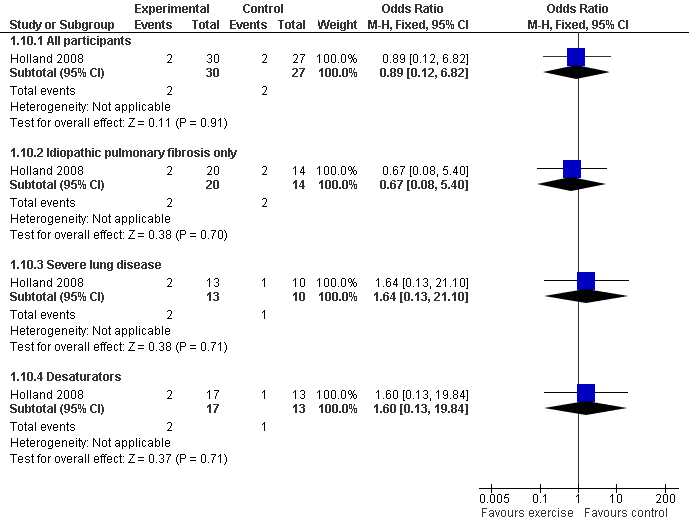
| 10 Six month survival Show forest plot | 1 | | Odds Ratio (M‐H, Fixed, 95% CI) | Subtotals only |
|
| 10.1 All participants | 1 | 57 | Odds Ratio (M‐H, Fixed, 95% CI) | 0.89 [0.12, 6.82] |
| 10.2 Idiopathic pulmonary fibrosis only | 1 | 34 | Odds Ratio (M‐H, Fixed, 95% CI) | 0.67 [0.08, 5.40] |
| 10.3 Severe lung disease | 1 | 23 | Odds Ratio (M‐H, Fixed, 95% CI) | 1.64 [0.13, 21.10] |
| 10.4 Desaturators | 1 | 30 | Odds Ratio (M‐H, Fixed, 95% CI) | 1.6 [0.13, 19.84] |