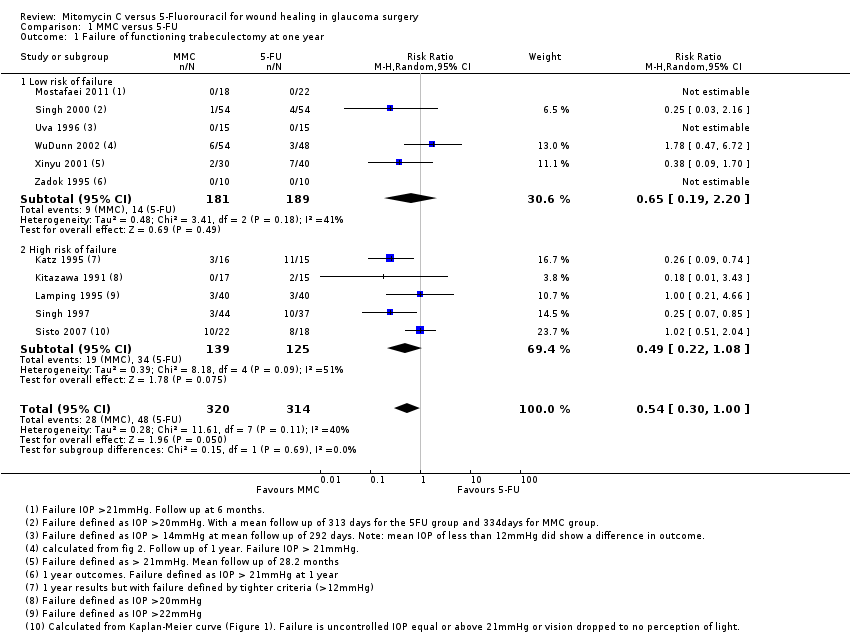
| 1 Failure of functioning trabeculectomy at one year Show forest plot | 11 | 634 | Risk Ratio (M‐H, Random, 95% CI) | 0.54 [0.30, 1.00] |
|
| 1.1 Low risk of failure | 6 | 370 | Risk Ratio (M‐H, Random, 95% CI) | 0.65 [0.19, 2.20] |
| 1.2 High risk of failure | 5 | 264 | Risk Ratio (M‐H, Random, 95% CI) | 0.49 [0.22, 1.08] |
| 2 Failure of functioning trabeculectomy at one year in descending order of MMC exposure (dose x duration) Show forest plot | 10 | 594 | Risk Ratio (M‐H, Random, 95% CI) | 0.54 [0.30, 1.00] |
|
| 3 Failure of functioning trabeculectomy at one year depending on 5‐FU administration technique Show forest plot | 10 | 594 | Risk Ratio (M‐H, Random, 95% CI) | 0.54 [0.30, 1.00] |
|
| 3.1 5‐FU by postoperative injections | 6 | 273 | Risk Ratio (M‐H, Random, 95% CI) | 0.55 [0.27, 1.15] |
| 3.2 5‐FU by intraoperative sponge application | 4 | 321 | Risk Ratio (M‐H, Random, 95% CI) | 0.52 [0.13, 2.08] |
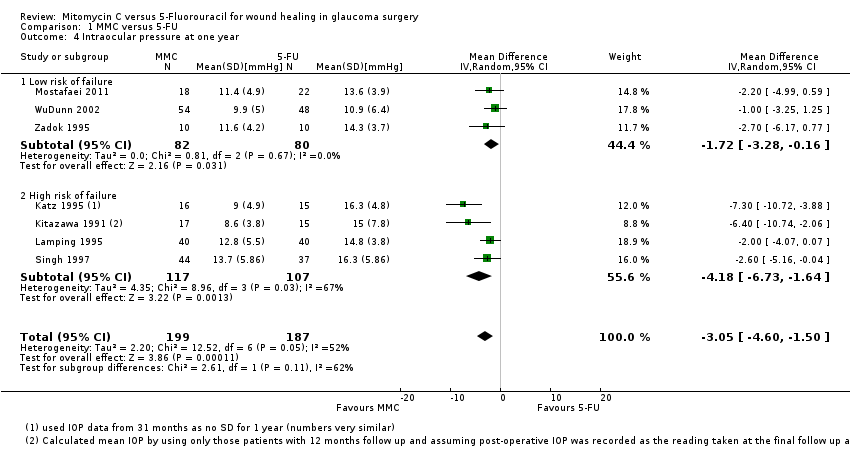
| 4 Intraocular pressure at one year Show forest plot | 7 | 386 | Mean Difference (IV, Random, 95% CI) | ‐3.05 [‐4.60, ‐1.50] |
|
| 4.1 Low risk of failure | 3 | 162 | Mean Difference (IV, Random, 95% CI) | ‐1.72 [‐3.28, ‐0.16] |
| 4.2 High risk of failure | 4 | 224 | Mean Difference (IV, Random, 95% CI) | ‐4.18 [‐6.73, ‐1.64] |
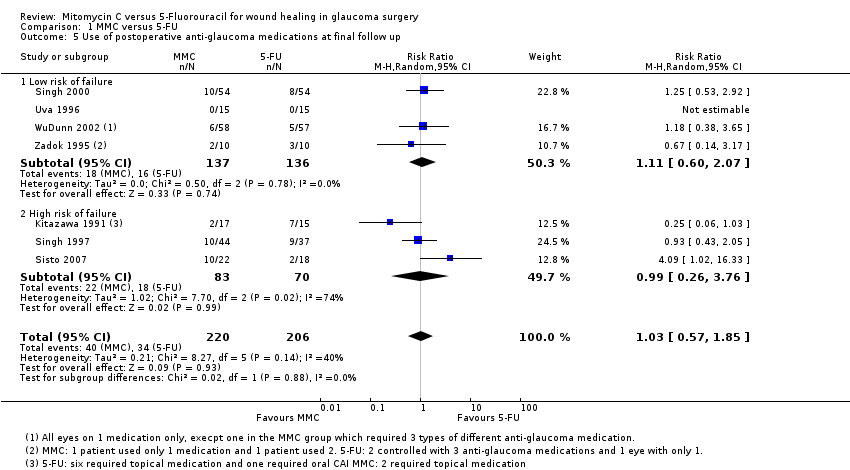
| 5 Use of postoperative anti‐glaucoma medications at final follow up Show forest plot | 7 | 426 | Risk Ratio (M‐H, Random, 95% CI) | 1.03 [0.57, 1.85] |
|
| 5.1 Low risk of failure | 4 | 273 | Risk Ratio (M‐H, Random, 95% CI) | 1.11 [0.60, 2.07] |
| 5.2 High risk of failure | 3 | 153 | Risk Ratio (M‐H, Random, 95% CI) | 0.99 [0.26, 3.76] |
| 6 Mean number of postoperative anti‐glaucoma medications Show forest plot | 4 | 342 | Mean Difference (IV, Random, 95% CI) | ‐0.33 [‐0.70, 0.05] |
|
| 6.1 Low risk of failure | 2 | 223 | Mean Difference (IV, Random, 95% CI) | ‐0.08 [‐0.27, 0.11] |
| 6.2 High risk of failure | 2 | 119 | Mean Difference (IV, Random, 95% CI) | ‐0.71 [‐1.34, ‐0.09] |
| 7 Loss of 2 or more lines of Snellen visual acuity postoperatively Show forest plot | 5 | 328 | Risk Ratio (M‐H, Fixed, 95% CI) | 1.05 [0.54, 2.06] |
|
| 7.1 Low risk of failure | 2 | 128 | Risk Ratio (M‐H, Fixed, 95% CI) | 2.0 [0.53, 7.59] |
| 7.2 High risk of failure | 3 | 200 | Risk Ratio (M‐H, Fixed, 95% CI) | 0.81 [0.36, 1.80] |
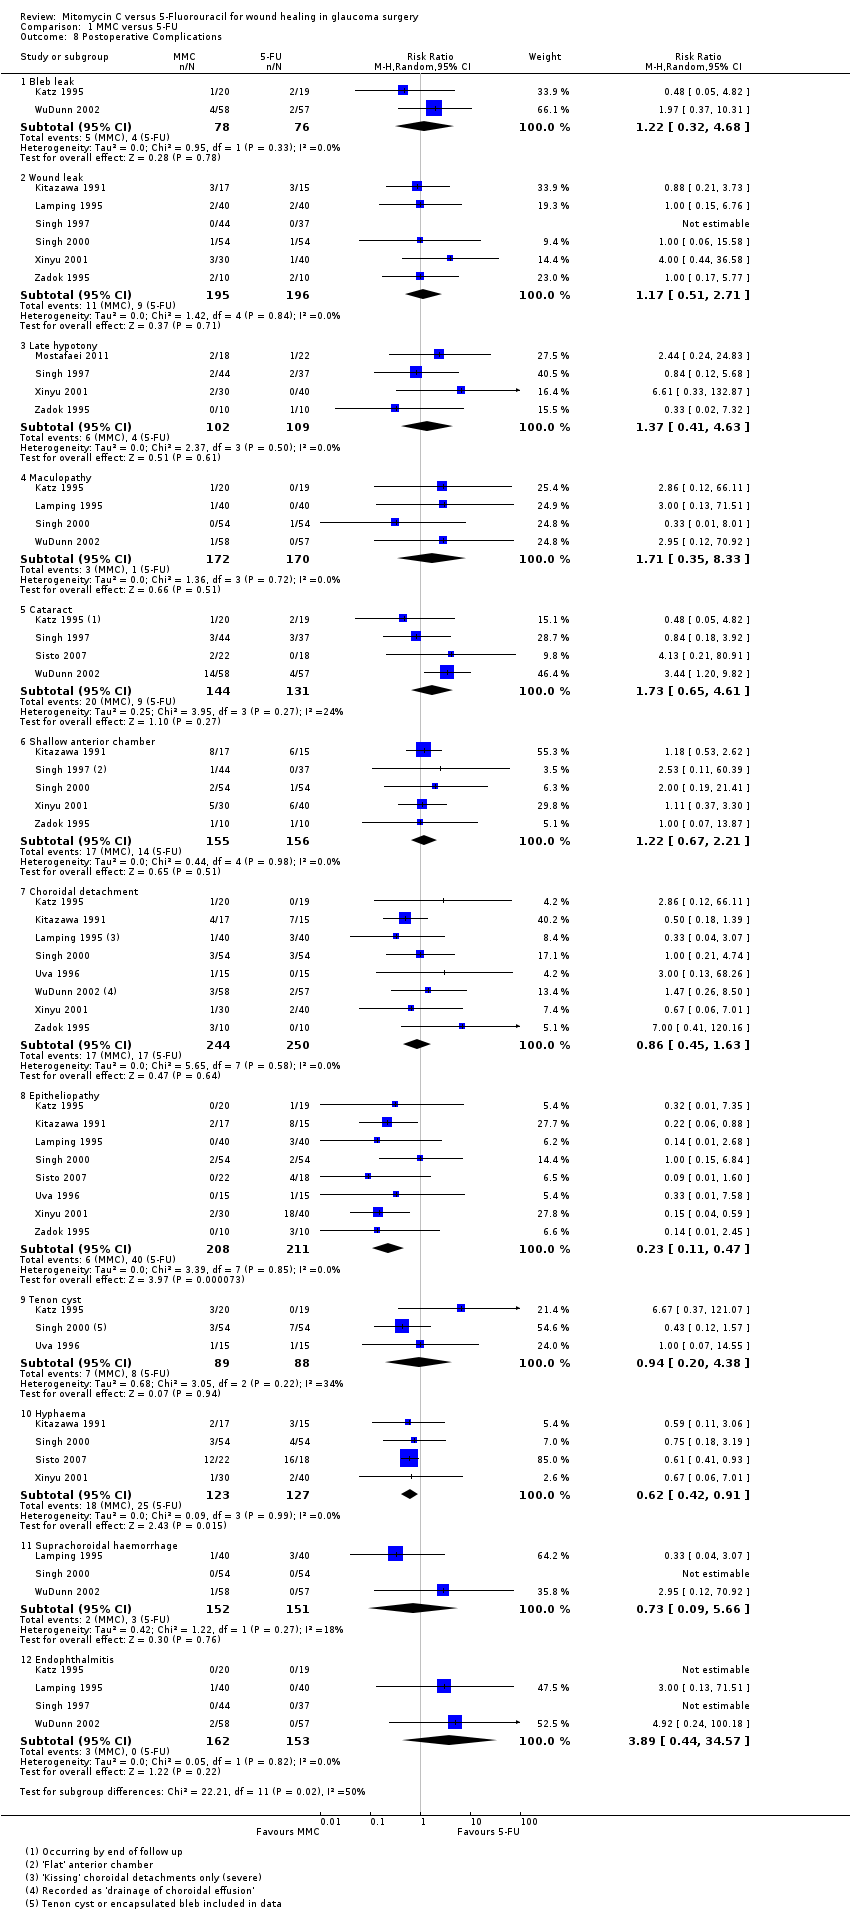
| 8 Postoperative Complications Show forest plot | 11 | | Risk Ratio (M‐H, Random, 95% CI) | Subtotals only |
|
| 8.1 Bleb leak | 2 | 154 | Risk Ratio (M‐H, Random, 95% CI) | 1.22 [0.32, 4.68] |
| 8.2 Wound leak | 6 | 391 | Risk Ratio (M‐H, Random, 95% CI) | 1.17 [0.51, 2.71] |
| 8.3 Late hypotony | 4 | 211 | Risk Ratio (M‐H, Random, 95% CI) | 1.37 [0.41, 4.63] |
| 8.4 Maculopathy | 4 | 342 | Risk Ratio (M‐H, Random, 95% CI) | 1.71 [0.35, 8.33] |
| 8.5 Cataract | 4 | 275 | Risk Ratio (M‐H, Random, 95% CI) | 1.73 [0.65, 4.61] |
| 8.6 Shallow anterior chamber | 5 | 311 | Risk Ratio (M‐H, Random, 95% CI) | 1.22 [0.67, 2.21] |
| 8.7 Choroidal detachment | 8 | 494 | Risk Ratio (M‐H, Random, 95% CI) | 0.86 [0.45, 1.63] |
| 8.8 Epitheliopathy | 8 | 419 | Risk Ratio (M‐H, Random, 95% CI) | 0.23 [0.11, 0.47] |
| 8.9 Tenon cyst | 3 | 177 | Risk Ratio (M‐H, Random, 95% CI) | 0.94 [0.20, 4.38] |
| 8.10 Hyphaema | 4 | 250 | Risk Ratio (M‐H, Random, 95% CI) | 0.62 [0.42, 0.91] |
| 8.11 Suprachoroidal haemorrhage | 3 | 303 | Risk Ratio (M‐H, Random, 95% CI) | 0.73 [0.09, 5.66] |
| 8.12 Endophthalmitis | 4 | 315 | Risk Ratio (M‐H, Random, 95% CI) | 3.89 [0.44, 34.57] |