Hemodijafiltracija, hemofiltracija i hemodijaliza u završnom stadiju bubrežne bolesti
Abstract
Background
Convective dialysis modalities (haemofiltration (HF), haemodiafiltration (HDF), and acetate‐free biofiltration (AFB)) removed excess body fluid across the dialysis membrane with positive pressure and accumulated middle‐ and larger‐size accumulated solutes more efficiently than haemodialysis (HD). This increased larger solute removal combined with use of ultra‐pure dialysis fluid in convective dialysis is hypothesised to reduce the frequency and severity of symptoms during dialysis as well as improve clinical outcomes. Convective dialysis therapies (HDF and HF) are associated with lower mortality compared to diffusive therapy (HD) in observational studies. This is an update of a review first published in 2006.
Objectives
To compare convective (HF, HDF, or AFB) with diffusive (HD) dialysis modalities on clinical outcomes (mortality, major cardiovascular events, hospitalisation and treatment‐related adverse events) in men and women with end‐stage kidney disease (ESKD).
Search methods
We searched the Cochrane Renal Group's Specialised Register (to 18 February 2015) through contact with a Trials' Search Co‐ordinator using search terms relevant to this review.
Selection criteria
We included randomised controlled trials comparing convective therapy (HF, HDF, AFB) with another convective therapy or diffusive therapy (HD) for treatment of ESKD.
Data collection and analysis
Two independent authors identified studies, extracted data and assessed study risk of bias. We summarised treatment effects using the random effects model. We reported results as a risk ratio (RR) for dichotomous outcomes and mean difference (MD) for continuous data together with 95% confidence intervals (CI). We assessed for heterogeneity using the Chi2 test and explored the amount of variation in treatment estimates beyond that expected by chance using the I2 statistic.
Main results
Twenty studies comprising 667 participants were included in the 2006 review. In that review, there was insufficient evidence of treatment effects on major clinical outcomes to draw clinically meaningful conclusions. Searching to February 2015 identified 40 eligible studies comprising 3483 participants overall. In total, 35 studies (4039 participants) compared HF, HDF or AFB with HD, three studies (54 participants) compared AFB with HDF, and three studies (129 participants) compared HDF with HF.
Risks of bias in all studies were generally high resulting in low confidence in estimated treatment effects. Convective dialysis had no significant effect on all‐cause mortality (11 studies, 3396 participants: RR 0.87, 95% CI 0.72 to 1.05; I2 = 34%), but significantly reduced cardiovascular mortality (6 studies, 2889 participants: RR 0.75, 95% CI 0.61 to 0.92; I2 = 0%). One study reported no significant effect on rates of nonfatal cardiovascular events (714 participants: RR 1.14, 95% CI 0.86 to 1.50) and two studies showed no significant difference in hospitalisation (2 studies, 1688 participants: RR 1.23, 95% CI 0.93 to 1.63; I2 = 0%). One study reported rates of hypotension during dialysis were significantly reduced with convective therapy (906 participants: RR 0.72, 95% CI 0.66 to 0.80). Adverse events were not systematically evaluated in most studies and data for health‐related quality of life were sparse. Convective therapies significantly reduced predialysis levels of B2 microglobulin (12 studies, 1813 participants: MD ‐5.55 mg/dL, 95% CI ‐9.11 to ‐1.98; I2 = 94%) and increased dialysis dose (Kt/V urea) (14 studies, 2022 participants: MD 0.07, 95% CI ‐0.00 to 0.14; I2 = 90%) compared to diffusive therapy, but results across studies were very heterogeneous. Sensitivity analyses limited to studies comparing HDF with HD showed very similar results. Directly comparative data for differing types of convective dialysis were insufficient to draw conclusions.
Studies had important risks of bias leading to low confidence in the summary estimates and were generally limited to patients who had adequate dialysis vascular access.
Authors' conclusions
Convective dialysis may reduce cardiovascular but not all‐cause mortality and effects on nonfatal cardiovascular events and hospitalisation are inconclusive. However, any treatment benefits of convective dialysis on all patient outcomes including cardiovascular death are unreliable due to limitations in study methods and reporting. Future studies which assess treatment effects of convection dose on patient outcomes including mortality and cardiovascular events would be informative.
PICO
Laički sažetak
Hemodijafiltracija, hemofiltracija i hemodijaliza u završnom stadiju bubrežne bolesti
Ljudi koji imaju ozbiljan gubitak bubrežne funkcije liječe se dijalizom ili presadbom bubrega da bi se iz tijela uklonili toksini i tekućina. Dijaliza uklanja otpadne proizvode i tekućinu filtriranjem toksina i tekućine kroz membranu u dijaliznom aparatu (prilikom hemodijalize) ili unutar organizma (prilikom peritonejske dijalize). Kad bubrezi zakažu, toksini koji se nakupljaju u tijelu razlikuju se po svojoj veličini i veće molekule se manje uspješno uklanjaju standardnom hemodijalizom. Novije vrste dijalize filtriraju vodu preko membrane koja omogućuje učinkovitije uklanjanje neželjenih molekula. Veće molekule se uklanjaju bolje i dijalizna tekućina ima manje nečistoća, što otvara mogućnost da konvektivna dijaliza može poboljšati pacijentove simptome i njihovo preživljavanje na dijalizi. Tri vrste konvektivne dijalizacijske terapije su: hemodijafiltracija, hemofiltracija i acetat‐slobodna biofiltracija. Uporaba konvektivne terapije za dijalizu veća je u Europi i manja u SAD‐u. S obzirom na razliku između regija u prihvaćanju te terapije i potencijalnu korist za pacijente, ažuriran je ovaj Cochrane prikaz novim studijama koje su objavljene u 2015. godini.
Pronađeno je 40 studija s uključenih 4.137 odraslih sudionika. Od toga 35 studija koje uključuju 4.039 odraslih uspoređuju konvektivnu dijalizu sa standardnom hemodijalizom. Ukupno gledano, dokazi u tim studijama bili su niske ili veoma niske kvalitete zbog ograničenja metoda koje su korištene u istraživanjima, što smanjuje pozdanost rezultata. Nije bilo dokaza da konvektivna dijaliza umanjuje rizik od smrti zbog bilo kojeg uzroka, no ona može smanjiti smrtnost od srčanih i krvožilnih bolesti. U usporedbi sa standardnom hemodijalizom, liječenje 1000 žena i muškaraca koji imaju završni stadij bubrežne bolesti konvektivnom dijalizom može spriječiti 25 smrti od srčanih bolesti. Konvektivna terapija može ublažiti sniženje krvnoga tlaka tijekom dijalize, ali nema dokaza da utječe na prijam u bolnicu ili druge nuspojave, ili da poboljšava kvalitetu života.
Authors' conclusions
Summary of findings
| Convective compared with diffusive dialysis modalities for men and women with end‐stage kidney disease | ||||||
| Patient or population: men and women with end‐stage kidney disease Intervention: convective dialysis Comparison: diffusive dialysis | ||||||
| Outcomes | Illustrative comparative risks* (95% CI) | Relative effect | No of participants | Quality of the evidence | Comments | |
| Assumed risk | Corresponding risk | |||||
| Diffusion | Convection | |||||
| All‐cause mortality | 200 per 1000 | Not significant | RR 0.87 (0.72 to 1.05) | 11 (3396) | ⊕⊕⊝⊝ | Convective therapy has little or no effect on all‐cause mortality |
| Cardiovascular mortality | 100 per 1000 | 75 per 1000 | RR 0.75 (0.81 to 0.92) | 6 (2889) | ⊕⊕⊝⊝ | Convective therapy may reduce cardiovascular mortality |
| Nonfatal cardiovascular events | 130 per 1000 | Not significant | RR 1.23 (0.93‐1.63) | 2 (1688) | ⊕⊝⊝⊝ | Convective therapy has uncertain effects on non‐fatal cardiovascular events |
| Health‐related quality of life | Not estimable | Not estimable | Not estimable | 8 (988) | ⊕⊕⊝⊝ | Convective therapy has uncertain effects on health‐related quality of life |
| *The assumed risk (e.g. the median control group risk across studies) is derived from data within dialysis registries for all‐cause mortality and cardiovascular mortality and the reported event rate in the available study for nonfatal cardiovascular events (CONTRAST (Dutch) Study 2005). The corresponding risk (and its 95% confidence interval) is based on the assumed risk in the comparison group and the relative effect of the intervention (and its 95% CI). CI: Confidence interval; RR: Risk Ratio | ||||||
| GRADE (Grading of Recommendations Assessment, Development, and Evaluation) Working Group grades of evidence (Guyatt 2011). | ||||||
Background
Description of the condition
Dialysis, kidney transplantation or supportive care are available treatment options for end‐stage kidney disease (ESKD). Dialysis therapies include peritoneal dialysis as well as standard haemodialysis (HD) or convective dialysis (haemofiltration (HF), haemodiafiltration (HDF), and acetate‐free biofiltration (AFB)) to remove accumulated fluid and metabolites from the blood when kidney function is severely impaired. Despite effective removal of solutes and water by standard HD to avoid life‐threatening complications, long‐term dialysis patients reported markedly impaired quality of life, sleep disturbance, nausea, depressive symptoms, anxiety, thirst, and pain (Murtagh 2007). In addition, survival remains poor; 10 to 20% of men and women treated with long‐term dialysis die each year (USRDS 2011).
Description of the intervention
Standard HD removes accumulated metabolites and fluid from the patient's blood by diffusion across a semi‐permeable membrane into the dialysate fluid for removal into the dialysis waste. Convective dialysis (HDF, HF and AFB) clears water (convection) using positive pressure across the dialysis membrane for removal. Accumulated solutes follow the movement of water in a phenomenon known as 'solvent drag' (Henderson 2004). Water and electrolytes are replaced as required into the blood circulation. The replacement fluid can be added to the patient's blood before the membrane filter ("pre‐dilution") or after the dialysis filter along with the blood returning into the patient's blood circulation ("post‐dilution").
Accumulated metabolites have different molecular weights and are cleared differently depending on the type of molecular transport used in dialysis (diffusive versus convective). HF may remove higher molecular weight molecules whereas standard HD may be more effective at removing smaller solutes such as urea (Locatelli 2000). A hybrid system that includes both convection and diffusion, known as HDF combines convection with diffusion (Schmidt 1986). In HD and HDF, the dialysate contains acetate, which buffers circulating acids which cannot be buffered sufficiently by kidney function. Acetate depresses myocardial contractility and may cause haemodynamic instability during dialysis (Daugirdas 1991; Sztajzel 1993). AFB, a HDF technique, uses a hypertonic sodium bicarbonate solution in place of acetate to manage acidosis (Zucchelli 1990).
How the intervention might work
While standard HD clears smaller, water‐soluble metabolites efficiently by diffusion, poor clinical outcomes might be explained in part by inadequate removal of middle‐ and larger‐sized waste products of metabolism which are implicated in the pathogenesis of atherosclerosis and dialysis‐related amyloidosis (Guerin 2000). In uncontrolled studies, convective dialysis therapies are associated with lower mortality (Locatelli 1999; Vilar 2009) and lower circulating levels of middle‐size molecules such as vitamin B12 or B2 microglobulin in dialysis patients are associated with reduced cardiovascular and infection‐related mortality (Liabeuf 2012). In addition, HDF is associated with less frequent hypotension during dialysis (Vilar 2009) and the enhanced biocompatibility of ultrapure dialysate fluids used in convective technologies may reduce inflammation, oxidative stress and infection.(Arizono 2004; Calo 2007) Removal of larger metabolites by newer convective dialysis strategies is therefore a potential strategy to improve dialysis outcomes and greater convection volumes during HDF might be a principal determinant of clinical effectiveness with HDF because of greater clearances of middle and large uraemic solutes during treatment.
Why it is important to do this review
In our previous meta‐analysis, published in 2006, that included 17 randomised studies (600 participants) comparing convective with diffusive dialysis (Rabindranath 2006), convective modalities had uncertain effects on mortality in low‐quality evidence and data for adverse events were sparse. Since 2006, 18 additional studies (3439 participants) comparing convection with diffusion modalities have been published, but results have been inconsistent, and consequently there has been variable uptake of HDF into clinical practice; in 2010 the proportion of incident dialysis patients treated with HDF in Europe varied between 0.7% in Finland and 18.9% in the Catalonian region of Spain (ERA‐EDTA Registry 2010). In Australia and New Zealand, the proportion of dialysis patients treated with HDF in 2011 was 21.5% and 10.9%, respectively (ANZDATA 2012). The European Best Practice Guidelines that were published in 2007 suggest that HDF is a suitable treatment strategy to delay complications of ESKD and exchange volumes should be as high as possible (EBPG 2007).
Objectives
To compare convective (HF, HDF, or AFB) with diffusive (HD) dialysis modalities on clinical outcomes (mortality, major cardiovascular events, hospitalisation and treatment‐related adverse events) in men and women with ESKD
Methods
Criteria for considering studies for this review
Types of studies
Randomised controlled trials (RCTs) and quasi‐RCTs (RCTs in which allocation to treatment was obtained by alternation, use of alternate medical records, date of birth or other predictable methods) comparing convective therapies (HF, HDF, AFB) and HD.
Types of participants
Adults with ESKD treated with dialysis.
Types of interventions
-
Convective therapy (HDF/ HF/AFB) compared with diffusive therapy (HD)
-
Direct comparisons of different convective therapies (HDF/HF/AFB)
Types of outcome measures
Primary outcomes
-
All‐cause mortality.
Secondary outcomes
Clinical outcomes
-
Cardiovascular mortality
-
Hypotension (symptomatic hypotension, hypotension requiring treatment and post‐dialysis hypotension, recorded as number of events/person‐years follow‐up or number of patients experiencing one or more episodes)
-
Hospitalisation (days of hospitalisation, one or more episodes, or number of events/person‐years of follow‐up)
-
Change of dialysis modality (from convective to diffusive dialysis modality or vice versa)
-
Symptoms (headaches, nausea, vomiting) occurring during or after dialysis (recorded as number of treatment sessions at which event occurred or number of patients experiencing one or more episodes of headaches, nausea or vomiting)
-
"Any adverse symptoms" or number of patients experiencing "Any adverse symptoms" (number of events/person‐years of follow‐up or patients experiencing one or more events)
-
Health‐related quality of life (any instrument used)
-
Amyloid‐related complications (amyloidosis, carpal tunnel syndrome, amyloid‐related arthropathy).
Surrogate outcomes
-
Adequacy of dialysis (assessed by Kt/V values or by urea reduction ratio (URR))
-
End of treatment blood pressure (measured as systolic, diastolic or mean arterial pressure, in mm Hg)
-
End of treatment predialysis B2 microglobulin levels (mg/L).
Dialysis adequacy measures and B2 microglobulin measures were not regarded as key clinical outcomes in this review. However, they were included to facilitate the determination of their usefulness as secondary outcome measures for the interventions compared.
Search methods for identification of studies
Electronic searches
We searched the Cochrane Renal Group's Specialised Register (to 18 February 2015) through contact with the Trials' Search Co‐ordinator using search terms relevant to this review. The Cochrane Renal Group’s specialised register contains studies identified from the following sources.
-
Quarterly searches of the Cochrane Central Register of Controlled Trials CENTRAL
-
Weekly searches of MEDLINE OVID SP
-
Handsearching of renal‐related journals & the proceedings of major renal conferences
-
Searching of the current year of EMBASE OVID SP
-
Weekly current awareness alerts for selected renal‐journals
-
Searches of the International Clinical Trials Register (ICTRP) Search Portal & ClinicalTrials.gov
Studies contained in the specialised register are identified through search strategies for CENTRAL, MEDLINE, and EMBASE based on the scope of the Cochrane Renal Group. Details of these strategies as well as a list of handsearched journals, conference proceedings and current awareness alerts are available in the 'specialised register' section of information about the Cochrane Renal Group.
See Appendix 1 for search terms used in strategies for this review.
Data collection and analysis
Selection of studies
The search strategies described were used to obtain titles and abstracts of studies that might be relevant to the review. The 2006 review was undertaken by six authors (Rabindranath 2006). Two authors independently assessed and retrieved titles and abstracts. The full text of all potentially relevant studies were retrieved by the same authors and independently assessed in detail. Two authors carried out data extraction independently using standardised data extraction forms. Disagreements were resolved in consultation among the authors.
The review update was undertaken by six authors. Two authors independently assessed and retrieved titles and abstracts. The full text (if published) of all potentially relevant studies were retrieved and independently assessed for inclusion by two authors. Two authors extracted data which was cross‐checked by a third author. Discrepancies were resolved by discussion among the authors.
Data extraction and management
Two authors carried out data extraction independently using standard data extraction forms and data were entered into RevMan. We extracted the number of events and participants as risk of events or when these data were not provided, the number of events/person‐years of follow‐up for dichotomous outcomes and mean (SD) and numbers of participants at risk for continuous outcomes. We translated studies not reported in English before assessment and data extraction. Where more than one publication of a study existed, only the publication with the most complete data was included.
Assessment of risk of bias in included studies
The following items were independently assessed by two authors using the risk of bias assessment tool (Higgins 2011) (see Appendix 2).
-
Was there adequate sequence generation (selection bias)?
-
Was allocation adequately concealed (selection bias)?
-
Was knowledge of the allocated interventions adequately prevented during the study?
-
Participants and personnel (performance bias)
-
Outcome assessors (detection bias)
-
-
Were incomplete outcome data adequately addressed (attrition bias)?
-
Are reports of the study free of suggestion of selective outcome reporting (reporting bias)?
-
Was the study apparently free of other problems that could put it at a risk of bias?
We considered the study to be at high risk of selective outcome reporting when investigators did not report data for all‐cause mortality and cardiovascular mortality and adverse events or patient symptoms.
We rated the quality of the evidence for convection versus diffusion interventions using the Grading of Recommendations Assessment, Development, and Evaluation (GRADE) system for systematic reviews considering study limitations, precision and consistency of treatment estimates, directness of available evidence and publication bias for the clinical outcomes of quality of all‐cause and cardiovascular mortality, nonfatal cardiovascular events, and health‐related quality of life (Guyatt 2011) to generate a summary of findings Table for the main comparison. To estimate the absolute number of men and women with ESKD who had mortality or nonfatal cardiovascular events avoided or incurred with convective dialysis therapy, we used the risk estimate and 95% CI obtained from the corresponding meta‐analysis together with the absolute population risk derived from previously published registry data (USRDS 2011) or from the control group of available RCTs.
Measures of treatment effect
We summarised treatment effects using random‐effects meta‐analysis and expressed results as relative risks (RR) or rate ratios with 95% confidence intervals (CI) for binary outcomes for all studies reporting one or more events (all‐cause mortality, cardiovascular mortality, rate of nonfatal cardiovascular events, rate of hospitalisation, rate of hypotension during dialysis, change in dialysis modality) and mean difference (MD) with 95% CI for continuous outcomes (serum B2 microglobulin, Kt/V, URR, blood pressure).
Data from cross‐over studies were included when authors reported results for the first phase of the study (Mandolfo 2008; Schiffl 2007; Vaslaki 2006). The studies of Schiffl 2007 and Vaslaki 2006 presented the results separately for the two phases and we included in our analysis data from the first phase. For Cristofano 2004, the results of first phase of the study were obtained after contacting the authors. For all the other cross‐over studies, results were extracted and presented in narrative form in a tabular format when available.
Dealing with missing data
Any additional unpublished information or clarification required from the authors was requested by written or electronic correspondence and relevant data obtained in this manner were included in the review.
Assessment of heterogeneity
Heterogeneity of treatment effects between studies was formally tested using the Cochran Q test. The I2 statistic was used to determine the proportion of variation in treatment estimates present that was attributable to heterogeneity beyond the level of that expected by chance (Higgins 2003).
Data synthesis
Data were pooled using a random effects model. For each analysis, the fixed effects model was also evaluated to ensure robustness of the model chosen and susceptibility to outliers.
Subgroup analysis and investigation of heterogeneity
Subgroup analyses to explore how possible sources of heterogeneity (type of treatment (different types of convective therapy (HF, HDF, AFB)); membrane flux (high versus low); age; allocation concealment) might modify treatment effects were not conducted as there was either no evidence for heterogeneity in analyses or insufficient numbers of studies available to conduct analysis.
To assess for potential bias from small study effects, we constructed funnel plots for the log risk ratio against its variance (standard error) for individual studies and formally assessed for plot asymmetry by using the Egger regression test.(Egger 1997).
Results
Description of studies
Results of the search
The results of the search processes are shown in Figure 1.
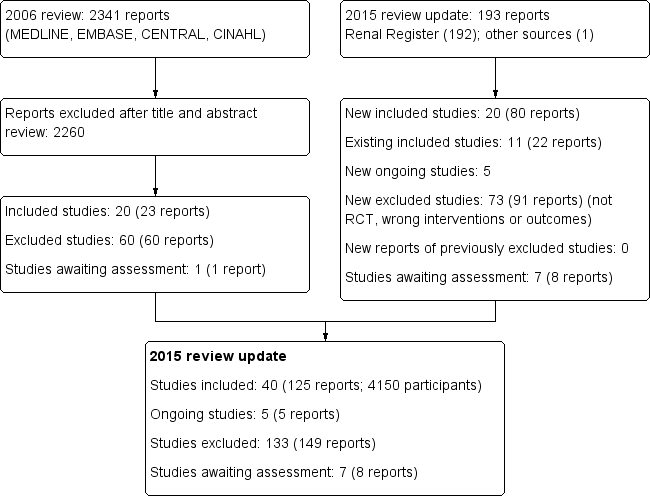
Study flow diagram.
2006 review
The combined search of MEDLINE, EMBASE, CINAHL, CENTRAL, American Journal of Physicians Database, and Database of Abstracts of Reviews of Effectiveness in May 2006 identified 2341 potentially relevant studies. After reviewing titles and abstracts, 2260 studies were excluded. The full text‐versions of 81 studies were retrieved, 59 which were excluded and one study (Ohyama 1981) in Japanese was waiting assessment. The major reason for exclusion was that the identified studies were not randomised. In total 20 studies (Altieri 2004; Bammens 2004; Basile 2001; Beerenhout 2005; Ding 2002; Eiselt 2000; Fox 1993; Lin 2001; Locatelli 1994; Lornoy 1998; Movilli 1996; Noris 1998; Schiffl 1992; Schrander vd Meer 1998; Teo 1987; Todeschini 2002; Tuccillo 2002; Verzetti 1998; Ward 2000; Wizemann 2000) reported in 23 publications enrolling 654 participants were included in the first version of this review.
2015 review update
The updated search of the Cochrane Renal Group's Specialised Register (18 February 2015) identified 193 new reports. After review 91 reports (73 studies) were excluded.
Five citations were ongoing studies with protocols available in the on‐line clinical studies registries (NCT01098149; NCT01327391; NCT01396863; NCT01445366; NCT02374372. We included 20 additional studies in this update (80 reports; 3483 participants) (Bolasco 2003; Coll 2009; CONTRAST (Dutch) Study 2005; Cristofano 2004; ESHOL Study 2011; Karamperis 2005; Kantartzi 2013; Mandolfo 2008; Meert 2009; Ohtake 2012; Pedrini 2011a; PROFIL Study 2011; Righetti 2010; Santoro 2005a; Schiffl 2007; Selby 2006a; Stefansson 2012; Santoro 1999; TURKISH HDF 2013; Vaslaki 2006).
Forty studies (4137 participants) could be included in the review. Thirty‐five studies (4039 participants) compared HF, HDF or AFB with HD, three studies (54 participants) compared AFB with HDF, and three studies (120 participants) compared HDF with HF (Table 1). For the studies that have been reported more than once, only data from the latest versions were used. The characteristics of the populations and interventions in the included studies are reported in the Characteristics of included studies.
| Study ID | Intervention | Duration | Number of patients |
| HDF versus HF | 12 months | 39 | |
| HDF versus HD | 2 weeks | 14 | |
| AFB versus HD | 12 months | 11 | |
| HF versus HD | 12 months | 40 | |
| HF versus HDF versus HD | 18 months | 146 | |
| AFB versus HDF | 15 months | 30 | |
| HDF versus HD | 36 months | 714 | |
| HDF versus HD | 1 session | 12 | |
| HDF versus AFB | 36 weeks | 12 | |
| AFB versus HD | 12 months | 20 | |
| HDF versus HD | 36 months | 906 | |
| HF versus HD | 1 session | 9 | |
| HDF versus HD | 3 months | 24 | |
| HDF versus HD | 2 sessions | 12 | |
| HDF versus HD | 15 months | 67 | |
| HDF versus HD | 24 months | 205 | |
| HDF versus HD | 1 session | 8 | |
| HDF versus HD | 6 weeks | 8 | |
| HDF versus HF | 9 weeks | 14 | |
| HDF versus AFB | 6 months | 12 | |
| AFB versus HD | 1 week | 5 | |
| HDF versus HD | 12 months | 22 | |
| HDF versus HD | 12 months | 69 | |
| HF versus HD | 24 months | 48 | |
| HDF versus HD | 18 months | 24 | |
| AFB versus HD | 48 months | 371 | |
| HF versus HD | 36 months | 64 | |
| HF versus HD | 48 months | 32 | |
| HDF versus HD | 48 months | 76 | |
| AFB versus HD | 12 months | 24 | |
| AFB versus HD | 4 weeks | 12 | |
| HDF versus HD | 4 months | 20 | |
| HDF versus HD | 8 months | 13 | |
| AFB versus HD | 3 sessions | 9 | |
| HDF versus HD | 3 months | 12 | |
| HDF versus HD | 24 months | 782 | |
| HDF versus HD | 48 weeks | 129 | |
| AFB versus HD | 12 months | 41 | |
| HDF versus HD | 12 months | 50 | |
| HDF versus HD | 24 months | 44 |
AFB ‐ acetate‐free biofiltration; HDF ‐ haemodiafiltration; HD ‐ haemodialysis; HF ‐ haemofiltration
Prior to publication of this review update a final search of the Specialised Register identified seven new potential studies (Beerenhout 2004; Bellien 2014; Cornelis 2014; de Sequera 2013; Francisco 2013; Gonzales‐Diez 2012; Krieter 2010a). These studies will be assessed for inclusion in a future update of this review.
Included studies
The 40 included studies were grouped into five subsets (Characteristics of included studies; Table 2).
| Categories of intervention | Study | Total number of studies | Total number of patients |
| HDF versus HD | Bammens 2004; Lin 2001; Locatelli 1994; Lornoy 1998; Teo 1987; Tuccillo 2002; Ward 2000; Wizemann 2000; Bolasco 2003; CONTRAST (Dutch) Study 2005; Cristofano 2004; Karamperis 2005; Mandolfo 2008; Pedrini 2011a; Righetti 2010; Schiffl 2007; Stefansson 2012; TURKISH HDF 2013; Vaslaki 2006ESHOL Study 2011; Kantartzi 2013; Ohtake 2012 | 22 | 3299 |
| HF versus HD | Beerenhout 2005; Fox 1993; Schiffl 1992; Bolasco 2003; Santoro 2005a; PROFIL Study 2011 | 6 | 325 |
| AFB versus HD | Basile 2001; Santoro 1999; Eiselt 2000; Noris 1998; Schrander vd Meer 1998; Selby 2006a; Todeschini 2002; Verzetti 1998 | 8 | 487 |
| HDF versus AFB | 3 | 59 | |
| HDF versus HF | 3 | 199 | |
| More than two treatment arms | 3 | 383 |
AFB ‐ acetate‐free biofiltration; HDF ‐ haemodiafiltration; HD ‐ haemodialysis; HF ‐ haemofiltration
Convective versus diffusive therapy
-
HF versus HD (Beerenhout 2005; Bolasco 2003; Fox 1993; PROFIL Study 2011; Santoro 2005a; Schiffl 1992)
-
HDF versus HD (Bammens 2004; Bolasco 2003; CONTRAST (Dutch) Study 2005; Cristofano 2004; ESHOL Study 2011; Karamperis 2005; Kantartzi 2013; Lin 2001; Locatelli 1994; Lornoy 1998; Mandolfo 2008; Ohtake 2012; Pedrini 2011a; Righetti 2010; Schiffl 2007; Stefansson 2012; Teo 1987; Tuccillo 2002; TURKISH HDF 2013; Vaslaki 2006; Ward 2000; Wizemann 2000)
-
AFB versus HD (Basile 2001; Eiselt 2000; Noris 1998; Schrander vd Meer 1998; Selby 2006a; Santoro 1999; Todeschini 2002; Verzetti 1998)
Study characteristics
Of the 22 studies evaluating HDF, all but three (Locatelli 1994; Teo 1987; Tuccillo 2002) reported convection methods using fluid generated on‐line (on‐line HDF). In the HD control group, 12 studies (34%) used high‐flux membranes, 16 studies (46%) used low‐flux membranes, four studies (11%) used either low or high‐flux membrane and in three studies (9%) the membrane flux was unclear. Convection strategies were highly heterogeneous and no study randomised participants to specific targeted convection volumes. In 16 (46%) studies, adequate vascular access for high volume dialysis was required. Most studies included patients who were anuric or had minimal kidney function.
Seventeen studies had a parallel study design (Beerenhout 2005; CONTRAST (Dutch) Study 2005; Cristofano 2004; Eiselt 2000; ESHOL Study 2011; Lin 2001; Locatelli 1994; Bolasco 2003; Ohtake 2012; PROFIL Study 2011; Santoro 2005a; Schiffl 1992; Schrander vd Meer 1998; Santoro 1999; TURKISH HDF 2013; Ward 2000; Wizemann 2000). Ten studies evaluated short‐term outcomes conducted over follow‐up that varied between one dialysis sessions and two weeks of treatment (Bammens 2004; Cristofano 2004; Fox 1993; Karamperis 2005; Lornoy 1998; Mandolfo 2008; Noris 1998; Selby 2006a; Todeschini 2002; Tuccillo 2002). The remaining 24 studies evaluated outcomes during treatment of between two and 48 months (median 12 months) except one in which treatment duration was unclear (Lin 2001). Sample size varied between five and 906 participants (median 24). Of the overall participants, 2402 (59%) were derived from three large studies evaluating on‐line HDF (CONTRAST (Dutch) Study 2005; ESHOL Study 2011; TURKISH HDF 2013).
Direct comparisons of different convective therapies
-
HDF versus AFB (Coll 2009; Ding 2002; Movilli 1996)
-
HDF versus HF (Altieri 2004; Bolasco 2003; Meert 2009).
Three studies (Locatelli 1994; Schiffl 1992; Bolasco 2003) had three or more treatment arms. These studies had a parallel study design. In the study by Locatelli 1994, HDF was compared with cuprophane HD, low‐flux polysulfone HD and high ‐flux polysulfone HD. Schiffl 1992 compared HF with both low‐flux HD and high‐flux polysulfone HD. Bolasco 2003 assigned participants to HF, HDF or HD. When analysing data from these studies for dichotomous outcomes, convective modalities were compared with the combined results of all the HD treatment arms. For continuous data analysis, data for HDF compared with HD were used.
Study characteristics
Of the six studies comparing convection with another convective strategy, five reported convection methods using fluid generated on‐line. Two studies used high‐flux (33%) membranes for HD, one reported low‐flux membranes (17%), and in the remainder the HD flux was unclear. Convection strategies were highly heterogeneous and no study randomised participants to specific targeted convection volumes. In four (66%) studies, adequate vascular access for high volume dialysis was required. Most studies included patients who were anuric or had minimal renal function.
One study had a parallel study design (Bolasco 2003) and the remainder were cross‐over studies. Follow‐up duration ranged between two and 24 months (median six months) with only one study reporting follow‐up for 12 months or more. Study sample sizes were small (12 to 76 participants; median 21).
Excluded studies
In total 133 studies (149 reports) were excluded. The reasons for exclusion were; not randomised (69); wrong population (1); wrong intervention (43); or outcomes not relevant to this review (23).
Risk of bias in included studies
Risk of bias in individual studies is shown in Figure 2 and the summary risk of bias in included studies is shown in Figure 3. According to standard criteria (Appendix 2), studies generally had very serious limitations due to risks of bias in most evaluated domains leading to down‐grading of overall evidence quality.
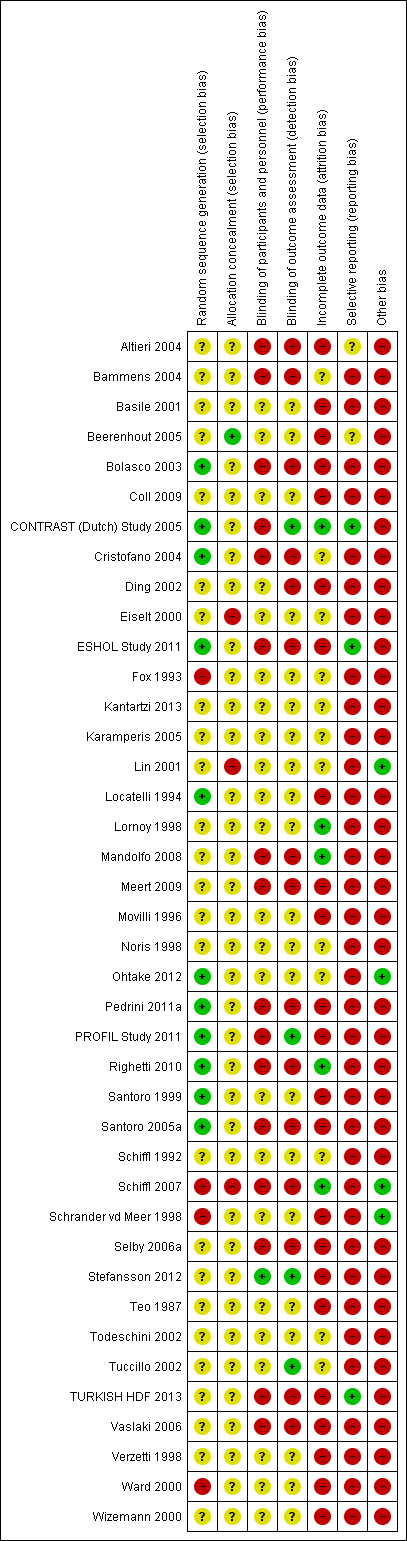
Risk of bias summary: review authors' judgements about each risk of bias item for each included study.

Risk of bias graph: review authors' judgements about each risk of bias item presented as percentages across all included studies.
Allocation
All studies stated that patients were randomly allocated to treatment groups. Sequence generation methods were at low risk of bias in 11 studies (Bolasco 2003; CONTRAST (Dutch) Study 2005; Cristofano 2004; ESHOL Study 2011; Locatelli 1994; Ohtake 2012; Pedrini 2011a; PROFIL Study 2011; Righetti 2010; Santoro 1999; Santoro 2005a), high risk in four studies (Fox 1993; Schiffl 2007; Schrander vd Meer 1998; Ward 2000), and unclear in the remainder.
Allocation concealment was at low risk of bias in one study (Beerenhout 2005), high risk in three studies (Eiselt 2000; Lin 2001; Schiffl 2007) and unclear in the remainder.
Blinding
Two studies reported blinding of participants (Karamperis 2005; Stefansson 2012) but not investigators for all outcomes and three (CONTRAST (Dutch) Study 2005; PROFIL Study 2011; Stefansson 2012) reported blinding of outcome assessment. In Tuccillo 2002, we considered that the lack of blinding will not influence the results. In Karamperis 2005, the authors did not blind the investigators but used electronic devices for assessing the outcomes.
Incomplete outcome data
A key risk of bias present in all but five studies (CONTRAST (Dutch) Study 2005; Lornoy 1998; Mandolfo 2008; Righetti 2010; Schiffl 2007) was the lack of complete outcome data for at least 90% of randomised patients and/or loss of patients to follow‐up was not similar between treatment groups for reasons unrelated to the outcomes of interest. Of the three largest studies contributing to the meta‐analyses, ESHOL Study 2011 did not include 39% of randomised patients in their analyses, and in the TURKISH HDF 2013, 21% of participants left the study for reasons other than death including 10% of the participants allocated to HDF due to vascular access problems. Twenty‐three studies were at high risk of incomplete follow‐up (Altieri 2004; Basile 2001; Beerenhout 2005; Bolasco 2003; Coll 2009; Ding 2002; ESHOL Study 2011; Locatelli 1994; Meert 2009; Movilli 1996; Pedrini 2011a; PROFIL Study 2011; Santoro 1999; Santoro 2005a; Schrander vd Meer 1998; Selby 2006a; Stefansson 2012; Teo 1987; TURKISH HDF 2013; Vaslaki 2006; Verzetti 1998; Ward 2000; Wizemann 2000) and the risk was unclear in the remainder.
Selective reporting
Three studies were at low risk of bias for selective outcome reporting (CONTRAST (Dutch) Study 2005; ESHOL Study 2011; TURKISH HDF 2013), in two studies it was unclear (Altieri 2004; Beerenhout 2005) and the remainder were at high risk.
Other potential sources of bias
Twenty‐one studies (52%) had a cross‐over design which was considered as a potential source of bias because of the carry over effect. All but four studies (Lin 2001; Ohtake 2012; Schiffl 2007; Schrander vd Meer 1998) were at high risk of other sources of bias including: commercial sponsor on authorship, or data management, or both; interventions or baseline participant characteristics or both were not matched; data not extractable for meta‐analysis; abstract‐only publication; or early termination of the study.
Effects of interventions
See: Summary of findings for the main comparison
Convective transport (haemofiltration/haemodiafiltration/acetate‐free biofiltration) versus haemodialysis
All‐cause and cardiovascular mortality
In eleven studies (3396 participants), convective dialysis treatment had no significant effect on all‐cause mortality compared to HD (Analysis 1.1 (11 studies, 3396 participants): RR 0.87, 95% CI 0.72 to 1.05; I2 = 34%). There was a moderate level heterogeneity between the studies.
Convective therapy significantly reduced death from cardiovascular causes compared with HD (Analysis 1.2 (6 studies, 2889 participants): RR 0.75, 95% CI 0.61 to 0.92; I2 = 0%). In absolute terms, convective therapy might prevent 25 cardiovascular deaths for every 1000 patients treated for one year, but has no significant effect on death overall.
Nonfatal cardiovascular events and hospitalisation
CONTRAST (Dutch) Study 2005 reported no significant effect on nonfatal cardiovascular events for convective dialysis versus HD (Analysis 1.3 (1 study, 714 participants): RR 1.14, 95% CI 0.86 to 1.50).
Locatelli 1994 reported no significant difference between convective therapy and HD for the number of hospitalisations/year (Analysis 1.4.1 (1 study, 45 participants): MD 0.20 hospitalisations/y, 95% CI ‐0.07 to 0.47).
There was no significant difference between convective therapy and HD for the number of days spent in hospital (Analysis 1.4.2 (2 studies, 67 participants): MD ‐1.22 days, 95% CI ‐7.47 to 5.03; I2 = 90%), and rate of hospitalisation (Analysis 1.5 (2 studies, 1688 participants): RR 1.23, 95% CI 0.93 to 1.63; I2 = 0%). Verzetti 1998 (cross‐over study) reported less hospitalisation in the convective therapy group compared to the HD group (data presented in Analysis 1.17.1). The substantial level of heterogeneity observed in the analysis of days spent in hospital might be possibly due to the 10 year difference in the date of publication of contributing studies.
Change in dialysis modality
The proportion of participants crossing over to another form of dialysis was not significantly different between treatment modalities (Analysis 1.6 (5 studies, 2919 participants): RR 0.87, 955 CI 0.41 to 1.84; I2 = 47%). There was a moderate level heterogeneity between the studies.
Blood pressure
ESHOL Study 2011 reported the number of hypotensive events/ person‐years of follow‐up; convective dialysis significantly reduced the rate of hypotension during dialysis (Analysis 1.7 (906 participants): RR 0.72, 95% CI 0.66 to 0.80). In two studies, the percentage of dialysis sessions complicated by hypotension was not significantly different (Analysis 1.8 (2 studies, 42 participants): MD ‐4.05%, 95% CI ‐15.39 to 7.30; I2 = 0%). Seven cross‐over studies reported data on number of patients experiencing hypotension, intradialytic hypotensive events or symptomatic intradialytic hypotensive events and reported uncertain effects of convective therapy (data presented in Analysis 1.17.2; Analysis 1.17.3; Analysis 1.17.4)
There was no significant difference between convective therapy and HD on predialysis systolic (Analysis 1.9.1 (7 studies, 1859 participants): MD 1.19 mm Hg, 95% CI ‐1.46 to 3.84; I2 = 44%) or diastolic blood pressure (Analysis 1.9.2 (6 studies, 1154 participants): MD ‐0.25 mm Hg, 95% CI ‐1.06 to 0.56; I2 = 0%). There was moderate heterogeneity between studies in treatment effects on predialysis systolic blood pressure.
Lin 2001 reported that the maximal drop in blood pressure during dialysis was significantly less with convection therapy compared to HD (Analysis 1.10 (1 study, 67 participants): MD ‐28.70 mm Hg, 95% CI ‐38.60 to ‐18.80).
In cross‐over studies convective therapy was not significantly different from HD for predialysis systolic, diastolic, and mean arterial blood pressure (Analysis 1.17,5; Analysis 1.17.6; Analysis 1.17.7). Similarly, in cross‐over studies, convective therapy was not significantly different from HD for postdialysis systolic blood pressure, diastolic blood pressure, fall in systolic blood pressure, and mean arterial blood pressure (Analysis 1.17.8; Analysis 1.17.9; Analysis 1.17.10; Analysis 1.17.11). There was no difference between before‐ and after‐dialysis systolic or diastolic blood pressure in cross‐over studies Analysis 1.17.12; Analysis 1.17.13). Blood pressure during dialysis was lower with convective therapy in one cross‐over study (Selby 2006a; Analysis 1.17.14; Analysis 1.17.15; Analysis 1.17.16).
Quality of life
Data for health‐related outcomes were reported in eight studies (988 participants) (Beerenhout 2005; CONTRAST (Dutch) Study 2005; Kantartzi 2013; Lin 2001; Schiffl 2007; Stefansson 2012; Verzetti 1998; Ward 2000) and described in Table 3. Of these, 50% (four studies) were a parallel group design (Beerenhout 2005; CONTRAST (Dutch) Study 2005; Lin 2001; Ward 2000). In the CONTRAST (Dutch) Study 2005, changes in quality of life scores for all domains assessed were not statistically different between the groups. Lin 2001 reported that participants treated with convective therapy had significantly higher end‐of‐treatment "patient well‐being" scores although results for tolerance and mental alertness were not reported (Analysis 1.11.6 (1 study, 67 patients): MD 0.60, 95% CI 0.30 to 0.90). In the study of Ward 2000, patients in both treatment groups had similar perceptions of quality of life. Patients showed a significant improvement in physical symptoms during the study, irrespective of treatment allocation. There was little or no effect on the quality of life dimensions assessed by the Kidney Diseases Questionnaire including fatigue, depression, relationships, frustration, and between‐dialysis patient well‐being score (Ward 2000; Analysis 1.11). Similarly, in Beerenhout 2005, physical symptoms improved from baseline in the convection group but no direct comparison in scores comparing convection with diffusion treatment was reported for physical scores and other domains (frustration, depression) did not change significantly. The remaining four studies were cross‐over design and disaggregated data for the end of the first phase of treatment were not available.
| Study ID | Comparison | Quality of Life scale used | Time of assessment | End of study result | Selective reporting of quality of life dimensions |
| HF versus HD | Kidney Disease Questionnaire | Before randomisation, at 6 months and at 1 year | No significant difference in scores in all five components of the scoring system between interventions | Yes | |
| HDF versus HD | Kidney Disease Quality of Life‐Short Form | Median follow‐up | There were no significant differences in changes in health‐related quality of life over time between groups (generic or kidney‐disease specific domains) | No | |
| HDF versus HD | SF‐36 | At 3 months | There were statistical significant differences in QoL for the total SF‐36 (36.1 (26.7 to 45.7) and 40.7 (30.2 to 62.8)), for classic low‐flux HD and high‐flux HDF, for bodily pain (45 (26.9 to 66.9) and 55 (35.6 to 87.5)), and No data were available for the end of the first phase of treatment | No | |
| HDF versus HD | Patient well‐being score | Once weekly for 15 months | Patients on HDF had significantly better scores ((physical well‐being score) MD 0.60, 95% CI 0.30 to 0.90). | No | |
| HDF versus HD | Kidney Disease | after 52 weeks | None of the other dimensions of the KDQ showed a change during the course of the study No data were available for the end of the first phase of treatment | Yes | |
| HDF versus HD | Physical functioning domain of IQOLA SF‐36 questionnaire | At day 60 | With the exception of a lower score for social functioning with HDF (P < 0.05), there was no significant difference in quality of life between HD and HDF No data were available for the end of the first phase of treatment | No | |
| AFB | Subjective well‐being | Monthly | Reported well‐being significantly higher in patients receiving AFB in multivariate analysis although unclear whether between‐groups comparison was reported No data were available for the end of the first phase of treatment | No | |
| HDF versus HD | Kidney Disease Questionnaire | At 6 months and 1 year | No significant difference in scores in all five components of the scoring system between interventions | No |
AFB ‐ acetate‐free biofiltration; HDF ‐ haemodiafiltration; HD ‐ haemodialysis; HF ‐ haemofiltration; SF‐36 ‐ Short‐Form Health Survey with 36 questions
Urea clearance and B2 microglobulin
Convective therapy increased Kt/V (Analysis 1.12 (14 studies, 2022 participants): MD 0.07, 95% CI ‐0.00 to 0.14; I2 = 90%) and URR (Analysis 1.13 (3 studies, 879 participants): SMD 0.39, 95% CI 0.06 to 0.72; I2 = 48%). There were moderate to high levels of heterogeneity between studies. Ten cross‐over studies reported heterogeneous treatment effects for convective therapy on predialysis Kt/V (Analysis 1.17.17). A single cross‐over study reported a higher URR with convective therapy (Analysis 1.17.18).
Convective therapy significantly lowered pre‐dialysis serum B2 microglobulin compared with diffusive therapies (Analysis 1.14 (12 studies, 1813 participants): MD ‐5.55 mg/L, 95% CI ‐9.11 to ‐1.98; I2 = 94%). Heterogeneity was significant across the studies. There was no significant difference between convective therapy and HD on end of treatment B2 microglobulin clearance (Analysis 1.15 (3 studies, 65 participants): MD 13.05 mg/L, 95% CI ‐5.94 to 32.04; I2 = 85%). Heterogeneity was high between the studies. Schiffl 1992 reported data for dialysate B2 microglobulin levels and found significantly higher dialysate B2 microglobulin concentrations in the dialysate with convection therapy (Analysis 1.16 (1 study, 20 patients): MD 133.00 mg/L, 95% CI 71.46 to 194.54). Four cross‐over studies (Kantartzi 2013; Pedrini 2011a; Righetti 2010; Stefansson 2012) reported lower levels of predialysis serum B2 microglobulin levels with convective therapy (Analysis 1.17.19).
Symptoms (headaches, nausea, vomiting) related to dialysis
Symptoms of headaches, nausea/vomiting were not reported in any of the included studies.
Amyloid‐related complications
Only Lin 2001 reported this outcome with respect to carpal tunnel syndrome. The authors reported that 8/38 participants in the convective treatment group had carpal tunnel syndrome compared with 3/29 patients in the HD group within 13 dialysis sessions after commencing the study. Details of the number of patients in each treatment arm with carpal tunnel syndrome at baseline were not provided. Considering the long duration needed to develop carpal tunnel syndrome, it is probable that at baseline there may have been more participants in the convective modality group with carpal tunnel syndrome. Due to this potential imbalance in participant characteristics, we did not analyse this outcome based on the results of this study.
Convective therapy versus convective therapy: haemofiltration versus haemodiafiltration
All‐cause and cardiovascular mortality
Bolasco 2003 reported no significant difference in all‐cause mortality between HF and HDF (Analysis 2.1 (1 study, 76 participants): RR 2.78, 95% CI 0.57 to 13.44).
Cardiovascular mortality was not reported in any of the included studies.
Hospitalisation
No data were available from the parallel RCTs.
Altieri 2004 reported no significant difference between HF and HDF for the number of days spent in hospital (Analysis 2.4.1).
Change in dialysis modality
Data for change in dialysis modality comparing HF with HDF were not available.
Blood pressure
No data were available from the parallel RCTs for hypotension.
Altieri 2004 reported no significant difference in the number of patients experiencing hypotension but the rate of hypotension episodes/patient/month was significantly lower with HF compared to HDF (Analysis 2.4.2).
Bolasco 2003 reported no significant difference between HF and HDF for systolic (Analysis 2.2.1 (1 study, 70 participants): MD ‐4.20 mm Hg, 95% CI ‐13.01 to 4.61) and diastolic blood pressure (Analysis 2.2.2 (1 study, 70 participants): MD ‐2.10 mm Hg, 95% CI ‐6.97 to 2.77). Altieri 2004 reported HDF lowered predialysis systolic blood pressure (Analysis 2.4.4) but had no significant effects on predialysis diastolic blood pressure (Analysis 2.4.5) and mean arterial pressure (Analysis 2.4.6). Similarly, Altieri 2004 also reported no significant differences between HF and HDF on postdialysis systolic (Analysis 2.4.7), diastolic (Analysis 2.4.8) and mean arterial pressure (Analysis 2.4.9).
Altieri 2004 reported no significant difference in the number of patients experiencing hypertension between HF and HDF (Analysis 2.4.10).
Quality of life
Data for quality of life comparing HF with HDF were not available from any of the included studies.
Urea clearance and B2 microglobulin
Bolasco 2003 reported a significantly higher Kt/V with HDF compared with HF (Analysis 2.3 (1 study, 58 participants): MD ‐0.24, 95% CI ‐0.33 to ‐0.15). Similarly, Altieri 2004 reported HDF resulted in a higher Kt/V compared to HF (Analysis 2.4.11).
No data were available from the parallel RCTs for B2 microglobulin. Altieri 2004 reported no significant difference between HDF and HF on predialysis B2 microglobulin levels (Analysis 2.4.12). Meert 2009 reported HF resulted in higher B2 microglobulin clearance compared to HDF (Analysis 2.4.13).
Symptoms (headaches, nausea, vomiting) related to dialysis
Altieri 2004 reported that patients tended to experience less headache on HF than HDF (P = 0.06) and that there was no significant differences for other intradialytic symptoms between convective therapies.
Convective therapy versus convective therapy: haemodiafiltration versus acetate‐free biofiltration
Data for outcomes comparing HDF with AFB were not reported in any parallel RCTs.
Mortality
Data for mortality comparing HDF with AFB were not reported.
Hospitalisation
Movilli 1996 reported no significant difference between HDF and AFB on number of hospitalisations and length of hospital stay (Analysis 3.1.1; Analysis 3.1.2).
Change in dialysis modality
Data for change in dialysis modality comparing HDF with AFB were not reported.
Blood pressure
Coll 2009 and Movilli 1996 reported data for this outcome with inconsistent findings between studies. Movilli 1996 reported no significant difference in number of dialysis sessions complicated by hypotension (Analysis 3.1.3), while Coll 2009 reported a significant reduction in hypotensive events in the AFB arm (Analysis 3.1.3).
Ding 2002 reported no significant difference between HDF and AFB on predialysis systolic blood pressure (Analysis 3.1.4) and mean arterial pressure (Analysis 3.1.5) and postdialysis systolic blood pressure (Analysis 3.1.6).
Quality of life
Ding 2002 reported no significant difference between HDF and AFB on interdialysis symptom score (Analysis 3.1.7).
Urea clearance and B2 microglobulin
Movilli 1996 reported no significant difference between HDF and AFB on Kt/V (Analysis 3.1.8). Ding 2002 reported no significant difference between HDF and AFB on URR (Analysis 3.1.9). Ding 2002 and Movilli 1996 both reported no significant difference between HDF and AFB on pre‐dialysis B2 microglobulin values (Analysis 3.1.10).
Symptoms (headaches, nausea, vomiting) related to dialysis
Movilli 1996 reported no significant difference between HDF and AFB on headache, nausea or vomiting (Analysis 3.1.11).
Bias from small‐study effects and sensitivity analysis
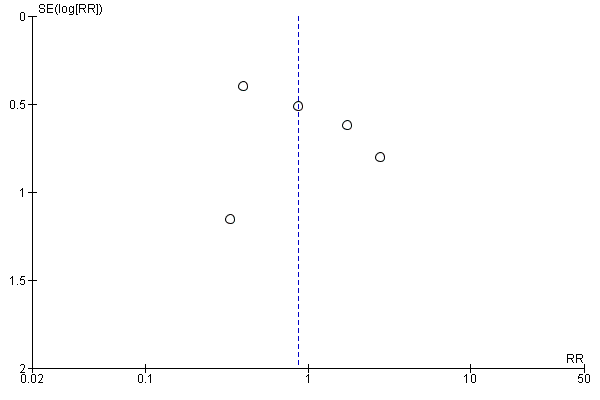
For the patient‐level outcomes with sufficient extractable data (all‐cause mortality, cardiovascular mortality and change in dialysis modality), there was no evidence of funnel plot asymmetry (Figure 4; Figure 5; Figure 6) suggestive of bias from small‐study effects.
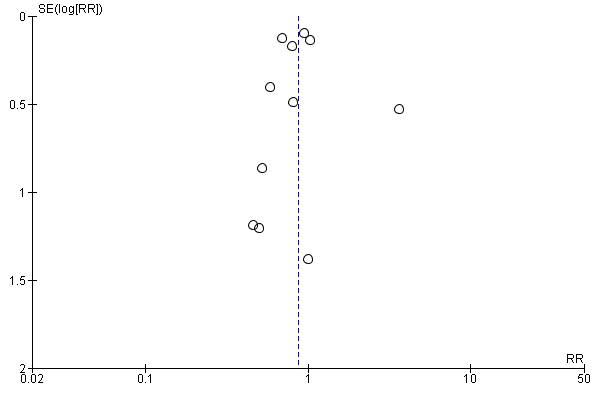
Funnel plot of comparison: 1 Convection (haemofiltration/HDF/acetate‐free biofiltration) versus haemodialysis, outcome: 1.1 All‐cause mortality.
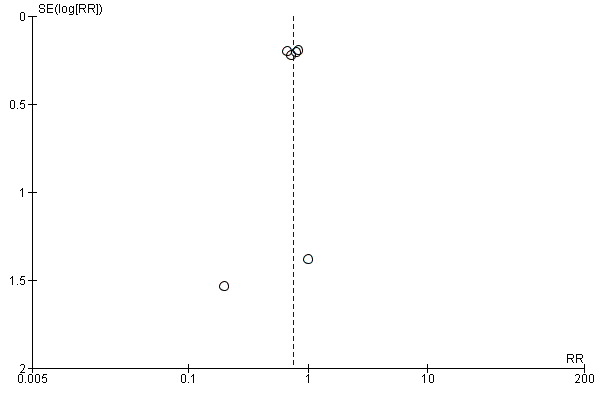
Funnel plot of comparison: 1 Convection (haemofiltration/haemodiafiltration/acetate‐free biofiltration) versus haemodialysis, outcome: 1.2 Cardiovascular mortality.
Funnel plot of comparison: 1 Convection (haemofiltration/HDF/acetate‐free biofiltration) versus haemodialysis, outcome: 1.6 Change of dialysis modality.
When analyses of convection versus diffusion modalities were limited to studies comparing HDF with HD, we found very similar treatment effects. Compared to HD, HDF had no significant effect on all‐cause mortality (7 studies, 2837 participants; RR 0.86, 95% CI 0.65 to 1.13) (Bolasco 2003; CONTRAST (Dutch) Study 2005; ESHOL Study 2011; Locatelli 1994; Schiffl 2007; TURKISH HDF 2013; Wizemann 2000) albeit with evidence of moderate heterogeneity (I2= 53%, P = 0.046) HDF reduced cardiovascular mortality (4 studies, 2512 participants; RR 0.72, 95% CI 0.57 to 0.91)(CONTRAST (Dutch) Study 2005; ESHOL Study 2011; Schiffl 2007; TURKISH HDF 2013), but not change in dialysis modality (4 studies, 2512 participants; RR 0.99, 95% CI 0.49 to 2.00) (CONTRAST (Dutch) Study 2005; ESHOL Study 2011; Bolasco 2003; TURKISH HDF 2013). Data for rates of nonfatal cardiovascular events, hospitalisation and hypotension during dialysis were already limited to studies comparing HDF with HD.
Discussion
Summary of main results
Thirty‐five studies in 4039 dialysis patients compared convective dialysis treatment (HDF, HF or AFB) with HD and six studies (174 participants) compared convective therapy directly with another convective therapy. Convective dialysis modalities had little or no effect on all‐cause mortality, may reduce cardiovascular death and hypotension during dialysis, but had uncertain effects on rates of nonfatal cardiovascular events and hospitalisation and serious limitations in study methodology markedly reduced our confidence in any treatment benefits of HDF. There was no difference in risks of changing dialysis modality between convective and diffusive modalities and treatment effects on clearances of urea and B2 microglobulin were markedly inconsistent between studies.
Overall completeness and applicability of evidence
First, while there were statistical reductions in cardiovascular mortality and rates of hypotension with HDF treatment, serious limitations in study methodologies reduced confidence in the conclusions that might be drawn from the available evidence for convective and diffusive dialysis modalities. Allocation concealment, blinding of outcome assessment, complete reporting of patient‐relevant outcomes and inclusion of patients in outcome analyses was inadequate in most studies, and therefore the evidence quality for clinical outcomes was downgraded to low or very low. Data for adverse events and quality of life were insufficient to draw clinically meaningful conclusions. Due to the limitations of existing data, the confidence in estimated effects of convective dialysis is low and the true effects of treatment might be substantially different from those summarized from existing studies.
Second, higher achieved convection volumes for HDF were associated with lower mortality in post‐hoc non‐randomised analyses within CONTRAST (Dutch) Study 2005, TURKISH HDF 2013, and ESHOL Study 2011. However, caution is needed before concluding this is evidence for the need to deliver high convection volumes to reduce all‐cause mortality with HDF. Convection volumes were not randomised treatment targets in any study (in other words, patients at randomisation were not equally likely to be assigned to specific convection volume targets) and as such the relationship observed between convection volume and mortality is also likely to be strongly confounded in important ways. Participants with insufficient vascular access and those with lower achieved blood flows (both known to be linked to poorer outcomes) would have been less likely to achieve higher convection volumes and those with longer treatment times would have been more likely to achieve convection targets. It is known that these specific patient and treatment characteristics independently predict mortality and may, as such, offer more viable and alternative explanations for the association between convection volume and risk of death.
Third, there was considerable heterogeneity in the dialysis interventions across studies including differences in flux, vascular access requirements, blood flows, and treatment times as well as convection volumes, resulting in uncertainty about which specific aspects of the convection process might be responsible for lower cardiovascular mortality. Future standardisation of therapy patterns might improve our understanding of the features of convective dialysis care that might lead to improved outcomes and patient acceptability.
Fourth, data for adverse events were sparse and no studies evaluated serious adverse events according to international definitions. Understanding hazards of treatment are essential to balancing desirable and undesirable outcomes when considering new therapies and questions about potential harms from convection therapy cannot be answered with confidence using the existing randomised study evidence.
Finally, the generalisability of the findings from RCTs to wider dialysis populations, including those in regions other than Europe might be limited. The absolute treatment benefits of convection on cardiovascular mortality might not be applicable to many dialysis patients, as data were frequently limited to participants who had vascular access sufficient to sustain high convection volumes.
Potential biases in the review process
The strengths of this review include the searching of conference proceedings and inclusions of additional unpublished data to provide a comprehensive analysis of all available evidence and the rigorous assessment of quality which has been incorporated into review conclusions using the methods of the GRADE guidelines. The limitations in this review are largely due to the reporting adequacy of the primary included studies.
Agreements and disagreements with other studies or reviews
This is an update of a review reported in 2006, which found insufficient evidence to provide robust recommendations for convective therapy to improve clinical outcomes for men and women who have ESKD (Rabindranath 2006). Despite the addition of 20 new studies including 3483 participants between 2006 and 2015, evidence for the benefits and harms of convective dialysis therapy remains low or very low quality.
The European Best Practice Guidelines on Haemodialysis (EBPG 2007) suggest on‐line HDF or HF should be considered to delay long‐term complications of dialysis therapy and that exchange volumes should be as high as possible. Current utilisation of HDF varies widely. Prevalence of HDF ranges between 0.3 and 232 per million of population within countries and regions of Europe (ERA‐EDTA Registry 2010) and the proportion of HDF as the treatment modality for patients in Australasia ranges between 0.8% and 23% (ANZDATA 2012). This review suggests the benefits of HDF or HF from contemporaneous RCTs are limited to reducing cardiovascular mortality and hypotension during dialysis and that evidence limitations lead to low confidence in these treatment benefits. None of the available studies randomised participants treated with HDF to different targeted convection volumes and accordingly robust evidence supportive of higher convection volumes to improve dialysis outcomes is not available.
This review draws similar conclusions to a recent systematic review and meta‐analysis that compared convective dialysis therapies (including high‐flux HD, HF, or HDF) with low‐flux HD alone (Susantitaphong 2013). In that review which included 36 parallel arm studies showed that convective therapies had little or no effect on all‐cause mortality (RR 0.88, 95% CI 0.76 to 1.02), and reduced risks of cardiovascular mortality (RR 0.84, 95% 0.71 to 0.98) and hypotension (RR 0.55, 95% CI 0.35 to 0.87). Unlike the present review, the quality of the available evidence was not incorporated into the review conclusions.
This review diverges from the conclusions of the largest HDF study to date (ESHOL Study 2011). This review finds no treatment effects of HDF in mortality, compared to a 30% relative reduction in risk of death from any causes during 36 months of follow‐up in the ESHOL Study 2011. We suggest that the consistent findings across all studies in the meta‐analysis for mortality in this review (variation in the estimates was not beyond that expected by chance) indicate the overall summary estimate is robust even accounting for the findings of the ESHOL Study 2011. Notably in that study, patients were withdrawn and not included in analyses if they did not receive the allocated treatment modality for two months or more, including those who did not achieve the minimum requested replacement volume (18L/session). As it is probable these participants might have had poorer outcomes (such as poorer vascular access due to other comorbidities including vascular disease or diabetes) and may have been preferentially excluded from follow‐up, the ESHOL Study 2011 might unreliably estimate mortality risk. It would be informative to re‐evaluate mortality data from ESHOL Study 2011 using intention‐to‐treat analyses that include mortality outcome data for all randomised patients according to their original treatment assignment.

Study flow diagram.

Risk of bias summary: review authors' judgements about each risk of bias item for each included study.
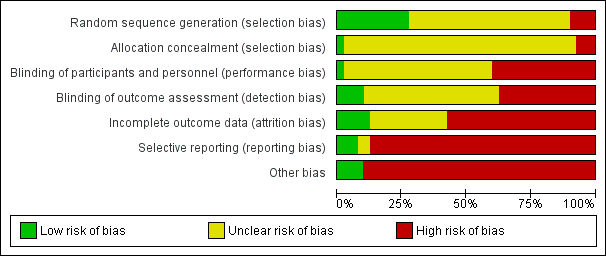
Risk of bias graph: review authors' judgements about each risk of bias item presented as percentages across all included studies.

Funnel plot of comparison: 1 Convection (haemofiltration/HDF/acetate‐free biofiltration) versus haemodialysis, outcome: 1.1 All‐cause mortality.

Funnel plot of comparison: 1 Convection (haemofiltration/haemodiafiltration/acetate‐free biofiltration) versus haemodialysis, outcome: 1.2 Cardiovascular mortality.

Funnel plot of comparison: 1 Convection (haemofiltration/HDF/acetate‐free biofiltration) versus haemodialysis, outcome: 1.6 Change of dialysis modality.

Comparison 1 Convection (haemofiltration/haemodiafiltration/acetate‐free biofiltration) versus haemodialysis, Outcome 1 All‐cause mortality.

Comparison 1 Convection (haemofiltration/haemodiafiltration/acetate‐free biofiltration) versus haemodialysis, Outcome 2 Cardiovascular mortality.
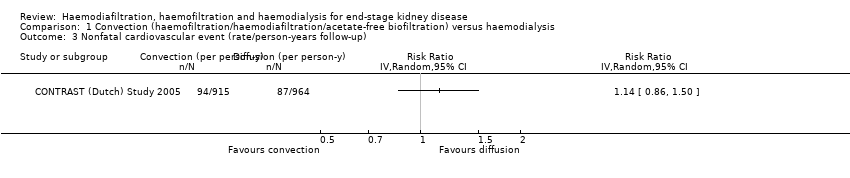
Comparison 1 Convection (haemofiltration/haemodiafiltration/acetate‐free biofiltration) versus haemodialysis, Outcome 3 Nonfatal cardiovascular event (rate/person‐years follow‐up).

Comparison 1 Convection (haemofiltration/haemodiafiltration/acetate‐free biofiltration) versus haemodialysis, Outcome 4 Hospitalisation.

Comparison 1 Convection (haemofiltration/haemodiafiltration/acetate‐free biofiltration) versus haemodialysis, Outcome 5 Hospitalisation (rate/person‐years follow‐up).
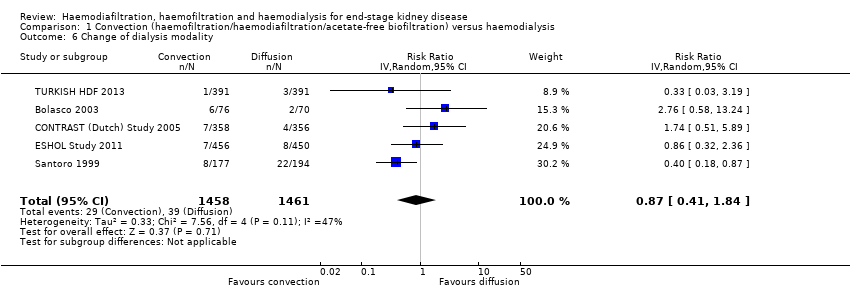
Comparison 1 Convection (haemofiltration/haemodiafiltration/acetate‐free biofiltration) versus haemodialysis, Outcome 6 Change of dialysis modality.
| Study | Treatment effect | No. of participants |
| ESHOL Study 2011 | In this study which reporting the number of hypotensive events/person‐years follow‐up, convective dialysis reduced the rate of hypotension during dialysis (906 participants: RR 0.72, 95% CI 0.66 to 0.80) | 906 |
Comparison 1 Convection (haemofiltration/haemodiafiltration/acetate‐free biofiltration) versus haemodialysis, Outcome 7 Hypotension during dialysis (rate/person‐years follow‐up).

Comparison 1 Convection (haemofiltration/haemodiafiltration/acetate‐free biofiltration) versus haemodialysis, Outcome 8 Dialysis sessions with hypotension.

Comparison 1 Convection (haemofiltration/haemodiafiltration/acetate‐free biofiltration) versus haemodialysis, Outcome 9 Predialysis blood pressure.
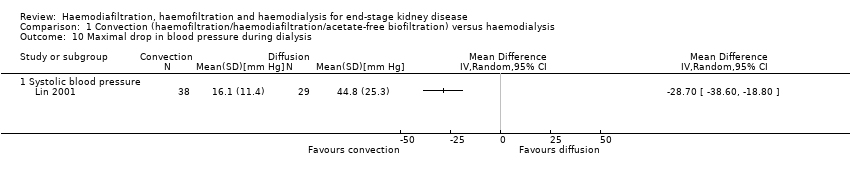
Comparison 1 Convection (haemofiltration/haemodiafiltration/acetate‐free biofiltration) versus haemodialysis, Outcome 10 Maximal drop in blood pressure during dialysis.

Comparison 1 Convection (haemofiltration/haemodiafiltration/acetate‐free biofiltration) versus haemodialysis, Outcome 11 Kidney diseases questionnaire and well‐being scores.

Comparison 1 Convection (haemofiltration/haemodiafiltration/acetate‐free biofiltration) versus haemodialysis, Outcome 12 Kt/V.

Comparison 1 Convection (haemofiltration/haemodiafiltration/acetate‐free biofiltration) versus haemodialysis, Outcome 13 Urea reduction ratio.

Comparison 1 Convection (haemofiltration/haemodiafiltration/acetate‐free biofiltration) versus haemodialysis, Outcome 14 Predialysis serum B2 microglobulin.

Comparison 1 Convection (haemofiltration/haemodiafiltration/acetate‐free biofiltration) versus haemodialysis, Outcome 15 B2 microglobulin clearance.
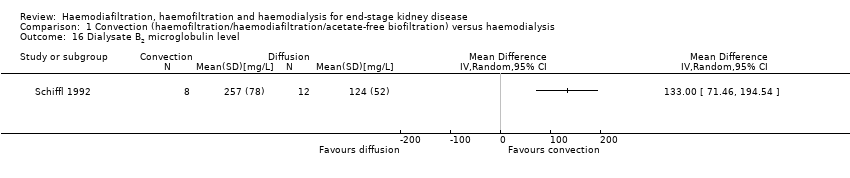
Comparison 1 Convection (haemofiltration/haemodiafiltration/acetate‐free biofiltration) versus haemodialysis, Outcome 16 Dialysate B2 microglobulin level.
| Study | Convective therapy | Diffusive therapy | P value from paper |
| Hospitalisation | |||
| Verzetti 1998 | 8 | 17 | Not reported |
| Patients experiencing hypotension | |||
| Fox 1993 | 1/9 | 0/9 | Not reported |
| Karamperis 2005 | 0/12 | 0/12 | Not significant |
| Pedrini 2011a | 2/62 | 5/62 | Not reported |
| Teo 1987 | 0/10 | 0/10 | Not reported |
| Intradialytic hypotensive events | |||
| Selby 2006a | 23 | 37 | Not significant |
| Stefansson 2012 | 32 dialysis sessions with hypotension from a total of 520 sessions | 28 dialysis sessions with hypotension from a total of 520 sessions | Not significant |
| Symptomatic intradialytic hypotensive events | |||
| Selby 2006a | 2 | 2 | Not significant |
| Predialysis systolic blood pressure (mm Hg) | |||
| Karamperis 2005 | 12 patients | 12 patients | Not significant |
| Noris 1998 | 5 patients | 5 patients | P > 0.05 |
| Pedrini 2011a | 62 patients | 62 patients | P = 0.014 |
| Stefansson 2012 | 20 patients | 20 patients | Not reported |
| Todeschini 2002 | 9 patients | 9 patients | P > 0.05 |
| Predialysis diastolic blood pressure (mm Hg) | |||
| Karamperis 2005 | 12 patients | 12 patients | Not significant |
| Noris 1998 | 5 patients | 5 patients | P > 0.05 |
| Pedrini 2011a | 62 patients | 62 patients | P = 0.05 |
| Stefansson 2012 | 20 patients | 20 patients | Not reported |
| Todeschini 2002 | 9 patients | 9 | P > 0.05 |
| Predialysis mean arterial pressure (mm Hg) | |||
| Karamperis 2005 | 12 patients | 12 patients | Not significant |
| Teo 1987 | 10 patients | 10 patients | "Statistically insignificant" |
| Postdialysis systolic blood pressure (mm Hg) | |||
| Karamperis 2005 | 12 patients | 12 patients | Not significant |
| Noris 1998 | 5 patients | 5 patients | P > 0.05 |
| Pedrini 2011a | 62 patients | 62 patients | "not differ significantly" |
| Stefansson 2012 | 20 patients | 20 patients | Not reported |
| Todeschini 2002 | 9 patients | 9 patients | P > 0.05 |
| Postdialysis diastolic blood pressure (mm Hg) | |||
| Karamperis 2005 | 12 patients | 12 patients | Not significant |
| Pedrini 2011a | 62 patients | 62 patients | "not differ significantly" |
| Stefansson 2012 | 20 patients | 20 patients | Not reported |
| Postdialysis fall in systolic blood pressure (mm Hg) | |||
| Todeschini 2002 | 9 patients | 9 patients | P > 0.05 |
| Postdialysis mean arterial pressure (mm Hg) | |||
| Karamperis 2005 | 12 patients | 12 patients | Not significant |
| Teo 1987 | 10 patients | 10 patients | "Statistically insignificant" |
| Difference between pre‐ and postdialysis systolic blood pressure (mm Hg) | |||
| Noris 1998 | 5 patients | 5 patients | P > 0.05 |
| Difference between pre‐ and postdialysis diastolic blood pressure (mm Hg) | |||
| Noris 1998 | 5 patients | 5 patients | P > 0.05 |
| Todeschini 2002 | 9 patients | 9 patients | P > 0.05 |
| Intradialysis mean systolic blood pressure (mm Hg) | |||
| Selby 2006a | 12 patients | 12 patients | P < 0.0001 |
| Intradialysis mean diastolic blood pressure (mm Hg) | |||
| Selby 2006a | 12 patients | 12 patients | P = 0.005 |
| Intradialysis mean arterial pressure (mm Hg) | |||
| Selby 2006a | 12 patients | 12 patients | P < 0.0001 |
| Teo 1987 | 10 patients | 10 patients | "statistically insignificant decrease" |
| Kt/V | |||
| Basile 2001 | 10 patients | 10 patients | No significant difference |
| Kantartzi 2013 | 48 patients | 48 patients | P = 0.33 |
| Karamperis 2005 | 12 patients | 12 patients | No significant difference |
| Noris 1998 | 5 patients | 5 patients | P > 0.05 |
| Pedrini 2011a | 62 patients Mean (± SE): 1.60 (0.31) | 62 patients Mean (± SE): 1.44 (0.26) | P < 0.0001 |
| Righetti 2010 | 24 patients | 24 patients | P < 0.01 |
| Selby 2006a | 12 patients Mean (± SE): 1.37 (0.28) | 12 patients Mean (± SE): 1.38 (0.32) | P = 0.91 |
| Stefansson 2012 | 20 patients | 20 patients | Not reported |
| Todeschini 2002 | 9 patients | 9 patients | P > 0.05 |
| Tuccillo 2002 | 12 patients | 12 patients | P > 0.05 |
| Urea reduction ratio | |||
| Righetti 2010 | 24 patients | 24 patients | P < 0.01 |
| Predialysis serum B2 microglobulin level (mg/L) | |||
| Kantartzi 2013 | 48 patients | 48 patients | P < 0.01 |
| Pedrini 2011a | 62 patients | 62 patients | P < 0.0001 |
| Righetti 2010 | 24 patients | 24 patients | P < 0.01 |
| Stefansson 2012 | 20 patients | 20 patients | Not reported |
Comparison 1 Convection (haemofiltration/haemodiafiltration/acetate‐free biofiltration) versus haemodialysis, Outcome 17 Data from cross‐over studies.

Comparison 2 Convection versus convection (haemofiltration versus haemodiafiltration), Outcome 1 All‐cause mortality.

Comparison 2 Convection versus convection (haemofiltration versus haemodiafiltration), Outcome 2 Predialysis blood pressure.

Comparison 2 Convection versus convection (haemofiltration versus haemodiafiltration), Outcome 3 Kt/V.
| Study | Haemodiafiltraton | Haemofiltration | P value from paper |
| Days spent in hospital | |||
| Altieri 2004 | 30 patients | 30 patients | Not significant |
| Average number of episodes of hypotension/patient/month | |||
| Altieri 2004 | 30 patients | 30 patients | P = 0.0169 |
| Number of patients experiencing hypotension | |||
| Altieri 2004 | 2/30 | 0/30 | P > 0.05 |
| Predialysis systolic blood pressure (mm Hg) | |||
| Altieri 2004 | 30 patients | 30 patients | P = 0.044 |
| Predialysis diastolic blood pressure (mm Hg) | |||
| Altieri 2004 | 30 patients | 30 patients | P > 0.05 |
| Predialysis mean arterial pressure (mm Hg) | |||
| Altieri 2004 | 30 patients | 30 patients | P > 0.05 |
| Postdialysis systolic blood pressure (mm Hg) | |||
| Altieri 2004 | 30 patients | 30 patients | P > 0.05 |
| Postdialysis diastolic blood pressure (mm Hg) | |||
| Altieri 2004 | 30 patients | 30 patients Mean (± SD): 74.5 (7.9) | P > 0.05 |
| Postdialysis mean arterial blood pressure (mm Hg) | |||
| Altieri 2004 | 30 patients | 30 patients | P > 0.05 |
| Number of patients experiencing hypertension | |||
| Altieri 2004 | 6/30 | 7/30 | P > 0.05 |
| Kt/V | |||
| Altieri 2004 | 30 patients | 30 patients | P < 0.001 |
| Predialysis serum B2 microglobulin (mg/L) | |||
| Altieri 2004 | 30 patients | 30 patients | Not significant |
| B2 microglobulin clearance (mL/min) | |||
| Meert 2009 | 14 patients | 14 patients | P < 0.017 |
Comparison 2 Convection versus convection (haemofiltration versus haemodiafiltration), Outcome 4 Data from cross‐over studies.
| Study | Haemodiafiltration | Acid‐free biofiltration | P value from paper |
| Number of hospitalisations/patient during observation period | |||
| Movilli 1996 | 12 patients | 12 patients | Not significant |
| Length of hospitalisation stay/patient (days/patient) | |||
| Movilli 1996 | 12 patients | 12 patients | Not significant |
| Number of dialysis sessions with hypotension | |||
| Coll 2009 | 21 patients 7/545 sessions | 21 patients 46/545 sessions | "On‐line HDF was associated with fewer hypotensive episodes than treatment with on‐line HDF without acetate (P=0.019)" |
| Movilli 1996 | 12 patients | 12 patients | Not significant |
| Predialysis systolic blood pressure (mm Hg) | |||
| Ding 2002 | 9 patients | 9 patients | Not significant |
| Predialysis mean arterial pressure (mm Hg) | |||
| Ding 2002 | 9 patients | 9 patients | Not reported |
| Postdialysis systolic blood pressure (mm Hg) | |||
| Ding 2002 | 9 patients | 9 patients | Not significant |
| Interdialysis symptom score | |||
| Ding 2002 | 9 patients | 9 patients | Not significant |
| Kt/V | |||
| Movilli 1996 | 12 patients | 12 patients | Not significant |
| Urea reduction ratio | |||
| Ding 2002 | 9 patients | 9 patients | Not significant |
| Predialysis B2 microglobulin (mg/L) | |||
| Coll 2009 | 21 patients Mean (± SD): 27.7 (7.2) | 21 patients Mean (± SD): 27.4 (6.7) | Not significant |
| Ding 2002 | 9 patients | 9 patients | Not significant |
| Number of dialysis sessions with side effects (nausea, vomiting, headaches) | |||
| Movilli 1996 | 12 patients | 12 patients | Not significant |
Comparison 3 Convection versus convection (haemodiafiltration versus acetate‐free biofiltration), Outcome 1 Data from cross‐over studies.
| Convective compared with diffusive dialysis modalities for men and women with end‐stage kidney disease | ||||||
| Patient or population: men and women with end‐stage kidney disease Intervention: convective dialysis Comparison: diffusive dialysis | ||||||
| Outcomes | Illustrative comparative risks* (95% CI) | Relative effect | No of participants | Quality of the evidence | Comments | |
| Assumed risk | Corresponding risk | |||||
| Diffusion | Convection | |||||
| All‐cause mortality | 200 per 1000 | Not significant | RR 0.87 (0.72 to 1.05) | 11 (3396) | ⊕⊕⊝⊝ | Convective therapy has little or no effect on all‐cause mortality |
| Cardiovascular mortality | 100 per 1000 | 75 per 1000 | RR 0.75 (0.81 to 0.92) | 6 (2889) | ⊕⊕⊝⊝ | Convective therapy may reduce cardiovascular mortality |
| Nonfatal cardiovascular events | 130 per 1000 | Not significant | RR 1.23 (0.93‐1.63) | 2 (1688) | ⊕⊝⊝⊝ | Convective therapy has uncertain effects on non‐fatal cardiovascular events |
| Health‐related quality of life | Not estimable | Not estimable | Not estimable | 8 (988) | ⊕⊕⊝⊝ | Convective therapy has uncertain effects on health‐related quality of life |
| *The assumed risk (e.g. the median control group risk across studies) is derived from data within dialysis registries for all‐cause mortality and cardiovascular mortality and the reported event rate in the available study for nonfatal cardiovascular events (CONTRAST (Dutch) Study 2005). The corresponding risk (and its 95% confidence interval) is based on the assumed risk in the comparison group and the relative effect of the intervention (and its 95% CI). CI: Confidence interval; RR: Risk Ratio | ||||||
| GRADE (Grading of Recommendations Assessment, Development, and Evaluation) Working Group grades of evidence (Guyatt 2011). | ||||||
| Study ID | Intervention | Duration | Number of patients |
| HDF versus HF | 12 months | 39 | |
| HDF versus HD | 2 weeks | 14 | |
| AFB versus HD | 12 months | 11 | |
| HF versus HD | 12 months | 40 | |
| HF versus HDF versus HD | 18 months | 146 | |
| AFB versus HDF | 15 months | 30 | |
| HDF versus HD | 36 months | 714 | |
| HDF versus HD | 1 session | 12 | |
| HDF versus AFB | 36 weeks | 12 | |
| AFB versus HD | 12 months | 20 | |
| HDF versus HD | 36 months | 906 | |
| HF versus HD | 1 session | 9 | |
| HDF versus HD | 3 months | 24 | |
| HDF versus HD | 2 sessions | 12 | |
| HDF versus HD | 15 months | 67 | |
| HDF versus HD | 24 months | 205 | |
| HDF versus HD | 1 session | 8 | |
| HDF versus HD | 6 weeks | 8 | |
| HDF versus HF | 9 weeks | 14 | |
| HDF versus AFB | 6 months | 12 | |
| AFB versus HD | 1 week | 5 | |
| HDF versus HD | 12 months | 22 | |
| HDF versus HD | 12 months | 69 | |
| HF versus HD | 24 months | 48 | |
| HDF versus HD | 18 months | 24 | |
| AFB versus HD | 48 months | 371 | |
| HF versus HD | 36 months | 64 | |
| HF versus HD | 48 months | 32 | |
| HDF versus HD | 48 months | 76 | |
| AFB versus HD | 12 months | 24 | |
| AFB versus HD | 4 weeks | 12 | |
| HDF versus HD | 4 months | 20 | |
| HDF versus HD | 8 months | 13 | |
| AFB versus HD | 3 sessions | 9 | |
| HDF versus HD | 3 months | 12 | |
| HDF versus HD | 24 months | 782 | |
| HDF versus HD | 48 weeks | 129 | |
| AFB versus HD | 12 months | 41 | |
| HDF versus HD | 12 months | 50 | |
| HDF versus HD | 24 months | 44 | |
| AFB ‐ acetate‐free biofiltration; HDF ‐ haemodiafiltration; HD ‐ haemodialysis; HF ‐ haemofiltration | |||
| Categories of intervention | Study | Total number of studies | Total number of patients |
| HDF versus HD | Bammens 2004; Lin 2001; Locatelli 1994; Lornoy 1998; Teo 1987; Tuccillo 2002; Ward 2000; Wizemann 2000; Bolasco 2003; CONTRAST (Dutch) Study 2005; Cristofano 2004; Karamperis 2005; Mandolfo 2008; Pedrini 2011a; Righetti 2010; Schiffl 2007; Stefansson 2012; TURKISH HDF 2013; Vaslaki 2006ESHOL Study 2011; Kantartzi 2013; Ohtake 2012 | 22 | 3299 |
| HF versus HD | Beerenhout 2005; Fox 1993; Schiffl 1992; Bolasco 2003; Santoro 2005a; PROFIL Study 2011 | 6 | 325 |
| AFB versus HD | Basile 2001; Santoro 1999; Eiselt 2000; Noris 1998; Schrander vd Meer 1998; Selby 2006a; Todeschini 2002; Verzetti 1998 | 8 | 487 |
| HDF versus AFB | 3 | 59 | |
| HDF versus HF | 3 | 199 | |
| More than two treatment arms | 3 | 383 | |
| AFB ‐ acetate‐free biofiltration; HDF ‐ haemodiafiltration; HD ‐ haemodialysis; HF ‐ haemofiltration | |||
| Study ID | Comparison | Quality of Life scale used | Time of assessment | End of study result | Selective reporting of quality of life dimensions |
| HF versus HD | Kidney Disease Questionnaire | Before randomisation, at 6 months and at 1 year | No significant difference in scores in all five components of the scoring system between interventions | Yes | |
| HDF versus HD | Kidney Disease Quality of Life‐Short Form | Median follow‐up | There were no significant differences in changes in health‐related quality of life over time between groups (generic or kidney‐disease specific domains) | No | |
| HDF versus HD | SF‐36 | At 3 months | There were statistical significant differences in QoL for the total SF‐36 (36.1 (26.7 to 45.7) and 40.7 (30.2 to 62.8)), for classic low‐flux HD and high‐flux HDF, for bodily pain (45 (26.9 to 66.9) and 55 (35.6 to 87.5)), and No data were available for the end of the first phase of treatment | No | |
| HDF versus HD | Patient well‐being score | Once weekly for 15 months | Patients on HDF had significantly better scores ((physical well‐being score) MD 0.60, 95% CI 0.30 to 0.90). | No | |
| HDF versus HD | Kidney Disease | after 52 weeks | None of the other dimensions of the KDQ showed a change during the course of the study No data were available for the end of the first phase of treatment | Yes | |
| HDF versus HD | Physical functioning domain of IQOLA SF‐36 questionnaire | At day 60 | With the exception of a lower score for social functioning with HDF (P < 0.05), there was no significant difference in quality of life between HD and HDF No data were available for the end of the first phase of treatment | No | |
| AFB | Subjective well‐being | Monthly | Reported well‐being significantly higher in patients receiving AFB in multivariate analysis although unclear whether between‐groups comparison was reported No data were available for the end of the first phase of treatment | No | |
| HDF versus HD | Kidney Disease Questionnaire | At 6 months and 1 year | No significant difference in scores in all five components of the scoring system between interventions | No | |
| AFB ‐ acetate‐free biofiltration; HDF ‐ haemodiafiltration; HD ‐ haemodialysis; HF ‐ haemofiltration; SF‐36 ‐ Short‐Form Health Survey with 36 questions | |||||
| Outcome or subgroup title | No. of studies | No. of participants | Statistical method | Effect size |
| 1 All‐cause mortality Show forest plot | 11 | 3396 | Risk Ratio (IV, Random, 95% CI) | 0.87 [0.72, 1.05] |
| 2 Cardiovascular mortality Show forest plot | 6 | 2889 | Risk Ratio (IV, Random, 95% CI) | 0.75 [0.61, 0.92] |
| 3 Nonfatal cardiovascular event (rate/person‐years follow‐up) Show forest plot | 1 | Risk Ratio (IV, Random, 95% CI) | Totals not selected | |
| 4 Hospitalisation Show forest plot | 2 | Mean Difference (IV, Random, 95% CI) | Subtotals only | |
| 4.1 Hospital admissions/year | 1 | 45 | Mean Difference (IV, Random, 95% CI) | 0.20 [‐0.07, 0.47] |
| 4.2 Days spent in hospital | 2 | 67 | Mean Difference (IV, Random, 95% CI) | ‐1.22 [‐7.47, 5.03] |
| 5 Hospitalisation (rate/person‐years follow‐up) Show forest plot | 2 | 400 | Risk Ratio (IV, Random, 95% CI) | 1.23 [0.93, 1.63] |
| 6 Change of dialysis modality Show forest plot | 5 | 2919 | Risk Ratio (IV, Random, 95% CI) | 0.87 [0.41, 1.84] |
| 7 Hypotension during dialysis (rate/person‐years follow‐up) Show forest plot | Other data | No numeric data | ||
| 8 Dialysis sessions with hypotension Show forest plot | 2 | 42 | Mean Difference (IV, Random, 95% CI) | ‐4.05 [‐15.39, 7.30] |
| 9 Predialysis blood pressure Show forest plot | 7 | Mean Difference (IV, Random, 95% CI) | Subtotals only | |
| 9.1 Systolic blood pressure | 7 | 1859 | Mean Difference (IV, Random, 95% CI) | 1.19 [‐1.46, 3.84] |
| 9.2 Diastolic blood pressure | 6 | 1154 | Mean Difference (IV, Random, 95% CI) | ‐0.25 [‐1.06, 0.56] |
| 10 Maximal drop in blood pressure during dialysis Show forest plot | 1 | Mean Difference (IV, Random, 95% CI) | Totals not selected | |
| 10.1 Systolic blood pressure | 1 | Mean Difference (IV, Random, 95% CI) | 0.0 [0.0, 0.0] | |
| 11 Kidney diseases questionnaire and well‐being scores Show forest plot | 3 | Mean Difference (IV, Random, 95% CI) | Subtotals only | |
| 11.1 Inter‐dialysis patient well‐being score | 1 | 67 | Mean Difference (IV, Random, 95% CI) | 0.60 [0.30, 0.90] |
| 11.2 Physical symptoms | 2 | 121 | Mean Difference (IV, Random, 95% CI) | ‐0.54 [‐1.52, 0.44] |
| 11.3 Fatigue | 1 | 45 | Mean Difference (IV, Random, 95% CI) | 0.0 [‐0.98, 0.98] |
| 11.4 Depression | 1 | 45 | Mean Difference (IV, Random, 95% CI) | 0.20 [‐0.50, 0.90] |
| 11.5 Relationships | 1 | 45 | Mean Difference (IV, Random, 95% CI) | 0.10 [‐0.73, 0.93] |
| 11.6 Frustration | 1 | 45 | Mean Difference (IV, Random, 95% CI) | ‐0.20 [‐1.61, 1.21] |
| 12 Kt/V Show forest plot | 14 | 2022 | Mean Difference (IV, Random, 95% CI) | 0.07 [‐0.00, 0.14] |
| 13 Urea reduction ratio Show forest plot | 3 | 879 | Std. Mean Difference (IV, Random, 95% CI) | 0.39 [0.06, 0.72] |
| 14 Predialysis serum B2 microglobulin Show forest plot | 12 | 1813 | Mean Difference (IV, Random, 95% CI) | ‐5.55 [‐9.11, ‐1.98] |
| 15 B2 microglobulin clearance Show forest plot | 3 | 65 | Mean Difference (IV, Random, 95% CI) | 13.05 [‐5.94, 32.04] |
| 16 Dialysate B2 microglobulin level Show forest plot | 1 | Mean Difference (IV, Random, 95% CI) | Totals not selected | |
| 17 Data from cross‐over studies Show forest plot | Other data | No numeric data | ||
| 17.1 Hospitalisation | Other data | No numeric data | ||
| 17.2 Patients experiencing hypotension | Other data | No numeric data | ||
| 17.3 Intradialytic hypotensive events | Other data | No numeric data | ||
| 17.4 Symptomatic intradialytic hypotensive events | Other data | No numeric data | ||
| 17.5 Predialysis systolic blood pressure (mm Hg) | Other data | No numeric data | ||
| 17.6 Predialysis diastolic blood pressure (mm Hg) | Other data | No numeric data | ||
| 17.7 Predialysis mean arterial pressure (mm Hg) | Other data | No numeric data | ||
| 17.8 Postdialysis systolic blood pressure (mm Hg) | Other data | No numeric data | ||
| 17.9 Postdialysis diastolic blood pressure (mm Hg) | Other data | No numeric data | ||
| 17.10 Postdialysis fall in systolic blood pressure (mm Hg) | Other data | No numeric data | ||
| 17.11 Postdialysis mean arterial pressure (mm Hg) | Other data | No numeric data | ||
| 17.12 Difference between pre‐ and postdialysis systolic blood pressure (mm Hg) | Other data | No numeric data | ||
| 17.13 Difference between pre‐ and postdialysis diastolic blood pressure (mm Hg) | Other data | No numeric data | ||
| 17.14 Intradialysis mean systolic blood pressure (mm Hg) | Other data | No numeric data | ||
| 17.15 Intradialysis mean diastolic blood pressure (mm Hg) | Other data | No numeric data | ||
| 17.16 Intradialysis mean arterial pressure (mm Hg) | Other data | No numeric data | ||
| 17.17 Kt/V | Other data | No numeric data | ||
| 17.18 Urea reduction ratio | Other data | No numeric data | ||
| 17.19 Predialysis serum B2 microglobulin level (mg/L) | Other data | No numeric data | ||
| Outcome or subgroup title | No. of studies | No. of participants | Statistical method | Effect size |
| 1 All‐cause mortality Show forest plot | 1 | Risk Ratio (M‐H, Random, 95% CI) | Totals not selected | |
| 2 Predialysis blood pressure Show forest plot | 1 | Mean Difference (IV, Random, 95% CI) | Totals not selected | |
| 2.1 Systolic blood pressure | 1 | Mean Difference (IV, Random, 95% CI) | 0.0 [0.0, 0.0] | |
| 2.2 Diastolic blood pressure | 1 | Mean Difference (IV, Random, 95% CI) | 0.0 [0.0, 0.0] | |
| 3 Kt/V Show forest plot | 1 | Mean Difference (IV, Random, 95% CI) | Totals not selected | |
| 4 Data from cross‐over studies Show forest plot | Other data | No numeric data | ||
| 4.1 Days spent in hospital | Other data | No numeric data | ||
| 4.2 Average number of episodes of hypotension/patient/month | Other data | No numeric data | ||
| 4.3 Number of patients experiencing hypotension | Other data | No numeric data | ||
| 4.4 Predialysis systolic blood pressure (mm Hg) | Other data | No numeric data | ||
| 4.5 Predialysis diastolic blood pressure (mm Hg) | Other data | No numeric data | ||
| 4.6 Predialysis mean arterial pressure (mm Hg) | Other data | No numeric data | ||
| 4.7 Postdialysis systolic blood pressure (mm Hg) | Other data | No numeric data | ||
| 4.8 Postdialysis diastolic blood pressure (mm Hg) | Other data | No numeric data | ||
| 4.9 Postdialysis mean arterial blood pressure (mm Hg) | Other data | No numeric data | ||
| 4.10 Number of patients experiencing hypertension | Other data | No numeric data | ||
| 4.11 Kt/V | Other data | No numeric data | ||
| 4.12 Predialysis serum B2 microglobulin (mg/L) | Other data | No numeric data | ||
| 4.13 B2 microglobulin clearance (mL/min) | Other data | No numeric data | ||
| Outcome or subgroup title | No. of studies | No. of participants | Statistical method | Effect size |
| 1 Data from cross‐over studies Show forest plot | Other data | No numeric data | ||
| 1.1 Number of hospitalisations/patient during observation period | Other data | No numeric data | ||
| 1.2 Length of hospitalisation stay/patient (days/patient) | Other data | No numeric data | ||
| 1.3 Number of dialysis sessions with hypotension | Other data | No numeric data | ||
| 1.4 Predialysis systolic blood pressure (mm Hg) | Other data | No numeric data | ||
| 1.5 Predialysis mean arterial pressure (mm Hg) | Other data | No numeric data | ||
| 1.6 Postdialysis systolic blood pressure (mm Hg) | Other data | No numeric data | ||
| 1.7 Interdialysis symptom score | Other data | No numeric data | ||
| 1.8 Kt/V | Other data | No numeric data | ||
| 1.9 Urea reduction ratio | Other data | No numeric data | ||
| 1.10 Predialysis B2 microglobulin (mg/L) | Other data | No numeric data | ||
| 1.11 Number of dialysis sessions with side effects (nausea, vomiting, headaches) | Other data | No numeric data | ||