Calcimiméticos para el hiperparatiroidismo secundario en pacientes con nefropatías crónicas
Información
- DOI:
- https://doi.org/10.1002/14651858.CD006254.pub2Copiar DOI

- Base de datos:
-
- Cochrane Database of Systematic Reviews
- Versión publicada:
-
- 09 diciembre 2014see what's new
- Tipo:
-
- Intervention
- Etapa:
-
- Review
- Grupo Editorial Cochrane:
-
Grupo Cochrane de Riñón y trasplante
- Copyright:
-
- Copyright © 2014 The Cochrane Collaboration. Published by John Wiley & Sons, Ltd.
Cifras del artículo
Altmetric:
Citado por:
Autores
Contributions of authors
-
Angela Ballinger: search screening, data extraction and analysis and input into writing of the review
-
Suetonia Palmer: design, conduct, data extraction and analysis, primary drafting and revisions of the review
-
Ionut Nistor: search screening, data extraction and analysis and input into writing of the review
-
Jonathan Craig: design, data analysis, writing the review
-
Giovanni Strippoli: design, conduct, data‐extraction and analysis, writing the review.
Sources of support
Internal sources
-
Cochrane Renal Group, Australia.
External sources
-
Suetonia Palmer receives a Fellowship from the Consorzio Mario Negri Sud from an unrestricted grant from Amgen Dompe, Italy.
-
Angela Ballinger completed this review as a University of Otago summer studentship project 2012/2013 supported by the Canterbury Medical Research Foundation, New Zealand.
-
Ionut Nistor was the recipient of a grant from European Renal Best Practice (ERBP) and the European Renal Association‐European Dialysis Transplantation Association (ERA‐EDTA), Other.
Declarations of interest
-
Angela Ballinger received a student stipend for a summer studentship 2012/2013 from the University of Otago to assist with completing this research.
-
Suetonia Palmer: none known
-
Jonathan Craig: none known
-
Ionut Nistor: is a fellow of the Methods Support Team of European Renal Best Practice (ERBP), supported by a grant of the European Renal Association ‐ European Dialysis Transplantation Association (ERA‐EDTA)
-
Giovanni Strippoli: none known.
Acknowledgements
The authors wish to acknowledge the editorial and administrative support of Narelle Willis and Sandra Puckeridge. Ruth Mitchell, Linda Heslop and Gail Higgins, Trial Search Co‐ordinators of the Cochrane Renal Group, provided search strategies for this review.
We also wish to acknowledge Drs Allison Tong and Grahame Elder who were authors on previous versions of this review.
Version history
| Published | Title | Stage | Authors | Version |
| 2014 Dec 09 | Calcimimetics for secondary hyperparathyroidism in chronic kidney disease patients | Review | Angela E Ballinger, Suetonia C Palmer, Ionut Nistor, Jonathan C Craig, Giovanni FM Strippoli | |
| 2006 Oct 18 | Calcimimetics for secondary hyperparathyroidism in chronic kidney disease patients | Review | Giovanni FM Strippoli, Allison Tong, Suetonia C Palmer, Grahame J Elder, Jonathan C Craig | |
Differences between protocol and review
The outcomes of cardiovascular mortality and one or more episodes of hypercalcaemia have been added to the review in the update to February 2013.
The study included in the review published in 2006 called Malluche 2004 has been updated to include data from a 2008 full text publication and renamed Malluche 2008.
Notes
A systematic review and meta‐analysis that includes sequential meta‐analysis and meta‐regression of these data has been published in PLoS Medicine (Palmer 2013).
Keywords
MeSH
Medical Subject Headings (MeSH) Keywords
- Calcimimetic Agents [adverse effects, *therapeutic use];
- Calcium [blood];
- Cardiovascular Diseases [mortality];
- Cause of Death;
- Cinacalcet;
- Hyperparathyroidism, Secondary [blood, *drug therapy, etiology];
- Kidney Failure, Chronic [*complications, therapy];
- Naphthalenes [adverse effects, *therapeutic use];
- Parathyroid Hormone [blood];
- Phosphorus [blood];
- Randomized Controlled Trials as Topic;
- Renal Dialysis;
Medical Subject Headings Check Words
Humans;
PICO
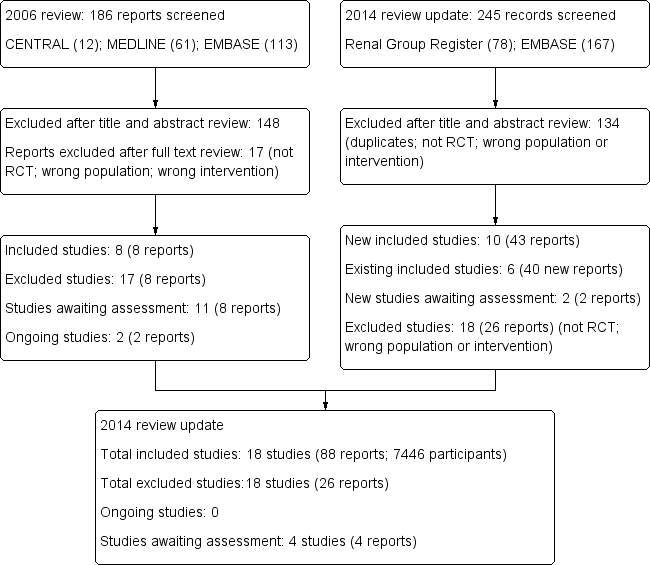
Study flow diagram.

Risk of bias summary: review authors' judgements about each risk of bias item for each included study.
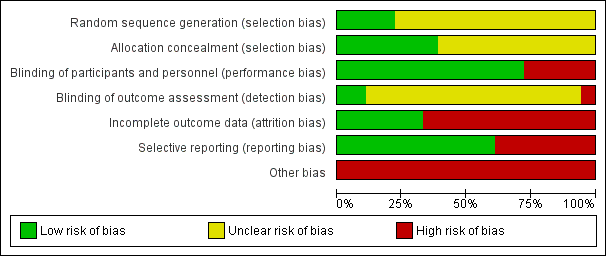
Risk of bias graph: review authors' judgements about each risk of bias item presented as percentages across all included studies.

Comparison 1 Calcimimetics versus placebo/no treatment, Outcome 1 All‐cause mortality.
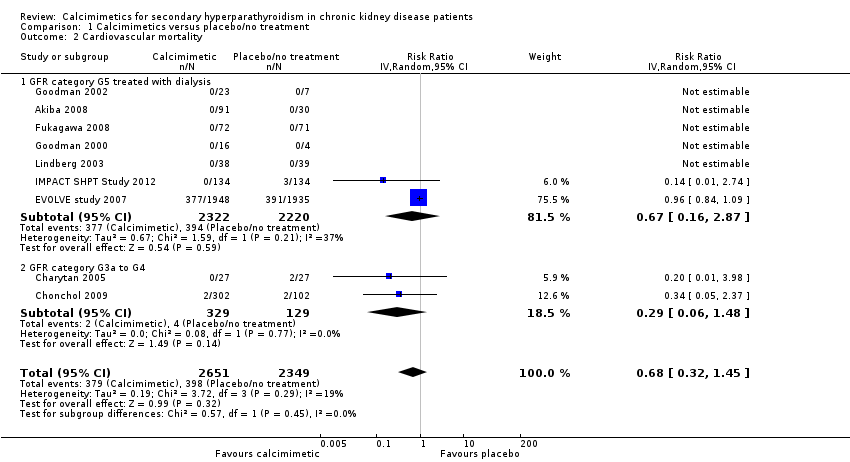
Comparison 1 Calcimimetics versus placebo/no treatment, Outcome 2 Cardiovascular mortality.
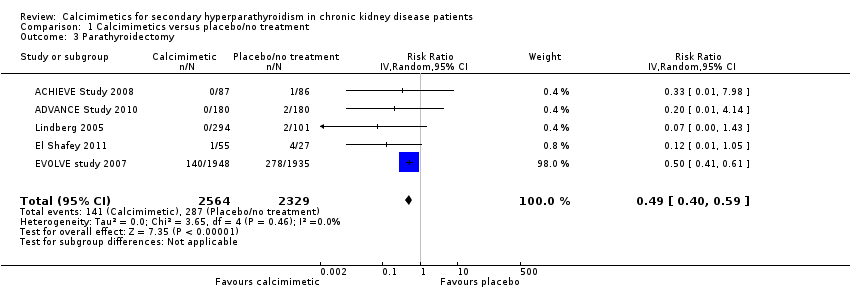
Comparison 1 Calcimimetics versus placebo/no treatment, Outcome 3 Parathyroidectomy.

Comparison 1 Calcimimetics versus placebo/no treatment, Outcome 4 Fractures.

Comparison 1 Calcimimetics versus placebo/no treatment, Outcome 5 Hypocalcaemia.

Comparison 1 Calcimimetics versus placebo/no treatment, Outcome 6 Hypercalcaemia.
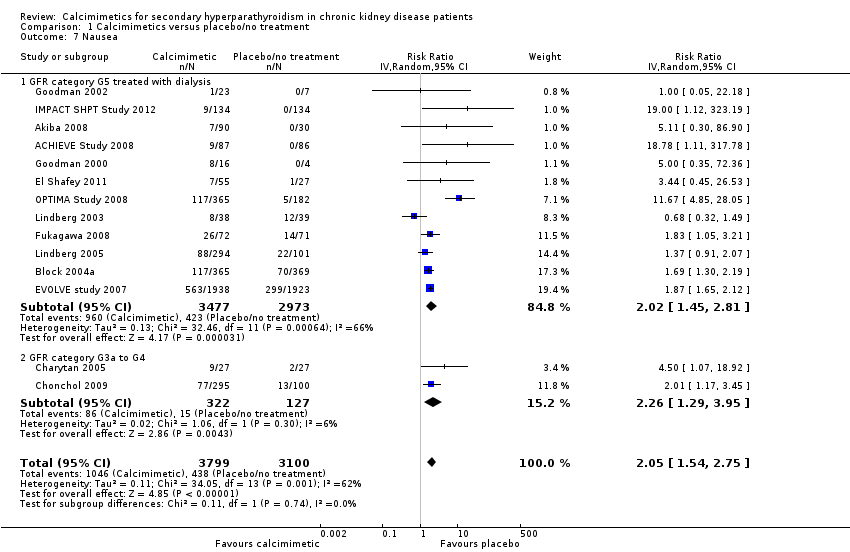
Comparison 1 Calcimimetics versus placebo/no treatment, Outcome 7 Nausea.

Comparison 1 Calcimimetics versus placebo/no treatment, Outcome 8 Vomiting.

Comparison 1 Calcimimetics versus placebo/no treatment, Outcome 9 Diarrhoea.
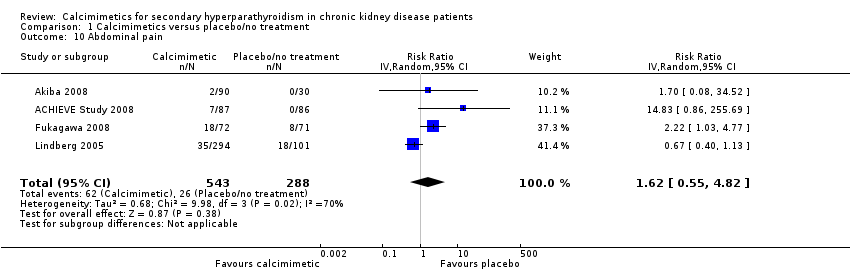
Comparison 1 Calcimimetics versus placebo/no treatment, Outcome 10 Abdominal pain.
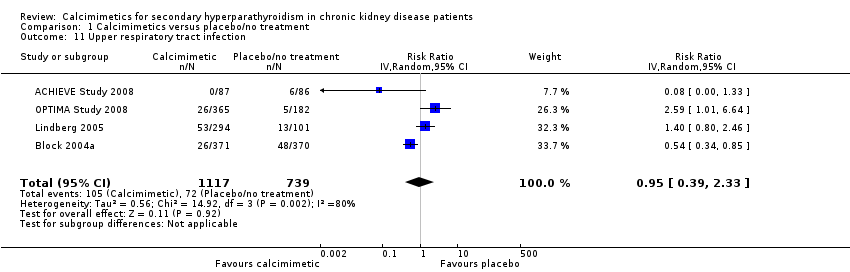
Comparison 1 Calcimimetics versus placebo/no treatment, Outcome 11 Upper respiratory tract infection.

Comparison 1 Calcimimetics versus placebo/no treatment, Outcome 12 Asthenia, muscle weakness or paraesthesia.

Comparison 1 Calcimimetics versus placebo/no treatment, Outcome 13 Dyspnoea.

Comparison 1 Calcimimetics versus placebo/no treatment, Outcome 14 Headache.

Comparison 1 Calcimimetics versus placebo/no treatment, Outcome 15 Achievement of PTH target.
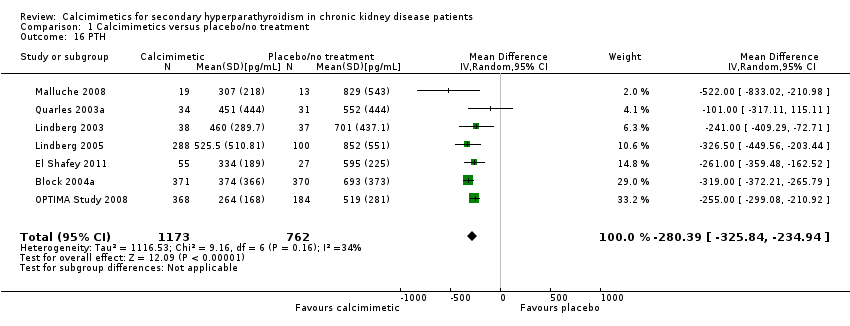
Comparison 1 Calcimimetics versus placebo/no treatment, Outcome 16 PTH.

Comparison 1 Calcimimetics versus placebo/no treatment, Outcome 17 Serum calcium.
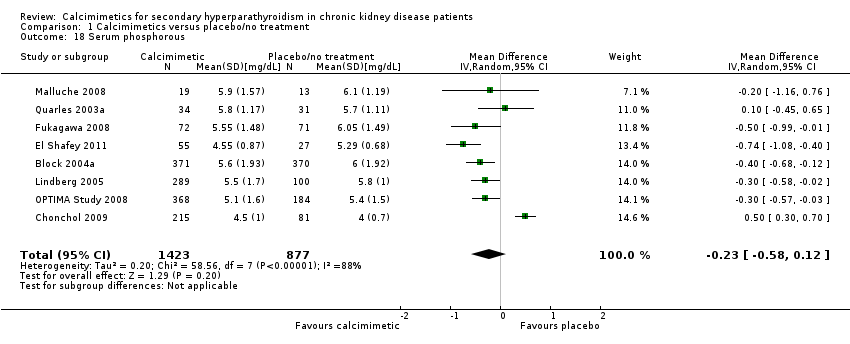
Comparison 1 Calcimimetics versus placebo/no treatment, Outcome 18 Serum phosphorous.

Comparison 1 Calcimimetics versus placebo/no treatment, Outcome 19 Calcium x phosphorous.
| Cinacalcet plus standard therapy versus placebo or standard therapy or both for patients with CKD and elevated PTH levels | |||||
| Patient or population: adults with CKD | |||||
| Outcomes (median treatment duration) | *Best estimate of control group risk | Relative effect | No of participants | Absolute effect per one year of treatment for 1000 treated (95%CI) | Quality of the evidence |
| GFR category G5 treated with dialysis | |||||
| All‐cause mortality (8 months) | 200 per 1000 | RR 0.97 (0.89 to 95) | 6893 (14) | 6 fewer (22 fewer to 10 more) | ⊕⊕⊕⊕ |
| Parathyroidectomy (9 months) | 7 per 1000 | RR 0.49 (0.40 to 0.59) | 4893 (5) | 3 fewer (4 fewer to 3 fewer) | ⊕⊕⊕⊕ |
| Hypocalcaemia (7 months) | 10 per 1000 | RR 6.98 (5.10 to 9.53) | 6415 (12) | 60 more (41 more to 85 more) | ⊕⊕⊕⊕ |
| Nausea (7 months) | 150 per 1000 | RR 2.02 (1.45 to 2.81) | 6450 (12) | 153 more (68 more to 272 more) | ⊕⊕⊕ |
| GFR category G3a‐G4 | |||||
| All‐cause mortality (8 months) | 25 per 1000 | RR 0.29 (0.06 to 1.48) | 458 (2) | 18 fewer (23 fewer to 12 more) | ⊕⊕ |
| Parathyroidectomy (9 months) | 7 per 1000 | RR not estimable | 0 (0) | Not estimable | nil |
| Hypocalcaemia (7 months) | 10 per 1000 | RR 31.9 (5.28 to 192.6) | 449 (2) | 310 more (43 more to 1910 more) | ⊕ |
| Nausea (7 months) | 100 per 1000 | RR 2.26 (1.29 to 3.95) | 449 (2) | 126 more (29 more to 295 more) | ⊕⊕ low |
| *The basis for the assumed risk (e.g. the median control group risk across studies) is provided in footnotes. The corresponding risk (and its 95% confidence interval) is based on the assumed risk in the comparison group and the relative effect of the intervention (and its 95% CI). Approximate absolute event rates of outcomes per year are derived from previously published cohort studies and registry data for the outcomes of all‐cause mortality (Weiner 2006) and parathyroidectomy (Kestenbaum 2004) or event rates in the control arm of contributing studies for outcomes of hypocalcaemia and nausea. Absolute numbers of people who had chronic kidney disease with mortality or parathyroidectomy events avoided or nausea or hypocalcaemia events caused per 1000 treated were calculated from the risk estimate for the outcome (and associated 95% confidence interval) obtained from meta‐analysis of placebo‐controlled studies together with the absolute population risk estimates. | |||||
| GRADE Working Group grades of evidence | |||||
| CKD ‐ chronic kidney disease; GFR ‐ glomerular filtration rate; PTH‐ parathyroid hormone | |||||
| Prognosis of CKD by GFR and albuminuria categories: KDIGO 2012 | Persistent albuminuria categories Description and range | |||||
| A1 Normal to mildly increased | A2 Moderately increased | A3 Severely increased | ||||
| < 30 mg/g < 3 mg/mmol | 30 to 300 mg/g 3 to 30 mg/mmol | > 300 mg/g > 30 mg/mmol | ||||
| GFR categories (mL/min per 1.73 m²) Description and range | G1 G2 | Normal or high Mildly decreased | > 90 60 to 89 | Low | Moderate | High |
| G3a | Mild to moderately decreased | 45 to 59 | Moderate | High | Very high | |
| G3b | Moderate to severely decreased | 30 to 44 | High | Very high | ||
| G4 | Severely decreased | 15 to 29 | Very high | |||
| G5 | Kidney failure | < 15 | ||||
| Description of the Kidney Disease: Improving Global Outcomes (KDIGO) nomenclature for chronic kidney disease used in this review (see the full KDIGO CKD 2013 for additional information). GFR ‐ glomerular filtration rate | ||||||
| Study | Participants (treatment/control) | PTH level triggering reduction in cinacalcet dose | Calcium level triggering reduction in cinacalcet dose | Hypocalcaemia (study endpoint) | Hypercalcaemia (study endpoint) |
| 173 (87/86) | < 150 pg/mL | Symptoms of hypocalcaemia or < 7.5 mg/dL | < 8.4 mg/dL | > 10.2 mg/dL | |
| 360 (180/180) | ‐‐ | ‐‐ | Hypocalcaemia | Hypercalcaemia | |
| 121 (91/30) | ‐‐ | ‐‐ | Hypocalcaemia | ‐‐ | |
| 741 (371/370) | < 100 pg/mL | Symptoms of hypocalcaemia or < 7.8 mg/dL | Withdrawal due to hypocalcaemia | ‐‐ | |
| 54 (27/27) | ‐‐ | Dose‐related adverse event or < 7.8 mg/dL | < 8.4 mg/dL | ‐‐ | |
| 404 (302/102) | PTH < 35 pg/mL for stage 3 and < 70 pg/mL for stage 4 | Symptoms of hypocalcaemia or < 7.5 mg/dL | < 7.5 mg/dL | ‐‐ | |
| 82 (55/27) | < 92 pg/mL | Dose‐related adverse event or < 7.5 mg/dL | Hypocalcaemia | ‐‐ | |
| 3883 (1948/1935) | < 150 pg/mL | < 7.5 mg/dL and/or symptoms of hypocalcaemia | < 8.0 mg/dL or < 7.5 mg/dL (unclear which threshold reported in study) | > 10.5 mg/dL | |
| 145 (72/73) | Investigators’ discretion or excessive decrease in PTH level | Investigators’ discretion or < 7.5 mg/dL | Hypocalcaemia | ‐‐ | |
| 21 (16/5) | ‐‐ | Symptoms of hypocalcaemia or ionised calcium < 4 mg/dL | Ionized calcium < 4 mg/dL | ‐‐ | |
| 30 (23/7) | ‐‐ | 8.0 mg/dL | < 8.0 mg/dL | ‐‐ | |
| 23 (17/6) | ‐‐ | ‐‐ | ‐‐ | ‐‐ | |
| 264 (134/134) | < 150 pg/mL | < 7.5 mg/dL | <8,.4 mg/dL | > 10.5 mg/dL | |
| 78 (39/39) | < 100 pg/mL | Symptoms of hypocalcaemia or < 7.8 mg/dL | < 7.5 mg/dL | ‐‐ | |
| 395 (294/101) | ‐‐ | Symptoms of hypocalcaemia or < 7.8 mg/dL | ‐‐ | ‐‐ | |
| 32 (19/13) | < 100 pg/mL | Symptoms of hypocalcaemia or < 7.8 mg/dL | ‐‐ | ‐‐ | |
| 552 (368/184) | < 150 pg/mL | < 8.0 mg/dL | < 7.5 mg/dL | ‐‐ | |
| 71 (36/35) | < 100 pg/mL | < 7.8 mg/dL | ‐‐ | ‐‐ | |
| PTH ‐ parathyroid hormone | |||||
| Outcome or subgroup title | No. of studies | No. of participants | Statistical method | Effect size |
| 1 All‐cause mortality Show forest plot | 16 | 7351 | Risk Ratio (IV, Random, 95% CI) | 0.96 [0.89, 1.05] |
| 1.1 GFR category G5 treated with dialysis | 14 | 6893 | Risk Ratio (IV, Random, 95% CI) | 0.97 [0.89, 1.05] |
| 1.2 GFR category G3a to G4 | 2 | 458 | Risk Ratio (IV, Random, 95% CI) | 0.29 [0.06, 1.48] |
| 2 Cardiovascular mortality Show forest plot | 9 | 5000 | Risk Ratio (IV, Random, 95% CI) | 0.68 [0.32, 1.45] |
| 2.1 GFR category G5 treated with dialysis | 7 | 4542 | Risk Ratio (IV, Random, 95% CI) | 0.67 [0.16, 2.87] |
| 2.2 GFR category G3a to G4 | 2 | 458 | Risk Ratio (IV, Random, 95% CI) | 0.29 [0.06, 1.48] |
| 3 Parathyroidectomy Show forest plot | 5 | 4893 | Risk Ratio (IV, Random, 95% CI) | 0.49 [0.40, 0.59] |
| 4 Fractures Show forest plot | 2 | 3965 | Risk Ratio (IV, Random, 95% CI) | 0.52 [0.12, 2.27] |
| 5 Hypocalcaemia Show forest plot | 14 | 6864 | Risk Ratio (IV, Random, 95% CI) | 7.38 [5.43, 10.03] |
| 5.1 GFR category G5 treated with dialysis | 12 | 6415 | Risk Ratio (IV, Random, 95% CI) | 6.98 [5.10, 9.53] |
| 5.2 GFR category G3a to G4 | 2 | 449 | Risk Ratio (IV, Random, 95% CI) | 31.90 [5.28, 192.60] |
| 6 Hypercalcaemia Show forest plot | 4 | 4662 | Risk Ratio (IV, Random, 95% CI) | 0.23 [0.05, 0.97] |
| 7 Nausea Show forest plot | 14 | 6899 | Risk Ratio (IV, Random, 95% CI) | 2.05 [1.54, 2.75] |
| 7.1 GFR category G5 treated with dialysis | 12 | 6450 | Risk Ratio (IV, Random, 95% CI) | 2.02 [1.45, 2.81] |
| 7.2 GFR category G3a to G4 | 2 | 449 | Risk Ratio (IV, Random, 95% CI) | 2.26 [1.29, 3.95] |
| 8 Vomiting Show forest plot | 10 | 6718 | Risk Ratio (IV, Random, 95% CI) | 1.95 [1.74, 2.18] |
| 8.1 GFR category G5 treated with dialysis | 9 | 6323 | Risk Ratio (IV, Random, 95% CI) | 1.97 [1.73, 2.24] |
| 8.2 GFR category G3a to G4 | 1 | 395 | Risk Ratio (IV, Random, 95% CI) | 1.77 [0.90, 3.48] |
| 9 Diarrhoea Show forest plot | 8 | 5639 | Risk Ratio (IV, Random, 95% CI) | 1.15 [1.02, 1.29] |
| 10 Abdominal pain Show forest plot | 4 | 831 | Risk Ratio (IV, Random, 95% CI) | 1.62 [0.55, 4.82] |
| 11 Upper respiratory tract infection Show forest plot | 4 | 1856 | Risk Ratio (IV, Random, 95% CI) | 0.95 [0.39, 2.33] |
| 12 Asthenia, muscle weakness or paraesthesia Show forest plot | 5 | 1379 | Risk Ratio (IV, Random, 95% CI) | 1.55 [0.93, 2.58] |
| 12.1 Asthenia | 2 | 790 | Risk Ratio (IV, Random, 95% CI) | 1.54 [0.26, 8.98] |
| 12.2 Muscle weakness or paraesthesia | 4 | 589 | Risk Ratio (IV, Random, 95% CI) | 1.78 [1.00, 3.14] |
| 13 Dyspnoea Show forest plot | 2 | 250 | Risk Ratio (IV, Random, 95% CI) | 1.02 [0.49, 2.12] |
| 14 Headache Show forest plot | 3 | 1115 | Risk Ratio (IV, Random, 95% CI) | 1.11 [0.65, 1.91] |
| 15 Achievement of PTH target Show forest plot | 11 | 2853 | Risk Ratio (IV, Random, 95% CI) | 3.06 [1.89, 4.98] |
| 16 PTH Show forest plot | 7 | 1935 | Mean Difference (IV, Random, 95% CI) | ‐280.39 [‐325.84, ‐234.94] |
| 17 Serum calcium Show forest plot | 7 | 1556 | Mean Difference (IV, Random, 95% CI) | ‐0.87 [‐0.96, ‐0.77] |
| 18 Serum phosphorous Show forest plot | 8 | 2300 | Mean Difference (IV, Random, 95% CI) | ‐0.23 [‐0.58, 0.12] |
| 19 Calcium x phosphorous Show forest plot | 8 | 2395 | Mean Difference (IV, Random, 95% CI) | ‐5.25 [‐9.16, ‐1.34] |