Calcimiméticos para el hiperparatiroidismo secundario en pacientes con nefropatías crónicas
Resumen
Antecedentes
Los agentes calcimiméticos disminuyen los niveles séricos anormales de la hormona paratiroidea (HPT) en pacientes con nefropatías crónicas (NC), aunque no se conocen los efectos beneficiosos y perjudiciales en los resultados a nivel del paciente. Desde la primera publicación en 2006 de esta revisión, que mostraba que las pruebas sobre calcimiméticos en gran parte se limitaban a los resultados bioquímicos, se han realizado estudios adicionales. Ésta es una actualización de una revisión publicada por primera vez en 2006.
Objetivos
Evaluar los efectos beneficiosos y perjudiciales del cinacalcet en los resultados a nivel del paciente en adultos con NC.
Métodos de búsqueda
Se realizaron búsquedas en MEDLINE, EMBASE, CENTRAL y actas de congresos para obtener ensayos controlados aleatorios (ECA) que evaluaran cualquier calcimimético versus placebo u otro agente en adultos con NC (albuminuria persistente > 30 mg/g con o sin reducción en la tasa de filtración glomerular [TFG] [por debajo de 60 mL/min/1,73 m²]). Se actualizaron las búsquedas hasta el 7 febrero 2013, incluyendo el registro especializado del Grupo Cochrane de Riñón (Cochrane Renal Group) para completar esta actualización.
Criterios de selección
Se incluyeron todos los ECA de un calcimimético administrado a los pacientes con NC para el tratamiento de los niveles séricos elevados de HPT.
Obtención y análisis de los datos
Se extrajeron datos de todos los resultados pertinentes alternativos y centrados en el paciente. Se resumieron los cálculos del tratamiento mediante los efectos aleatorios, y se expresaron los efectos del tratamiento como cociente de riesgos (CR) o diferencia de medias (DM) con intervalos de confianza (IC) del 95%.
Resultados principales
Dieciocho estudios (7446 participantes) compararon cinacalcet además del tratamiento estándar con ningún tratamiento o placebo más tratamiento estándar. En adultos con una TFG de categoría G5 (TFG por debajo de 15 mL/min/1,73 m²) tratados con diálisis, el tratamiento habitual con cinacalcet tuvo poco o ningún efecto sobre la mortalidad por todas las causas (CR 0,97; IC del 95%: 0,89 a 1,05), efectos imprecisos sobre la mortalidad cardiovascular (CR 0,67; IC del 95%: 0,16 a 2,87), y previno la paratiroidectomía quirúrgica (CR 0,49; IC del 95%: 0,40 a 0,59) y la hipercalcemia (CR 0,23; IC del 95%: 0,05 a 0,97), aunque aumentó la hipocalcemia (CR 6,98; IC del 95%: 5,10 a 9,53), las náuseas (CR 2,02; IC del 95%: 1,45 a 2,81) y los vómitos (CR 1,97; IC del 95%: 1,73 a 2,24). El cinacalcet redujo los niveles séricos de HPT (DM ‐281,39 pg/mL, IC del 95%: ‐325,84 a ‐234,94) y calcio (DM ‐0,87 mg/dl, IC del 95%: ‐0,96 a ‐0,77), aunque tuvo poco o ningún efecto sobre los niveles séricos de fósforo (DM ‐0,23 mg/dl, IC del 95%: ‐0,58 a 0,12).
Los datos fueron dispersos para los adultos con una TFG de categoría G3a a G4 (TFG 15 a 60 mL/min/1,73 m²) y los receptores de trasplantes renales.
En términos generales, basado en los criterios GRADE, las pruebas sobre el cinacalcet en adultos con una TFG de categoría G5 tratados con diálisis (mortalidad, paratiroidectomía, hipocalcemia y náuseas) son de calidad alta o moderada. Las pruebas de alta calidad indican que "es muy poco probable que la investigación adicional cambie la confianza en la estimación del efecto del tratamiento" y las pruebas de calidad moderada sugieren que "es probable que la investigación adicional tenga una marcada repercusión sobre la confianza en la estimación del efecto y pueda cambiarla". La información sobre los adultos con NC menos graves y una TFG de categoría G3a a G4 es de calidad baja o muy baja. Esto significa que es probable que la realización de más investigaciones tenga una marcada repercusión sobre la confianza en la estimación del efecto y pueda cambiarla
Conclusiones de los autores
El tratamiento habitual con cinacalcet redujo la necesidad de paratiroidectomía en pacientes adultos tratados con diálisis y con niveles elevados de HPT aunque no mejora la mortalidad cardiovascular ni por todas las causas. El cinacalcet aumenta los riesgos de náuseas, vómitos e hipocalcemia, lo cual sugiere que los efectos perjudiciales pueden superar los beneficios en esta población.
PICO
Resumen en términos sencillos
Calcimiméticos para el hiperparatiroidismo secundario en pacientes con nefropatías crónicas
En pacientes con nefropatías crónicas se observan niveles anormales de calcio y fósforo en la sangre y los tejidos. Estos cambios están vinculados a una supervivencia más corta y al endurecimiento de las arterias que da lugar a cardiopatías. El tratamiento estándar para los niveles anormales de calcio y otros minerales incluye restricciones alimentarias, captadores de fósforo y compuestos de vitamina D. Se observó que un tratamiento más nuevo con un fármaco denominado cinacalcet es prometedor para mejorar los niveles anormales de minerales aunque no se conocen los efectos de este fármaco sobre los resultados de los pacientes (la forma en que se sienten los pacientes, su función y supervivencia) a partir de los estudios anteriores. Se ha actualizado una revisión anterior de 2006 para incluir estudios que evaluaban los efectos del cinacalcet en alrededor de 7500 pacientes con nefropatías crónicas. Aunque el cinacalcet mejora algunas anomalías sanguíneas, no mejora el riesgo de muerte ni las cardiopatías en los pacientes tratados con diálisis. Además, los pacientes que reciben cinacalcet pueden presentar un aumento en las náuseas, los vómitos y la necesidad de análisis de sangre para comprobar los niveles de calcio en la sangre. La investigación actual es de alta calidad y significa que los nuevos estudios adicionales probablemente cambien la confianza en los resultados. La información sobre la administración de cinacalcet en pacientes con formas más leves de nefropatía y en pacientes con un trasplante renal es insuficiente para guiar la toma de decisiones.
Authors' conclusions
Summary of findings
| Cinacalcet plus standard therapy versus placebo or standard therapy or both for patients with CKD and elevated PTH levels | |||||
| Patient or population: adults with CKD | |||||
| Outcomes (median treatment duration) | *Best estimate of control group risk | Relative effect | No of participants | Absolute effect per one year of treatment for 1000 treated (95%CI) | Quality of the evidence |
| GFR category G5 treated with dialysis | |||||
| All‐cause mortality (8 months) | 200 per 1000 | RR 0.97 (0.89 to 95) | 6893 (14) | 6 fewer (22 fewer to 10 more) | ⊕⊕⊕⊕ |
| Parathyroidectomy (9 months) | 7 per 1000 | RR 0.49 (0.40 to 0.59) | 4893 (5) | 3 fewer (4 fewer to 3 fewer) | ⊕⊕⊕⊕ |
| Hypocalcaemia (7 months) | 10 per 1000 | RR 6.98 (5.10 to 9.53) | 6415 (12) | 60 more (41 more to 85 more) | ⊕⊕⊕⊕ |
| Nausea (7 months) | 150 per 1000 | RR 2.02 (1.45 to 2.81) | 6450 (12) | 153 more (68 more to 272 more) | ⊕⊕⊕ |
| GFR category G3a‐G4 | |||||
| All‐cause mortality (8 months) | 25 per 1000 | RR 0.29 (0.06 to 1.48) | 458 (2) | 18 fewer (23 fewer to 12 more) | ⊕⊕ |
| Parathyroidectomy (9 months) | 7 per 1000 | RR not estimable | 0 (0) | Not estimable | nil |
| Hypocalcaemia (7 months) | 10 per 1000 | RR 31.9 (5.28 to 192.6) | 449 (2) | 310 more (43 more to 1910 more) | ⊕ |
| Nausea (7 months) | 100 per 1000 | RR 2.26 (1.29 to 3.95) | 449 (2) | 126 more (29 more to 295 more) | ⊕⊕ low |
| *The basis for the assumed risk (e.g. the median control group risk across studies) is provided in footnotes. The corresponding risk (and its 95% confidence interval) is based on the assumed risk in the comparison group and the relative effect of the intervention (and its 95% CI). Approximate absolute event rates of outcomes per year are derived from previously published cohort studies and registry data for the outcomes of all‐cause mortality (Weiner 2006) and parathyroidectomy (Kestenbaum 2004) or event rates in the control arm of contributing studies for outcomes of hypocalcaemia and nausea. Absolute numbers of people who had chronic kidney disease with mortality or parathyroidectomy events avoided or nausea or hypocalcaemia events caused per 1000 treated were calculated from the risk estimate for the outcome (and associated 95% confidence interval) obtained from meta‐analysis of placebo‐controlled studies together with the absolute population risk estimates. | |||||
| GRADE Working Group grades of evidence | |||||
| CKD ‐ chronic kidney disease; GFR ‐ glomerular filtration rate; PTH‐ parathyroid hormone | |||||
Background
Description of the condition
Abnormal calcium and phosphorous metabolism occurs with kidney failure and is associated with bone and vascular disease. In addition to causing reduced quality of life, these complications of chronic kidney disease (CKD) are associated with increased mortality and major cardiovascular events (Block 2004b; Ganesh 2001; Malluche 2004b; Marco 2003; Martin 2004; Stehman‐Breen 2004). Standard management of patients with CKD, particularly those with glomerular filtration rate (GFR) category G5 (KDIGO CKD 2013) includes treatment to control serum levels of calcium, phosphorous and parathyroid hormone (PTH) to prevent bone and soft‐tissue complications. Based on a number of association studies (Block 2004b; Ganesh 2001; Kestenbaum 2005; Marco 2003; Stevens 2004), including studies of bone histomorphometry (Hutchison 1993; Qi 1995; Wang 1995; Ziolkowska 2000), optimal ranges for serum phosphorous, calcium, the calcium by phosphorous product and PTH have been suggested (KHA‐CARI 2014; NKF 2003).
How the intervention might work
Specific management of elevated serum PTH levels in people with GFR categories G3a to G5 (estimated GFR below 60 mL/min/1.73 m²) may be accomplished by restriction of dietary phosphorous, calcium supplementation, or the use of vitamin D compounds or both (Albaaj 2003; Courant 1993). A novel class of drugs called calcimimetic agents have been developed to reduce PTH secretion and parathyroid cell proliferation, while decreasing levels of serum calcium, phosphorous and the calcium by phosphorous product (Mentaverri 2006; Mizobuchi 2007). Cinacalcet, a calcimimetic agent, was first approved in the United States in 2004 to lower elevated serum PTH levels in dialysis patients (FDA 2004). Cinacalcet mimics the action of calcium on calcium‐sensing receptors in the parathyroid gland to suppress PTH secretion. In an earlier version of this review that included eight studies (1,429 participants) published in late 2005 or earlier, cinacalcet markedly reduced serum levels of PTH (290 pg/mL), calcium (‐0.85 mg/dL) and phosphorous (‐0.29 mg/dL), that have all been shown to be associated with poorer outcomes in adults with CKD (Block 2004b)
Why it is important to do this review
However, while cinacalcet reduces biochemical parameters (serum PTH, calcium, and phosphorous), our earlier meta‐analysis found insufficient evidence for benefit on clinical outcomes. Despite this lack of evidence for patient‐level outcomes, cinacalcet has become the largest single drug cost for dialysis patients in the United States with annual prescribing costs of at least USD 260 million (USRDS 2012). A pooled analysis of four placebo‐controlled randomised controlled trials (RCTs) of cinacalcet in 2005 showed a large reduction in cardiovascular‐related hospitalisation which may have led to uncertainty for clinicians about the therapy benefits of cinacalcet treatment (Cunningham 2005a).
This systematic review now updates an earlier review that was performed at an early phase of calcimimetic usage, but one year after licensing by the FDA (FDA 2004). In the light of recent studies of cinacalcet, high prescribing costs in some regions and insufficient existing evidence for cinacalcet on patient‐level outcomes in an earlier review, we have updated the evidence summary for the benefits and harms of cinacalcet therapy in people with CKD to early 2013.
Objectives
To evaluate the benefits and harms of cinacalcet on patient‐level outcomes in adults with CKD.
Methods
Criteria for considering studies for this review
Types of studies
We included all RCTs of any calcimimetic agent (cinacalcet HCl (AMG‐073, Sensipar®), NPS R‐467 or NPS R‐568) administered to patients with CKD and elevated serum PTH levels.
Types of participants
Patients with CKD of any severity and elevated serum parathyroid levels.
Types of interventions
Any calcimimetic agent (e.g. cinacalcet HCl (AMG‐073, Sensipar®), NPS R‐467 or NPS R‐568).
Types of outcome measures
Primary outcomes
-
All‐cause mortality
-
Cardiovascular mortality
-
Parathyroidectomy
-
Fractures
-
Adverse events (hypocalcaemia, hypercalcaemia, nausea, vomiting, upper respiratory tract infection, dyspnoea, muscle weakness, headache, paraesthesia, abdominal pain, diarrhoea)
Secondary outcomes
-
At least 30% decrease in serum PTH level
-
Fractures
-
Mixed uraemic osteodystrophy
-
Bone histomorphometry
-
End of treatment PTH levels (any measure)
-
End of treatment serum calcium concentrations (mg/dL)
-
End of treatment serum phosphorous concentrations (mg/dL)
-
End of treatment calcium x phosphorous product (mg²/dL²)
Search methods for identification of studies
For this review update we searched EMBASE and the Cochrane Renal Group's Specialised Register (to 7 February 2013) through contact with the Trials' Search Co‐ordinator using search terms relevant to this review. The Cochrane Renal Group’s Specialised Register contains studies identified from the following sources.
-
Monthly searches of the Cochrane Central Register of Controlled Trials (CENTRAL)
-
Weekly searches of MEDLINE OVID SP
-
Handsearching of renal‐related journals & the proceedings of major renal conferences
-
Searching of the current year of EMBASE OVID SP
-
Weekly current awareness alerts for selected renal‐journals
-
Searches of the International Clinical Trials Register (ICTRP) Search Portal & ClinicalTrials.gov.
Studies contained in the Specialised Register were identified through search strategies for CENTRAL, MEDLINE, and EMBASE based on the scope of the Cochrane Renal Group. Details of these strategies as well as a list of handsearched journals, conference proceedings and current awareness alerts are available in the 'Specialised Register' section of information about the Cochrane Renal Group.
See Appendix 1 for search terms used in strategies for this review.
Previous search strategies can be found in Strippoli 2006a.
Data collection and analysis
Selection of studies
The search strategy described was used to obtain titles and abstracts of studies that might have been relevant to the review. The titles and abstracts were screened independently by two or more authors, who discarded studies that were not applicable; however studies and reviews that might have included relevant data or information on studies were retained initially. Two authors independently assessed retrieved abstracts and, if necessary the full text, of these studies to determine which studies satisfied the inclusion criteria.
Data extraction and management
Data extraction for population characteristics, interventions, non‐randomised co‐interventions, and risk of bias was carried out independently by two or more authors using standard data extraction forms in a purpose‐built database. Each author double‐checked data extraction and data entry independently and any discrepancies between authors were resolved through discussion.
The following data were extracted.
-
Population: category of CKD, mean age, proportion of men, baseline serum PTH level
-
Intervention: drug name, dosing strategy, target serum PTH level used, randomised and non‐randomised co‐interventions
-
Comparison: placebo or no treatment, randomised and non‐randomised co‐interventions
-
Outcomes: all‐cause mortality, cardiovascular mortality, parathyroidectomy, fracture, and treatment related adverse events
-
Study design: inclusion criteria; exclusion criteria, primary endpoint; duration of treatment, duration of follow‐up, number of participants, date of publication, number of centres, source of funding; study registration (for studies published after 2005); publication (full text publication, abstract publication, unpublished data); period of collection of clinical outcomes (total duration of follow‐up, specific phase(s) of follow‐up)
-
Risk of bias: sequence generation; allocation concealment; blinding of participants and investigators, blinding of outcome assessment, attrition, selective outcome reporting, other sources of bias (reporting only in conference proceedings, early termination of study, marked imbalance in baseline characteristics, sponsor on authorship or involved with data handling and analysis)
Data were cross checked between authors and discussed. Studies reported in non‐English language journals were translated before assessment. Where more than one publication of one study existed, reports were grouped together and the publication with the most complete data was used in the analyses. Where relevant outcomes were only published in earlier versions, these data were used. Any discrepancy between published versions was highlighted. Any disagreements in data extraction were discussed with a third author.
Assessment of risk of bias in included studies
The following items were independently assessed by two authors using the risk of bias assessment tool (Higgins 2011). The specific attributes of each risk of bias considered in the adjudication process are described in Appendix 2.
-
Was there adequate sequence generation (selection bias)?
-
Was allocation adequately concealed (selection bias)?
-
Was knowledge of the allocated interventions adequately prevented during the study (detection bias)?
-
Participants and personnel
-
Outcome assessors
-
-
Were incomplete outcome data adequately addressed (attrition bias)?
-
Are reports of the study free of suggestion of selective outcome reporting (reporting bias)?
-
Was the study apparently free of other problems that could put it at a risk of bias?
Measures of treatment effect
The estimate of effect of an experimental versus a control intervention on categorical outcomes (e.g. all‐cause mortality, one or more fractures, parathyroidectomy, one or more episodes of nausea) was analysed using the risk ratio (RR) measure and its 95% confidence interval (CI) for each study. Where proportions of participants experiencing an event were provided in the study reports only (instead of raw event data), we estimated the number of participants experiencing one or more events by multiplying the proportion affected by the sample size and contacted the authors or sponsors for additional information.
For continuous variables (end of treatment serum PTH, calcium, phosphorous, calcium x phosphorous), the mean difference (MD), and its 95% CI were calculated using the end of treatment values of the variable in the treatment and control groups.
Assessment of heterogeneity
We assessed for heterogeneity in summary effect estimates using the Cochran Q test and the I² test (Higgins 2003). We considered a P value < 0.10 to indicate significant heterogeneity.
Data synthesis
When appropriate and feasible, treatment effects were summarised using random effects meta‐analysis and results were expressed as a RR or MD and the 95% confidence interval.
We summarised the quality of the evidence together with absolute treatment effects based on estimated baseline risks by using the Grading of Recommendations Assessment, Development, and Evaluation guidelines (Guyatt 2008). To estimate the absolute number of people with CKD who avoided death or parathyroidectomy and incurred hypocalcaemia or nausea with calcimimetic therapy, the risk estimate and 95% CI were obtained from the corresponding meta‐analyses, together with the absolute population risk for people with each category of CKD derived from cohort studies and registry data for all‐cause mortality and parathyroidectomy (Kestenbaum 2004; USRDS 2012; Weiner 2006) and event rates in the control arm of meta‐analyses for hypocalcaemia and nausea.
Subgroup analysis and investigation of heterogeneity
We analysed data for all‐cause mortality, cardiovascular mortality, parathyroidectomy, hypocalcaemia, and nausea and vomiting within stratified analyses comprising adults with GFR category G5 treated with dialysis and GFR categories G33‐G4 (using the KDIGO nomenclature ‐ see Table 1 for more details) (KDIGO CKD 2013).
| Prognosis of CKD by GFR and albuminuria categories: KDIGO 2012 | Persistent albuminuria categories Description and range | |||||
| A1 Normal to mildly increased | A2 Moderately increased | A3 Severely increased | ||||
| < 30 mg/g < 3 mg/mmol | 30 to 300 mg/g 3 to 30 mg/mmol | > 300 mg/g > 30 mg/mmol | ||||
| GFR categories (mL/min per 1.73 m²) Description and range | G1 G2 | Normal or high Mildly decreased | > 90 60 to 89 | Low | Moderate | High |
| G3a | Mild to moderately decreased | 45 to 59 | Moderate | High | Very high | |
| G3b | Moderate to severely decreased | 30 to 44 | High | Very high | ||
| G4 | Severely decreased | 15 to 29 | Very high | |||
| G5 | Kidney failure | < 15 | ||||
Description of the Kidney Disease: Improving Global Outcomes (KDIGO) nomenclature for chronic kidney disease used in this review (see the full KDIGO CKD 2013 for additional information).
GFR ‐ glomerular filtration rate
Sensitivity analysis
We conducted additional analyses excluding studies in which randomised co‐interventions strategies (vitamin D compounds) were not comparable between treatment arms.
Results
Description of studies
Results of the search
Initial search to November 2005
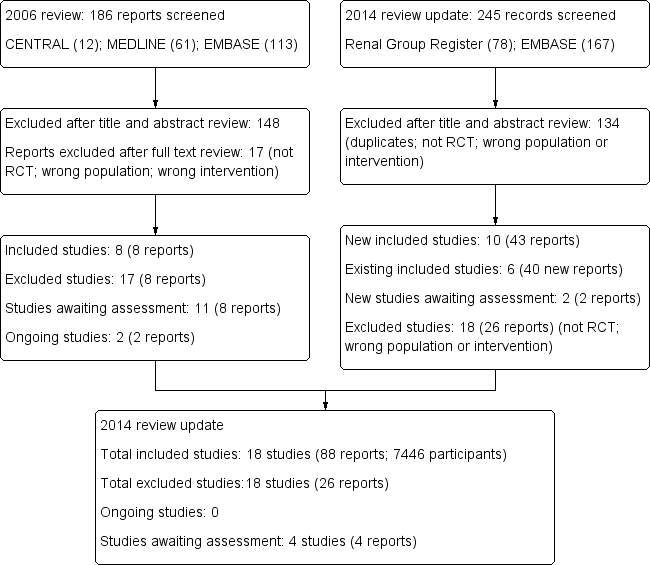
Our search for RCTs of calcimimetic interventions identified 186 records (see Figure 1 ‐ Study flow diagram). Of these, 148 were excluded after title and abstract review because they were clearly ineligible (non‐RCTs, RCTs of interventions not relevant to treatment of elevated PTH levels, not calcimimetic interventions, duplicate articles of the same study, or review articles). Of the remaining 38 potentially eligible studies (either full‐text or abstract publications), 30 were excluded because we could not confirm from the full‐text analysis or from contacting authors that they were RCTs, or that they were not a duplicate publication. Two attempts were made to contact all authors of the studies for clarifications of study designs and request supplemental data but we were not able to obtain some of the data nor to ascertain if some reports (presented in abstract form at the American Society of Nephrology (ASN) and the European Renal Association‐European Dialysis and Transplantation Association (ERA‐EDTA) meetings of years 2003 and 2004)) were subsets of other publications which had subsequently appeared as full‐text articles in scientific journals or were unique unpublished studies. These studies could therefore not be included and were listed under Characteristics of studies awaiting classification. We have subsequently reviewed these studies and ascertained all but Coburn 2003 are clearly duplicate reports of primary studies and these have been moved to the relevant studies.

Study flow diagram.
Search update to February 2013
The updated search to February 7, 2013 is detailed in Figure 1.
We identified 78 records from the Cochrane Renal Group Specialised Register and 167 from EMBASE. After title and abstract review we excluded 134 reports (duplicate reports, not randomised, wrong population or intervention).
We screened 111 full‐text records and excluded 66 reports as they were not RCTs, did not investigate relevant interventions, or did not include the relevant population. Two ongoing studies from the original review could now be excluded as they are not randomised studies (CONTROL Study 2006; TARGET Study 2008) and three studies are awaiting classification.
-
The URL describing the report is no longer linked to the article and the authors could not be contacted to obtain additional information (UPen 2004a)
-
Two studies state they are subgroup analyses of three studies; however we were unable to determine which three studies (Drueke 2001a; Fournier 2004a).
Included studies
Initial review including search to November 2005
In the initial review publication we included eight studies (in eight publications) enrolling 1429 patients (Block 2004b; Goodman 2000; Goodman 2002; Harris 2004; Lindberg 2003; Lindberg 2005; Malluche 2008 (included as Malluche 2004 in original review); Quarles 2003a). These studies compared cinacalcet HCl (845 patients) to placebo (584 patients). Three of these studies reported cinacalcet HCl as AMG‐073. One study reported on the first‐generation calcimimetic R‐568. This drug has been withdrawn from clinical use because of poor bioavailability, variable serum concentrations and potential drug interactions caused by cytochrome P‐450 activity (Goodman 2000; Urena 2003).
In addition to these randomised interventions, patients received vitamin D for suppression of PTH and phosphate binders for management of hyperphosphataemia as co‐interventions in all studies in a non‐randomised fashion. There were no significant differences in the proportions of patients who were prescribed calcitriol, vitamin D analogues and phosphate binders as co‐interventions between the calcimimetic and placebo groups of the studies. Entry to some studies was restricted when patients had severely elevated PTH levels (e.g. iPTH > 800 pg/mL) while other studies stratified patients according to the severity of hyperparathyroidism. The mean age of patients enrolled in the studies ranged from 47 to 55 years. All patients had elevated PTH levels. On average, a higher proportion of males were enrolled in the studies (388 males compared to 220 females in the six studies that reported gender distribution). Follow‐up of the studies ranged from three to 26 weeks. All studies were supported by Amgen Inc., Thousand Oaks, CA, which holds the cinacalcet HCl patent. Of note, the largest report published (Goodman 2002) was based on the pooled results of two separate studies.
Updated review including search to February 2013
We included 10 additional studies in this review update (ACHIEVE Study 2008; ADVANCE Study 2010; Akiba 2008; Charytan 2005; Chonchol 2009; El Shafey 2011; EVOLVE study 2007; Fukagawa 2008; IMPACT SHPT Study 2012; OPTIMA Study 2008). One study from the original review (known as Malluche 2004) was updated using data from a newer publication report (Malluche 2008). Overall, the updated review included 18 studies comprising 7446 adults with CKD comparing a calcimimetic plus conventional therapy with placebo or no treatment with conventional therapy. We could include 17 studies in 7424 participants in the meta‐analyses. The characteristics of the included studies are described in Characteristics of included studies.
All included studies evaluated cinacalcet hydrochloride (referred to as R‐568 or AMG‐073 in the four earliest studies) (Goodman 2000; Goodman 2002; Quarles 2003a; Lindberg 2003). Cinacalcet in additional to conventional therapy (vitamin D compounds and phosphorous binding agents) was compared to placebo or conventional therapy or both in all studies. In three studies, the strategy for vitamin D therapy differed between treatment groups (ACHIEVE Study 2008; ADVANCE Study 2010; IMPACT SHPT Study 2012). The two earliest studies were short‐term evaluations of cinacalcet therapy (eight days (Goodman 2002) and 15 days (Goodman 2000)) in adults with GFR category G5 (treated with dialysis). Following these earliest studies of safety and biochemical efficacy, the first larger‐scale study of cinacalcet therapy was reported in 2004 in 741 adults with GFR category G5 (treated with dialysis) and measured treatment efficacy based on PTH concentrations (Block 2004a). Between 2004 and 2012, 11 additional studies were reported (ACHIEVE Study 2008; ADVANCE Study 2010; Akiba 2008; Charytan 2005; Chonchol 2009; El Shafey 2011; Fukagawa 2008; IMPACT SHPT Study 2012; Lindberg 2005; Malluche 2008; OPTIMA Study 2008) although none was powered to evaluate treatment effects on mortality. In late 2012, the Evaluation of Cinacalcet Therapy to Lower Cardiovascular Events (EVOLVE study 2007) in 3883 participants with GFR category G5 treated with dialysis was the first study specifically designed to evaluate calcimimetic therapy on a primary composite outcome of all‐cause mortality or non‐fatal cardiovascular event.
Cinacalcet therapy was given in the included studies generally at increasing doses (usually 30 to 180 mg/d) targeted to serum PTH concentrations. In one study, the cinacalcet dose prescribed was unclear (IMPACT SHPT Study 2012). Overall, 16 studies comprised 6988 participants with GFR category G5 treatment with dialysis (ACHIEVE Study 2008; ADVANCE Study 2010; Akiba 2008; Block 2004a; El Shafey 2011; EVOLVE study 2007; Fukagawa 2008; Goodman 2000; Goodman 2002; Harris 2004; IMPACT SHPT Study 2012; Lindberg 2003; Lindberg 2005; Malluche 2008; OPTIMA Study 2008; Quarles 2003a) and two studies comprised 458 participants with GFR category G3a to G5 (Charytan 2005; Chonchol 2009). Of studies in dialysis, 15 enrolled haemodialysis patients and one enrolled patients treated with either haemodialysis or peritoneal dialysis. Follow‐up duration was between eight days and 21.2 months (median: 6.5 months)
Excluded studies
We excluded studies as they were not evaluating a calcimimetic with or without standard therapy versus placebo or standard therapy or both, did not provide data for relevant outcomes, were not RCTs, or were not in the CKD population. The details of reasons for exclusions are provided in the table for Characteristics of excluded studies.
Risk of bias in included studies
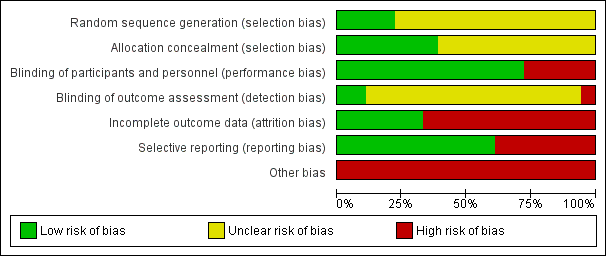
Risk of bias in the included studies is summarised in Figure 2 (individual studies) and Figure 3 (overall summary).

Risk of bias summary: review authors' judgements about each risk of bias item for each included study.

Risk of bias graph: review authors' judgements about each risk of bias item presented as percentages across all included studies.
Allocation
Four studies reported adequate sequence generation (22%) (Akiba 2008; Fukagawa 2008; Lindberg 2005; Malluche 2008) and reporting on this item was unclear in the remainder. Allocation was adequately concealed in seven studies (39%) (Charytan 2005; Chonchol 2009; EVOLVE study 2007; IMPACT SHPT Study 2012; Lindberg 2005; Malluche 2008; Quarles 2003a) and unclear in the remainder.
Blinding
Participants and investigators were adequately blinded to treatment assignment in 13 studies (72%) (Akiba 2008; Block 2004a; Charytan 2005; Chonchol 2009; EVOLVE study 2007; Fukagawa 2008; Goodman 2000; Goodman 2002; Harris 2004; Lindberg 2003; Lindberg 2005; Malluche 2008; Quarles 2003a), and not blinded in five studies (ACHIEVE Study 2008; ADVANCE Study 2010; El Shafey 2011; IMPACT SHPT Study 2012; OPTIMA Study 2008). Outcome assessment was blinded in two studies (11%) (Akiba 2008; EVOLVE study 2007), not blinded in one study (ACHIEVE Study 2008), and unclear in the remainder.
Incomplete outcome data
Six studies were at low risk of attrition bias (33%) (Chonchol 2009; El Shafey 2011; EVOLVE study 2007; Fukagawa 2008; Goodman 2002; Quarles 2003a) and the remainder were considered at high risk.
Selective reporting
Eleven studies reported all expected outcomes (61%) including mortality, hypocalcaemia, and two or more of nausea, vomiting or diarrhoea (ACHIEVE Study 2008; Akiba 2008; Block 2004a; Charytan 2005; Chonchol 2009; El Shafey 2011; EVOLVE study 2007; Fukagawa 2008; Goodman 2002; IMPACT SHPT Study 2012; OPTIMA Study 2008).
Other potential sources of bias
One study described uneven treatment comparisons at baseline (El Shafey 2011). The study sponsor was on the authorship and/or involved in data collection, analysis and/or interpretation in 15 studies (ACHIEVE Study 2008; ADVANCE Study 2010; Block 2004a; Charytan 2005; Chonchol 2009; EVOLVE study 2007; Goodman 2000; Goodman 2002; Harris 2004; IMPACT SHPT Study 2012; Lindberg 2003; Lindberg 2005; Malluche 2008; OPTIMA Study 2008; Quarles 2003a). Of 10 studies reported since 2005, five (50%) reported evidence of study registration within a studies registry before publication (ADVANCE Study 2010; Chonchol 2009; EVOLVE study 2007; Fukagawa 2008; IMPACT SHPT Study 2012).
Effects of interventions
See: Summary of findings for the main comparison Summary of findings for dialysis patients
Clinical outcomes
All‐cause and cardiovascular mortality
Compared to placebo or no treatment, cinacalcet had little or no effect on all‐cause mortality (Analysis 1.1.1 (14 studies, 6893 participants): RR 0.97, 95% CI 0.89 to 1.05; I² = 0%) in adults with GFR category G5 treated with dialysis and imprecise effects on all‐cause mortality in adults with GFR categories G3a to G4 (Analysis 1.1.2 (2 studies, 458 participants): RR 0.29, 95% CI 0.06 to 1.48; I² = 0%). There was no heterogeneity in treatment effects across studies in either subgroup and no statistical difference in treatment effects in the different stages of CKD.
Cinacalcet had uncertain effects on cardiovascular mortality for participants with GFR category G5 treated with dialysis (Analysis 1.2.1 (7 studies, 4542 participants): RR 0.67, 95% CI 0.16 to 2.87; I² = 37%) and GFR category G3a‐G4 (Analysis 1.2.2 (2 studies, 458 participants): RR 0.29, 95% CI 0.06 to 1.48; I² = 0%). There was no significant heterogeneity in treatment effects across studies in either subgroup and no statistical difference in treatment effects in the different stages of CKD.
Parathyroidectomy
Cinacalcet reduced the risk of parathyroidectomy (Analysis 1.3 (5 studies, 4893 participants): RR 0.49, 95% CI 0.40 to 0.59; I² = 0%) without evidence of heterogeneity in treatment estimates.
Fractures
The risk of one of more fractures was reported in extractable format in two studies. Cinacalcet had uncertain effects on risk of one or more fractures (Analysis 1.4 (2 studies, 3965 participants): RR 0.52, 95% CI 0.12 to 2.27) with significant heterogeneity in the treatment effect estimates of contributing studies (P = 0.05, I²; I² = 73%).
Hypocalcaemia and hypercalcaemia
Definitions of hypocalcaemia and hypercalcaemia in the included studies are provided in Table 2. The cut‐off for the definition of hypocalcaemia generally ranged between 7.1 and 8.4 mg/dL and that of hypercalcaemia was 10.2 to 10.5 mg/dL. Cinacalcet increased hypocalcaemia in both adults with GFR category G5 treated with dialysis (Analysis 1.5.1 (12 studies, 6415 participants): RR 6.98, 95% CI 5.10 to 9.53; I² = 0%) and those with GFR category G3 to G4 (Analysis 1.5.2 (2 studies, 449 participants): RR 31.90, 95% CI 5.28 to 192.60; I² = 16%) without significant heterogeneity in treatment estimates between studies.
| Study | Participants (treatment/control) | PTH level triggering reduction in cinacalcet dose | Calcium level triggering reduction in cinacalcet dose | Hypocalcaemia (study endpoint) | Hypercalcaemia (study endpoint) |
| 173 (87/86) | < 150 pg/mL | Symptoms of hypocalcaemia or < 7.5 mg/dL | < 8.4 mg/dL | > 10.2 mg/dL | |
| 360 (180/180) | ‐‐ | ‐‐ | Hypocalcaemia | Hypercalcaemia | |
| 121 (91/30) | ‐‐ | ‐‐ | Hypocalcaemia | ‐‐ | |
| 741 (371/370) | < 100 pg/mL | Symptoms of hypocalcaemia or < 7.8 mg/dL | Withdrawal due to hypocalcaemia | ‐‐ | |
| 54 (27/27) | ‐‐ | Dose‐related adverse event or < 7.8 mg/dL | < 8.4 mg/dL | ‐‐ | |
| 404 (302/102) | PTH < 35 pg/mL for stage 3 and < 70 pg/mL for stage 4 | Symptoms of hypocalcaemia or < 7.5 mg/dL | < 7.5 mg/dL | ‐‐ | |
| 82 (55/27) | < 92 pg/mL | Dose‐related adverse event or < 7.5 mg/dL | Hypocalcaemia | ‐‐ | |
| 3883 (1948/1935) | < 150 pg/mL | < 7.5 mg/dL and/or symptoms of hypocalcaemia | < 8.0 mg/dL or < 7.5 mg/dL (unclear which threshold reported in study) | > 10.5 mg/dL | |
| 145 (72/73) | Investigators’ discretion or excessive decrease in PTH level | Investigators’ discretion or < 7.5 mg/dL | Hypocalcaemia | ‐‐ | |
| 21 (16/5) | ‐‐ | Symptoms of hypocalcaemia or ionised calcium < 4 mg/dL | Ionized calcium < 4 mg/dL | ‐‐ | |
| 30 (23/7) | ‐‐ | 8.0 mg/dL | < 8.0 mg/dL | ‐‐ | |
| 23 (17/6) | ‐‐ | ‐‐ | ‐‐ | ‐‐ | |
| 264 (134/134) | < 150 pg/mL | < 7.5 mg/dL | <8,.4 mg/dL | > 10.5 mg/dL | |
| 78 (39/39) | < 100 pg/mL | Symptoms of hypocalcaemia or < 7.8 mg/dL | < 7.5 mg/dL | ‐‐ | |
| 395 (294/101) | ‐‐ | Symptoms of hypocalcaemia or < 7.8 mg/dL | ‐‐ | ‐‐ | |
| 32 (19/13) | < 100 pg/mL | Symptoms of hypocalcaemia or < 7.8 mg/dL | ‐‐ | ‐‐ | |
| 552 (368/184) | < 150 pg/mL | < 8.0 mg/dL | < 7.5 mg/dL | ‐‐ | |
| 71 (36/35) | < 100 pg/mL | < 7.8 mg/dL | ‐‐ | ‐‐ |
PTH ‐ parathyroid hormone
Cinacalcet reduced risks of one or more episodes of hypercalcaemia in adults with GFR category G5 treated with dialysis (Analysis 1.6 (4 studies, 4662 participants): RR 0.23, 95% CI 0.05 to 0.97) although there was significant heterogeneity in treatment estimates in the available studies (P = 0.005, I² = 77%).
Nausea and vomiting
Cinacalcet increased nausea in participants with GFR category G5 treated with dialysis (Analysis 1.7.1 (12 studies, 6450 participants): RR 2.02, 95% CI 1.45 to 2.81; I² = 66%) and those with GFR category G3 to G4 (Analysis 1.7.2 (2 studies, 449 participants): RR 2.26, 95% CI 1.29 to 3.95; I² = 6%). There was no statistical evidence that treatment effects were different in the different categories of CKD but there was significant heterogeneity in treatment estimates in studies including dialysis patients (P < 0.0006; I² = 66%).
Cinacalcet also increased vomiting in participants with GFR category G5 treated with dialysis (Analysis 1.8.1 (9 studies, 6323 participants): RR 1.97, 95% CI 1.73 to 2.24; I² = 3%) and those with GFR category G3 to G4 (Analysis 1.8.2 (1 study, 395 participants): RR 1.77, 95% CI 0.90 to 3.48). There was no statistical evidence that treatment effects were different in the different categories of CKD or significant heterogeneity in treatment estimates between studies.
Other adverse events
-
Cinacalcet consistently increased diarrhoea in the available studies (Analysis 1.9 (8 studies, 5639 participants): RR 1.15, 95% CI 1.02 to 1.29; I² = 0%).
-
Cinacalcet had uncertain effects on abdominal pain (Analysis 1.10 (4 studies, 831 participants): RR 1.62, 95% CI 0.55 to 4.82) with significant heterogeneity in the treatment effect estimates of contributing studies (P = 0.02, I² = 70%)
-
Cinacalcet had uncertain effects on the risk of upper respiratory tract infection (Analysis 1.11 (4 studies, 1856 participants): RR 0.95, 95% CI 0.39 to 2.33) with statistically significant heterogeneity in estimated treatment effects between studies (P = 0.002, I² = 80%)
-
Cinacalcet had uncertain effects on asthenia (Analysis 1.12.1 (2 studies, 790 participants): RR 1.54, 95% CI 0.26 to 8.98) with statistically significant heterogeneity in the estimated treatment effects in available studies (P = 0.04, I² = 77%)
-
Cinacalcet increased muscle weakness (Analysis 1.12.2 (4 studies, 589 participants): RR 1.78, 95% CI 1.00 to 3.14; I² = 0%) without heterogeneity in treatment effects.
-
Cinacalcet had uncertain effects on dyspnoea (Analysis 1.13 (2 studies, 250 participants): RR 1.02, 95% CI 0.49 to 2.12; I² = 0%) without heterogeneity in treatment effects.
-
Cinacalcet had uncertain effects on headache (Analysis 1.14 (3 studies, 1115 participants): RR 1.11, 95% CI 0.65 to 1.91; I² = 25%) without significant heterogeneity in treatment effects.
Biochemical parameters
Achieved serum PTH value target
Target serum PTH values are described in Table 2. Most PTH values targeted by cinacalcet therapy were a reduction of 30% or more from baseline or a reduction to below 250 pg/mL, 279 pg/mL or 300 pg/mL or a target value between 150 to 300 pg/mL. Cinacalcet increased the likelihood that serum PTH values were reduced to a target value (Analysis 1.15 (11 studies, 2853 participants): RR 3.06, 95% CI 1.89 to 4.98), although there was marked heterogeneity in the treatment estimates between studies (P < 0.00001, I² = 92%).
End of treatment serum PTH
Cinacalcet lowered serum PTH levels (Analysis 1.16 (7 studies, 1935 participants): MD ‐280.39 pg/mL, 95% CI ‐326.84 to ‐235.94) with moderate heterogeneity in the analysis (P = 0.16, I² = 34%).
End of treatment serum calcium
Cinacalcet lowered end of treatment serum calcium levels (Analysis 1.17 (7 study, 1556 participants): MD ‐0.87 mg/dL, 95% CI ‐0.96 to ‐0.77; I² = 18%) without significant heterogeneity in the analysis.
End of treatment serum phosphorous
Cinacalcet had little or no effect on end of treatment serum phosphorous levels (Analysis 1.18 (8 studies, 2300 participants): MD ‐0.23 mg/dL, 95% CI ‐0.58 to 0.12) with marked heterogeneity in treatment effects between studies (P < 0.00001, I² = 88%).
End of treatment serum calcium by phosphorous product
Cinacalcet significantly lowered the serum calcium by phosphorous product (Analysis 1.19 (8 studies, 2395 participants): MD ‐5.25 mg²/dL², 95% CI ‐9.16 to ‐1.34) with marked heterogeneity in treatment effects between studies (P < 0.00001, I² = 91%).
Bone outcomes
Effects of calcimimetic therapy on bone structure and function was not consistently reported in available studies (Analysis 1.20; Analysis 1.21).
Sensitivity analyses
When we excluded the three studies in which randomised co‐intervention strategies for vitamin D compounds were not comparable between treatment arms, we observed similar treatment estimates in dialysis patients (all‐cause mortality: RR, 0.97, 95% CI 0.89 to 1.05; cardiovascular mortality: RR 0.95, 95% CI 0.84 to 1.08; hypocalcaemia: RR 6.72, 95% CI 4.88 to 9.25; nausea: RR 1.89, 95% CI 1.38 to 2.60; vomiting: RR 1.98 95% CI 1.71 to 2.30), although risks of hypercalcaemia became less certain (RR 0.88, 95% CI 0.55 to 1.41).
Absolute treatment effects
Estimated absolute treatment effects of cinacalcet (taking into consideration baseline event rates) combined with an overall grading of evidence quality are summarised in the summary of findings Table for the main comparison. Overall, treating 1000 patients with GFR category G5 (treated with dialysis) with cinacalcet might be expected to prevent three experiencing parathyroidectomy, and 60 and 150 more to experience hypocalcaemia and nausea respectively, without altering mortality. In adults with less severe kidney disease (GFR category G3a to G5), treating 1000 patients for one year would result in approximately 300 and 120 experiencing hypocalcaemia and nausea respectively, without evidence for benefits on mortality or parathyroidectomy.
Discussion
Summary of main results
High‐ to moderate‐quality evidence for cinacalcet treatment in adults with GFR category G5 treated with dialysis and elevated PTH levels is available in 16 RCTs (6,988 participants). Routine cinacalcet therapy in dialysis patients at doses between 30 and 180 mg/d decreases serum PTH levels (281 pg/mL) and infrequently reduces surgical parathyroidectomy, but has little or no effect on total mortality, uncertain effects on cardiovascular‐related death, and is commonly associated with adverse events including nausea, vomiting, hypocalcaemia and diarrhoea. Evidence for adults with GFR category G3a to G4 is scant and generally low or very low quality. Because of lower absolute risks of parathyroidectomy in earlier stages of CKD, the benefits of cinacalcet identified by studies in dialysis populations are likely to be smaller if generalised to people who have less severe CKD. Data for adults with a functioning kidney transplant and those treated with peritoneal dialysis were largely absent. It should be noted that adverse treatment effects including nausea, vomiting and hypocalcaemia may have been transient and additional information about patient experiences of these outcomes would inform clinical decision‐making.
Although it is possible that routine cinacalcet prescribing has a beneficial effect on all‐cause mortality, consistent treatment effects across all available studies suggest that, at best, any benefit for mortality is likely to be small. Given that lag censoring analyses for outcomes (where data were censored six months after patients stopped using the study drug) were reported as prespecified secondary analyses in the EVOLVE study 2007 and suggested a potential benefit for cinacalcet on total mortality (hazard ratio 0.83, 95% CI 0.73 to 0.96), it might be argued that additional studies of cinacalcet are now needed or that cinacalcet lowers mortality. However, we suggest that these lag‐censoring approaches were secondary analyses only, and that existing evidence for all‐cause mortality is high‐quality according to GRADE criteria (Guyatt 2008). This means that additional studies are unlikely to change the treatment estimates we observed or our confidence in these estimates.
By contrast, evidence for GFR categories G3a to G4 (estimated GFR 15 to 60 mL/min/1.73 m²) was low or very low quality indicating that further data for this specific group of patients would be informative.
Overall completeness and applicability of evidence
Despite widespread adoption into clinical practice and approval by the FDA, the efficacy and tolerability of cinacalcet in available studies is now better understood and suggests routine cinacalcet therapy has little or no benefit for dialysis patients. Notably, all available studies of cinacalcet investigating cinacalcet used it as "routine" or "first‐line" therapy in patients with elevated serum PTH levels. The findings in these studies therefore do not assess the possibility that cinacalcet may improve patient outcomes when used as treatment of elevated PTH levels resistant to other therapy including vitamin D compounds and phosphorous binders. The National Health Service National Institute for Health and Clinical Excellence (NICE) Clinical practice guidelines have suggested that cinacalcet should be used when serum PTH levels are very high, other treatments have been ineffective and when surgical parathyroidectomy is contraindicated (NICE 2007). However, we advise caution in this clinical setting, as available studies for this approach to cinacalcet therapy are not available and, in particular, outcomes and adverse events comparing parathyroidectomy versus cinacalcet treatment are not available.
This updated review has provided additional evidence for patient‐level outcomes, beyond surrogate outcomes of efficacy that dominated earlier studies and our earlier review (Strippoli 2006a). A surrogate is a measurable outcome such as a laboratory or imaging test, which is responsive to the effect of an intervention (e.g. reduction of total cholesterol with statins) and is also causally associated with a clinically important outcome (e.g. reduction in all‐cause or cardiovascular mortality with statins). A valid surrogate end‐point therefore captures the full effect of an intervention but earlier in the causal chain of events (Bucher 1999; Psaty 1999; Temple 1999). Surrogate end points are used in preference to hard end points in RCTs because cost and sample size can be reduced and feasibility increased substantially. Compared with hard endpoints, surrogates allow for shorter study duration, and either occur more commonly or are continuous measures and so more sensitive to differences in treatment. In kidney disease, surrogates are commonly used in studies, and include dialysis adequacy, haemoglobin levels, left ventricular hypertrophy, and episodes of acute rejection, which have been the basis for the regulatory approval and clinical use of various drugs (Besarab 1998; Borrows 2004; Churchill 1997; McMahon 2004). However, not all surrogates are valid proxies of clinically important patient‐entered outcomes. In order for a surrogate to be valid, two criteria must be met. First, there must be a strong, independent and consistent association between the surrogate and the clinically important outcome, which comes from observational studies. For calcium, phosphorous and PTH this criterion has been met from a number of large‐scale cohort and cross sectional studies (Avram 1996; Ganesh 2001; Kestenbaum 2005; Stevens 2004). Second, and more importantly, for a surrogate to be valid there must also be evidence that using an intervention changes a surrogate (e.g. reduction of PTH with a calcimimetic) and results in an expected change in the patient‐based outcome distal to the surrogate in the same causal pathway for the disease in question (e.g. reduction of deaths with a calcimimetic). This criterion requires a RCT, which measures both the surrogate and the hard endpoint. In the available studies for cinacalcet, we have shown that despite large and clinically‐relevant improvements in serum PTH and serum calcium levels, mortality is not reduced and effects on cardiovascular mortality remain uncertain, suggesting that serum PTH and calcium are not sufficiently proven to be valid proxies of hard patient endpoints in studies of novel agents in CKD.
To date, cinacalcet has uncertain effects on fracture in CKD. The treatment effect we observed (RR 0.53) was similar in magnitude to, but less certain than the risk estimate measured in a pooled analysis of 4 similarly designed, RCTs of cinacalcet comprising 1184 participants with GFR category G5 treated with dialysis and serum PTH levels of 300 pg/mL or greater, in which the reported risk of fracture was 0.46 (95% CI 0.22 to 0.95) (Cunningham 2005a). It was unclear in that publication which studies were included in the analysis, and which included data for extended treatment in two studies that included only about half of the initially randomised participants. While it is possible that cinacalcet has beneficial effects on fracture, at present available evidence provides uncertain estimates of effect.
At this stage, data for cinacalcet in adults with earlier stages of CKD, peritoneal dialysis patients and those with a functioning kidney transplant are scarce or absent. There is currently no strong evidence to support the use of cinacalcet in these clinical settings.
Quality of the evidence
Overall, based on GRADE criteria considering risks of bias in individual studies consistency of the evidence between studies, directness of the evidence to clinical populations, precision of estimates and publication bias, (summary of findings Table for the main comparison) evidence for cinacalcet in adults with GFR category G5 treated with dialysis (mortality, parathyroidectomy, hypocalcaemia, and nausea) is of high or moderate quality. High quality evidence suggests "further research is very unlikely to change our confidence in the estimate of treatment effect" and moderate quality evidence is "further research is likely to have an important impact on our confidence in the estimate of effect and may change the estimate".
Information for adults with less severe CKD GFR category G3a to G4 is of low or very low quality. This means that further research is very likely to have an important impact on our confidence in the estimate of effect and is likely to change the estimate. Very low quality evidence suggests any estimate of effect is very uncertain.
Potential biases in the review process
First, to illustrate the importance of prospective registration of studies recently adopted by all major biomedical journals and kidney journals, in order to ensure that all studies evaluating an intervention can be known and linked with publications to avoid publication bias (Simes 1986) and duplication bias (Egger 1998), we found it very difficult to link publications with specific studies. This was an issue with the first publication of this review in 2006 and continues with this update. While we believe we have eighteen unequivocally separate studies with unique data, we found numerous reports for which we believe data were duplicates of that already available in full‐text published reports. Duplicate reporting is known to be associated with an overestimation of true treatment effects and spurious precision if the studies are incorporated in meta‐analysis (Egger 1998). Prospective registration with a unique identification number for each study would avoid this; despite the recommendation for study registration, only 50% of the 10 included studies published after 2005 (when this requirement commenced) had clearly reported studies registration in the primary published report.
Second, sponsor involvement in authorship, data management and statistical analysis may influence study reporting and lead to a greater likelihood of positive results (Lexchin 2003). The sponsor played a role in the authorship or analysis of over 80% of available studies for cinacalcet suggesting a potential for over‐estimation of treatment benefits.
Third, the investigators of one large study (Block 2004a) combined the results of two separate but similar studies, a method used by the CLASS investigators that has been widely criticized (Juni 2003). When the cinacalcet group of one study is compared both with the placebo group of the same study (random allocation) but also the placebo group of the other study (non‐random allocation), outcome differences between the cinacalcet and placebo groups may be due to differences in study populations or co‐interventions; which are unknown and therefore cannot be adjusted for. Having identical study designs does not prevent these effects. Such study results would be better reported separately. Data could then be combined using meta‐analysis to provide a summary weighted estimate of the effects shown in the individual studies.
Agreements and disagreements with other studies or reviews
This review disagrees with the findings of a pooled analyses of four studies of cinacalcet reported in 2005 (Cunningham 2005a) comprising 1184 dialysis patients with an elevated serum PTH level. That study combined four studies without meta‐analysis and evaluated parathyroidectomy, fracture, hospitalisations and mortality to find marked reductions in the risk of parathyroidectomy (RR 0.07, 95% CI 0.01 to 0.55), fracture (RR 0.46, 95% CI 0.22 to 0.95) and cardiovascular hospitalisation (RR 0.61, 95% CI 0.43 to 0.86). These findings were in contrast to our meta‐analysis in 2006 which found no significant effects on patient‐based endpoints (Strippoli 2006a). Our current update which includes all available studies, indicates a similar but more uncertain effect on fracture, a smaller effect on parathyroidectomy, and could not provide estimates for hospitalisation.
Study flow diagram.

Risk of bias summary: review authors' judgements about each risk of bias item for each included study.
Risk of bias graph: review authors' judgements about each risk of bias item presented as percentages across all included studies.

Comparison 1 Calcimimetics versus placebo/no treatment, Outcome 1 All‐cause mortality.
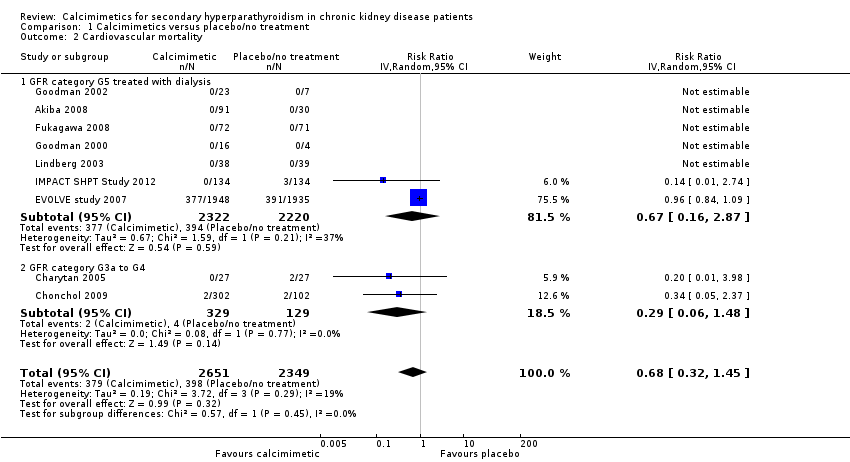
Comparison 1 Calcimimetics versus placebo/no treatment, Outcome 2 Cardiovascular mortality.
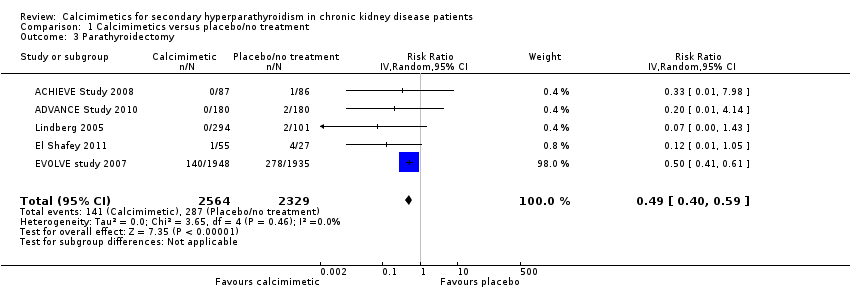
Comparison 1 Calcimimetics versus placebo/no treatment, Outcome 3 Parathyroidectomy.

Comparison 1 Calcimimetics versus placebo/no treatment, Outcome 4 Fractures.

Comparison 1 Calcimimetics versus placebo/no treatment, Outcome 5 Hypocalcaemia.

Comparison 1 Calcimimetics versus placebo/no treatment, Outcome 6 Hypercalcaemia.
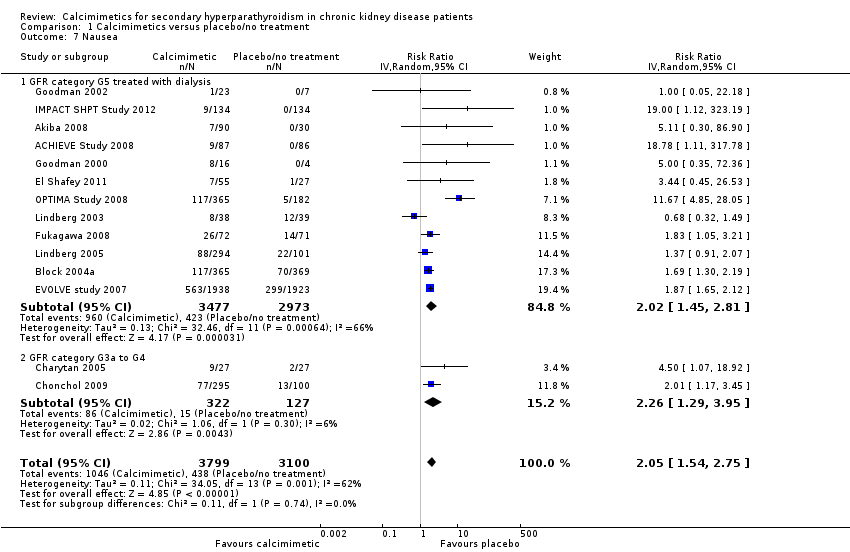
Comparison 1 Calcimimetics versus placebo/no treatment, Outcome 7 Nausea.

Comparison 1 Calcimimetics versus placebo/no treatment, Outcome 8 Vomiting.

Comparison 1 Calcimimetics versus placebo/no treatment, Outcome 9 Diarrhoea.
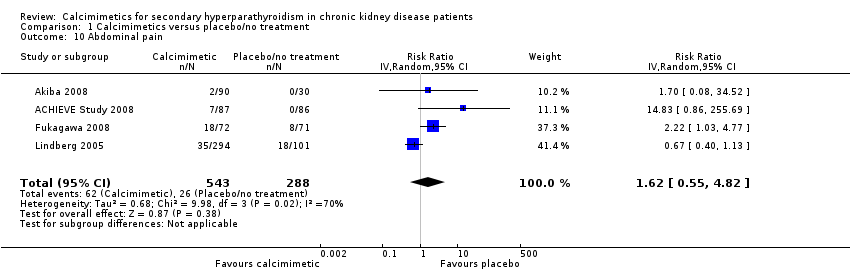
Comparison 1 Calcimimetics versus placebo/no treatment, Outcome 10 Abdominal pain.
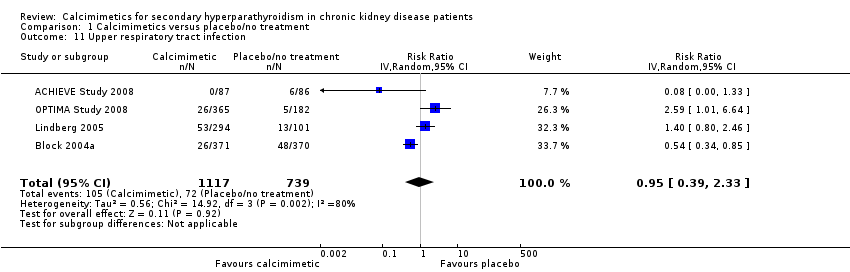
Comparison 1 Calcimimetics versus placebo/no treatment, Outcome 11 Upper respiratory tract infection.

Comparison 1 Calcimimetics versus placebo/no treatment, Outcome 12 Asthenia, muscle weakness or paraesthesia.

Comparison 1 Calcimimetics versus placebo/no treatment, Outcome 13 Dyspnoea.

Comparison 1 Calcimimetics versus placebo/no treatment, Outcome 14 Headache.

Comparison 1 Calcimimetics versus placebo/no treatment, Outcome 15 Achievement of PTH target.
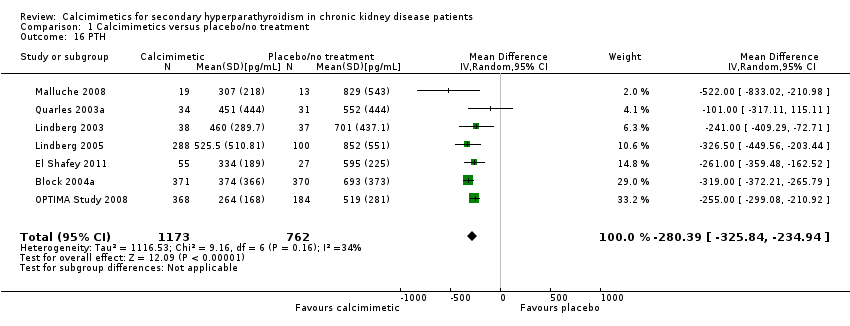
Comparison 1 Calcimimetics versus placebo/no treatment, Outcome 16 PTH.

Comparison 1 Calcimimetics versus placebo/no treatment, Outcome 17 Serum calcium.
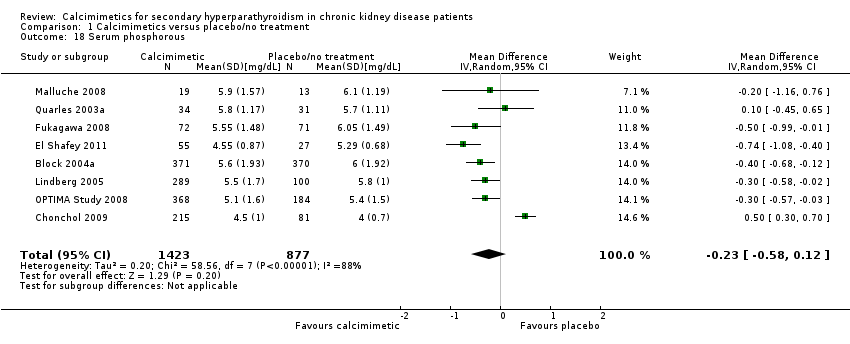
Comparison 1 Calcimimetics versus placebo/no treatment, Outcome 18 Serum phosphorous.

Comparison 1 Calcimimetics versus placebo/no treatment, Outcome 19 Calcium x phosphorous.
| Cinacalcet plus standard therapy versus placebo or standard therapy or both for patients with CKD and elevated PTH levels | |||||
| Patient or population: adults with CKD | |||||
| Outcomes (median treatment duration) | *Best estimate of control group risk | Relative effect | No of participants | Absolute effect per one year of treatment for 1000 treated (95%CI) | Quality of the evidence |
| GFR category G5 treated with dialysis | |||||
| All‐cause mortality (8 months) | 200 per 1000 | RR 0.97 (0.89 to 95) | 6893 (14) | 6 fewer (22 fewer to 10 more) | ⊕⊕⊕⊕ |
| Parathyroidectomy (9 months) | 7 per 1000 | RR 0.49 (0.40 to 0.59) | 4893 (5) | 3 fewer (4 fewer to 3 fewer) | ⊕⊕⊕⊕ |
| Hypocalcaemia (7 months) | 10 per 1000 | RR 6.98 (5.10 to 9.53) | 6415 (12) | 60 more (41 more to 85 more) | ⊕⊕⊕⊕ |
| Nausea (7 months) | 150 per 1000 | RR 2.02 (1.45 to 2.81) | 6450 (12) | 153 more (68 more to 272 more) | ⊕⊕⊕ |
| GFR category G3a‐G4 | |||||
| All‐cause mortality (8 months) | 25 per 1000 | RR 0.29 (0.06 to 1.48) | 458 (2) | 18 fewer (23 fewer to 12 more) | ⊕⊕ |
| Parathyroidectomy (9 months) | 7 per 1000 | RR not estimable | 0 (0) | Not estimable | nil |
| Hypocalcaemia (7 months) | 10 per 1000 | RR 31.9 (5.28 to 192.6) | 449 (2) | 310 more (43 more to 1910 more) | ⊕ |
| Nausea (7 months) | 100 per 1000 | RR 2.26 (1.29 to 3.95) | 449 (2) | 126 more (29 more to 295 more) | ⊕⊕ low |
| *The basis for the assumed risk (e.g. the median control group risk across studies) is provided in footnotes. The corresponding risk (and its 95% confidence interval) is based on the assumed risk in the comparison group and the relative effect of the intervention (and its 95% CI). Approximate absolute event rates of outcomes per year are derived from previously published cohort studies and registry data for the outcomes of all‐cause mortality (Weiner 2006) and parathyroidectomy (Kestenbaum 2004) or event rates in the control arm of contributing studies for outcomes of hypocalcaemia and nausea. Absolute numbers of people who had chronic kidney disease with mortality or parathyroidectomy events avoided or nausea or hypocalcaemia events caused per 1000 treated were calculated from the risk estimate for the outcome (and associated 95% confidence interval) obtained from meta‐analysis of placebo‐controlled studies together with the absolute population risk estimates. | |||||
| GRADE Working Group grades of evidence | |||||
| CKD ‐ chronic kidney disease; GFR ‐ glomerular filtration rate; PTH‐ parathyroid hormone | |||||
| Prognosis of CKD by GFR and albuminuria categories: KDIGO 2012 | Persistent albuminuria categories Description and range | |||||
| A1 Normal to mildly increased | A2 Moderately increased | A3 Severely increased | ||||
| < 30 mg/g < 3 mg/mmol | 30 to 300 mg/g 3 to 30 mg/mmol | > 300 mg/g > 30 mg/mmol | ||||
| GFR categories (mL/min per 1.73 m²) Description and range | G1 G2 | Normal or high Mildly decreased | > 90 60 to 89 | Low | Moderate | High |
| G3a | Mild to moderately decreased | 45 to 59 | Moderate | High | Very high | |
| G3b | Moderate to severely decreased | 30 to 44 | High | Very high | ||
| G4 | Severely decreased | 15 to 29 | Very high | |||
| G5 | Kidney failure | < 15 | ||||
| Description of the Kidney Disease: Improving Global Outcomes (KDIGO) nomenclature for chronic kidney disease used in this review (see the full KDIGO CKD 2013 for additional information). GFR ‐ glomerular filtration rate | ||||||
| Study | Participants (treatment/control) | PTH level triggering reduction in cinacalcet dose | Calcium level triggering reduction in cinacalcet dose | Hypocalcaemia (study endpoint) | Hypercalcaemia (study endpoint) |
| 173 (87/86) | < 150 pg/mL | Symptoms of hypocalcaemia or < 7.5 mg/dL | < 8.4 mg/dL | > 10.2 mg/dL | |
| 360 (180/180) | ‐‐ | ‐‐ | Hypocalcaemia | Hypercalcaemia | |
| 121 (91/30) | ‐‐ | ‐‐ | Hypocalcaemia | ‐‐ | |
| 741 (371/370) | < 100 pg/mL | Symptoms of hypocalcaemia or < 7.8 mg/dL | Withdrawal due to hypocalcaemia | ‐‐ | |
| 54 (27/27) | ‐‐ | Dose‐related adverse event or < 7.8 mg/dL | < 8.4 mg/dL | ‐‐ | |
| 404 (302/102) | PTH < 35 pg/mL for stage 3 and < 70 pg/mL for stage 4 | Symptoms of hypocalcaemia or < 7.5 mg/dL | < 7.5 mg/dL | ‐‐ | |
| 82 (55/27) | < 92 pg/mL | Dose‐related adverse event or < 7.5 mg/dL | Hypocalcaemia | ‐‐ | |
| 3883 (1948/1935) | < 150 pg/mL | < 7.5 mg/dL and/or symptoms of hypocalcaemia | < 8.0 mg/dL or < 7.5 mg/dL (unclear which threshold reported in study) | > 10.5 mg/dL | |
| 145 (72/73) | Investigators’ discretion or excessive decrease in PTH level | Investigators’ discretion or < 7.5 mg/dL | Hypocalcaemia | ‐‐ | |
| 21 (16/5) | ‐‐ | Symptoms of hypocalcaemia or ionised calcium < 4 mg/dL | Ionized calcium < 4 mg/dL | ‐‐ | |
| 30 (23/7) | ‐‐ | 8.0 mg/dL | < 8.0 mg/dL | ‐‐ | |
| 23 (17/6) | ‐‐ | ‐‐ | ‐‐ | ‐‐ | |
| 264 (134/134) | < 150 pg/mL | < 7.5 mg/dL | <8,.4 mg/dL | > 10.5 mg/dL | |
| 78 (39/39) | < 100 pg/mL | Symptoms of hypocalcaemia or < 7.8 mg/dL | < 7.5 mg/dL | ‐‐ | |
| 395 (294/101) | ‐‐ | Symptoms of hypocalcaemia or < 7.8 mg/dL | ‐‐ | ‐‐ | |
| 32 (19/13) | < 100 pg/mL | Symptoms of hypocalcaemia or < 7.8 mg/dL | ‐‐ | ‐‐ | |
| 552 (368/184) | < 150 pg/mL | < 8.0 mg/dL | < 7.5 mg/dL | ‐‐ | |
| 71 (36/35) | < 100 pg/mL | < 7.8 mg/dL | ‐‐ | ‐‐ | |
| PTH ‐ parathyroid hormone | |||||
| Outcome or subgroup title | No. of studies | No. of participants | Statistical method | Effect size |
| 1 All‐cause mortality Show forest plot | 16 | 7351 | Risk Ratio (IV, Random, 95% CI) | 0.96 [0.89, 1.05] |
| 1.1 GFR category G5 treated with dialysis | 14 | 6893 | Risk Ratio (IV, Random, 95% CI) | 0.97 [0.89, 1.05] |
| 1.2 GFR category G3a to G4 | 2 | 458 | Risk Ratio (IV, Random, 95% CI) | 0.29 [0.06, 1.48] |
| 2 Cardiovascular mortality Show forest plot | 9 | 5000 | Risk Ratio (IV, Random, 95% CI) | 0.68 [0.32, 1.45] |
| 2.1 GFR category G5 treated with dialysis | 7 | 4542 | Risk Ratio (IV, Random, 95% CI) | 0.67 [0.16, 2.87] |
| 2.2 GFR category G3a to G4 | 2 | 458 | Risk Ratio (IV, Random, 95% CI) | 0.29 [0.06, 1.48] |
| 3 Parathyroidectomy Show forest plot | 5 | 4893 | Risk Ratio (IV, Random, 95% CI) | 0.49 [0.40, 0.59] |
| 4 Fractures Show forest plot | 2 | 3965 | Risk Ratio (IV, Random, 95% CI) | 0.52 [0.12, 2.27] |
| 5 Hypocalcaemia Show forest plot | 14 | 6864 | Risk Ratio (IV, Random, 95% CI) | 7.38 [5.43, 10.03] |
| 5.1 GFR category G5 treated with dialysis | 12 | 6415 | Risk Ratio (IV, Random, 95% CI) | 6.98 [5.10, 9.53] |
| 5.2 GFR category G3a to G4 | 2 | 449 | Risk Ratio (IV, Random, 95% CI) | 31.90 [5.28, 192.60] |
| 6 Hypercalcaemia Show forest plot | 4 | 4662 | Risk Ratio (IV, Random, 95% CI) | 0.23 [0.05, 0.97] |
| 7 Nausea Show forest plot | 14 | 6899 | Risk Ratio (IV, Random, 95% CI) | 2.05 [1.54, 2.75] |
| 7.1 GFR category G5 treated with dialysis | 12 | 6450 | Risk Ratio (IV, Random, 95% CI) | 2.02 [1.45, 2.81] |
| 7.2 GFR category G3a to G4 | 2 | 449 | Risk Ratio (IV, Random, 95% CI) | 2.26 [1.29, 3.95] |
| 8 Vomiting Show forest plot | 10 | 6718 | Risk Ratio (IV, Random, 95% CI) | 1.95 [1.74, 2.18] |
| 8.1 GFR category G5 treated with dialysis | 9 | 6323 | Risk Ratio (IV, Random, 95% CI) | 1.97 [1.73, 2.24] |
| 8.2 GFR category G3a to G4 | 1 | 395 | Risk Ratio (IV, Random, 95% CI) | 1.77 [0.90, 3.48] |
| 9 Diarrhoea Show forest plot | 8 | 5639 | Risk Ratio (IV, Random, 95% CI) | 1.15 [1.02, 1.29] |
| 10 Abdominal pain Show forest plot | 4 | 831 | Risk Ratio (IV, Random, 95% CI) | 1.62 [0.55, 4.82] |
| 11 Upper respiratory tract infection Show forest plot | 4 | 1856 | Risk Ratio (IV, Random, 95% CI) | 0.95 [0.39, 2.33] |
| 12 Asthenia, muscle weakness or paraesthesia Show forest plot | 5 | 1379 | Risk Ratio (IV, Random, 95% CI) | 1.55 [0.93, 2.58] |
| 12.1 Asthenia | 2 | 790 | Risk Ratio (IV, Random, 95% CI) | 1.54 [0.26, 8.98] |
| 12.2 Muscle weakness or paraesthesia | 4 | 589 | Risk Ratio (IV, Random, 95% CI) | 1.78 [1.00, 3.14] |
| 13 Dyspnoea Show forest plot | 2 | 250 | Risk Ratio (IV, Random, 95% CI) | 1.02 [0.49, 2.12] |
| 14 Headache Show forest plot | 3 | 1115 | Risk Ratio (IV, Random, 95% CI) | 1.11 [0.65, 1.91] |
| 15 Achievement of PTH target Show forest plot | 11 | 2853 | Risk Ratio (IV, Random, 95% CI) | 3.06 [1.89, 4.98] |
| 16 PTH Show forest plot | 7 | 1935 | Mean Difference (IV, Random, 95% CI) | ‐280.39 [‐325.84, ‐234.94] |
| 17 Serum calcium Show forest plot | 7 | 1556 | Mean Difference (IV, Random, 95% CI) | ‐0.87 [‐0.96, ‐0.77] |
| 18 Serum phosphorous Show forest plot | 8 | 2300 | Mean Difference (IV, Random, 95% CI) | ‐0.23 [‐0.58, 0.12] |
| 19 Calcium x phosphorous Show forest plot | 8 | 2395 | Mean Difference (IV, Random, 95% CI) | ‐5.25 [‐9.16, ‐1.34] |