Bifosfonatos para el cáncer de próstata avanzado
Referencias
Referencias de los estudios incluidos en esta revisión
Referencias de los estudios excluidos de esta revisión
Referencias adicionales
Referencias de otras versiones publicadas de esta revisión
Characteristics of studies
Characteristics of included studies [ordered by study ID]
Ir a:
| Methods | Three randomized single‐blinded controlled studies | |
| Participants | Prostatic carcinoma. Bone metastasis (radiographic). Pain requirement: not specified. | |
| Interventions | Study 1: Placebo (n=6) versus Clodronate i.v. infusion 300mg /day x 2 weeks (n=7) | |
| Outcomes | Study 1: Mean pain score and analgesic consumption at 0,1,2,4 week. No S.D. provided. | |
| Notes | ||
| Methods | Randomized double‐blind placebo‐controlled study | |
| Participants | Prostate cancer bone metastases. | |
| Interventions | Active: Clodronte oral 2080mg/day up to 3 years | |
| Outcomes | Longer time to first regular use of analgesics in active group, HR = 1.12 (95%CI = 0.86‐1.45, P=0.41, data not shown) | |
| Notes | ||
| Methods | Randomized placebo‐controlled parallel study. Blinding not mentioned. | |
| Participants | Prostate cancer refractory to at least one hormonal therapy. Bone metastases required. Pain required (with daily use of analgesics). | |
| Interventions | Active arm: Clodronate oral 3.2g/day for 1 month then 1.6g/day for 5 months. Total 6 months. | |
| Outcomes | No pain (doctor evaluation) at 0, 1, 3, 6 months: clodronate 0/36 9/29 5/22 3/11; placebo 0/39 5/34 1/24 1/13. | |
| Notes | ||
| Methods | Randomized double‐blind controlled study | |
| Participants | Prostate cancer. Progressive bone disease. Castration testosterone levels. Hormonal treatment stopped before randomization. | |
| Interventions | Active arm (n=115): clodronate 1500mg i.v. q3w until disease progression in responding patients. | |
| Outcomes | Palliative response: active 49/115, control 41/112. | |
| Notes | ||
| Methods | Randomized controlled study | |
| Participants | Prostate cancer, hormone refractory. | |
| Interventions | Active arm: oral clodronate 3.2g/day x 1 month then 1.6g/day x 5 months; extramustine 280mg twice daily | |
| Outcomes | Percentage of patient free from bone pain: no significant difference, SD not reported. | |
| Notes | ||
| Methods | Randomized double‐blind placebo‐controlled study | |
| Participants | Prostate cancer (failed hormonal therapy). Bone metastases required. No pain required. | |
| Interventions | Active arm: clodronate (i.v. 300mg/day x 5days followed by oral 1.6g/day x 12 months) | |
| Outcomes | Pain: no significant different in any pain score. Proportion of patient with no pain at 1 month: active 10/28, control 6/29. | |
| Notes | ||
| Methods | Randomized double blind placebo‐controlled study. | |
| Participants | Prostate cancer (hormone refractory). Bone metastases required. Pain not required. | |
| Interventions | Active arm 1: zoledronic acid 4mg, 214 patients | |
| Outcomes | Pain score, mean change (95% confidence intervals) at 3 months: active1 ‐0.028 (0.22), active2 ‐0.04 (0.21), control 0.42 (0.22) | |
| Notes | ||
| Methods | Randomized double‐blind, placebo‐controlled trial. | |
| Participants | Prostate cancer (hormone refractory). Bone metastases. Pain required. | |
| Interventions | Active arm: Pamidronate 90mg in 250ml D5 iv infusion over 2h q3w x 27 weeks. | |
| Outcomes | Mean Pain change (average BPI) at week 9: active ‐0.61 SE 0.17, n=147; placebo: ‐0.44 SE 0.16 n=154 | |
| Notes | Data pooled from two trials | |
| Methods | Randomized double‐blind placebo‐controlled study | |
| Participants | Prostate cancer (previous hormone therapy). Bone metastases required (documented by bone scan). Pain required. | |
| Interventions | Active 1 ‐ sodium etidronate 7.5mg/kg x 3 days then oral sodium etidronate 200mg bid | |
| Outcomes | Major pain improvement: active1 0/14, active2 2/14, active3 1/15, control 1/14 | |
| Notes | ||
| Methods | Randomized double‐blind placebo‐controlled study | |
| Participants | Prostate cancer, hormone refractory, bone metastases. | |
| Interventions | Active arm: Clodronate 300mg/day iv x 3 days then Clodroate 1600mg bd oral for 4 weeks | |
| Outcomes | Baseline mean overall pain and mean pain during the best and worst period reported. | |
| Notes | Study closed early due to lack of accrual. | |
Characteristics of excluded studies [ordered by study ID]
Ir a:
| Study | Reason for exclusion |
| No control arm. | |
| No control arm. | |
| No control arm. | |
| No control arm. | |
| Randomized controlled study with histomorphometric outcomes. Pain not one of the outcomes. | |
| Nonrandomized study | |
| Nonrandomized study | |
| Randomised study comparing i.v. pamidronate with oral clodronate in a mixed tumour population. Not specific for prostate cancer. | |
| No control arm. | |
| Randomized controlled study with biochemical outcomes, clinical outcomes including pain were reported in another article by Strang 1997, one of the included studies. | |
| No control arm. | |
| Randomized controlled study with histomorphometric outcomes. Pain not one of the outcomes. | |
| No control arm. | |
| No control arm. |
Data and analyses
| Outcome or subgroup title | No. of studies | No. of participants | Statistical method | Effect size |
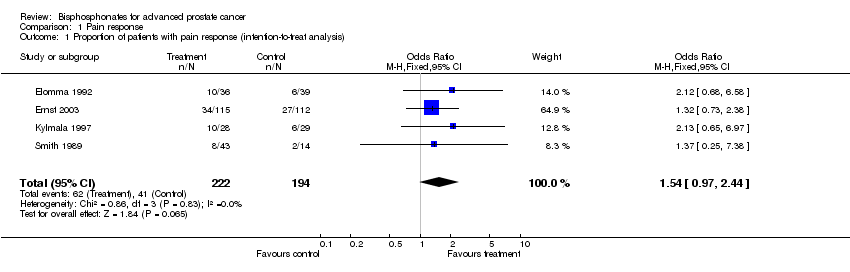
| 1 Proportion of patients with pain response (intention‐to‐treat analysis) Show forest plot | 4 | 416 | Odds Ratio (M‐H, Fixed, 95% CI) | 1.54 [0.97, 2.44] |
| Analysis 1.1  Comparison 1 Pain response, Outcome 1 Proportion of patients with pain response (intention‐to‐treat analysis). | ||||
| 2 Proportion of patients with pain response (evaluable patients as defined by original studies) Show forest plot | 4 | 374 | Odds Ratio (M‐H, Fixed, 95% CI) | 1.64 [1.02, 2.61] |
| Analysis 1.2  Comparison 1 Pain response, Outcome 2 Proportion of patients with pain response (evaluable patients as defined by original studies). | ||||
| 3 Mean pain change Show forest plot | 2 | 723 | Std. Mean Difference (IV, Fixed, 95% CI) | ‐1.58 [‐1.75, ‐1.41] |
| Analysis 1.3  Comparison 1 Pain response, Outcome 3 Mean pain change. | ||||
| Outcome or subgroup title | No. of studies | No. of participants | Statistical method | Effect size |
| 1 Proportion of patients with decreased analgesic consumption Show forest plot | 4 | 416 | Odds Ratio (M‐H, Fixed, 95% CI) | 1.27 [0.82, 1.98] |
| Analysis 2.1  Comparison 2 Analgesic consumption, Outcome 1 Proportion of patients with decreased analgesic consumption. | ||||
| Outcome or subgroup title | No. of studies | No. of participants | Statistical method | Effect size |
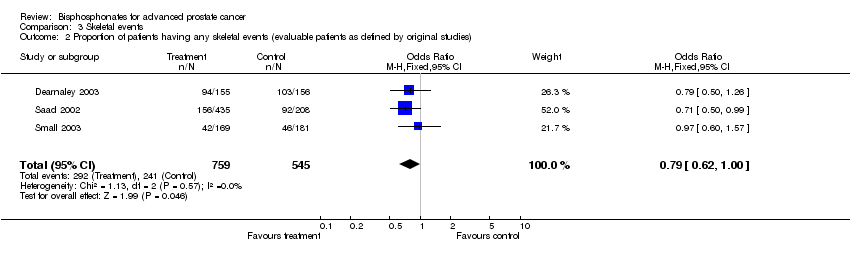
| 1 Proportion of patients having any skeletal events Show forest plot | 3 | 1332 | Odds Ratio (M‐H, Fixed, 95% CI) | 0.79 [0.62, 1.00] |
| Analysis 3.1  Comparison 3 Skeletal events, Outcome 1 Proportion of patients having any skeletal events. | ||||
| 2 Proportion of patients having any skeletal events (evaluable patients as defined by original studies) Show forest plot | 3 | 1304 | Odds Ratio (M‐H, Fixed, 95% CI) | 0.79 [0.62, 1.00] |
| Analysis 3.2  Comparison 3 Skeletal events, Outcome 2 Proportion of patients having any skeletal events (evaluable patients as defined by original studies). | ||||
| 3 Proportion of patients having any skeletal events (evaluable patients, selecting 8/4mg arm from Saad 2002) Show forest plot | 3 | 1090 | Odds Ratio (M‐H, Fixed, 95% CI) | 0.84 [0.65, 1.08] |
| Analysis 3.3  Comparison 3 Skeletal events, Outcome 3 Proportion of patients having any skeletal events (evaluable patients, selecting 8/4mg arm from Saad 2002). | ||||
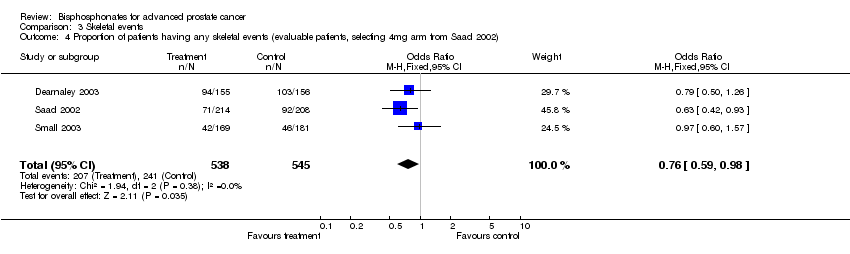
| 4 Proportion of patients having any skeletal events (evaluable patients, selecting 4mg arm from Saad 2002) Show forest plot | 3 | 1083 | Odds Ratio (M‐H, Fixed, 95% CI) | 0.76 [0.59, 0.98] |
| Analysis 3.4  Comparison 3 Skeletal events, Outcome 4 Proportion of patients having any skeletal events (evaluable patients, selecting 4mg arm from Saad 2002). | ||||
| 5 Proportion of patients having pathologic fractures Show forest plot | 2 | 1021 | Odds Ratio (M‐H, Fixed, 95% CI) | 0.75 [0.53, 1.06] |
| Analysis 3.5  Comparison 3 Skeletal events, Outcome 5 Proportion of patients having pathologic fractures. | ||||
| 6 Proportion of patients having vertebral fractures Show forest plot | 2 | 1021 | Odds Ratio (M‐H, Fixed, 95% CI) | 0.65 [0.38, 1.13] |
| Analysis 3.6  Comparison 3 Skeletal events, Outcome 6 Proportion of patients having vertebral fractures. | ||||
| 7 Proportion of patients having non‐vertebral fractures Show forest plot | 2 | 1021 | Odds Ratio (M‐H, Fixed, 95% CI) | 0.74 [0.49, 1.12] |
| Analysis 3.7  Comparison 3 Skeletal events, Outcome 7 Proportion of patients having non‐vertebral fractures. | ||||
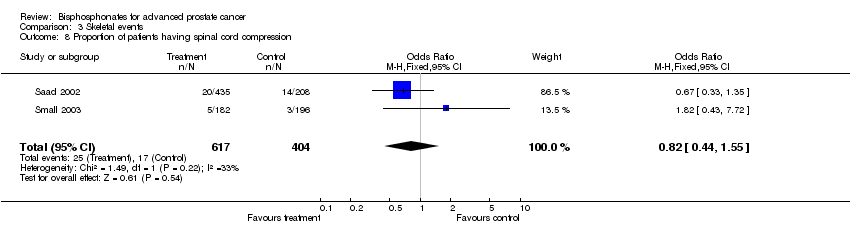
| 8 Proportion of patients having spinal cord compression Show forest plot | 2 | 1021 | Odds Ratio (M‐H, Fixed, 95% CI) | 0.82 [0.44, 1.55] |
| Analysis 3.8  Comparison 3 Skeletal events, Outcome 8 Proportion of patients having spinal cord compression. | ||||
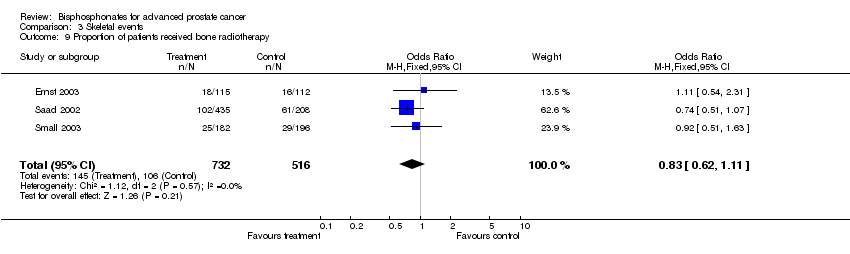
| 9 Proportion of patients received bone radiotherapy Show forest plot | 3 | 1248 | Odds Ratio (M‐H, Fixed, 95% CI) | 0.83 [0.62, 1.11] |
| Analysis 3.9  Comparison 3 Skeletal events, Outcome 9 Proportion of patients received bone radiotherapy. | ||||
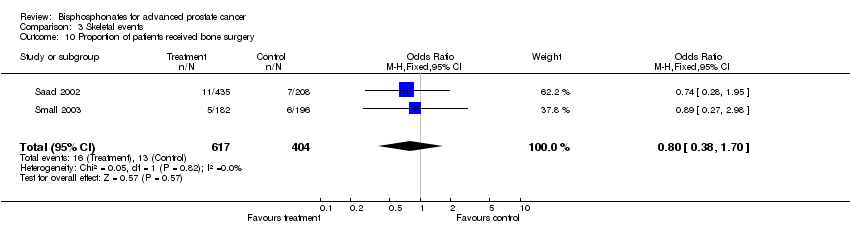
| 10 Proportion of patients received bone surgery Show forest plot | 2 | 1021 | Odds Ratio (M‐H, Fixed, 95% CI) | 0.80 [0.38, 1.70] |
| Analysis 3.10  Comparison 3 Skeletal events, Outcome 10 Proportion of patients received bone surgery. | ||||
| Outcome or subgroup title | No. of studies | No. of participants | Statistical method | Effect size |
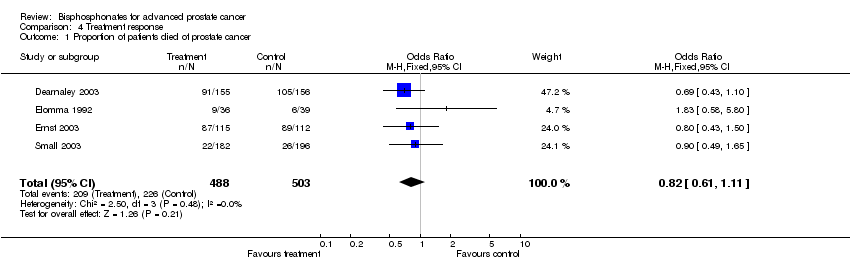
| 1 Proportion of patients died of prostate cancer Show forest plot | 4 | 991 | Odds Ratio (M‐H, Fixed, 95% CI) | 0.82 [0.61, 1.11] |
| Analysis 4.1  Comparison 4 Treatment response, Outcome 1 Proportion of patients died of prostate cancer. | ||||
| 2 Proportion of patients with disease progression Show forest plot | 2 | 538 | Odds Ratio (M‐H, Fixed, 95% CI) | 0.76 [0.53, 1.08] |
| Analysis 4.2  Comparison 4 Treatment response, Outcome 2 Proportion of patients with disease progression. | ||||
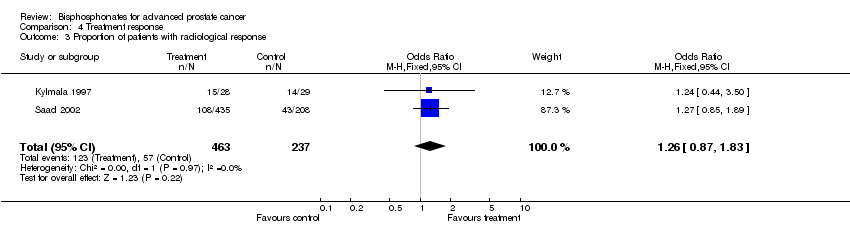
| 3 Proportion of patients with radiological response Show forest plot | 2 | 700 | Odds Ratio (M‐H, Fixed, 95% CI) | 1.26 [0.87, 1.83] |
| Analysis 4.3  Comparison 4 Treatment response, Outcome 3 Proportion of patients with radiological response. | ||||
| Outcome or subgroup title | No. of studies | No. of participants | Statistical method | Effect size |
| 1 Proportion of patients with improvement in performance status Show forest plot | 2 | 368 | Odds Ratio (M‐H, Fixed, 95% CI) | 1.53 [0.81, 2.91] |
| Analysis 5.1  Comparison 5 Performance status, Outcome 1 Proportion of patients with improvement in performance status. | ||||
| Outcome or subgroup title | No. of studies | No. of participants | Statistical method | Effect size |
| 1 Proportion of patients having nausea Show forest plot | 2 | 1021 | Odds Ratio (M‐H, Fixed, 95% CI) | 1.35 [1.02, 1.77] |
| Analysis 6.1  Comparison 6 Adverse events, Outcome 1 Proportion of patients having nausea. | ||||
| 2 Proportion of patients having vomiting Show forest plot | 2 | 1021 | Odds Ratio (M‐H, Fixed, 95% CI) | 1.22 [0.89, 1.69] |
| Analysis 6.2  Comparison 6 Adverse events, Outcome 2 Proportion of patients having vomiting. | ||||
| 3 Proportion of patients having anaemia Show forest plot | 3 | 1037 | Odds Ratio (M‐H, Fixed, 95% CI) | 1.04 [0.76, 1.41] |
| Analysis 6.3  Comparison 6 Adverse events, Outcome 3 Proportion of patients having anaemia. | ||||
| 4 Proportion of patients having bone pain Show forest plot | 2 | 1021 | Odds Ratio (M‐H, Fixed, 95% CI) | 0.93 [0.72, 1.21] |
| Analysis 6.4  Comparison 6 Adverse events, Outcome 4 Proportion of patients having bone pain. | ||||
Comparison 1 Pain response, Outcome 1 Proportion of patients with pain response (intention‐to‐treat analysis).

Comparison 1 Pain response, Outcome 2 Proportion of patients with pain response (evaluable patients as defined by original studies).

Comparison 1 Pain response, Outcome 3 Mean pain change.

Comparison 2 Analgesic consumption, Outcome 1 Proportion of patients with decreased analgesic consumption.

Comparison 3 Skeletal events, Outcome 1 Proportion of patients having any skeletal events.
Comparison 3 Skeletal events, Outcome 2 Proportion of patients having any skeletal events (evaluable patients as defined by original studies).

Comparison 3 Skeletal events, Outcome 3 Proportion of patients having any skeletal events (evaluable patients, selecting 8/4mg arm from Saad 2002).
Comparison 3 Skeletal events, Outcome 4 Proportion of patients having any skeletal events (evaluable patients, selecting 4mg arm from Saad 2002).

Comparison 3 Skeletal events, Outcome 5 Proportion of patients having pathologic fractures.

Comparison 3 Skeletal events, Outcome 6 Proportion of patients having vertebral fractures.

Comparison 3 Skeletal events, Outcome 7 Proportion of patients having non‐vertebral fractures.
Comparison 3 Skeletal events, Outcome 8 Proportion of patients having spinal cord compression.
Comparison 3 Skeletal events, Outcome 9 Proportion of patients received bone radiotherapy.
Comparison 3 Skeletal events, Outcome 10 Proportion of patients received bone surgery.
Comparison 4 Treatment response, Outcome 1 Proportion of patients died of prostate cancer.

Comparison 4 Treatment response, Outcome 2 Proportion of patients with disease progression.
Comparison 4 Treatment response, Outcome 3 Proportion of patients with radiological response.

Comparison 5 Performance status, Outcome 1 Proportion of patients with improvement in performance status.

Comparison 6 Adverse events, Outcome 1 Proportion of patients having nausea.
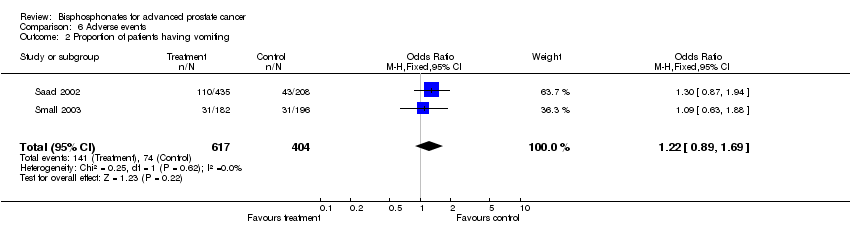
Comparison 6 Adverse events, Outcome 2 Proportion of patients having vomiting.

Comparison 6 Adverse events, Outcome 3 Proportion of patients having anaemia.

Comparison 6 Adverse events, Outcome 4 Proportion of patients having bone pain.
| Outcome or subgroup title | No. of studies | No. of participants | Statistical method | Effect size |
| 1 Proportion of patients with pain response (intention‐to‐treat analysis) Show forest plot | 4 | 416 | Odds Ratio (M‐H, Fixed, 95% CI) | 1.54 [0.97, 2.44] |
| 2 Proportion of patients with pain response (evaluable patients as defined by original studies) Show forest plot | 4 | 374 | Odds Ratio (M‐H, Fixed, 95% CI) | 1.64 [1.02, 2.61] |
| 3 Mean pain change Show forest plot | 2 | 723 | Std. Mean Difference (IV, Fixed, 95% CI) | ‐1.58 [‐1.75, ‐1.41] |
| Outcome or subgroup title | No. of studies | No. of participants | Statistical method | Effect size |
| 1 Proportion of patients with decreased analgesic consumption Show forest plot | 4 | 416 | Odds Ratio (M‐H, Fixed, 95% CI) | 1.27 [0.82, 1.98] |
| Outcome or subgroup title | No. of studies | No. of participants | Statistical method | Effect size |
| 1 Proportion of patients having any skeletal events Show forest plot | 3 | 1332 | Odds Ratio (M‐H, Fixed, 95% CI) | 0.79 [0.62, 1.00] |
| 2 Proportion of patients having any skeletal events (evaluable patients as defined by original studies) Show forest plot | 3 | 1304 | Odds Ratio (M‐H, Fixed, 95% CI) | 0.79 [0.62, 1.00] |
| 3 Proportion of patients having any skeletal events (evaluable patients, selecting 8/4mg arm from Saad 2002) Show forest plot | 3 | 1090 | Odds Ratio (M‐H, Fixed, 95% CI) | 0.84 [0.65, 1.08] |
| 4 Proportion of patients having any skeletal events (evaluable patients, selecting 4mg arm from Saad 2002) Show forest plot | 3 | 1083 | Odds Ratio (M‐H, Fixed, 95% CI) | 0.76 [0.59, 0.98] |
| 5 Proportion of patients having pathologic fractures Show forest plot | 2 | 1021 | Odds Ratio (M‐H, Fixed, 95% CI) | 0.75 [0.53, 1.06] |
| 6 Proportion of patients having vertebral fractures Show forest plot | 2 | 1021 | Odds Ratio (M‐H, Fixed, 95% CI) | 0.65 [0.38, 1.13] |
| 7 Proportion of patients having non‐vertebral fractures Show forest plot | 2 | 1021 | Odds Ratio (M‐H, Fixed, 95% CI) | 0.74 [0.49, 1.12] |
| 8 Proportion of patients having spinal cord compression Show forest plot | 2 | 1021 | Odds Ratio (M‐H, Fixed, 95% CI) | 0.82 [0.44, 1.55] |
| 9 Proportion of patients received bone radiotherapy Show forest plot | 3 | 1248 | Odds Ratio (M‐H, Fixed, 95% CI) | 0.83 [0.62, 1.11] |
| 10 Proportion of patients received bone surgery Show forest plot | 2 | 1021 | Odds Ratio (M‐H, Fixed, 95% CI) | 0.80 [0.38, 1.70] |
| Outcome or subgroup title | No. of studies | No. of participants | Statistical method | Effect size |
| 1 Proportion of patients died of prostate cancer Show forest plot | 4 | 991 | Odds Ratio (M‐H, Fixed, 95% CI) | 0.82 [0.61, 1.11] |
| 2 Proportion of patients with disease progression Show forest plot | 2 | 538 | Odds Ratio (M‐H, Fixed, 95% CI) | 0.76 [0.53, 1.08] |
| 3 Proportion of patients with radiological response Show forest plot | 2 | 700 | Odds Ratio (M‐H, Fixed, 95% CI) | 1.26 [0.87, 1.83] |
| Outcome or subgroup title | No. of studies | No. of participants | Statistical method | Effect size |
| 1 Proportion of patients with improvement in performance status Show forest plot | 2 | 368 | Odds Ratio (M‐H, Fixed, 95% CI) | 1.53 [0.81, 2.91] |
| Outcome or subgroup title | No. of studies | No. of participants | Statistical method | Effect size |
| 1 Proportion of patients having nausea Show forest plot | 2 | 1021 | Odds Ratio (M‐H, Fixed, 95% CI) | 1.35 [1.02, 1.77] |
| 2 Proportion of patients having vomiting Show forest plot | 2 | 1021 | Odds Ratio (M‐H, Fixed, 95% CI) | 1.22 [0.89, 1.69] |
| 3 Proportion of patients having anaemia Show forest plot | 3 | 1037 | Odds Ratio (M‐H, Fixed, 95% CI) | 1.04 [0.76, 1.41] |
| 4 Proportion of patients having bone pain Show forest plot | 2 | 1021 | Odds Ratio (M‐H, Fixed, 95% CI) | 0.93 [0.72, 1.21] |