| 1 Sensitivity analysis 1: Assuming zero mortality in nonreporting trials Show forest plot | 13 | 2337 | Risk Difference (M‐H, Fixed, 95% CI) | ‐0.00 [‐0.01, 0.01] |
|
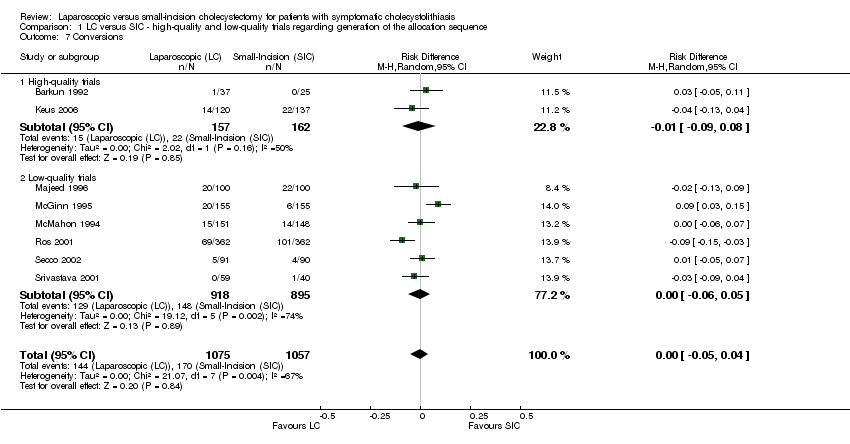
| 2 Sensitivity analysis 2: Assuming zero conversions in nonreporting trials Show forest plot | 13 | 2346 | Risk Difference (M‐H, Fixed, 95% CI) | ‐0.02 [‐0.05, 0.01] |
|
| 3 Sensitivity analysis 3: Imputing medians and standard deviations for missing data in operative time (minutes) Show forest plot | 12 | 2315 | Mean Difference (IV, Random, 95% CI) | 9.71 [2.34, 17.08] |
|
| 4 Sensitivity analysis 4: Imputing medians and standard deviations for missing data in hospital stay (days) Show forest plot | 12 | 2315 | Mean Difference (IV, Random, 95% CI) | ‐0.96 [‐1.41, ‐0.51] |
|
| 5 Sensitivity analysis 5: Imputing medians and standard deviations for missing data in convalescence: work leave Show forest plot | 6 | 1890 | Mean Difference (IV, Random, 95% CI) | ‐5.86 [‐12.31, 0.59] |
|
| 6 Sensitivity analysis 6: Imputing medians and standard deviations for missing data in normal activity Show forest plot | 7 | 1867 | Mean Difference (IV, Random, 95% CI) | ‐7.42 [‐15.94, 1.10] |
|
| 7 Sensitivity analysis 7: Omitting outlier Srivastava in minor complications Show forest plot | 11 | 2216 | Risk Difference (M‐H, Random, 95% CI) | 0.00 [‐0.01, 0.02] |
|
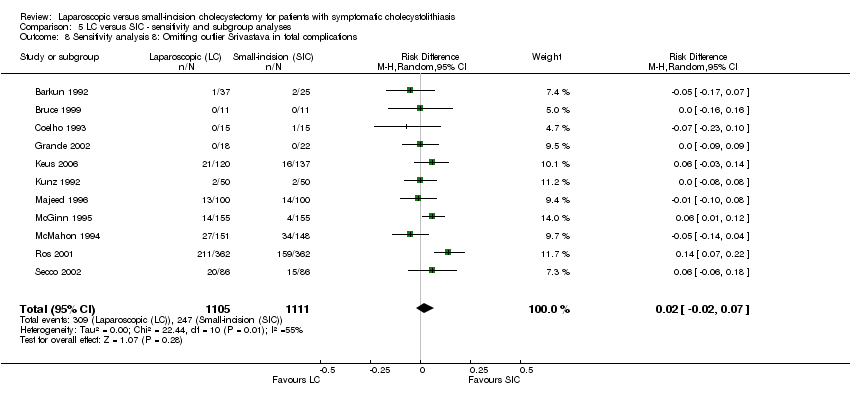
| 8 Sensitivity analysis 8: Omitting outlier Srivastava in total complications Show forest plot | 11 | 2216 | Risk Difference (M‐H, Random, 95% CI) | 0.02 [‐0.02, 0.07] |
|
| 9 Sensitivity analysis 9: Omitting outlier Grande in hospital stay (days) Show forest plot | 7 | 1574 | Mean Difference (IV, Random, 95% CI) | ‐0.59 [‐0.98, ‐0.21] |
|
| 10 Sensitivity analysis 10: Total complications including Redmond Show forest plot | 13 | 2359 | Risk Difference (M‐H, Random, 95% CI) | ‐0.03 [‐0.10, 0.03] |
|
| 11 Sensitivity analysis 11: Operative time (minutes) including Redmond Show forest plot | 13 | 2359 | Mean Difference (IV, Random, 95% CI) | 8.04 [0.82, 15.26] |
|
| 12 Subgroup analysis 1: Influence antibiotic prophylaxis on total complications Show forest plot | 12 | 2315 | Risk Difference (M‐H, Random, 95% CI) | ‐0.01 [‐0.07, 0.05] |
|
| 12.1 Antibiotic: yes | 6 | 852 | Risk Difference (M‐H, Random, 95% CI) | 0.00 [‐0.04, 0.05] |
| 12.2 Antibiotic: no / unknown | 6 | 1463 | Risk Difference (M‐H, Random, 95% CI) | ‐0.03 [‐0.14, 0.08] |
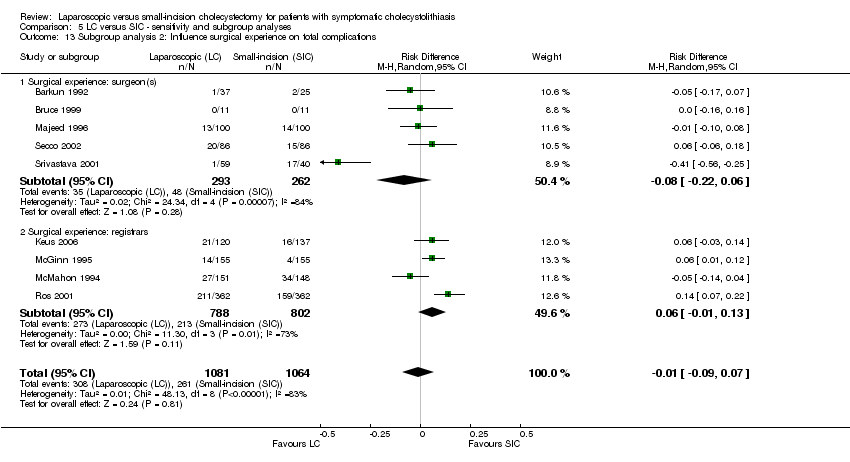
| 13 Subgroup analysis 2: Influence surgical experience on total complications Show forest plot | 9 | 2145 | Risk Difference (M‐H, Random, 95% CI) | ‐0.01 [‐0.09, 0.07] |
|
| 13.1 Surgical experience: surgeon(s) | 5 | 555 | Risk Difference (M‐H, Random, 95% CI) | ‐0.08 [‐0.22, 0.06] |
| 13.2 Surgical experience: registrars | 4 | 1590 | Risk Difference (M‐H, Random, 95% CI) | 0.06 [‐0.01, 0.13] |
| 14 Subgroup analysis 3: Influence cholangiography on operative time (minutes) Show forest plot | 12 | 2315 | Mean Difference (IV, Random, 95% CI) | 9.71 [2.34, 17.08] |
|
| 14.1 Cholangiography: yes | 2 | 924 | Mean Difference (IV, Random, 95% CI) | 18.96 [9.36, 28.57] |
| 14.2 Cholangiography: no | 10 | 1391 | Mean Difference (IV, Random, 95% CI) | 7.64 [‐0.50, 15.77] |
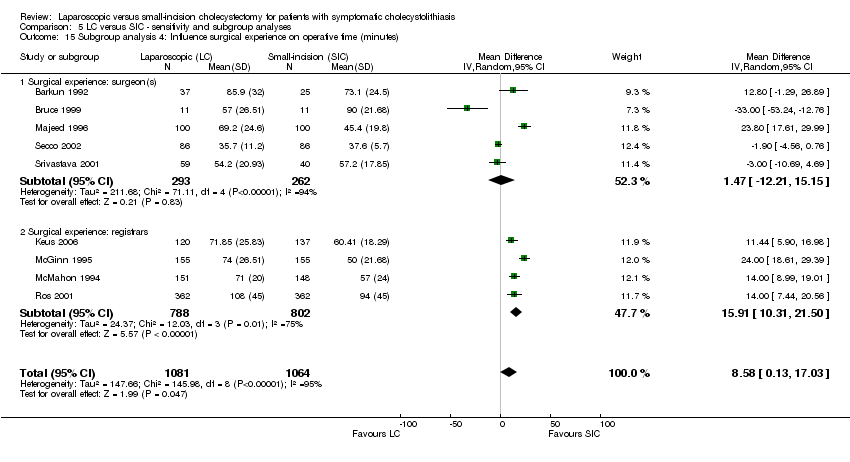
| 15 Subgroup analysis 4: Influence surgical experience on operative time (minutes) Show forest plot | 9 | 2145 | Mean Difference (IV, Random, 95% CI) | 8.58 [0.13, 17.03] |
|
| 15.1 Surgical experience: surgeon(s) | 5 | 555 | Mean Difference (IV, Random, 95% CI) | 1.47 [‐12.21, 15.15] |
| 15.2 Surgical experience: registrars | 4 | 1590 | Mean Difference (IV, Random, 95% CI) | 15.91 [10.31, 21.50] |
| 16 Subgroup analysis 5: Influence antibiotic prophylaxis on hospital stay (days) Show forest plot | 12 | 2315 | Mean Difference (IV, Random, 95% CI) | ‐0.96 [‐1.41, ‐0.51] |
|
| 16.1 Antibiotic profylaxis: yes | 5 | 830 | Mean Difference (IV, Random, 95% CI) | ‐1.29 [‐2.24, ‐0.35] |
| 16.2 Antibiotic profylaxis: no / unknown | 7 | 1485 | Mean Difference (IV, Random, 95% CI) | ‐0.71 [‐1.17, ‐0.25] |
| 17 Subgroup analysis 6: Influence surgical experience on hospital stay (days) Show forest plot | 9 | 2145 | Mean Difference (IV, Random, 95% CI) | ‐0.78 [‐1.22, ‐0.35] |
|
| 17.1 Surgical experience: surgeon(s) | 5 | 555 | Mean Difference (IV, Random, 95% CI) | ‐0.46 [‐0.84, ‐0.07] |
| 17.2 Surgical experience: registrars | 4 | 1590 | Mean Difference (IV, Random, 95% CI) | ‐1.15 [‐1.88, ‐0.43] |
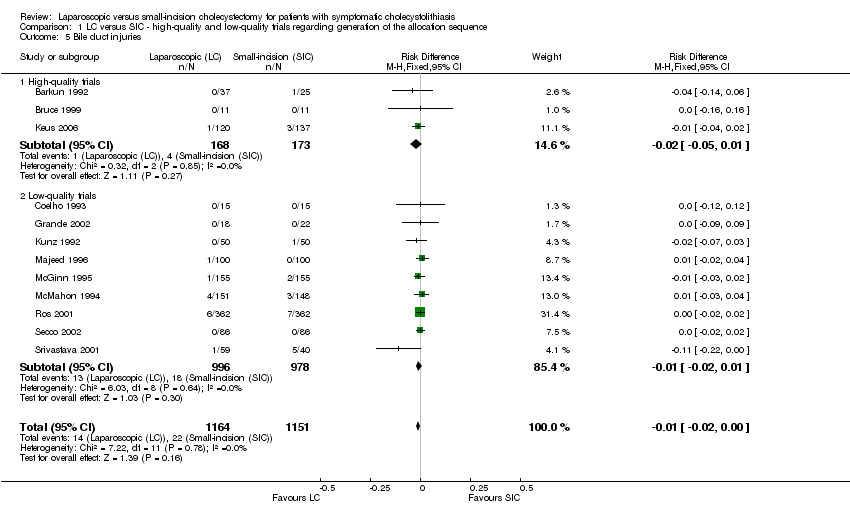
| 18 Subgroup analysis 7: Influence cholangiography on bile duct injuries Show forest plot | 9 | 2163 | Risk Difference (M‐H, Fixed, 95% CI) | ‐0.01 [‐0.02, 0.00] |
|
| 18.1 Cholangiography: yes | 2 | 924 | Risk Difference (M‐H, Fixed, 95% CI) | 0.0 [‐0.02, 0.02] |
| 18.2 Cholangiography: no | 7 | 1239 | Risk Difference (M‐H, Fixed, 95% CI) | ‐0.01 [‐0.03, 0.00] |