Scolaris Content Display Scolaris Content Display

Comparison 1 CS‐NANP vaccine versus control, Outcome 1 New malaria infection.
Figuras y tablas -
Analysis 1.1

Comparison 1 CS‐NANP vaccine versus control, Outcome 1 New malaria infection.

Comparison 2 CS‐102 vaccine versus control, Outcome 1 Nausea.
Figuras y tablas -
Analysis 2.1

Comparison 2 CS‐102 vaccine versus control, Outcome 1 Nausea.

Comparison 2 CS‐102 vaccine versus control, Outcome 2 Fever.
Figuras y tablas -
Analysis 2.2

Comparison 2 CS‐102 vaccine versus control, Outcome 2 Fever.

Comparison 2 CS‐102 vaccine versus control, Outcome 3 Malaise.
Figuras y tablas -
Analysis 2.3

Comparison 2 CS‐102 vaccine versus control, Outcome 3 Malaise.

Comparison 3 RTS,S vaccine versus control, Outcome 1 New infection: by type of challenge.
Figuras y tablas -
Analysis 3.1

Comparison 3 RTS,S vaccine versus control, Outcome 1 New infection: by type of challenge.

Comparison 3 RTS,S vaccine versus control, Outcome 2 New infection: by age group.
Figuras y tablas -
Analysis 3.2

Comparison 3 RTS,S vaccine versus control, Outcome 2 New infection: by age group.

Comparison 3 RTS,S vaccine versus control, Outcome 3 Clinical malaria episodes.
Figuras y tablas -
Analysis 3.3

Comparison 3 RTS,S vaccine versus control, Outcome 3 Clinical malaria episodes.

Comparison 3 RTS,S vaccine versus control, Outcome 4 Clinical malaria episodes: by year.
Figuras y tablas -
Analysis 3.4

Comparison 3 RTS,S vaccine versus control, Outcome 4 Clinical malaria episodes: by year.

Comparison 3 RTS,S vaccine versus control, Outcome 5 Severe malaria.
Figuras y tablas -
Analysis 3.5

Comparison 3 RTS,S vaccine versus control, Outcome 5 Severe malaria.

Comparison 3 RTS,S vaccine versus control, Outcome 6 Malaria requiring admission.
Figuras y tablas -
Analysis 3.6

Comparison 3 RTS,S vaccine versus control, Outcome 6 Malaria requiring admission.

Comparison 3 RTS,S vaccine versus control, Outcome 7 Admission to hospital for any cause.
Figuras y tablas -
Analysis 3.7

Comparison 3 RTS,S vaccine versus control, Outcome 7 Admission to hospital for any cause.

Comparison 3 RTS,S vaccine versus control, Outcome 8 Prevalence of parasitaemia.
Figuras y tablas -
Analysis 3.8

Comparison 3 RTS,S vaccine versus control, Outcome 8 Prevalence of parasitaemia.

Comparison 3 RTS,S vaccine versus control, Outcome 9 Anaemia (packed cell volume < 25%).
Figuras y tablas -
Analysis 3.9

Comparison 3 RTS,S vaccine versus control, Outcome 9 Anaemia (packed cell volume < 25%).

Comparison 3 RTS,S vaccine versus control, Outcome 10 Adverse events.
Figuras y tablas -
Analysis 3.10

Comparison 3 RTS,S vaccine versus control, Outcome 10 Adverse events.

Comparison 3 RTS,S vaccine versus control, Outcome 11 Severe adverse events.
Figuras y tablas -
Analysis 3.11

Comparison 3 RTS,S vaccine versus control, Outcome 11 Severe adverse events.

Comparison 4 ME‐TRAP vaccine versus control, Outcome 1 New malaria infection.
Figuras y tablas -
Analysis 4.1

Comparison 4 ME‐TRAP vaccine versus control, Outcome 1 New malaria infection.

Comparison 4 ME‐TRAP vaccine versus control, Outcome 2 Clinical malaria episodes.
Figuras y tablas -
Analysis 4.2

Comparison 4 ME‐TRAP vaccine versus control, Outcome 2 Clinical malaria episodes.

Comparison 4 ME‐TRAP vaccine versus control, Outcome 3 Density of Plasmodium falciparum.
Figuras y tablas -
Analysis 4.3

Comparison 4 ME‐TRAP vaccine versus control, Outcome 3 Density of Plasmodium falciparum.

Comparison 4 ME‐TRAP vaccine versus control, Outcome 4 Mean packed cell volume.
Figuras y tablas -
Analysis 4.4

Comparison 4 ME‐TRAP vaccine versus control, Outcome 4 Mean packed cell volume.

Comparison 4 ME‐TRAP vaccine versus control, Outcome 5 Adverse events.
Figuras y tablas -
Analysis 4.5

Comparison 4 ME‐TRAP vaccine versus control, Outcome 5 Adverse events.

Comparison 1. CS‐NANP vaccine versus control

Outcome or subgroup title

No. of studies

No. of participants

Statistical method

Effect size

1 New malaria infection Show forest plot

3

307

Risk Ratio (M‐H, Fixed, 95% CI)

1.05 [0.82, 1.35]

Figuras y tablas -
Comparison 1. CS‐NANP vaccine versus control
Comparison 2. CS‐102 vaccine versus control

Outcome or subgroup title

No. of studies

No. of participants

Statistical method

Effect size

1 Nausea Show forest plot

1

Risk Ratio (M‐H, Fixed, 95% CI)

Totals not selected

2 Fever Show forest plot

1

Risk Ratio (M‐H, Fixed, 95% CI)

Totals not selected

3 Malaise Show forest plot

1

Risk Ratio (M‐H, Fixed, 95% CI)

Totals not selected

Figuras y tablas -
Comparison 2. CS‐102 vaccine versus control
Comparison 3. RTS,S vaccine versus control

Outcome or subgroup title

No. of studies

No. of participants

Statistical method

Effect size

1 New infection: by type of challenge Show forest plot

3

Risk Ratio (M‐H, Fixed, 95% CI)

Subtotals only

1.1 Experimental challenge

1

24

Risk Ratio (M‐H, Fixed, 95% CI)

0.56 [0.35, 0.90]

1.2 Natural challenge

2

723

Risk Ratio (M‐H, Fixed, 95% CI)

0.96 [0.87, 1.06]

2 New infection: by age group Show forest plot

3

747

Risk Ratio (M‐H, Fixed, 95% CI)

0.95 [0.86, 1.04]

2.1 Adults

2

330

Risk Ratio (M‐H, Fixed, 95% CI)

0.96 [0.79, 1.17]

2.2 Children

1

417

Risk Ratio (M‐H, Fixed, 95% CI)

0.94 [0.85, 1.04]

3 Clinical malaria episodes Show forest plot

2

1911

Risk Ratio (M‐H, Fixed, 95% CI)

0.76 [0.66, 0.88]

3.1 Adults

1

306

Risk Ratio (M‐H, Fixed, 95% CI)

0.88 [0.63, 1.23]

3.2 Children

1

1605

Risk Ratio (M‐H, Fixed, 95% CI)

0.74 [0.63, 0.87]

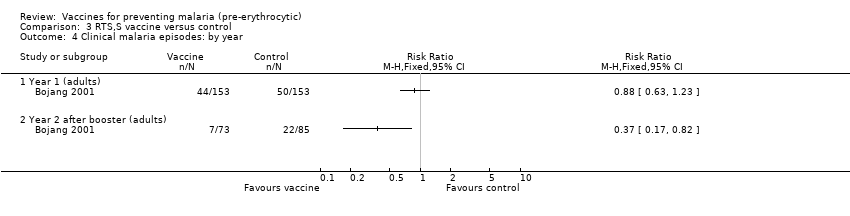
4 Clinical malaria episodes: by year Show forest plot

1

Risk Ratio (M‐H, Fixed, 95% CI)

Totals not selected

4.1 Year 1 (adults)

1

Risk Ratio (M‐H, Fixed, 95% CI)

0.0 [0.0, 0.0]

4.2 Year 2 after booster (adults)

1

Risk Ratio (M‐H, Fixed, 95% CI)

0.0 [0.0, 0.0]

5 Severe malaria Show forest plot

1

Risk Ratio (M‐H, Fixed, 95% CI)

Totals not selected

6 Malaria requiring admission Show forest plot

1

Risk Ratio (M‐H, Fixed, 95% CI)

Totals not selected

7 Admission to hospital for any cause Show forest plot

1

Risk Ratio (M‐H, Fixed, 95% CI)

Totals not selected

8 Prevalence of parasitaemia Show forest plot

2

Risk Ratio (M‐H, Fixed, 95% CI)

Subtotals only

8.1 After 6 months

2

2022

Risk Ratio (M‐H, Fixed, 95% CI)

0.74 [0.62, 0.89]

8.2 After 18 months

2

1794

Risk Ratio (M‐H, Fixed, 95% CI)

0.80 [0.65, 0.99]

9 Anaemia (packed cell volume < 25%) Show forest plot

2

Risk Ratio (M‐H, Fixed, 95% CI)

Subtotals only

9.1 After 6 months

2

2022

Risk Ratio (M‐H, Fixed, 95% CI)

0.69 [0.42, 1.12]

9.2 After 18 months

1

1442

Risk Ratio (M‐H, Fixed, 95% CI)

0.20 [0.01, 4.14]

10 Adverse events Show forest plot

5

Risk Ratio (M‐H, Fixed, 95% CI)

Subtotals only

10.1 Injection site pain

5

7502

Risk Ratio (M‐H, Fixed, 95% CI)

1.37 [1.28, 1.45]

10.2 Arm pain

1

138

Risk Ratio (M‐H, Fixed, 95% CI)

1.76 [0.80, 3.89]

10.3 Swelling

4

7329

Risk Ratio (M‐H, Fixed, 95% CI)

9.85 [6.61, 14.67]

10.4 Induration

1

138

Risk Ratio (M‐H, Fixed, 95% CI)

8.26 [0.50, 136.74]

10.5 Warmth

1

138

Risk Ratio (M‐H, Fixed, 95% CI)

4.94 [0.67, 36.25]

10.6 Tenderness

1

138

Risk Ratio (M‐H, Fixed, 95% CI)

1.82 [0.83, 4.01]

10.7 Erythema

1

138

Risk Ratio (M‐H, Fixed, 95% CI)

2.82 [0.68, 11.68]

10.8 Arm motion limitation

3

1272

Risk Ratio (M‐H, Fixed, 95% CI)

4.32 [2.95, 6.33]

10.9 Myalgia

2

1003

Risk Ratio (M‐H, Fixed, 95% CI)

1.16 [0.74, 1.80]

10.10 Arthralgia

2

1003

Risk Ratio (M‐H, Fixed, 95% CI)

1.26 [0.87, 1.83]

10.11 Axillary adenopathy

1

138

Risk Ratio (M‐H, Fixed, 95% CI)

2.12 [0.26, 17.00]

10.12 Headache

3

1272

Risk Ratio (M‐H, Fixed, 95% CI)

1.47 [1.21, 1.78]

10.13 Fever

3

1527

Risk Ratio (M‐H, Fixed, 95% CI)

1.00 [0.68, 1.46]

10.14 Feverishness (subjective)

1

138

Risk Ratio (M‐H, Fixed, 95% CI)

8.26 [0.50, 136.74]

10.15 Chills

1

138

Risk Ratio (M‐H, Fixed, 95% CI)

1.06 [0.30, 3.70]

10.16 Drowsiness

1

392

Risk Ratio (M‐H, Fixed, 95% CI)

1.17 [0.53, 2.58]

10.17 Loss of appetite

1

392

Risk Ratio (M‐H, Fixed, 95% CI)

1.04 [0.57, 1.88]

10.18 Nausea

2

1134

Risk Ratio (M‐H, Fixed, 95% CI)

1.58 [0.99, 2.51]

10.19 Malaise

3

1360

Risk Ratio (M‐H, Fixed, 95% CI)

1.67 [1.30, 2.14]

10.20 Irritability/fussiness

1

392

Risk Ratio (M‐H, Fixed, 95% CI)

1.57 [0.83, 2.98]

10.21 General (fever, irritability, drowsiness, anorexia)

1

5838

Risk Ratio (M‐H, Fixed, 95% CI)

2.38 [1.47, 3.86]

10.22 Any event preventing normal activity

1

1876

Risk Ratio (M‐H, Fixed, 95% CI)

1.09 [1.02, 1.16]

11 Severe adverse events Show forest plot

1

3815

Risk Ratio (M‐H, Fixed, 95% CI)

0.73 [0.62, 0.85]

11.1 Up to 6 months

1

1876

Risk Ratio (M‐H, Fixed, 95% CI)

0.72 [0.61, 0.85]

11.2 6 to 18 months

1

1939

Risk Ratio (M‐H, Fixed, 95% CI)

0.75 [0.53, 1.07]

Figuras y tablas -
Comparison 3. RTS,S vaccine versus control
Comparison 4. ME‐TRAP vaccine versus control

Outcome or subgroup title

No. of studies

No. of participants

Statistical method

Effect size

1 New malaria infection Show forest plot

1

Risk Ratio (M‐H, Fixed, 95% CI)

Totals not selected

2 Clinical malaria episodes Show forest plot

1

Risk Ratio (M‐H, Fixed, 95% CI)

Totals not selected

3 Density of Plasmodium falciparum Show forest plot

1

Mean Difference (IV, Fixed, 95% CI)

Totals not selected

4 Mean packed cell volume Show forest plot

1

Mean Difference (IV, Fixed, 95% CI)

Totals not selected

5 Adverse events Show forest plot

1

Risk Ratio (M‐H, Fixed, 95% CI)

Totals not selected

5.1 Limited arm motion

1

Risk Ratio (M‐H, Fixed, 95% CI)

0.0 [0.0, 0.0]

5.2 Pain at injection site

1

Risk Ratio (M‐H, Fixed, 95% CI)

0.0 [0.0, 0.0]

5.3 Local discolouration

1

Risk Ratio (M‐H, Fixed, 95% CI)

0.0 [0.0, 0.0]

5.4 Induration

1

Risk Ratio (M‐H, Fixed, 95% CI)

0.0 [0.0, 0.0]

5.5 Blister at injection site

1

Risk Ratio (M‐H, Fixed, 95% CI)

0.0 [0.0, 0.0]

5.6 Headache

1

Risk Ratio (M‐H, Fixed, 95% CI)

0.0 [0.0, 0.0]

5.7 Objective fever

1

Risk Ratio (M‐H, Fixed, 95% CI)

0.0 [0.0, 0.0]

5.8 Malaise

1

Risk Ratio (M‐H, Fixed, 95% CI)

0.0 [0.0, 0.0]

5.9 Nausea

1

Risk Ratio (M‐H, Fixed, 95% CI)

0.0 [0.0, 0.0]

Figuras y tablas -
Comparison 4. ME‐TRAP vaccine versus control