抗生素用于新生儿羊水胎粪污染
摘要
研究背景
大约十分之一的妊娠在分娩时会受到胎便排出的影响,这可能导致胎粪吸入综合征(meconium aspiration syndrome, MAS)。MAS可导致呼吸系统并发症,极少数情况下甚至会导致死亡。对于接触羊水中胎便的新生儿使用抗生素治疗,目的是预防潜在细菌污染物引起的感染。
研究目的
本综述的目的是评估抗生素的功效和安全性:
1. 预防出生时无症状、有羊水胎粪污染(meconium‐stained amniotic fluid, MSAF)情况的新生儿的感染、发病和死亡;和
2. 预防出现MSAF且具有胎便吸入综合征(MAS)体征和症状的婴儿的感染、发病和死亡。
检索策略
我们使用以下数据库进行文献检索:MEDLINE(1966年至2016年7月)、Embase(1980年至2016年7月)、护理和联合健康文献累积索引(Cumulative Index of Nursing and Allied Health Literature, CINAHL, 1982年至2016年7月)Cochrane图书馆的Cochrane对照试验中心注册库(Cochrane Central Register of Controlled Trials,CENTRAL,截至2016第7期)。我们也检索了临床试验数据库、会议论文以及检索所获文章的参考文献 。
纳入排除标准
我们纳入了随机和半随机对照试验,比较了通过任何途径施用抗生素与安慰剂或不治疗出现MSAF或发生MAS的新生儿的感染预防效果。我们排除了队列、病例对照和任何其他非随机研究,并且无语言限制。我们纳入了足月儿和早产儿的研究,以及检查任何抗菌抗生素使用情况的研究。我们纳入了报告任何研究关注点结局结果的研究。
资料收集与分析
我们通过查阅研究报告中提供的信息以及与研究作者个人交流获得的信息来评估纳入试验的方法学质量。我们提取了相关结局的数据,估计效应量,并酌情报告了风险比(risk ratios, RRs)、风险差异(risk differences, RDs)和平均差(mean difference, MDs)。我们对MAS的治疗和预防(接触胎便且无症状的新生儿)进行了亚组分析。
主要结果
有4项共涉及695名受试者的随机对照试验符合本综述的纳入标准。三项研究评估了患有MAS的新生儿,一项研究评估了接触到羊水胎便的无症状新生儿。这些研究表现出不同程度的方法严谨性:有两项研究为低偏倚风险,两项研究为高偏倚风险。我们将这些研究得出的证据评为低质量证据。由于一项试验中大量受试者失访、所有试验的样本量小以及两项试验提供的方法学细节不明确,我们降低了总体证据的级别。
主要结局是早发型和晚发型新生儿败血症的风险。抗生素不会降低诊断为MAS(RR=1.54, 95% 置信区间(confidence interval, CI)为0.27至8.96;RD=0.00, 95% CI [‐0.02, 0.03];445名受试者,三项研究;I²=0%)和接触羊水胎粪且无症状(RR=0.76, 95% CI [0.25, 2.34];RD=‐0.01, 95% CI [‐0.07, 0.04];250名受试者,一项研究;I²=0%)的新生儿患败血症的风险。结果显示,有症状和无症状新生儿的抗生素组与对照组之间的死亡率或住院时间没有显着差异。一项针对无症状新生儿的研究报告称,与抗生素组相比,对照组的机械通气持续时间显着缩短(MD=0.26, 95% CI [0.15, 0.37];250名受试者,一项研究;I²=0%)。
作者结论
在评价现有证据后,我们发现在羊水胎粪中出生的新生儿和患有胎粪吸入综合征的新生儿接受抗生素治疗后的感染率没有差异。由于纳入的研究数量少,证据的总体质量低。需要对足够的把握度进行严格控制的研究。
PICO
简语概要
抗生素用于减少接触胎便的婴儿的感染
研究问题是什么?
大约每10次妊娠中就有1次出现婴儿在分娩过程中接触到胎便的情况。胎粪是婴儿的第一次粪便。如果婴儿在出生前排便,含有羊水的粪便会进入婴儿的肺部,可能会导致呼吸困难,同时使婴儿面临肺部和身体感染和炎症的风险。
本研究为什么重要?
肺部感染或炎症可导致呼吸困难、氧气水平降低和肺炎。抗生素已用于预防在分娩过程中接触胎便的婴儿感染。
我们找到了哪些证据?
首先,我们检索了医学文献中符合条件的研究,检索日期截止2016年6月。我们发现了四项研究,比较了抗生素与安慰剂在减少出生时新生儿羊水胎便污染的感染方面的情况。两项研究质量良好,两项研究遗漏了一些有关研究方法的细节。这四项研究纳入了695名婴儿,他们接受各种抗生素治疗或被置于对照组(不使用抗生素)。研究人员评估了几种不同的抗生素类型和治疗时长。总体而言,我们发现两组之间的感染率和死亡率没有差异。由于研究设计质量差且纳入的婴儿数量少,我们将证据评为低质量。
这些证据意味着什么?
我们不确定抗生素是否对新生儿感染羊水胎粪污染有重要影响。我们的结果并不精确,需要更多的研究来确定抗生素在这种情况下的作用。
Authors' conclusions
Summary of findings
| Antibiotics compared with control (no antibiotics) in symptomatic neonates born through meconium‐stained amniotic fluid | ||||||
| Patient or population: symptomatic neonates born through meconium‐stained amniotic fluid | ||||||
| Outcomes | Anticipated absolute effects* (95% CI) | Relative effect | Number of participants | Quality of the evidence | Comments | |
| Risk with control (no antibiotics) | Risk with antibiotics | |||||
| Incidence of confirmed sepsis in first 28 days | Study population | Not estimable | 445 | ⊕⊕⊝⊝ | Evidence was downgraded owing to unclear risk of bias due to methodological limitations, including a large number of dropouts; and imprecision resulting from a small sample size | |
| 9 per 1000 | 0 per 1000 | |||||
| Mortality (before discharge) | Study population | RR 1.69 | 445 | ⊕⊕⊝⊝ | Evidence was downgraded owing to unclear risk of bias due to methodological limitations, including a large number of dropouts; and imprecision resulting from a small sample size | |
| 5 per 1000 | 8 per 1000 | |||||
| Duration of oxygen therapy, days | Mean duration of oxygen therapy (days) was 0 | MD 0.85 days lower | ‐ | 405 | ⊕⊕⊝⊝ | Evidence was downgraded owing to unclear risk of bias due to methodological limitations, including a large number of dropouts; and imprecision resulting from a small sample size |
| Duration of hospital stay, days | Mean duration of hospital stay (days) was 0 | MD 0.16 days higher | ‐ | 146 | ⊕⊕⊕⊝ | Evidence was downgraded owing to imprecision resulting from a small sample size |
| Incidence of mechanical ventilation | Study population | RR 1.18 | 445 | ⊕⊕⊝⊝ | Evidence was downgraded owing to unclear risk of bias due to methodological limitations, including a large number of dropouts; and imprecision resulting from a small sample size | |
| 45 per 1000 | 53 per 1000 | |||||
| Incidence of respiratory failure | Study population | RR 1.20 | 405 | ⊕⊕⊝⊝ | Evidence was downgraded owing to unclear risk of bias due to methodological limitations, including a large number of dropouts; and imprecision resulting from a small sample size | |
| 41 per 1000 | 47 per 1000 | |||||
| *The risk in the intervention group (and its 95% confidence interval) is based on assumed risk in the comparison group and relative effect of the intervention (and its 95% CI) | ||||||
| GRADE Working Group grades of evidence | ||||||
| Antibiotics compared with control (no antibiotics) in asymptomatic neonates born through meconium‐stained amniotic fluid | ||||||
| Patient or population: asymptomatic neonates born through meconium‐stained amniotic fluid | ||||||
| Outcomes | Anticipated absolute effects* (95% CI) | Relative effect | Number of participants | Quality of the evidence | Comments | |
| Risk with control (no antibiotics) | Risk with antibiotics | |||||
| Incidence of confirmed sepsis in first 28 days | Study population | Not estimable | 250 | ⊕⊕⊝⊝ | Evidence was downgraded owing to very serious imprecision, as the results from this study have not been replicated | |
| 54 per 1000 | 0 per 1000 | |||||
| Mortality (before discharge) | Study population | RR 1.07 | 250 | ⊕⊕⊝⊝ | Evidence was downgraded owing to very serious imprecision, as the results from this study have not been replicated | |
| 23 per 1000 | 25 per 1000 | |||||
| Duration of oxygen therapy, days | Mean duration of oxygen therapy (days) was 0 | MD 0.43 days higher | ‐ | 250 | ⊕⊕⊝⊝ | Evidence was downgraded owing to very serious imprecision, as the results from this study have not been replicated |
| Incidence of suspected sepsis | Study population | Not estimable | 250 | ⊕⊕⊝⊝ | Evidence was downgraded owing to very serious imprecision, as the results from this study have not been replicated | |
| 109 per 1000 | 0 per 1000 | |||||
| Incidence of mechanical ventilation | Study population | RR 2.13 | 250 | ⊕⊕⊝⊝ | Evidence was downgraded owing to very serious imprecision, as the results from this study have not been replicated | |
| 23 per 1000 | 50 per 1000 | |||||
| Duration of respiratory distress, hours | Mean duration of respiratory distress (hours) was 0 | MD 6.87 higher | ‐ | 250 | ⊕⊕⊝⊝ | Evidence was downgraded owing to very serious imprecision, as the results from this study have not been replicated |
| Incidence of MAS | Study population | RR 1.17 | 250 | ⊕⊕⊝⊝ | Evidence was downgraded owing to very serious imprecision, as the results from this study have not been replicated | |
| 155 per 1000 | 181 per 1000 | |||||
| *The risk in the intervention group (and its 95% confidence interval) is based on assumed risk in the comparison group and relative effect of the intervention (and its 95% CI) | ||||||
| GRADE Working Group grades of evidence | ||||||
Background
Description of the condition
Meconium aspiration syndrome (MAS) is a problem that is commonly encountered in neonates. Meconium is the viscous green material found in the foetal gastrointestinal tract from approximately the tenth week of gestation. Meconium is composed of a mixture of bile, bile acids, mucus, pancreatic secretions, and cellular debris (Wiswell 1993). Approximately 10% to 15% of pregnancies are complicated by passage of meconium around the time of delivery (Wiswell 1993). An adverse intrauterine environment that compromises foetal well‐being can lead to meconium‐stained amniotic fluid (MSAF) (Ahanya 2005). 'Meconium aspiration syndrome' is defined as respiratory distress with compatible chest roentgenographic findings in an infant born through MSAF whose symptoms cannot be otherwise explained (Wiswell 1990). Despite current interventions such as intubation with tracheal suction, it is estimated that 5% to 12% of infants born through MSAF develop MAS (Wiswell 2000). An estimated 25,000 to 30,000 cases and 1000 deaths related to MAS are reported annually in the United States (Gelfand 2004). MAS accounts for roughly 2% of all perinatal deaths (Cleary 1998). Clinical features of MAS include tachypnoea, retractions, grunting, and/or cyanosis with or without radiological features of aspiration pneumonia. Radiological features of MAS consist of areas of atelectasis and consolidation, along with regions of hyperexpansion. Histologically, researchers have observed a significant inflammatory reaction with a diffuse pulmonary infiltrate of polymorphonuclear leucocytes (Burgess 1996). Although initially sterile, meconium can become colonised secondarily by bacteria following rupture of membranes in utero (Florman 1969) or during neonatal interventions such as endotracheal intubation.
Description of the intervention
Antibiotics target bacteria and are prescribed to treat infection or, at times, to prevent infection. Penicillin prevents cross‐linking during the formation of peptidoglycan. Normal healthy human cells do not make or need peptidoglycan, a polymer that makes penicillin selective to bacteria. Loss of peptidoglycan makes the bacterial call wall weak, causing it to burst. Antibiotics are among the treatments most frequently used in the neonatal intensive care unit (NICU) (Warrier 2006).
How the intervention might work
Proposed explanations for widespread use of antibiotics in patients with MAS include difficulty differentiating aspiration pneumonia from bacterial pneumonia radiologically (Lee 2004); the possibility of meconium‐induced inhibition of phagocytic activity and respiratory burst response by alveolar macrophages, rendering infants with MAS susceptible to pulmonary infection (Craig 2005); in vitro enhancement of bacterial growth in the presence of meconium in amniotic fluid (Florman 1969; Lembet 2003); in vivo inflammatory response aggravated by the combination of meconium and bacteria (Speer 1998); the likelihood of foetal bacterial infection causing in utero meconium passage (Blot 1983; Bortolucci 1990); and apprehension about complications associated with untreated bacterial pneumonia (Wiswell 1992). Several study authors have reported increased rates of chorioamnionitis associated with MSAF (Mazor 1995; Rao 2001; Romero 1991; Usta 1995), although it is unclear whether chorioamnionitis is a cause or a secondary effect of meconium passage. In a retrospective study of 215 well term babies born through MSAF (88 of whom required tracheal meconium aspiration at birth), researchers noted no significant differences in the incidence of culture‐positive sepsis (1 (1.1%) vs 2 (1.6%); P > 0.05) when comparing 127 control infants not requiring tracheal suctioning of meconium passage (Krishnan 1995). Administration of intravenous ampicillin‐sulbactam therapy or cefazolin infusion into the amniotic cavity during amnioinfusion in mothers with MSAF has not been beneficial in reducing neonatal sepsis (Adair 1996; Edwards 1999).
Why it is important to do this review
Widespread use of antibiotics in neonates is a matter of some concern (CDC 2004). Excessive use of antibiotics in neonatal units can lead to emergence of resistant bacterial strains (Tom‐Revzon 2004). Fanos 1999 reported nephrotoxicity in newborns even after brief periods of antibacterial treatment. McCracken 1986 observed ototoxicity in neonates following aminoglycoside treatment. Researchers have not systematically evaluated the role of antibiotics in infants born through MSAF.
Objectives
We conducted this review to assess the efficacy and safety of antibiotics for:
-
prevention of infection, morbidity, and mortality among infants born through meconium‐stained amniotic fluid (MSAF) who are asymptomatic at birth; and
-
prevention of infection, morbidity, and mortality among infants born through MSAF who have signs and symptoms compatible with meconium aspiration syndrome (MAS).
Methods
Criteria for considering studies for this review
Types of studies
We considered for inclusion in this review randomised and quasi‐randomised controlled trials of antibiotic administration in infants born through MSAF. We excluded non‐randomised studies, editorials, letter to editors, and commentaries.
Types of participants
We studied two sets of infants.
-
Term (≥ 37 weeks' gestational age) and preterm (< 37 weeks' gestational age) newborn infants with a history of meconium‐stained amniotic fluid and asymptomatic at birth.
-
Term (≥ 37 weeks' gestational age) and preterm (< 37 weeks' gestational age) newborn infants with a history of meconium‐stained amniotic fluid and clinical findings of tachypnoea, retractions, grunting, and cyanosis with or without radiological findings of atelectasis, consolidation, and hyperinflation.
If studies included a mixed population of term and preterm infants born with a history of meconium‐stained amniotic fluid who may or may not have had symptoms and signs (clinical or radiological) of MAS, we contacted study authors to request individual data for symptomatic and asymptomatic infants. We incorporated these data into appropriate subgroup comparisons, as noted above.
Types of interventions
We studied two intervention strategies.
-
Administration of antibiotics started immediately after birth compared with no antibiotics or placebo in infants born through MSAF and asymptomatic at birth.
-
Administration of antibiotics compared with no antibiotics or placebo started at the time of initial clinical suspicion of MAS in infants born through MSAF.
Types of outcome measures
Outcomes were similar across sets of interventions/populations.
Primary outcome
The primary outcome was incidence of sepsis in the first 28 days (symptomatic neonate was considered to have sepsis if blood or cerebrospinal fluid (CSF) culture was positive for bacterial organisms). We planned to classify this outcome into two groups.
-
Early‐onset neonatal sepsis (symptomatic before 72 hours).
-
Late‐onset neonatal sepsis (symptomatic at 72 hours or later).
Secondary outcomes
-
Mortality before discharge
-
Duration of mechanical ventilation (days)
-
Maximum ventilatory requirements (oxygenation index (OI), mean airway pressure (MAP), fraction of inspired oxygen (FiO2)) during first seven days of life
-
Duration of oxygen therapy (days)
-
Treatment with high‐frequency ventilation (HFV)
-
Treatment with inhaled nitric oxide
-
Treatment with surfactant lavage
-
Treatment with bolus surfactant administration
-
Treatment with extracorporeal membrane oxygenation (ECMO)
-
Incidence of pulmonary air leak syndrome (pneumothorax, pulmonary interstitial emphysema)
-
Incidence of intracranial haemorrhage
-
Incidence of intraventricular haemorrhage
-
Incidence of periventricular leucomalacia
-
Duration of hospital stay until discharge home among survivors (days)
-
Incidence of oliguria (< 1 mL/kg/h)
-
Incidence of azotaemia (> 1.5 mg/dL)
-
Incidence of diarrhoea
-
Incidence of hearing impairment associated with antibiotics
-
Incidence of suspected sepsis (neonate was suspected to have sepsis if one or a combination of the following markers of sepsis was abnormal: total white blood cell count, absolute neutrophil count, immature‐to‐total neutrophil ratio, C‐reactive protein, cytokines, interleukin (IL)‐6, gastric aspirates for neutrophils or bacteria)
-
Proportion of infants born through MSAF starting antibiotics before discharge
Subgroup analysis
For both of the comparisons above, we planned to perform subgroup analyses to assess effects of the antibiotic regimen, duration of antibiotics, and gestational age.
Search methods for identification of studies
We searched MEDLINE (1966 to July 2016) using the following terms, with all subheadings connected by "AND".
-
Population: infant‐newborn (MeSH) OR infant, newborn, meconium aspiration (MeSH) OR infant, newborn, MAS (MeSH) OR newborn (text word) OR infant (text word) OR neonate (text word) OR meconium aspiration (text word) OR MAS.
-
Intervention: antibacterial agents (MeSH), antibiotics (text word).
-
Comparison: clinical trial (MeSH) OR controlled clinical trial (MeSH) OR randomized controlled trial (MeSH).
Electronic searches We searched other databases including Embase (1980 to July 2016); the Cumulative Index to Nursing and Allied Health Literature (CINAHL; 1982 to July 2016); the Cochrane Central Register of Controlled Trials (CENTRAL; 2016, Issue 7) in the Cochrane Library; and reference lists of identified trials and abstracts from annual meetings of the Society for Pediatric Research, the American Pediatric Society, and Pediatric Academic Societies, published in Pediatric Research (2002 to 2016). We included editorials, commentaries, reviews, lectures, abstracts, and letters to the editor only if they included original data. We applied no language restrictions. We contacted study authors for additional/missing information. We have appended below the detailed search strategy developed by the Cochrane Neonatal Review Group (Appendices).
Electronic searches
We searched other databases including Embase (1980 to July 2016); the Cumulative Index to Nursing and Allied Health Literature (CINAHL; 1982 to July 2016); and the Cochrane Central Register of Controlled Trials (CENTRAL; 2016, Issue 7) in the Cochrane Library; as well as reference lists of identified trials and abstracts from annual meetings of the Society for Pediatric Research, the American Pediatric Society, and Pediatric Academic Societies, published in Pediatric Research (2002 to 2016). We included editorials, commentaries, reviews, lectures, abstracts, and letters to the editor only if they included original data. We applied no language restrictions. We contacted study authors to ask for additional/missing information. We have appended below the detailed search strategy developed by the Cochrane Neonatal Review Group (Appendices).
Searching other resources
We searched multiple clinical trials registries (clinicaltrials.gov; controlled‐trials.com; who.int/ictrp) to identify past, current, and planned clinical studies evaluating antibiotic use in neonates exposed to meconium‐stained amniotic fluid.
Data collection and analysis
Two review authors (LEK, PSS) independently searched for and assessed trials for inclusion and for methodological quality. We resolved discrepancies by consensus. We assessed the quality of studies by using the Cochrane 'Risk of bias' assessment tool (Review Manager 5.3). We evaluated domains of bias that included the following criteria: masking of randomisation, masking of intervention, completeness of follow‐up, and blinding of outcome measurement. Two review authors (LEK, PSS) independently extracted data. We resolved discrepancies or differences by discussion and consensus. We performed meta‐analysis by using RevMan 5.3. We reported mean differences (MDs) for continuous variables, and risk ratios (RRs) and risk differences (RDs) for categorical outcomes. For significant findings, we calculated the number needed to treat for an additional beneficial outcome (NNTB) along with 95% confidence intervals (CIs). We estimated treatment effects of individual trials and examined heterogeneity between trial results by inspecting forest plots and quantifying the impact of heterogeneity in any meta‐analysis using I² as a measure of inconsistency in study results. When we detected statistical heterogeneity, we explored possible causes. We used a fixed‐effect model for meta‐analysis.
Selection of studies
Two review authors (LEK, PSS) independently searched for and assessed trials for inclusion and for methodological quality. We resolved discrepancies by consensus.
Data extraction and management
Two review authors (LEK, PSS) independently extracted and managed data from full‐text publications using Review Manager 5.3.
Assessment of risk of bias in included studies
We assessed the quality of studies by using the Cochrane 'Risk of bias' assessment tool (Review Manager 5.3). We evaluated the following criteria for domains of bias: masking of randomisation, masking of intervention, completeness of follow‐up, and blinding of outcome measurement. Two review authors (LEK, PSS) independently extracted data and resolved discrepancies or differences by discussion and consensus.
Measures of treatment effect
We performed meta‐analysis using RevMan 5.3. We reported mean differences (MDs) for continuous variables, and risk ratios (RRs) and risk differences (RDs) for categorical outcomes. For significant findings, we calculated the number needed to treat for an additional beneficial outcome (NNTB) along with 95% confidence intervals (CIs).
Unit of analysis issues
The unit of analysis in each included study is the individual neonate; we identified no cluster‐randomised studies.
Dealing with missing data
When study data were missing, we contacted corresponding study authors to request further information. We performed all analyses by intention‐to‐treat, including all randomised participants.
Assessment of heterogeneity
We estimated treatment effects of individual trials and examined heterogeneity between trial results by inspecting forest plots and quantifying the impact of heterogeneity in any meta‐analysis using I² to measure inconsistency in study results. When we detected statistical heterogeneity, we explored possible causes. We used a fixed‐effect model for meta‐analysis.
Assessment of reporting biases
We were unable to identify study protocols or clinical trial registrations for all four studies. We reported these findings in the 'Risk of bias' tables.
Data synthesis
We performed data synthesis according to recommendations provided by the Cochrane Neonatal Review Group. We randomly assigned all neonates and performed intention‐to‐treat analysis. If results were presented as medians and interquartile ranges (IQRs), we transformed the data into means and standard deviations using the formulas provided by Wan 2014.
Sensitivity analysis
All included studies evaluated different antibiotic treatment protocols for neonatal exposure to meconium in amniotic fluid; therefore, a sensitivity analysis was not indicated.
Results
Description of studies
See Characteristics of included studies and Characteristics of excluded studies tables. No included studies included mixed populations of symptomatic and asymptomatic neonates at the time of randomisation.
Results of the search
We identified 116 citations from the literature and 41 trials from clinical trials registries. We have presented the process of selection of studies for inclusion in the PRISMA (Preferred Reporting Items for Systematic Reviews and Meta‐Analyses) flow diagram (Figure 1). We included in this review four eligible studies (Basu 2007; Goel 2015; Lin 2005; Shankar 1995) conducted in India and Taiwan with a total of 695 participants. We have presented the demographics of participants and details of interventions, study design, and outcomes in the Characteristics of included studies table.

Figure 1. Study flow diagram.
Included studies
In summary, three studies (Basu 2007; Lin 2005; Shankar 1995) enrolled infants with a diagnosis of MAS (symptomatic).
Shankar 1995 randomised infants (N = 40) with a diagnosis of MAS to antibiotics (gentamicin) for seven days or to no treatment. Shankar 1995 included no predefined primary outcome.
Lin 2005 randomised 259 neonates with a diagnosis of MAS to antibiotics (ampicillin and gentamicin) for three days or no treatment. Lin 2005 included no predefined primary outcome.
Basu 2007 randomised neonates (N = 146) with MAS to antibiotics (ampicillin and amikacin) for seven days or no treatment. The primary outcome in Basu 2007 was the incidence of sepsis.
The fourth included study (Goel 2015) compared the prophylactic effectiveness of antibiotics given for three days versus no treatment in terms of the incidence of sepsis among neonates (N = 250) born through meconium‐stained amniotic fluid. Goel 2015 excluded infants with congenital malformations and those for whom consent could not be obtained. Both groups reported subsequent development of MAS, along with infection.
With respect to heterogeneity between included studies, the diagnostic criteria for MAS (born through meconium‐stained amniotic fluid, respiratory distress for longer than four hours after birth, and radiographic evidence of meconium in the trachea) were consistent among studies. All four trials used positive blood culture screens to define the primary outcome of this review ‐ culture‐proven (confirmed) sepsis. Review authors observed heterogeneity in study design and antibiotic treatment regimens among included studies and noted that investigators evaluated various antibiotics. The following were evaluated (each by two trials): amikacin, gentamicin, and ampicillin.Treatment timelines varied from three days (Goel 2015; Lin 2005) to seven days (Basu 2007; Shankar 1995).
Excluded studies
We excluded studies that did not prospectively evaluate antibiotic use using a randomised clinical design.
Risk of bias in included studies
Included studies showed varying degrees of bias. We have presented risk of bias details for each study in Figure 2. Two included studies (Lin 2005; Shankar 1995) were at overall unclear or high risk of bias, and two included studies (Basu 2007; Goel 2015) were at low risk of bias.
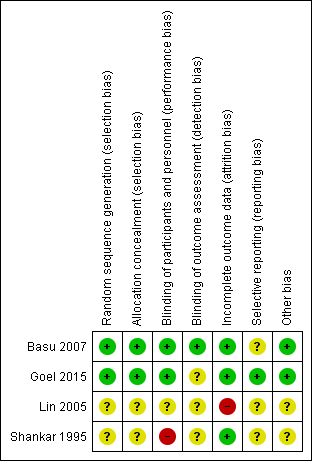
Figure 2. Risk of bias summary: review authors' judgements about each risk of bias item for each included study.
Allocation
Lin 2005 and Shankar 1995 provided no data on allocation concealment, resulting in unclear risk of bias. Basu 2007 and Goel 2015 appropriately concealed treatment allocation.
Blinding
Shankar 1995 did not blind nursery staff, resulting in high risk of bias. Lin 2005 described no blinding of participants, personnel, or outcome assessors. Basu 2007 reported that parents, attendants, radiologists, and statisticians were blinded. Goel 2015 blinded treating clinicians and nursery personnel but did not indicate how the treating clinician could be blinded, as the control group was provided no intervention, resulting in unclear risk of bias.
Incomplete outcome data
Lin 2005 described significant post‐randomisation exclusions, resulting in high risk of bias. Basu 2007,Goel 2015, and Shankar 1995 reported data for all randomised participants.
Selective reporting
Lin 2005 and Shankar 1995 did not provide data points for primary or secondary outcomes. We could not access a protocol or a clinical trials registry for Lin 2005 or Shankar 1995, nor a protocol for Basu 2007, creating unclear risk of bias, as we could not identify planned outcomes. For Goel 2015, reported outcomes matched those in the clinical trial registry.
Other potential sources of bias
We identified no other potential sources of bias in Basu 2007, Goel 2015, Lin 2005, or Shankar 1995.
Effects of interventions
See: Summary of findings for the main comparison Antibiotics compared with control (no antibiotics) in symptomatic neonates born through meconium‐stained amniotic fluid; Summary of findings 2 Antibiotics compared with control (no antibiotics) in asymptomatic neonates born through meconium‐stained amniotic fluid
Antibiotics versus control (no treatment with antibiotics) in neonates with a diagnosis of MAS
Three studies (Basu 2007; Lin 2005; Shankar 1995) evaluated effects of antibiotics in neonates with MAS. We graded evidence showing effects of antibiotics in neonates with a diagnosis of MAS as low owing to the small sample size (of only one study) and unclear risk of bias in the design of included studies.
Primary outcome
Outcome 1.1. Incidence of sepsis within first 28 days of life (Analysis 1.1)
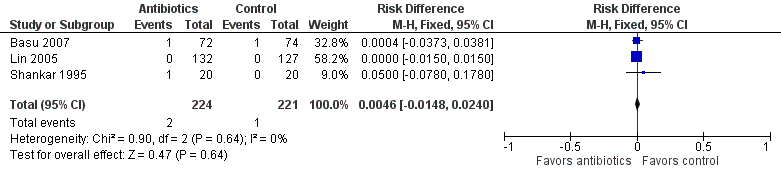
We found no significant differences in risk of culture‐proven, confirmed sepsis (RR 1.54, 95% CI 0.27 to 8.96; RD 0.00, 95% CI ‐0.02 to 0.03; 445 participants, three studies; I² = 0%) (Figure 3). Of note, two of the three included studies (Lin 2005; Shankar 1995) reported a confirmed sepsis event rate of zero in both groups. Owing to low infection rates and limited information on the time of onset, we could not evaluate early‐onset versus late‐onset neonatal sepsis. None of the three studies included in this analysis reported the incidence of suspected sepsis.

Forest plot of comparison: Incidence of confirmed sepsis in symptomatic neonates within the first 28 days.
Secondary outcomes
Outcome 1.2. Mortality before discharge (Analysis 1.2)
We found no statistically significant differences in mortality between groups (RR 1.69, 95% CI 0.23 to 12.53; RD 0.00, 95% CI ‐0.01 to 0.02; 445 participants, three studies; I² = 0%) (Figure 4).
Forest plot of comparison: Mortality in symptomatic neonates (before discharge).
Outcome 1.3. Duration of oxygen therapy (days) (Analysis 1.3)
Duration of oxygen therapy, as evaluated in two studies, was significantly less in the antibiotics group than in the control group (MD ‐0.85, 95% CI ‐1.19 to ‐0.52; 405 participants, two studies; I² = 73%; P < 0.00001).
Outcome 1.4. Duration of hospital stay (days) (Analysis 1.4)
Basu 2007 noted no statistically significant differences in mean duration of hospital stay between neonates who received antibiotics and those in the control group (MD 0.16, 95% CI ‐1.15 to 1.47; 146 participants, one study; I² = 0%).
Outcome 1.5. Incidence of pulmonary air leak syndrome (Analysis 1.5)
Trial authors noted no statistically significant differences in pulmonary air leak syndrome between groups (RR 1.50, 95% CI 0.62 to 3.67; RD 0.02, 95% CI ‐0.02 to 0.05; 445 participants, three studies; I² = 38%).
Post hoc outcomes in neonates with MAS
We added post hoc outcomes after reviewing included studies.
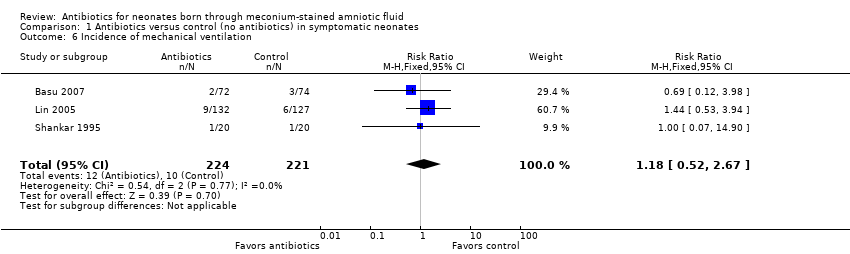
Incidence of mechanical ventilation (outcome 1.6) (Analysis 1.6)
Three studies reported the incidence of mechanical ventilation. Results show no statistically significant differences in the requirement for mechanical ventilation between antibiotic and control groups (RR 1.18, 95% CI 0.52 to 2.67; RD 0.01, 95% CI ‐0.03 to 0.05; 445 participants, three studies; I² = 0%).
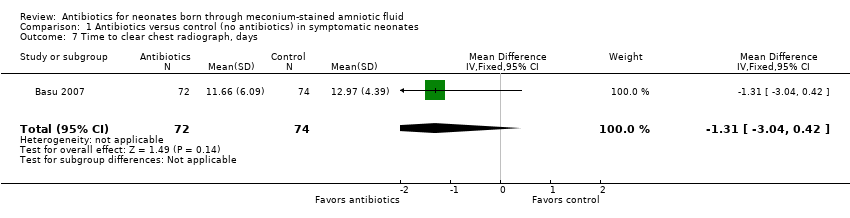
Time to clear chest radiograph (days) (outcome 1.7) (Analysis 1.7)
Basu 2007 evaluated the time it took to obtain a clear chest radiograph in neonates with the diagnosis of MAS. Results show no statistically significant differences in both antibiotic and control groups (MD ‐1.31 days, 95% CI ‐3.04 to 0.42 days; 146 participants, one study; I² = 0%; P = 0.14).
Incidence of respiratory failure (outcome 1.8) (Analysis 1.8)
Two studies (Basu 2007; Lin 2005) reported the incidence of respiratory failure. Data show no statistically significant differences in risk between antibiotic and control groups (RR 1.20, 95% CI 0.51 to 2.83; RD 0.01, 95% CI ‐0.03 to 0.05; 405 participants, two studies; I² = 0%).
Duration of respiratory distress (hours) (outcome 1.9) Analysis 1.9
Neonates with MAS randomised to receive antibiotics did not experience different durations of respiratory distress (MD ‐1.20 hours, 95% CI ‐25.59 to 23.19 hours; 40 participants, one study; I² = 0%).
Antibiotics versus control (no treatment with antibiotics) in asymptomatic neonates
Only one study contributed data for this comparison (Goel 2015). We graded the evidence for effects of antibiotics in neonates who appear asymptomatic as low owing to the small sample size (of only one study). We were unable to assess the generalisability and impact of these findings.
Primary outcome
Outcome 2.1. Incidence of confirmed sepsis in first 28 days (Analysis 2.1)
Results show no significant differences in risk of culture‐proven, confirmed sepsis between groups (RR 0.76, 95% CI 0.25 to 2.34; RD ‐0.01, 95% CI ‐0.07 to 0.04; 250 participants, one study; I² = 0%). As only one study evaluated infection prevention in asymptomatic neonates, and given that infection rates were low and information on time of onset was limited, we could not evaluate early‐onset versus late‐onset neonatal sepsis.
Secondary outcomes
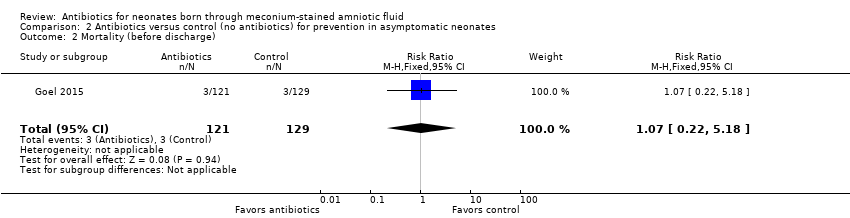
Outcome 2.2. Mortality (before discharge) (Analysis 2.2)
We noted no significant differences in mortality before discharge from hospital between groups (RR 1.07, 95% CI 0.22 to 5.18; RD 0.00, 95% CI ‐0.04 to 0.04; 250 participants, one study; I² = 0%).
Outcome 2.3. Duration of mechanical ventilation (days) (Analysis 2.3)
Duration of mechanical ventilation was significantly longer in the antibiotics group than in the placebo group (MD 0.26 days, 95% CI 0.15 to 0.37 days; 250 participants; one study; I² = 0%; P < 0.00001).
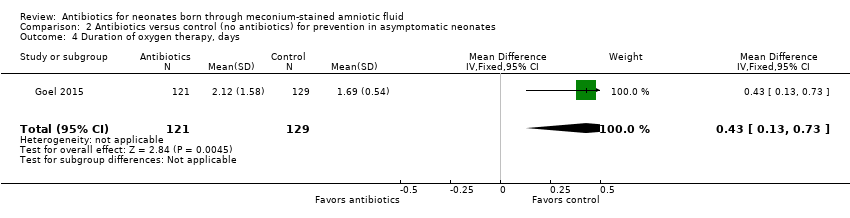
Outcome 2.4. Duration of oxygen therapy (days) (Analysis 2.4)
Neonates in the antibiotic arm required oxygen for a significantly longer time than those in the control group (MD 0.43 days, 95% CI 0.13 to 0.73 days; 250 participants, one study; I² = 0%; P = 0.004) (Analysis 2.4).
Outcome 2.5. Incidence of suspected sepsis (Analysis 2.5)
Suspected sepsis was confirmed in 50% of cases in both antibiotic and control groups. Results show no significant differences in the incidence of suspected sepsis between groups (RR 0.76, 95% CI 0.35 to 1.65; RD ‐0.03, 95% CI ‐0.10 to 0.05; 250 participants, one study; I² = 0%).
Outcome 2.6. Incidence of intracranial haemorrhage (Analysis 2.6)
Investigators identified only one case of intracranial haemorrhage in the control group, making this finding not significantly different from that in the antibiotic group (RR 0.36, 95% CI 0.01 to 8.64; RD ‐0.01, 95% CI ‐0.03 to 0.01; 250 participants; one study; I² = 0%).
Outcome 2.7. Incidence of azotaemia (Analysis 2.7)
Goel 2015 detected azotaemia in one infant treated with antibiotics. Data show no statistically significant differences in the incidence of azotaemia between groups (RR 3.20, 95% CI 0.13 to 77.73; RD 0.01, 95% CI ‐0.01 to 0.03; 250 participants, one study; I² = 0%).
Outcome 2.8. Incidence of oliguria (Analysis 2.8)
Goel 2015 detected only one case of oliguria in the antibiotics group. Study results show no statistically significant differences in the incidence of oliguria between groups (RR 3.20, 95% CI 0.13 to 77.73; RD 0.01, 95% CI ‐0.01 to 0.03; 250 participants, one study; I² = 0%).
Outcome 2.9. Incidence of diarrhoea (Analysis 2.9)
Researchers documented diarrhoea in four infants in the control group. Data show no statistically significant differences in the rate of diarrhoea between antibiotic and control groups (RR 0.12, 95% CI 0.01 to 2.18; RD ‐0.03, 95% CI ‐0.06 to 0.00; 250 participants, one study; I² = 0%).
Additional Outcome: Length of stay
Goel 2015 reported duration of stay in hospital at a median of three days (range three to three days) in both groups. As the range is 0, and the mean/standard deviation was not reported or was not available from the corresponding author, we could perform no further analysis on this outcome.
Post hoc outcomes in asymptomatic neonates
We added post hoc outcomes after reviewing included studies.
Outcome 2.10. Incidence of mechanical ventilation (Analysis 2.10)
Data show no significant differences in the number of neonates requiring mechanical ventilation between groups (RR 2.13, 95% CI 0.55 to 8.34; RD 0.03, 95% CI ‐0.02 to 0.07; 250 participants, one study; I² = 0%).
Outcome 2.11. Incidence of respiratory distress (Downe's score) (Analysis 2.11)
Results show no differences in risk of respiratory distress between antibiotic and control groups (RR 1.18, 95% CI 0.81 to 1.72; RD 0.05, 95% CI ‐0.06 to 0.17; 250 participants, one study; I² = 0%).
Outcome 2.12. Duration of respiratory distress (hours) (Analysis 2.12)
Neonates randomised to antibiotics had a significantly longer duration of respiratory distress than those in the control group (MD 6.87 hours, 95% CI 4.22 to 9.52 hours; 250 participants, one study; I² = 0%; P < 0.00001).
Outcome 2.13. Incidence of MAS (Analysis 2.13)
Goel 2015 treated neonates exposed to meconium but without a diagnosis of MAS before enrolment. Data show no significant differences in development of MAS between antibiotic and control groups (RR 1.17, 95% CI 0.67 to 2.04; RD 0.03, 95% CI ‐0.07 to 0.12; 250 participants, one study; I² = 0%).
Subgroup analysis
We could not complete comparisons planned to evaluate effects of antibiotic regimens, duration of antibiotics, and gestational age owing to limited information provided by few studies.
Discussion
Summary of main results
Clinicians have used various antibiotics and antibiotic regimens to treat neonates exposed to meconium during delivery. We identified four randomised controlled trials that enrolled 695 individuals to evaluate effectiveness of antibiotics in reducing infection following meconium exposure or diagnosis of meconium aspiration syndrome (MAS). Upon review of available evidence, we identified no differences in risk of infection (confirmed sepsis) among neonates receiving antibiotics (3/224) and controls (2/221) following MAS diagnosis. Evidence does not allow us to corroborate differences in the incidence of confirmed sepsis among asymptomatic neonates receiving antibiotics. Data show that in symptomatic neonates, antibiotics significantly lowered the duration of oxygen therapy, but in asymptomatic neonates, antibiotics were significantly associated with increased duration of oxygen therapy, mechanical ventilation, and respiratory distress. Given these inconsistent findings and the small numbers of neonates enrolled in these studies, we cannot present conclusions regarding the efficacy or safety of antibiotics in preventing infection following meconium exposure.
Overall completeness and applicability of evidence
All four included trials consistently reported no significant improvement in infection reduction with antibiotic treatment or prophylaxis despite use of different antibiotics and treatment durations. Studies were of mixed quality, included small sample sizes, and differed marginally in types of antibiotics and duration of therapy examined. Differences in antibiotic type and in treatment timelines (three to seven days) created heterogeneity in the intervention arms of included studies.
Quality of the evidence
All four trials compared antibiotics versus no treatment and did not include a placebo control. The lack of placebo control may have resulted in biased reporting; however, each study objectively defined criteria for sepsis. Limitations of this review include that the methodological quality of some included studies was poor, and that none of these studies included a placebo arm and full blinding of treating clinicians. Types of outcome measures reported showed some inconsistency, with only one trial evaluating the duration of mechanical ventilation, and with various measures of respiratory morbidity used across studies. We downgraded evidence owing to imprecision related to small sample sizes and unclear methodological features in some trials.
Potential biases in the review process
When interpreting the results of this review, one must consider the overall low event rate for sepsis in both intervention and control arms of all four trials. Variation in study design, including the addition of post hoc outcomes, could present a potential source of bias. After searching the literature, the review authors believed that relevant clinical outcomes should be added, but outcomes evaluated post hoc did not influence overall recommendations provided in this review. Although dogma suggests that meconium (comprising mostly water) is sterile, this paradigm is shifting, as several studies have identified bacterial contaminants in meconium samples (Jiménez 2008; Madan 2012; Mshvildadze 2010). Further investigation into the variable degree of bacterial colonisation observed in meconium and characterisation of organisms as pathogenic or non‐pathogenic may allow clinicians to better predict which neonates are at greatest risk for infection.
Agreements and disagreements with other studies or reviews
Similar to reviews published in 2015 (Pongmee 2015) and 2016 (Natarajan 2016), we did not identify a change in risk of infection (confirmed sepsis) among neonates receiving antibiotics following exposure to meconium.
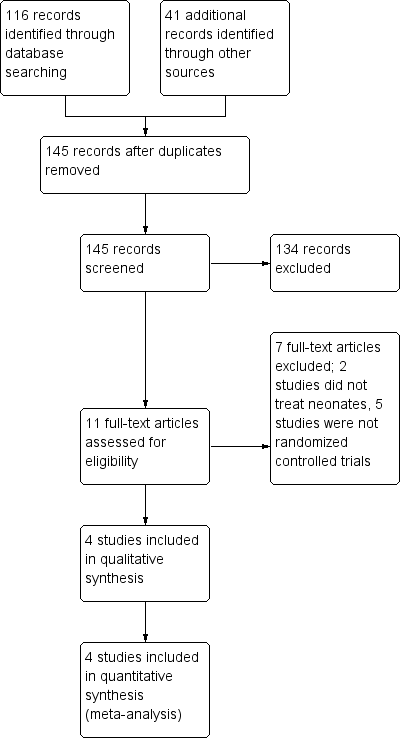
Figure 1. Study flow diagram.

Figure 2. Risk of bias summary: review authors' judgements about each risk of bias item for each included study.

Forest plot of comparison: Incidence of confirmed sepsis in symptomatic neonates within the first 28 days.

Forest plot of comparison: Mortality in symptomatic neonates (before discharge).

Comparison 1 Antibiotics versus control (no antibiotics) in symptomatic neonates, Outcome 1 Incidence of confirmed sepsis in first 28 days.

Comparison 1 Antibiotics versus control (no antibiotics) in symptomatic neonates, Outcome 2 Mortality (before discharge).
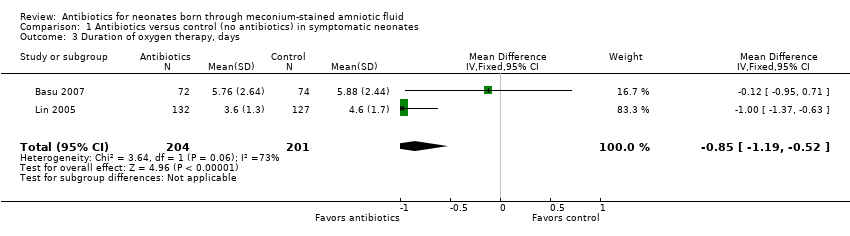
Comparison 1 Antibiotics versus control (no antibiotics) in symptomatic neonates, Outcome 3 Duration of oxygen therapy, days.

Comparison 1 Antibiotics versus control (no antibiotics) in symptomatic neonates, Outcome 4 Duration of hospital stay, days.

Comparison 1 Antibiotics versus control (no antibiotics) in symptomatic neonates, Outcome 5 Incidence of pulmonary air leak syndrome.
Comparison 1 Antibiotics versus control (no antibiotics) in symptomatic neonates, Outcome 6 Incidence of mechanical ventilation.
Comparison 1 Antibiotics versus control (no antibiotics) in symptomatic neonates, Outcome 7 Time to clear chest radiograph, days.

Comparison 1 Antibiotics versus control (no antibiotics) in symptomatic neonates, Outcome 8 Incidence of respiratory failure.

Comparison 1 Antibiotics versus control (no antibiotics) in symptomatic neonates, Outcome 9 Duration of respiratory distress, hours.

Comparison 2 Antibiotics versus control (no antibiotics) for prevention in asymptomatic neonates, Outcome 1 Incidence of confirmed sepsis in first 28 days.
Comparison 2 Antibiotics versus control (no antibiotics) for prevention in asymptomatic neonates, Outcome 2 Mortality (before discharge).

Comparison 2 Antibiotics versus control (no antibiotics) for prevention in asymptomatic neonates, Outcome 3 Duration of mechanical ventilation, days.
Comparison 2 Antibiotics versus control (no antibiotics) for prevention in asymptomatic neonates, Outcome 4 Duration of oxygen therapy, days.
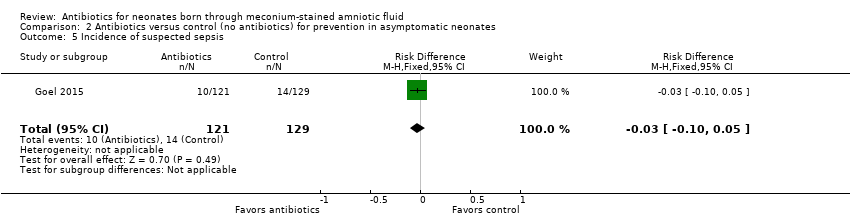
Comparison 2 Antibiotics versus control (no antibiotics) for prevention in asymptomatic neonates, Outcome 5 Incidence of suspected sepsis.

Comparison 2 Antibiotics versus control (no antibiotics) for prevention in asymptomatic neonates, Outcome 6 Incidence of intracranial haemorrhage.

Comparison 2 Antibiotics versus control (no antibiotics) for prevention in asymptomatic neonates, Outcome 7 Incidence of azotaemia.
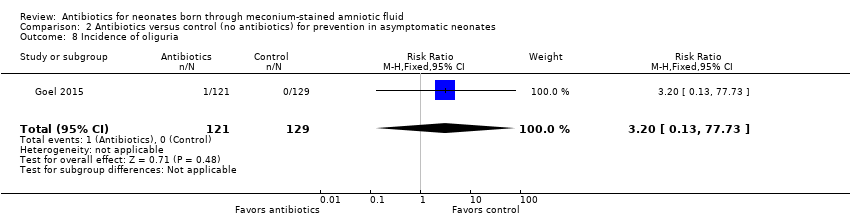
Comparison 2 Antibiotics versus control (no antibiotics) for prevention in asymptomatic neonates, Outcome 8 Incidence of oliguria.

Comparison 2 Antibiotics versus control (no antibiotics) for prevention in asymptomatic neonates, Outcome 9 Incidence of diarrhoea.

Comparison 2 Antibiotics versus control (no antibiotics) for prevention in asymptomatic neonates, Outcome 10 Incidence of mechanical ventilation.

Comparison 2 Antibiotics versus control (no antibiotics) for prevention in asymptomatic neonates, Outcome 11 Incidence of respiratory distress (Downe's score).

Comparison 2 Antibiotics versus control (no antibiotics) for prevention in asymptomatic neonates, Outcome 12 Duration of respiratory distress, hours.

Comparison 2 Antibiotics versus control (no antibiotics) for prevention in asymptomatic neonates, Outcome 13 Incidence of MAS.
| Antibiotics compared with control (no antibiotics) in symptomatic neonates born through meconium‐stained amniotic fluid | ||||||
| Patient or population: symptomatic neonates born through meconium‐stained amniotic fluid | ||||||
| Outcomes | Anticipated absolute effects* (95% CI) | Relative effect | Number of participants | Quality of the evidence | Comments | |
| Risk with control (no antibiotics) | Risk with antibiotics | |||||
| Incidence of confirmed sepsis in first 28 days | Study population | Not estimable | 445 | ⊕⊕⊝⊝ | Evidence was downgraded owing to unclear risk of bias due to methodological limitations, including a large number of dropouts; and imprecision resulting from a small sample size | |
| 9 per 1000 | 0 per 1000 | |||||
| Mortality (before discharge) | Study population | RR 1.69 | 445 | ⊕⊕⊝⊝ | Evidence was downgraded owing to unclear risk of bias due to methodological limitations, including a large number of dropouts; and imprecision resulting from a small sample size | |
| 5 per 1000 | 8 per 1000 | |||||
| Duration of oxygen therapy, days | Mean duration of oxygen therapy (days) was 0 | MD 0.85 days lower | ‐ | 405 | ⊕⊕⊝⊝ | Evidence was downgraded owing to unclear risk of bias due to methodological limitations, including a large number of dropouts; and imprecision resulting from a small sample size |
| Duration of hospital stay, days | Mean duration of hospital stay (days) was 0 | MD 0.16 days higher | ‐ | 146 | ⊕⊕⊕⊝ | Evidence was downgraded owing to imprecision resulting from a small sample size |
| Incidence of mechanical ventilation | Study population | RR 1.18 | 445 | ⊕⊕⊝⊝ | Evidence was downgraded owing to unclear risk of bias due to methodological limitations, including a large number of dropouts; and imprecision resulting from a small sample size | |
| 45 per 1000 | 53 per 1000 | |||||
| Incidence of respiratory failure | Study population | RR 1.20 | 405 | ⊕⊕⊝⊝ | Evidence was downgraded owing to unclear risk of bias due to methodological limitations, including a large number of dropouts; and imprecision resulting from a small sample size | |
| 41 per 1000 | 47 per 1000 | |||||
| *The risk in the intervention group (and its 95% confidence interval) is based on assumed risk in the comparison group and relative effect of the intervention (and its 95% CI) | ||||||
| GRADE Working Group grades of evidence | ||||||
| Antibiotics compared with control (no antibiotics) in asymptomatic neonates born through meconium‐stained amniotic fluid | ||||||
| Patient or population: asymptomatic neonates born through meconium‐stained amniotic fluid | ||||||
| Outcomes | Anticipated absolute effects* (95% CI) | Relative effect | Number of participants | Quality of the evidence | Comments | |
| Risk with control (no antibiotics) | Risk with antibiotics | |||||
| Incidence of confirmed sepsis in first 28 days | Study population | Not estimable | 250 | ⊕⊕⊝⊝ | Evidence was downgraded owing to very serious imprecision, as the results from this study have not been replicated | |
| 54 per 1000 | 0 per 1000 | |||||
| Mortality (before discharge) | Study population | RR 1.07 | 250 | ⊕⊕⊝⊝ | Evidence was downgraded owing to very serious imprecision, as the results from this study have not been replicated | |
| 23 per 1000 | 25 per 1000 | |||||
| Duration of oxygen therapy, days | Mean duration of oxygen therapy (days) was 0 | MD 0.43 days higher | ‐ | 250 | ⊕⊕⊝⊝ | Evidence was downgraded owing to very serious imprecision, as the results from this study have not been replicated |
| Incidence of suspected sepsis | Study population | Not estimable | 250 | ⊕⊕⊝⊝ | Evidence was downgraded owing to very serious imprecision, as the results from this study have not been replicated | |
| 109 per 1000 | 0 per 1000 | |||||
| Incidence of mechanical ventilation | Study population | RR 2.13 | 250 | ⊕⊕⊝⊝ | Evidence was downgraded owing to very serious imprecision, as the results from this study have not been replicated | |
| 23 per 1000 | 50 per 1000 | |||||
| Duration of respiratory distress, hours | Mean duration of respiratory distress (hours) was 0 | MD 6.87 higher | ‐ | 250 | ⊕⊕⊝⊝ | Evidence was downgraded owing to very serious imprecision, as the results from this study have not been replicated |
| Incidence of MAS | Study population | RR 1.17 | 250 | ⊕⊕⊝⊝ | Evidence was downgraded owing to very serious imprecision, as the results from this study have not been replicated | |
| 155 per 1000 | 181 per 1000 | |||||
| *The risk in the intervention group (and its 95% confidence interval) is based on assumed risk in the comparison group and relative effect of the intervention (and its 95% CI) | ||||||
| GRADE Working Group grades of evidence | ||||||
| Outcome or subgroup title | No. of studies | No. of participants | Statistical method | Effect size |
| 1 Incidence of confirmed sepsis in first 28 days Show forest plot | 3 | 445 | Risk Difference (M‐H, Fixed, 95% CI) | 0.00 [‐0.02, 0.03] |
| 2 Mortality (before discharge) Show forest plot | 3 | 445 | Risk Difference (M‐H, Fixed, 95% CI) | 0.00 [‐0.01, 0.02] |
| 3 Duration of oxygen therapy, days Show forest plot | 2 | 405 | Mean Difference (IV, Fixed, 95% CI) | ‐0.85 [‐1.19, ‐0.52] |
| 4 Duration of hospital stay, days Show forest plot | 1 | 146 | Mean Difference (IV, Fixed, 95% CI) | 0.16 [‐1.15, 1.47] |
| 5 Incidence of pulmonary air leak syndrome Show forest plot | 3 | 445 | Risk Ratio (M‐H, Fixed, 95% CI) | 1.50 [0.62, 3.67] |
| 6 Incidence of mechanical ventilation Show forest plot | 3 | 445 | Risk Ratio (M‐H, Fixed, 95% CI) | 1.18 [0.52, 2.67] |
| 7 Time to clear chest radiograph, days Show forest plot | 1 | 146 | Mean Difference (IV, Fixed, 95% CI) | ‐1.31 [‐3.04, 0.42] |
| 8 Incidence of respiratory failure Show forest plot | 2 | 405 | Risk Difference (M‐H, Fixed, 95% CI) | 0.01 [‐0.03, 0.05] |
| 9 Duration of respiratory distress, hours Show forest plot | 1 | 40 | Mean Difference (IV, Random, 95% CI) | ‐1.20 [‐25.59, 23.19] |
| Outcome or subgroup title | No. of studies | No. of participants | Statistical method | Effect size |
| 1 Incidence of confirmed sepsis in first 28 days Show forest plot | 1 | 250 | Risk Difference (M‐H, Fixed, 95% CI) | ‐0.01 [‐0.07, 0.04] |
| 2 Mortality (before discharge) Show forest plot | 1 | 250 | Risk Ratio (M‐H, Fixed, 95% CI) | 1.07 [0.22, 5.18] |
| 3 Duration of mechanical ventilation, days Show forest plot | 1 | 250 | Mean Difference (IV, Fixed, 95% CI) | 0.26 [0.15, 0.37] |
| 4 Duration of oxygen therapy, days Show forest plot | 1 | 250 | Mean Difference (IV, Fixed, 95% CI) | 0.43 [0.13, 0.73] |
| 5 Incidence of suspected sepsis Show forest plot | 1 | 250 | Risk Difference (M‐H, Fixed, 95% CI) | ‐0.03 [‐0.10, 0.05] |
| 6 Incidence of intracranial haemorrhage Show forest plot | 1 | 250 | Risk Ratio (M‐H, Fixed, 95% CI) | 0.36 [0.01, 8.64] |
| 7 Incidence of azotaemia Show forest plot | 1 | 250 | Risk Ratio (M‐H, Fixed, 95% CI) | 3.20 [0.13, 77.73] |
| 8 Incidence of oliguria Show forest plot | 1 | 250 | Risk Ratio (M‐H, Fixed, 95% CI) | 3.20 [0.13, 77.73] |
| 9 Incidence of diarrhoea Show forest plot | 1 | 250 | Risk Ratio (M‐H, Fixed, 95% CI) | 0.12 [0.01, 2.18] |
| 10 Incidence of mechanical ventilation Show forest plot | 1 | 250 | Risk Ratio (M‐H, Fixed, 95% CI) | 2.13 [0.55, 8.34] |
| 11 Incidence of respiratory distress (Downe's score) Show forest plot | 1 | 250 | Risk Ratio (M‐H, Fixed, 95% CI) | 1.18 [0.81, 1.72] |
| 12 Duration of respiratory distress, hours Show forest plot | 1 | 250 | Mean Difference (IV, Fixed, 95% CI) | 6.87 [4.22, 9.52] |
| 13 Incidence of MAS Show forest plot | 1 | 250 | Risk Ratio (M‐H, Fixed, 95% CI) | 1.17 [0.67, 2.04] |