Monitorización uterina domiciliaria para la detección del trabajo de parto prematuro
Información
- DOI:
- https://doi.org/10.1002/14651858.CD006172.pub4Copiar DOI

- Base de datos:
-
- Cochrane Database of Systematic Reviews
- Versión publicada:
-
- 15 febrero 2017see what's new
- Tipo:
-
- Intervention
- Etapa:
-
- Review
- Grupo Editorial Cochrane:
-
Grupo Cochrane de Embarazo y parto
- Copyright:
-
- Copyright © 2017 The Cochrane Collaboration. Published by John Wiley & Sons, Ltd.
Cifras del artículo
Altmetric:
Citado por:
Autores
Contributions of authors
Rosemary Currell and Christine Urquhart jointly worked on the protocol, with assistance from Liz Callow for literature searching and development of the search strategy. Francoise Harlow advised on the protocol and commented on the draft review. The idea for the review emerged from a systematic review of telemedicine (for the Cochrane Effective Practice and Organisation of Care Group) which identified a discrete set of studies on home uterine monitoring that were more suitable for consideration as a separate review for the Cochrane Pregnancy and Childbirth Group. Both Rosemary Currell and Christine Urquhart were review authors on the telemedicine review.
Rosemary Currell and Christine Urquhart jointly worked on the 2014 and 2016 updates with contributions from Liz Callow (search strategy development) and Francoise Harlow (contribution to background).
Christine Urquhart is the contact author and guarantor for this review.
Sources of support
Internal sources
-
Aberystwyth University, UK.
External sources
-
UNDP‐UNFPA‐UNICEF‐WHO‐World Bank Special Programme of Research, Development and Research Training in Human Reproduction (HRP), Department of Reproductive Health and Research (RHR), World Health Organization, Switzerland.
2014 update
-
National Institute for Health Research (NIHR), UKNIHR Cochrane Programme Grant Project: 13/89/05 – Pregnancy and childbirth systematic reviews to support clinical guidelines, UK.
Declarations of interest
Christine Urquhart was a co‐author with Rosemary Currell on a Cochrane Review of telemedicine for the EPOC group.
Rosemary Currell: University of Wales Swansea received a grant from the Welsh Office of Research and Development for work on the Cochrane Review of telemedicine (published 2000), from which the current review originated.
Francoise Harlow: none known.
Liz Callow: none known.
Acknowledgements
Therese Dowswell, for assistance with the editorial queries for the 2016 update.
Nancy Medley, for preparing the 'Summary of findings' table for the 2014 update. Nancy Medley's work was financially supported by the UNDP/UNFPA/UNICEF/WHO/World Bank Special Programme of Research, Development and Research Training in Human Reproduction (HRP), Department of Reproductive Health and Research (RHR), World Health Organization. The named authors alone are responsible for the views expressed in this publication.
The review authors thank the Cochrane Pregnancy and Childbirth Group (Liverpool, UK) for their support, and the Cochrane Effective Practice and Organisation of Care Group for their earlier support in the telemedicine systematic review work that was the start of this particular review.
As part of the prepublication editorial process, the previous version of this review (Urquhart 2012) was commented on by three peers (an editor and two referees who are external to the editorial team) and the Group's Statistical Adviser.
This project was supported by the National Institute for Health Research, via Cochrane programme Grant funding to Cochrane Pregnancy and Childbirth. The views and opinions expressed therein are those of the authors and do not necessarily reflect those of the Systematic Reviews Programme, NIHR, NHS or the Department of Health.
Version history
| Published | Title | Stage | Authors | Version |
| 2017 Feb 15 | Home uterine monitoring for detecting preterm labour | Review | Christine Urquhart, Rosemary Currell, Francoise Harlow, Liz Callow | |
| 2015 Jan 06 | Home uterine monitoring for detecting preterm labour | Review | Christine Urquhart, Rosemary Currell, Francoise Harlow, Liz Callow | |
| 2012 May 16 | Home uterine monitoring for detecting preterm labour | Review | Christine Urquhart, Rosemary Currell, Francoise Harlow, Liz Callow | |
| 2006 Oct 18 | Home uterine monitoring for detecting preterm labour | Protocol | Rosemary Currell, Christine Urquhart, Fran Harlow, Liz Callow | |
Differences between protocol and review
We have updated the methods to reflect the latest Cochrane Handbook for Systematic Reviews of Interventions (Higgins 2011) and the Cochrane Pregnancy and Childbirth Group's methodological guidelines.
In the protocol we stated that we intended to carry out the following subgroup analyses: singleton pregnancy; multiple pregnancy; gestational age at which home uterine activity monitoring (HUAM) began; type of HUAM used; reason HUAM was used. We planned to use the following outcomes: perinatal mortality and preterm birth less than 34 weeks. The studies provided only data on singleton pregnancy and multiple pregnancy, and only one study was involved. For this update, we added the following outcomes to the methods for subgroup analysis:
-
preterm birth less than 37 weeks;
-
respiratory distress syndrome;
-
number of unscheduled antenatal visits.
Keywords
MeSH
Medical Subject Headings (MeSH) Keywords
- Early Diagnosis;
- Gestational Age;
- Intensive Care Units, Neonatal [statistics & numerical data];
- Obstetric Labor, Premature [*diagnosis];
- Patient Admission [statistics & numerical data];
- Premature Birth [epidemiology, *prevention & control];
- Prenatal Care [statistics & numerical data];
- Randomized Controlled Trials as Topic;
- Uterine Monitoring [*methods];
Medical Subject Headings Check Words
Female; Humans; Infant, Newborn; Pregnancy;
PICO

Study flow diagram.

Methodological quality graph: review authors' judgements about each methodological quality item presented as percentages across all included studies.

Methodological quality summary: review authors' judgements about each methodological quality item for each included study.
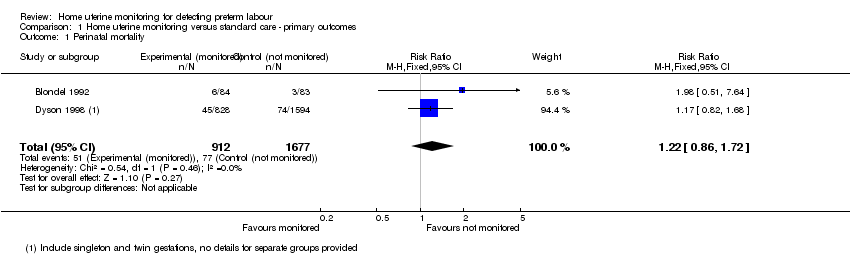
Comparison 1 Home uterine monitoring versus standard care ‐ primary outcomes, Outcome 1 Perinatal mortality.

Comparison 1 Home uterine monitoring versus standard care ‐ primary outcomes, Outcome 2 Preterm birth < 34 weeks.
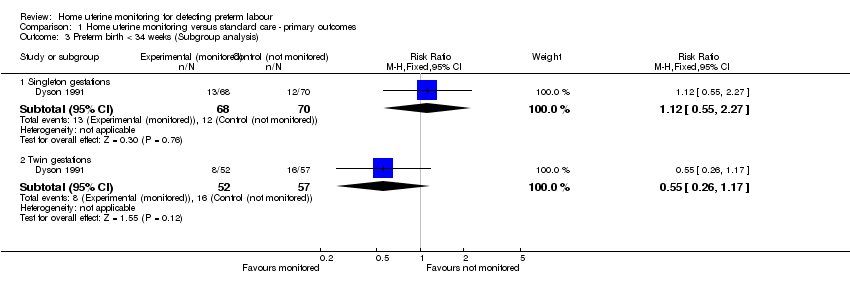
Comparison 1 Home uterine monitoring versus standard care ‐ primary outcomes, Outcome 3 Preterm birth < 34 weeks (Subgroup analysis).

Comparison 2 Home uterine monitoring versus standard care (secondary outcomes ‐ infant), Outcome 1 Preterm birth < 37 weeks.

Comparison 2 Home uterine monitoring versus standard care (secondary outcomes ‐ infant), Outcome 2 Preterm birth < 37 weeks (Subgroup analysis).
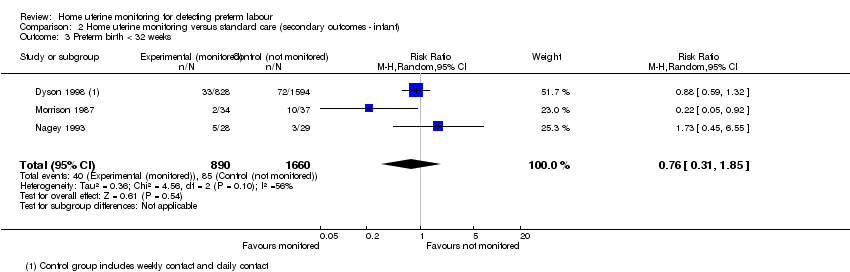
Comparison 2 Home uterine monitoring versus standard care (secondary outcomes ‐ infant), Outcome 3 Preterm birth < 32 weeks.
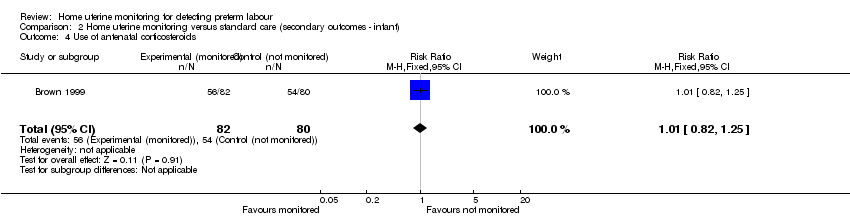
Comparison 2 Home uterine monitoring versus standard care (secondary outcomes ‐ infant), Outcome 4 Use of antenatal corticosteroids.
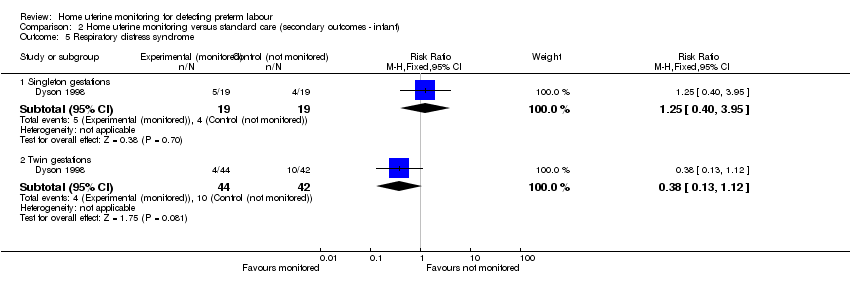
Comparison 2 Home uterine monitoring versus standard care (secondary outcomes ‐ infant), Outcome 5 Respiratory distress syndrome.
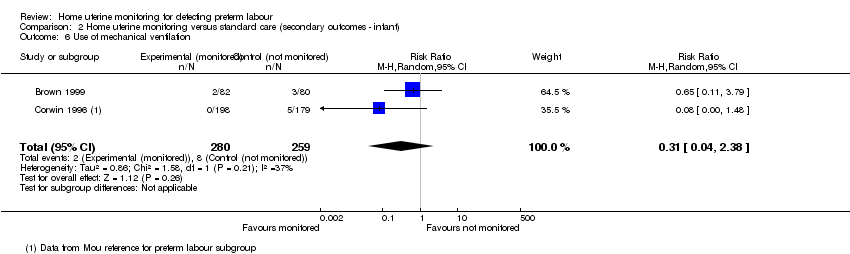
Comparison 2 Home uterine monitoring versus standard care (secondary outcomes ‐ infant), Outcome 6 Use of mechanical ventilation.

Comparison 2 Home uterine monitoring versus standard care (secondary outcomes ‐ infant), Outcome 7 Admission to neonatal intensive care unit.

Comparison 2 Home uterine monitoring versus standard care (secondary outcomes ‐ infant), Outcome 8 Mode of delivery.

Comparison 3 Home uterine monitoring versus standard care (secondary outcomes ‐ prenatal), Outcome 1 Number of antenatal visits (unscheduled).
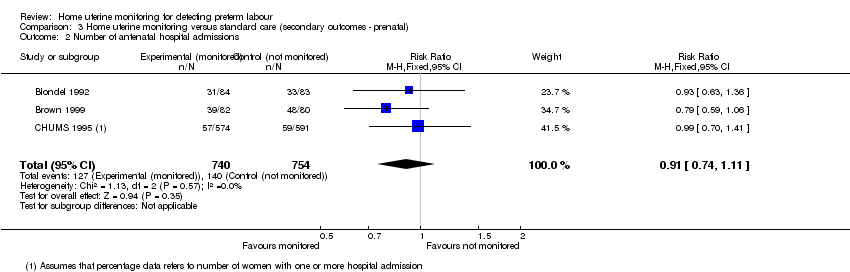
Comparison 3 Home uterine monitoring versus standard care (secondary outcomes ‐ prenatal), Outcome 2 Number of antenatal hospital admissions.
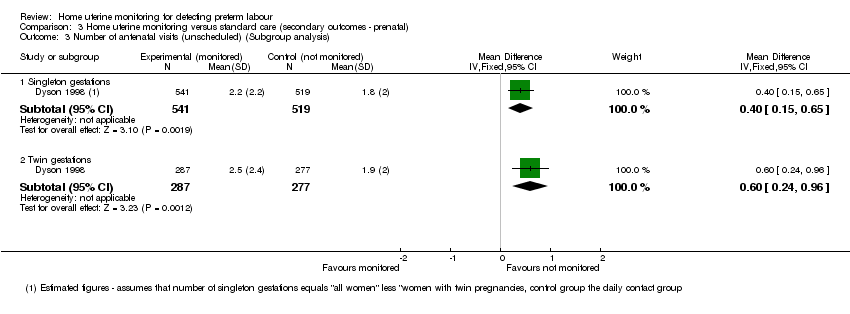
Comparison 3 Home uterine monitoring versus standard care (secondary outcomes ‐ prenatal), Outcome 3 Number of antenatal visits (unscheduled) (Subgroup analysis).
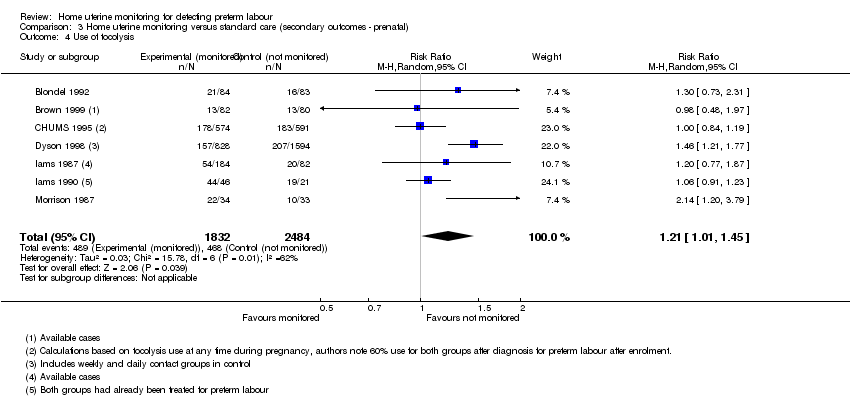
Comparison 3 Home uterine monitoring versus standard care (secondary outcomes ‐ prenatal), Outcome 4 Use of tocolysis.
| Home uterine monitoring for preventing preterm birth | ||||||
| Patient or population: women undergoing home monitoring for preventing preterm birth versus women receiving standard care | ||||||
| Outcomes | Illustrative comparative risks* (95% CI) | Relative effect | No of Participants | Quality of the evidence | Comments | |
| Assumed risk | Corresponding risk | |||||
| Control | Home uterine monitoring | |||||
| Perinatal mortality | Study population | RR 1.22 | 2589 | ⊕⊕⊝⊝ | ||
| 46 per 1000 | 56 per 1000 | |||||
| Preterm birth less than 34 weeks' gestation | Study population | RR 0.78 | 1596 | ⊕⊕⊕⊕ | Sensitivity analysis included 1 study at low risk of bias (1292 women) and did not show any difference in results | |
| 166 per 1000 | 130 per 1000 | |||||
| Antenatal hospital admissions | Study population | RR 0.91 | 1494 | ⊕⊕⊝⊝ | ||
| 186 per 1000 | 169 per 1000 | |||||
| Preterm birth less than 37 weeks' gestation | Study population | RR 0.85 | 4834 | ⊕⊝⊝⊝ | ||
| 364 per 1000 | 310 per 1000 | |||||
| Admission to NICU | Study population | RR 0.77 | 2367 | ⊕⊕⊕⊝ | Evidence not downgraded for moderate heterogeneity (I² = 32%) | |
| 290 per 1000 | 223 per 1000 | |||||
| Number of unscheduled antenatal visits | The mean number of days ranged across control groups from approximately 1 to 2 days | The mean number of days in the monitored group was approximately half a day higher MD 0.48 (0.31 to 0.64) | 1994 | ⊕⊕⊕⊝ | Variation in protocol and healthcare delivery structures make it difficult to generalise from 1 large study contributing 65% of the weight for this outcome | |
| Use of tocolysis | Study population | RR 1.21 | 4316 | ⊕⊕⊝⊝ | This outcome may no longer be useful, due to changes in clinical practice. Sensitivity analysis including only 3 studies at low risk of bias (3749 women) did not show any clear difference in results. | |
| 188 per 1000 | 228 per 1000 | |||||
| *The basis for the assumed risk (e.g. the median control group risk across studies) is provided in footnotes. The corresponding risk (and its 95% confidence interval) is based on the assumed risk in the comparison group and the relative effect of the intervention (and its 95% CI). | ||||||
| GRADE Working Group grades of evidence | ||||||
| 1All studies contributing data with design limitations (‐1). | ||||||
| Methodological item | Adequate | Inadequate |
| Generation of random sequence | Computer‐generated sequence, random‐number tables, lot drawing, coin‐tossing, shuffling cards, throwing dice | Case number, date of birth, date of admission, alternation |
| Concealment of allocation | Central randomisation, coded drug boxes, sequentially‐sealed opaque envelopes | Open allocation sequence, any procedure based on inadequate generation |
| Outcome or subgroup title | No. of studies | No. of participants | Statistical method | Effect size |
| 1 Perinatal mortality Show forest plot | 2 | 2589 | Risk Ratio (M‐H, Fixed, 95% CI) | 1.22 [0.86, 1.72] |
| 2 Preterm birth < 34 weeks Show forest plot | 3 | 1596 | Risk Ratio (M‐H, Fixed, 95% CI) | 0.78 [0.62, 0.99] |
| 3 Preterm birth < 34 weeks (Subgroup analysis) Show forest plot | 1 | Risk Ratio (M‐H, Fixed, 95% CI) | Subtotals only | |
| 3.1 Singleton gestations | 1 | 138 | Risk Ratio (M‐H, Fixed, 95% CI) | 1.12 [0.55, 2.27] |
| 3.2 Twin gestations | 1 | 109 | Risk Ratio (M‐H, Fixed, 95% CI) | 0.55 [0.26, 1.17] |
| Outcome or subgroup title | No. of studies | No. of participants | Statistical method | Effect size |
| 1 Preterm birth < 37 weeks Show forest plot | 8 | 4834 | Risk Ratio (M‐H, Random, 95% CI) | 0.85 [0.72, 1.01] |
| 2 Preterm birth < 37 weeks (Subgroup analysis) Show forest plot | 1 | Risk Ratio (M‐H, Fixed, 95% CI) | Subtotals only | |
| 2.1 Singleton gestations | 1 | 2422 | Risk Ratio (M‐H, Fixed, 95% CI) | 0.95 [0.62, 1.45] |
| 2.2 Twin gestations | 1 | 844 | Risk Ratio (M‐H, Fixed, 95% CI) | 0.96 [0.71, 1.30] |
| 3 Preterm birth < 32 weeks Show forest plot | 3 | 2550 | Risk Ratio (M‐H, Random, 95% CI) | 0.76 [0.31, 1.85] |
| 4 Use of antenatal corticosteroids Show forest plot | 1 | 162 | Risk Ratio (M‐H, Fixed, 95% CI) | 1.01 [0.82, 1.25] |
| 5 Respiratory distress syndrome Show forest plot | 1 | Risk Ratio (M‐H, Fixed, 95% CI) | Subtotals only | |
| 5.1 Singleton gestations | 1 | 38 | Risk Ratio (M‐H, Fixed, 95% CI) | 1.25 [0.40, 3.95] |
| 5.2 Twin gestations | 1 | 86 | Risk Ratio (M‐H, Fixed, 95% CI) | 0.38 [0.13, 1.12] |
| 6 Use of mechanical ventilation Show forest plot | 2 | 539 | Risk Ratio (M‐H, Random, 95% CI) | 0.31 [0.04, 2.38] |
| 7 Admission to neonatal intensive care unit Show forest plot | 5 | 2367 | Risk Ratio (M‐H, Random, 95% CI) | 0.77 [0.62, 0.96] |
| 8 Mode of delivery Show forest plot | 1 | 162 | Risk Ratio (M‐H, Fixed, 95% CI) | 0.98 [0.36, 2.66] |
| Outcome or subgroup title | No. of studies | No. of participants | Statistical method | Effect size |
| 1 Number of antenatal visits (unscheduled) Show forest plot | 2 | 1994 | Mean Difference (IV, Fixed, 95% CI) | 0.48 [0.31, 0.64] |
| 2 Number of antenatal hospital admissions Show forest plot | 3 | 1494 | Risk Ratio (M‐H, Fixed, 95% CI) | 0.91 [0.74, 1.11] |
| 3 Number of antenatal visits (unscheduled) (Subgroup analysis) Show forest plot | 1 | Mean Difference (IV, Fixed, 95% CI) | Subtotals only | |
| 3.1 Singleton gestations | 1 | 1060 | Mean Difference (IV, Fixed, 95% CI) | 0.40 [0.15, 0.65] |
| 3.2 Twin gestations | 1 | 564 | Mean Difference (IV, Fixed, 95% CI) | 0.60 [0.24, 0.96] |
| 4 Use of tocolysis Show forest plot | 7 | 4316 | Risk Ratio (M‐H, Random, 95% CI) | 1.21 [1.01, 1.45] |