نقش اوپیوئیدها در مدیریت بالینی درد نوروپاتیک
Referencias
منابع مطالعات واردشده در این مرور
منابع مطالعات خارجشده از این مرور
منابع اضافی
منابع دیگر نسخههای منتشرشده این مرور
Characteristics of studies
Characteristics of included studies [ordered by study ID]
Ir a:
| Methods | Cross‐over ‐ at least 4 test infusions with active drug or placebo given | |
| Participants | Participants enrolled: 8 Neuropathic pain diagnosis: Mixed deafferentation | |
| Interventions | Morphine: 15 mg IV over 15 mins | |
| Outcomes | VAS pain intensity, before and 15 mins after infusion. Means of VAS pain reduction compared between active and placebo phases. In some participants, categorical pain relief was assessed (reasons for only some participants not given). 'Positive' outcome defined as moderate or complete pain relief. | |
| Notes | Adverse events, withdrawals not reported | |
| Risk of bias | ||
| Bias | Authors' judgement | Support for judgement |
| Random sequence generation (selection bias) | Unclear risk | No description of methods |
| Allocation concealment (selection bias) | Unclear risk | No description of methods |
| Blinding (performance bias and detection bias) | Low risk | "Test infusions were prepared with saline or opioids by a nurse who was not a regular member of the ward staff. The infusions were coded and handed over to another nurse". |
| Incomplete outcome data (attrition bias) | Low risk | All participants appear to have completed the study |
| Selective reporting (reporting bias) | Unclear risk | All outcomes described in Methods section are reported in Results section, but are difficult to interpret. No protocol available. |
| Methods | Cross‐over, single doses, separated by at least 2 weeks | |
| Participants | Participants enrolled: 15 Neuropathic pain diagnosis: central: SC (n = 9), post‐stroke pain (n = 6) | |
| Interventions | Morphine IV: 9 to 30 mg (mean 16 ± 6), previously individually titrated to maximum dose tolerated, over 20 mins | |
| Outcomes | Spontaneous pain intensity at baseline, every 15 mins up to 1 hr, then at 90 and 120 minutes (0 ‐ 100 VAS). Total relief = 100% reduction in pain intensity, major relief = at least 50% reduction, no relief or worse pain = decreased by less than 5% or increased. Tactile allodynia Mechanical detection and pain thresholds Thermal detection and pain Global assessment of pain relief (complete through worse pain), blindness. | |
| Notes | ||
| Risk of bias | ||
| Bias | Authors' judgement | Support for judgement |
| Random sequence generation (selection bias) | Unclear risk | Methods not described |
| Allocation concealment (selection bias) | Low risk | "A study nurse maintained the blind nature of the study and performed the randomization by means of sealed envelopes that contained study medication and order of administration". |
| Blinding (performance bias and detection bias) | Low risk | "IV morphine or saline in the same volume was administered using the dosage determined during the unblinded phase. IV infusion was performed over a 20‐minute period by an anesthesiologist unaware of the treatment and who did not participate in the unblinded phase". 7/15 subjects correctly identified the active treatment. The examiner identified active treatment in 10/15 cases. |
| Incomplete outcome data (attrition bias) | Unclear risk | Data from completers only; however only 1 of 16 participants withdrew post‐randomization "because he did not wish to continue". |
| Selective reporting (reporting bias) | Low risk | All outcomes described in Methods section are reported in Results section. Data for outcome analyzed are provided. |
| Methods | Cross‐over, single doses (fentanyl vs saline or fentanyl vs diazepam) | |
| Participants | Participants enrolled: 53 Neuropathic pain diagnosis: peripheral (n = 50), central (n = 3) | |
| Interventions | Fentanyl: 5 mcg/kg/min for maximum of 5 hrs | |
| Outcomes | Pain intensity and pain unpleasantness (0 ‐ 100 NRS). Pain intensity difference expressed as percentage of baseline pain intensity. Peak pain intensity difference and average pain intensity difference over 8 hrs. Responders defined as those in whom pain intensity or unpleasantness reduced by 50% at any time point. | |
| Notes | 90% of fentanyl infusions vs 46% diazepam infusions vs 8% saline infusions stopped early due to adverse events | |
| Risk of bias | ||
| Bias | Authors' judgement | Support for judgement |
| Random sequence generation (selection bias) | Low risk | Performed in the hospital pharmacy in blocks of 4. |
| Allocation concealment (selection bias) | Low risk | Sealed envelopes from hospital pharmacy |
| Blinding (performance bias and detection bias) | Low risk | Infusions prepared in pharmacy and delivered to study nurse. All infusions identical in appearance. |
| Incomplete outcome data (attrition bias) | Low risk | Minimal dropouts and for non‐intervention‐related reasons |
| Selective reporting (reporting bias) | Low risk | All outcomes described in Methods section are reported in Results section. |
| Methods | Cross‐over, single doses, separated by one week | |
| Participants | Participants enrolled: 8 Neuropathic pain diagnosis: PHN | |
| Interventions | Morphine IV: 0.075 mg/kg over 10 mins | |
| Outcomes | VAS 0 ‐ 100 (no relief through very significant relief) pain relief Assessment of allodynia, wind‐up‐like pain, tactile sensibility and thermal sensibility. | |
| Notes | ||
| Risk of bias | ||
| Bias | Authors' judgement | Support for judgement |
| Random sequence generation (selection bias) | Unclear risk | Not described |
| Allocation concealment (selection bias) | Unclear risk | Not described |
| Blinding (performance bias and detection bias) | Unclear risk | Not described |
| Incomplete outcome data (attrition bias) | Low risk | It appears that all participants completed the study |
| Selective reporting (reporting bias) | Low risk | All outcomes described in Methods section are reported in Results section. |
| Methods | Cross‐over, single doses, separated by 2 hrs | |
| Participants | Participants enrolled: 9 Neuropathic pain diagnosis: central spinal cord injury | |
| Interventions | Alfentanil IV: 7 mcg/kg over 5 mins + 0.6 mcg/kg/min for 17 to 21 mins | |
| Outcomes | Median % reduction in VAS (0 = no pain, 100 = unbearable pain) continuous pain intensity Allodynia Wind‐up‐like pain Thermal pain threshold | |
| Notes | Pain intensity reduction data extracted from figure | |
| Risk of bias | ||
| Bias | Authors' judgement | Support for judgement |
| Random sequence generation (selection bias) | Low risk | Latin square |
| Allocation concealment (selection bias) | Unclear risk | Not mentioned |
| Blinding (performance bias and detection bias) | Unclear risk | Described as double‐blind, but no details |
| Incomplete outcome data (attrition bias) | Low risk | It appears that all participants completed the study |
| Selective reporting (reporting bias) | Low risk | All outcomes described in Methods section are reported in Results section. |
| Methods | Cross‐over, each arm 6 weeks, with 2‐week washout between | |
| Participants | Participants enrolled: 96 Neuropathic pain diagnosis: mixed | |
| Interventions | Dihydrocodeine: oral 30 ‐ 240 mg/day Nabilone: oral 0.25 ‐ 2 mg/day | |
| Outcomes | Pain intensity: Mean VAS 0 ‐ 100 computed over the last 2 weeks of each treatment period SF‐36 Hospital Anxiety and Depression Score | |
| Notes | ||
| Risk of bias | ||
| Bias | Authors' judgement | Support for judgement |
| Random sequence generation (selection bias) | Low risk | "Treatment was allocated by random permuted blocks of 10". |
| Allocation concealment (selection bias) | Low risk | Coded envelopes retained in pharmacy |
| Blinding (performance bias and detection bias) | Low risk | "The pharmacy supplied identical white capsules containing 250 mcg nabilone or 30 mg dihydrocodeine". |
| Incomplete outcome data (attrition bias) | Unclear risk | Both available case analysis and per protocol analysis presented. Similar outcomes in each population. Greater number of participants withdrew due to side effects in dihydrocodeine phases. |
| Selective reporting (reporting bias) | Low risk | All outcomes described in Methods section are reported in Results section. |
| Methods | Cross‐over, each arm 5 weeks (including titration and washout). | |
| Participants | Neuropathic pain diagnosis: Diabetic neuropathy (n = 35), PHN (n = 22) | |
| Interventions | Morphine oral long‐acting: up to 120 mg/day | |
| Outcomes | VAS 0 ‐ 10 (0 = no pain, 10 = worst imaginable) pain intensity at maximum tolerated dose averaged over 7 days Brief Pain Inventory Beck Depression Inventory SF‐36 Mini‐Mental State Examination Global pain relief (worse through complete relief) Incidence and severity (mild, moderate, severe) of adverse events | |
| Notes | Baseline pain intensity: 5.72 ± 0.23 (SE) | |
| Risk of bias | ||
| Bias | Authors' judgement | Support for judgement |
| Random sequence generation (selection bias) | Low risk | Balanced Latin‐square cross‐over design assigned by hospital pharmacist. |
| Allocation concealment (selection bias) | Low risk | Allocation concealed by a hospital pharmacist |
| Blinding (performance bias and detection bias) | Low risk | Participants received identical‐appearing capsules in a double‐dummy design. Active placebo (lorazepam) used. Participants asked to guess treatment allocation ‐ slightly higher correct responses when receiving placebo. |
| Incomplete outcome data (attrition bias) | Unclear risk | Withdrawals (16/57) evenly distributed amongst groups, but reasons for withdrawal not fully described. |
| Selective reporting (reporting bias) | Low risk | All outcomes described in Methods section are reported in Results section. |
| Methods | Parallel, 6 weeks | |
| Participants | Study arms enrolled: Opioid group: 82; Control group: 77 | |
| Interventions | Oxycodone oral long‐acting: 10 to 60 mg twice daily (mean: 37 ± 21) | |
| Outcomes | Average, current and worst daily NRS (0 ‐ 10) pain intensity Satisfaction with pain medication Sleep Quality Brief Pain Inventory Sickness Impact Profile SF‐36 Incidence and severity of adverse events | |
| Notes | Average pain intensity of ≥ 5 required for enrolment. Jensen 2006 reported on the same study and participants, but also presented scores for each item on the Neuropathic Pain Scale, from which we were able to extract data for Analysis 2.1. | |
| Risk of bias | ||
| Bias | Authors' judgement | Support for judgement |
| Random sequence generation (selection bias) | Low risk | "A computer generated randomization schedule with permuted blocks of size 4 was used to assign subjects to study treatment". |
| Allocation concealment (selection bias) | Low risk | Randomized information sealed at sponsor site |
| Blinding (performance bias and detection bias) | Low risk | Placebo described as being identical to opioid |
| Incomplete outcome data (attrition bias) | Unclear risk | Although a relatively large number of dropouts (44/159), they were equally distributed between the groups (19 vs. 25) and reasons specified. Analysis performed on ITT population using LOCF. |
| Selective reporting (reporting bias) | Low risk | Data provided for primary outcome and most secondary outcomes described in Methods section. Some secondary outcomes only listed as being NS between groups. |
| Methods | Parallel, 12 weeks | |
| Participants | Study arms enrolled: Oxycodone group: 169; Placebo group: 169 Neuropathic pain diagnosis: Diabetic neuropathy | |
| Interventions | Oxycodone oral long‐acting: 10 ‐ 80 mg/day Placebo | |
| Outcomes | Primary: Pain intensity difference (Box‐scale 11 pain scores) Secondary: escape medication use; sleep disturbance/sleep quality; participants’ global assessment of pain. Exploratory: SF‐BPI; Short‐Form McGill Pain Questionnaire; EuroQoL, EQ‐5D; and subject resource utilization. | |
| Notes | Oxycodone or placebo was added to participants' standing gabapentin therapy. Gabapentin dose ranged from 100 ‐ 4800 mg/day. | |
| Risk of bias | ||
| Bias | Authors' judgement | Support for judgement |
| Random sequence generation (selection bias) | Low risk | "Randomisation was performed using a validated interactive voice response system that automated the assignment of treatment groups to randomization numbers in accordance with a randomization schedule. Treatment allocation was in balanced blocks of 4 and was stratified by country". |
| Allocation concealment (selection bias) | Low risk | Central allocation |
| Blinding (performance bias and detection bias) | Unclear risk | "matched placebo oxycodone tablets", but not stated whether they appeared identical |
| Incomplete outcome data (attrition bias) | Unclear risk | Missing data imputed using LOCF |
| Selective reporting (reporting bias) | Low risk | All outcomes described in Methods section are reported in Results section. |
| Methods | Parallel, 2‐phase, 8 days each phase | |
| Participants | Study arms enrolled: Morphine group: 21; Placebo group I: 17; Carbamazepine group: 22; Placebo group II: 21 | |
| Interventions | Morphine oral long‐acting: 30 mg 3 times daily | |
| Outcomes | Pain intensity NRS (0 ‐ 10) Time to reactivation of spinal cord stimulator | |
| Notes | Participants had peripheral neuropathic pain reduced by spinal cord stimulation. They were switched into a painful state after device deactivation. In Phase 1, participants were randomly allocated to receive either carbamazepine (600 mg/day) or placebo during an spinal cord stimulator‐free period of 8 days. In Phase 2, oral morphine or placebo were administered under similar conditions. | |
| Risk of bias | ||
| Bias | Authors' judgement | Support for judgement |
| Random sequence generation (selection bias) | Unclear risk | Not described |
| Allocation concealment (selection bias) | Unclear risk | Not described |
| Blinding (performance bias and detection bias) | Unclear risk | Not described |
| Incomplete outcome data (attrition bias) | Low risk | Minimal withdrawals |
| Selective reporting (reporting bias) | Unclear risk | Not clear from Methods section what outcomes were considered |
| Methods | Cross‐over, 4 weeks | |
| Participants | Participants enrolled: 12 | |
| Interventions | Morphine oral long‐acting: 70 ‐ 300 mg/day | |
| Outcomes | Pain intensity VAS (0 ‐ 1): mean and numbers with 50% reduction Brief Stress Scale West Haven‐Yale Multidimensional Pain Inventory 'd2‐test' (test for attention performance) | |
| Notes | ||
| Risk of bias | ||
| Bias | Authors' judgement | Support for judgement |
| Random sequence generation (selection bias) | Unclear risk | Not described |
| Allocation concealment (selection bias) | Unclear risk | Not described |
| Blinding (performance bias and detection bias) | Low risk | Morphine and placebo described as identical and were prepared by the pharmacy |
| Incomplete outcome data (attrition bias) | Unclear risk | Participants were required to complete hourly pain diaries for 4 weeks ‐ no mention of imputation of missing values |
| Selective reporting (reporting bias) | Unclear risk | Large number of outcomes assessed, but not all reported |
| Methods | Cross‐over, 8 hrs, separated by 24 hrs. | |
| Participants | Participants enrolled: 7 | |
| Interventions | Morphine (low vs high dose): PCA up to 30 mg/hr for up to 8 hrs, or up to 90 mg/hr for up to 8 hrs | |
| Outcomes | % maximal total pain relief | |
| Notes | Study compared responses in participants with nociceptive and neuropathic pain. Participant information reflects only those with neuropathic pain. | |
| Risk of bias | ||
| Bias | Authors' judgement | Support for judgement |
| Random sequence generation (selection bias) | Low risk | Coin toss |
| Allocation concealment (selection bias) | Unclear risk | "codes kept in a sealed envelope until the patients had completed both sessions", but no mention of who generated the codes |
| Blinding (performance bias and detection bias) | Unclear risk | "The syringes were filled by a nurse and connected by a nurse not involved with the assessments", but no description of whether comparator syringes appeared identical |
| Incomplete outcome data (attrition bias) | Low risk | 1 participant withdrew after first session. Reasons for dropout described and unlikely to be related to true outcome. |
| Selective reporting (reporting bias) | Unclear risk | Some outcomes reported only as P values, but none used in analyses. |
| Methods | Cross‐over, single doses, separated by at least 2 hrs | |
| Participants | Participants enrolled: 12 | |
| Interventions | Alfentanil: 7 µg/kg over 5 mins + 0.6 µg/kg/min over 20 mins | |
| Outcomes | Pain elicited at threshold level for cold pain (0 ‐ 10 VAS) Radiation of pain from site of stimulation (Y or N) Mechanical allodynia and ongoing pain (0 ‐ 10 VAS) All measurements taken before (baseline) and during drug infusion | |
| Notes | Data extracted from figure | |
| Risk of bias | ||
| Bias | Authors' judgement | Support for judgement |
| Random sequence generation (selection bias) | Low risk | "Using a Latin square design, the participants were randomized to one of 12 possible sequences by the use of random numbers". |
| Allocation concealment (selection bias) | Unclear risk | Not described |
| Blinding (performance bias and detection bias) | Unclear risk | Intervention preparation performed "by someone not present during the examination", but no mention of whether syringes appeared identical. |
| Incomplete outcome data (attrition bias) | Low risk | It appears that all participants completed the study and contributed data for all outcomes. |
| Selective reporting (reporting bias) | Low risk | All outcomes described in Methods section are reported in Results section. |
| Methods | Parallel, single doses | |
| Participants | Participants enrolled: oxycodone/lidocaine group 14; tramadol/lidocaine group 13 Neuropathic pain diagnosis: mixed | |
| Interventions | Oxcodone: 10 mg plus lidocaine 3 mg/kg Tramadol: 100 mg plus lidocaine 3 mg/kg Both administered over 2 hrs as single intravenous infusions | |
| Outcomes | VAS (0 ‐ 10): spontaneous pain, tactile and thermal (cold) allodynia, hyperalgesia Nausea and vomiting (VAS) Satisfaction Sedation Vital signs | |
| Notes | ||
| Risk of bias | ||
| Bias | Authors' judgement | Support for judgement |
| Random sequence generation (selection bias) | Low risk | Table of random numbers |
| Allocation concealment (selection bias) | Unclear risk | Not described |
| Blinding (performance bias and detection bias) | Unclear risk | Authors state that investigators were unaware of intervention administered (no mention of participant blinding), but methods to ensure blinding not described. |
| Incomplete outcome data (attrition bias) | Low risk | All participants completed the study |
| Selective reporting (reporting bias) | Unclear risk | All outcomes described in Methods section are reported in Results section, but method of presenting outcomes not described in Methods section |
| Methods | Cross‐over, 9 weeks each phase | |
| Participants | Participants enrolled: 55 (28 participants received all 4 treatments) | |
| Interventions | Morphine: 15‐90 mg/day (mean: 62 ± 29) Nortriptyline: 25 ‐ 100 mg/day (mean: 84 ± 24) Morphine + nortriptyline (not included in our analysis) Placebo (benztropine as 'active' placebo) | |
| Outcomes | NRS: average and worst leg pain Global pain relief SF‐36 Beck Depression Inventory Oswestry Disability Index | |
| Notes | Negative results may be due to small groups, newspaper recruitment, or type of neuropathic pain (lumbar radiculopathy) | |
| Risk of bias | ||
| Bias | Authors' judgement | Support for judgement |
| Random sequence generation (selection bias) | Low risk | "patients were assigned by random numbers within blocks of four to one of four treatment sequences " |
| Allocation concealment (selection bias) | Unclear risk | Not described |
| Blinding (performance bias and detection bias) | Low risk | Identical blue and pink pills for all groups of treatment |
| Incomplete outcome data (attrition bias) | Low risk | Only 28 of 55 randomized participants completed all 4 arms of the study. Efficacy analysis included participants who completed at least 2 treatment arms. Dropouts adequately described |
| Selective reporting (reporting bias) | Low risk | All outcomes described in Methods section are reported in Results section. |
| Methods | Cross‐over, 50 mins, separated by at least 24 hrs | |
| Participants | Participants enrolled: 6 | |
| Interventions | Morphine: 0.3 mg/kg in 5 divided bolus doses every 10 mins | |
| Outcomes | Change (pre‐ to post‐injection) in affective and sensory dimensions of pain sensation (McGill Pain Questionnaire, 0 ‐ 100 NRS) | |
| Notes | Data extracted in part from figure Results refer to the "affective" component of pain Adverse events not reported | |
| Risk of bias | ||
| Bias | Authors' judgement | Support for judgement |
| Random sequence generation (selection bias) | Unclear risk | Method not described |
| Allocation concealment (selection bias) | Unclear risk | Not mentioned |
| Blinding (performance bias and detection bias) | Unclear risk | "All drugs were administered intravenously by a third person. Both the patient and the clinician who made the assessments were not told which of the two drugs was being given", but no mention of whether interventions appeared identical. |
| Incomplete outcome data (attrition bias) | Low risk | All participants completed the study |
| Selective reporting (reporting bias) | Low risk | All outcomes described in Methods section are reported in Results section. |
| Methods | Cross‐over, 50 mins, separated by at least 24 hrs | |
| Participants | Participants enrolled: 8 | |
| Interventions | Morphine: 0.3 mg/kg in 5 divided bolus doses every 10 mins | |
| Outcomes | ||
| Notes | Kupers 1991 central and Kupers 1991 peripheral are same study ‐ we divided results by participants with peripheral pain or with central pain | |
| Risk of bias | ||
| Bias | Authors' judgement | Support for judgement |
| Random sequence generation (selection bias) | Unclear risk | Method not described |
| Allocation concealment (selection bias) | Unclear risk | Not mentioned |
| Blinding (performance bias and detection bias) | Unclear risk | "All drugs were administered intravenously by a third person. Both the patient and the clinician who made the assessments were not told which of the two drugs was being given", but no mention of whether interventions appeared identical. |
| Incomplete outcome data (attrition bias) | Low risk | All participants completed the study |
| Selective reporting (reporting bias) | Low risk | All outcomes described in Methods section are reported in Results section. |
| Methods | Cross‐over, single doses, separated by 1 week | |
| Participants | Participants enrolled: 12 | |
| Interventions | Alfentanil: 20 min infusion aimed at achieving plasma levels of 25, 50 and 75 ng/ml | |
| Outcomes | % VAS (0 ‐ 100) reduction in spontaneous and evoked pain Effect on neurosensory threshold and allodynic area | |
| Notes | Data extracted from figures | |
| Risk of bias | ||
| Bias | Authors' judgement | Support for judgement |
| Random sequence generation (selection bias) | Unclear risk | Method not described |
| Allocation concealment (selection bias) | Unclear risk | Not mentioned |
| Blinding (performance bias and detection bias) | Unclear risk | Diphenhydramine used as a placebo due to side effect profile similar to other interventions, but no mention of whether interventions appeared identical |
| Incomplete outcome data (attrition bias) | Low risk | It appears that all participants completed the study |
| Selective reporting (reporting bias) | Low risk | All outcomes described in Methods section are reported in Results section. |
| Methods | Cross‐over, single doses, separated by at least 48 hrs | |
| Participants | Participants enrolled: 46 | |
| Interventions | Codeine: 120 mg single oral dose | |
| Outcomes | Pain intensity and relief at baseline, and each hr through 6 hrs Categorical scales of pain (severe = 3, none = 0) and relief (complete = 4, none = 0); VAS for pain and relief (100 mm) McGill Pain Questionnaire and verbal descriptor scales (13‐word lists of descriptors for pain intensity, pain unpleasantness, and "overall" pain) SPID and TOTPAR derived from above scales | |
| Notes | ||
| Risk of bias | ||
| Bias | Authors' judgement | Support for judgement |
| Random sequence generation (selection bias) | Unclear risk | Method not described |
| Allocation concealment (selection bias) | Unclear risk | Not mentioned |
| Blinding (performance bias and detection bias) | Low risk | Capsules had identical appearance |
| Incomplete outcome data (attrition bias) | Low risk | 7/46 did not provide data, but only 1 case was due to opioid side effect |
| Selective reporting (reporting bias) | Low risk | All outcomes described in Methods section are reported in Results section. |
| Methods | Cross‐over, single infusions, separated by 1 day | |
| Participants | Participants enrolled: 8 | |
| Interventions | Alfentanil: 1.5 µg/kg/min for 60 mins; rate doubled as required at 60 and 90 mins for a total of 2 hrs | |
| Outcomes | Background pain (0 ‐ 100 VAS) Mechanical allodynia (0 ‐ 100 VAS) % pain relief from both of above | |
| Notes | SD calculated from data | |
| Risk of bias | ||
| Bias | Authors' judgement | Support for judgement |
| Random sequence generation (selection bias) | Unclear risk | Method not described |
| Allocation concealment (selection bias) | Unclear risk | Not mentioned |
| Blinding (performance bias and detection bias) | Unclear risk | Solutions prepared by third party, but no mention of appearing identical |
| Incomplete outcome data (attrition bias) | Low risk | All participants completed the study |
| Selective reporting (reporting bias) | Low risk | All outcomes described in Methods section are reported in Results section. |
| Methods | Randomized, double‐blind, placebo‐controlled cross‐over. Two phases, each 20 days. | |
| Participants | Participants enrolled: | |
| Interventions | Phase I: Methadone oral: 5 mg twice daily alternating with placebo on odd days and rest on even days | |
| Outcomes | All outcomes assessed each evening in patient diaries. Maxium and average pain intensity, pain relief (VAS). Adverse effects with severity (mild, moderate, severe). Any additional "prn" medications required | |
| Notes | For each phase, results of 5 days with active intervention were compared with results of 5 days with placebo. Analyses of safety and efficacy in this review are based on Phase I (low‐dose phase). Participants had neuropathic pain that had not been satisfactorily relieved by other interventions or by current or previous drug regimens. Participants were permitted to continue with concurrent medications, some of which were opioids. | |
| Risk of bias | ||
| Bias | Authors' judgement | Support for judgement |
| Random sequence generation (selection bias) | Low risk | Eight replications of a Latin square design |
| Allocation concealment (selection bias) | Low risk | Central allocation |
| Blinding (performance bias and detection bias) | Low risk | Medication containers appeared identical, and medications "were not distinguishable by taste or appearance" |
| Incomplete outcome data (attrition bias) | Unclear risk | Only participants completing study were analyzed, 6 participants withdrew from high‐dose phase due to severe nausea ‐ 3 while taking placebo, 3 while taking methadone |
| Selective reporting (reporting bias) | Low risk | All outcomes described in Methods section are reported in Results section. |
| Methods | Cross‐over, single doses, separated by 1 week | |
| Participants | Participants enrolled: 30 | |
| Interventions | Meperidine: 1.0 mg/kg IM | |
| Outcomes | Pain intensity (VAS 0 ‐ 100) pre‐ and post‐intervention Three different subgroups of response were defined: no analgesic effect, short‐term analgesic effect, and long‐term analgesic effect | |
| Notes | ||
| Risk of bias | ||
| Bias | Authors' judgement | Support for judgement |
| Random sequence generation (selection bias) | Unclear risk | "Patients were randomized in blocks of four according to sex, age, and duration of pain" |
| Allocation concealment (selection bias) | Unclear risk | Not mentioned |
| Blinding (performance bias and detection bias) | Unclear risk | Method not described |
| Incomplete outcome data (attrition bias) | Unclear risk | 3 participants receiving pethidine withdrew due to nausea |
| Selective reporting (reporting bias) | Low risk | All outcomes described in Methods section are reported in Results section. |
| Methods | Randomized, double‐blind, active‐ and placebo‐controlled, cross‐over. Each treatment period lasted approximately 8 weeks and had a titration, maintenance, and taper phase. The treatment periods were separated by a 1‐week drug‐free, washout period. | |
| Participants | Participants enrolled: | |
| Interventions | Morphine oral: 15 to 240 mg/day or methadone oral 5 to 80 mg/day (means 91 ± 49.3 and 15 ± 2.0) | |
| Outcomes | Primary outcomes: pain intensity, pain relief, cognitive function (symbol substitution task) Secondary outcomes: physical functioning, sleep, mood, side effects, treatment preference Pain intensity (0 ‐ 10 NRS) and pain relief (0 ‐ 100 NRS) values were collected by twice‐weekly telephone interviews during the trial. All other outcome measures were obtained during clinic visits at the end of the drug‐free baseline period and at the end of the maintenance phase for each drug | |
| Notes | Study compared opioid (morphine or methadone) vs tricyclic antidepressant (nortriptyline or desipramine) vs placebo. Participants received methadone only if they did not tolerate morphine. | |
| Risk of bias | ||
| Bias | Authors' judgement | Support for judgement |
| Random sequence generation (selection bias) | Low risk | "The randomization sequence was computer generated by the biostatistician" |
| Allocation concealment (selection bias) | Low risk | Sealed envelopes |
| Blinding (performance bias and detection bias) | Low risk | "The pharmacist formulated the study drugs in identical gel capsules to maintain the blinding. All investigators were blinded to the drug treatments during the study". |
| Incomplete outcome data (attrition bias) | Unclear risk | ITT analysis employed. For participants who did not complete a treatment period, the last 3 available pain ratings were used. Number of participants who did not complete methadone phase not reported. |
| Selective reporting (reporting bias) | Low risk | All outcomes described in Methods section are reported in Results section. |
| Methods | Cross‐over, single infusions, separated by at least 48 hrs | |
| Participants | Participants enrolled: 19 | |
| Interventions | Morphine: 0.3 mg/kg (max 25 mg) over 1 hr | |
| Outcomes | Pain intensity pre‐ and post‐infusion, and pain relief (0 ‐ 100 VAS) | |
| Notes | ||
| Risk of bias | ||
| Bias | Authors' judgement | Support for judgement |
| Random sequence generation (selection bias) | Unclear risk | Method not described |
| Allocation concealment (selection bias) | Unclear risk | Not mentioned |
| Blinding (performance bias and detection bias) | Unclear risk | Method not described |
| Incomplete outcome data (attrition bias) | Low risk | Only one participant did not complete all 3 sessions, withdrawing from lidocaine session due to side effects, but supplying data for first 30 minutes. |
| Selective reporting (reporting bias) | Low risk | All outcomes described in Methods section are reported in Results section. |
| Methods | Parallel, 8 weeks | |
| Participants | Study arms enrolled: | |
| Interventions | Levorphanol: 0.75 mg (1 ‐ 7 capsules) 3 times daily (mean 8.9 mg/day) | |
| Outcomes | Pain intensity (0 ‐ 100 VAS): change in weekly average from baseline to 8th week of treatment Pain relief (categorical, 0 ‐ 5) Profile of Mood States Questionnaire Symbol‐Digit Modalities Test Multidimensional Pain Inventory Opiate‐Agonist Effects Scale and Opiate Withdrawal Scale | |
| Notes | ||
| Risk of bias | ||
| Bias | Authors' judgement | Support for judgement |
| Random sequence generation (selection bias) | Unclear risk | Method not described |
| Allocation concealment (selection bias) | Unclear risk | Not mentioned |
| Blinding (performance bias and detection bias) | Low risk | " Low‐strength capsules and high‐strength capsules were identical in appearance and were packaged in patient‐specific bottles". |
| Incomplete outcome data (attrition bias) | High risk | Withdrawals due to adverse events: 12 in the high‐strength group vs. 3 in the low‐strength group |
| Selective reporting (reporting bias) | Unclear risk | Data not provided for some secondary outcomes |
| Methods | Randomized, double‐blind, placebo‐controlled cross‐over. Single doses for each of 9 consecutive breakthrough pain episodes separated by at least 2 hours. Maximum study duration of 21 days. | |
| Participants | N = 79 (77 completed); had a ≥ 3 month history of chronic persistent neuropathic pain; mean age 48 years; mean pain intensity = 5.1/10 | |
| Interventions | Fentanyl buccal tablets 100 ‐ 800 mcg, based on effective dose established during open‐label phase Placebo Participants received 6 doses of active intervention and 3 of placebo, according to 1 of 3 prespecified treatment sequences. Placebo tablets were not supplied in consecutive episodes. | |
| Outcomes | Primary efficacy measure: SPID from 5 ‐ 60 mins after administration of study drug. Secondary efficacy measures: PIDs at 5, 10, 15, 30, 45, 60, 90, and 120 mins after administration of study drug; Proportion of breakthrough pain episodes with > 33% and > 50% improvement in PI from baseline; PR at 5, 10, 15, 30, 45, 60, 90, and 120 minutes (0 = none to 4 = complete); Proportion of breakthrough pain episodes in which participants reported achieving meaningful PR; Time to meaningful PR; | |
| Notes | Dose‐titration phase before study enrolled 103 participants. 23 participants withdrew during this phase, 12 because of adverse events. | |
| Risk of bias | ||
| Bias | Authors' judgement | Support for judgement |
| Random sequence generation (selection bias) | Low risk | Computer‐generated random code |
| Allocation concealment (selection bias) | Unclear risk | Not described |
| Blinding (performance bias and detection bias) | Unclear risk | "matching" placebo. "Both patients and investigators were blinded". No further information. |
| Incomplete outcome data (attrition bias) | Unclear risk | 77 (97%) participants completed the study. When supplemental opioid was used for inadequate pain reduction, LOCF was used for efficacy measures. Participants used supplemental opioid for 59 (14%) of the 432 episodes treated with FBT and for 77 (36%) of the 213 episodes in which placebo was administered. |
| Selective reporting (reporting bias) | Low risk | All outcomes described in Methods section are reported in Results section. |
| Methods | Randomized, double‐blind, placebo‐controlled cross‐over. | |
| Participants | N = 32 (26 completed); PHN for at least 3 months with baseline VAS ≥ 45/100 | |
| Interventions | CJC‐1008 (experimental dynorphin analog): 3 mg/kg single dose Placebo | |
| Outcomes | Pain intensity difference VAS, overall and for each of 3 pain types (constant, spontaneous or allodynia); Categorical pain intensity; Categorical pain relief; Physical examination, vital signs. Evaluations every 15 mins for first hr; 2, 3, 4, 6 and 8 hrs; and during return visits to study site at 2, 7 and 28 days post‐dose. | |
| Notes | Participants crossed over to alternative intervention once pain returned to baseline level | |
| Risk of bias | ||
| Bias | Authors' judgement | Support for judgement |
| Random sequence generation (selection bias) | Unclear risk | Not described |
| Allocation concealment (selection bias) | Unclear risk | Not described |
| Blinding (performance bias and detection bias) | Unclear risk | Not described |
| Incomplete outcome data (attrition bias) | Unclear risk | 26/32 participants completed study. Efficacy outcomes only in those completing the study for all but primary outcome. Reasons for dropouts not described. LOCF used for missing data. |
| Selective reporting (reporting bias) | Unclear risk | Not all data are presented in results section; all data presented are in graphical form only |
| Methods | Cross‐over, 4 weeks | |
| Participants | Participants enrolled: 50 | |
| Interventions | Oxycodone oral long‐acting: 10 ‐ 30 mg twice daily (mean: 45 ± 17) | |
| Outcomes | Daily pain intensity (0 ‐ 100 VAS) and pain relief (categorical 0 ‐ 5) Beck Depression Inventory | |
| Notes | Adverse events in placebo group not listed. | |
| Risk of bias | ||
| Bias | Authors' judgement | Support for judgement |
| Random sequence generation (selection bias) | Unclear risk | Method not described |
| Allocation concealment (selection bias) | Low risk | Opaque, patient‐specific envelopes |
| Blinding (performance bias and detection bias) | Unclear risk | Method not described |
| Incomplete outcome data (attrition bias) | Low risk | Numbers of dropouts, reasons, similar in both groups |
| Selective reporting (reporting bias) | Unclear risk | Data not provided for some secondary outcomes |
| Methods | Cross‐over, 4 weeks | |
| Participants | Participants enrolled: | |
| Interventions | Oxycodone oral long‐acting: 10 ‐ 40 mg twice daily (mean: 40.0 ± 18.5) | |
| Outcomes | Daily pain, steady pain, brief pain, and skin (allodynia) pain intensity (0 ‐ 100 VAS and categorical 0 ‐ 4) SF‐36 | |
| Notes | ||
| Risk of bias | ||
| Bias | Authors' judgement | Support for judgement |
| Random sequence generation (selection bias) | Low risk | Computer‐generated |
| Allocation concealment (selection bias) | Unclear risk | Not mentioned |
| Blinding (performance bias and detection bias) | Unclear risk | Method not described |
| Incomplete outcome data (attrition bias) | Low risk | Data for both evaluable and ITT populations presented ‐ similar results |
| Selective reporting (reporting bias) | Unclear risk | Data not presented for some secondary outcomes |
| Methods | Cross‐over, single infusions, separated by 24 hrs | |
| Participants | Participants enrolled: 20 | |
| Interventions | Morphine: 0.05 mg/kg bolus + 0.2 mg/kg over 40 mins | |
| Outcomes | Phantom and stump pain intensity (0 ‐ 100 VAS) pre‐ and post‐infusion % overall satisfaction | |
| Notes | Data on initial and end VAS extracted from figures. SD data received from direct communication with one of the authors 25% of participants had only mild pain on days of infusion | |
| Risk of bias | ||
| Bias | Authors' judgement | Support for judgement |
| Random sequence generation (selection bias) | Unclear risk | "subjects were randomized in balanced blocks of 12" |
| Allocation concealment (selection bias) | Unclear risk | Not mentioned |
| Blinding (performance bias and detection bias) | Low risk | Interventions were prepared by a pharmacist and were identical in appearance |
| Incomplete outcome data (attrition bias) | Low risk | 1 dropout because of absence of pain before initiation of infusion |
| Selective reporting (reporting bias) | Low risk | All outcomes described in Methods section are reported in Results section. |
| Methods | ||
| Participants | Participants enrolled: 22 | |
| Interventions | ||
| Outcomes | ||
| Notes | See Wu 2002 phantom limb. Wu 2002 phantom limb refers to those participants with phantom limb pain; Wu 2002 stump to those with stump pain. Total number of participants = 31; 11 participants had stump pain alone, 9 had phantom pain alone, and 11 had both stump and phantom pains | |
| Risk of bias | ||
| Bias | Authors' judgement | Support for judgement |
| Random sequence generation (selection bias) | Unclear risk | |
| Allocation concealment (selection bias) | Unclear risk | |
| Blinding (performance bias and detection bias) | Low risk | |
| Incomplete outcome data (attrition bias) | Low risk | |
| Selective reporting (reporting bias) | Low risk | |
| Methods | Cross‐over, 8 weeks each phase | |
| Participants | Participants enrolled: 60 | |
| Interventions | Morphine: oral sustained release 15 ‐ 180 mg/day (mean 112 ± 62.7) Mexiletine: 300 ‐ 1200mg/day (mean: 933 ± 257) Placebo | |
| Outcomes | Change in pain intensity (0 ‐ 10 NRS) from baseline to end of therapy Pain relief (0 ‐ 100%) Multidimensional Pain Inventory | |
| Notes | ||
| Risk of bias | ||
| Bias | Authors' judgement | Support for judgement |
| Random sequence generation (selection bias) | Unclear risk | "The subjects were randomized in balanced blocks of 12" |
| Allocation concealment (selection bias) | Low risk | "The sequence of drug and placebo .. for each subject was provided in sealed envelops to the investigational pharmacy and the monitoring committee" |
| Blinding (performance bias and detection bias) | Low risk | "Mexiletine and placebo were similarly packaged in sealed capsules that were identical in appearance" |
| Incomplete outcome data (attrition bias) | Low risk | Dropouts described, equally distributed. Both case analysis of all randomized participants and per protocol analysis performed. |
| Selective reporting (reporting bias) | Low risk | Data provided for primary outcome and for most secondary outcomes. Some secondary outcomes only listed as being NS between groups. |
| Methods | Parallel, 5 weeks | |
| Participants | Study arms enrolled: | |
| Interventions | Oxycodone: liquid 5 mg twice daily Placebo: identical liquid twice daily Pregabilin (in both groups): 75 ‐ 600 mg/day | |
| Outcomes | 2‐cm drop in pain‐intensity score and a pain‐intensity score of < 4 cm measured by VAS from baseline, following pregabalin dosage escalation > 50% pain reduction from baseline Sleep interference score Neuropathic pain scale SF‐36 questionnaire Profile of Mood States Trail‐making test Patient global impression of change Clinician global impression of change | |
| Notes | Participants were randomized to receive either oxycodone or placebo for 1 week, and were then started on open‐label pregabalin (75, 150, 300 and 600 mg/day) according to a forced titration dosing regimen, while continuing the same dosage of oxycodone or placebo for 4 weeks. | |
| Risk of bias | ||
| Bias | Authors' judgement | Support for judgement |
| Random sequence generation (selection bias) | Low risk | "patients were assigned to 1 of 2 treatment group using a computer generated randomization number in block size of 10 " |
| Allocation concealment (selection bias) | Unclear risk | "All the study medications were supplied to patient by the clinical–trial pharmacist at the GPH" |
| Blinding (performance bias and detection bias) | Low risk | "All of the characteristics (appearance,taste,and method of administration) of the oxycodone and placebo mixture were identical to ensure that study blinding was maintained " |
| Incomplete outcome data (attrition bias) | Low risk | Dropouts and AEs adequately presented. ITT analysis with attention to missing observation (LOCF) |
| Selective reporting (reporting bias) | Low risk | All outcomes described in Methods section are reported in Results section.
|
AE = adverse event; CI = 95% confidence interval; ITT = intention‐to‐treat; IV = intravenous; LOCF = last observation carried forward; NNTB = number needed to treat for an additional beneficial outcome; NNTH = number needed to treat for an additional harmful outcome; NR = not reported; NRS = numerical rating scale; NS = non significant (P > 0.05); PCA = patient controlled analgesia; PHN = postherpetic neuralgia; PTN = post‐traumatic neuralgia; RSD = reflex sympathetic dystrophy; SD = standard deviation; SE = standard error; SF‐36 = Short‐Form 36 Questionnaire; VAS = visual analog scale;
Characteristics of excluded studies [ordered by study ID]
Ir a:
| Study | Reason for exclusion |
| Not an RCT | |
| Non‐neuropathic pain | |
| Study group had mixed pain syndromes ‐ both neuropathic and nociceptive; results not presented independently | |
| Opioid studied ‐ buprenorphine ‐ is not a full mu receptor agonist | |
| Opioid studied ‐ buprenorphine ‐ is not a full mu receptor agonist | |
| Presented in abstract form only | |
| Opioid studied ‐ buprenorphine ‐ is not a full mu receptor agonist | |
| Presented in abstract form only | |
| Study group had mixed pain syndromes ‐ both neuropathic and nociceptive; results not presented independently | |
| Participants had mixed nociceptive and neuropathic pain (acute herpes zoster) ‐ effects of opioid on each not presented separately | |
| Not an RCT | |
| Study group had mixed pain syndromes ‐ both neuropathic and nociceptive; results not presented independently | |
| Only 5 participants had neuropathic pain (information provided by contacting author); data not presented separately | |
| Presented in abstract form only | |
| Morphine plus placebo versus morphine plus dextromethorphan | |
| Non‐randomized and single‐blinded study | |
| Participants had mixed nociceptive and neuropathic pain (low back pain) ‐ effects of opioid on each not presented separately | |
| Study group had mixed pain syndromes ‐ both neuropathic and nociceptive; results not presented independently | |
| Opioid studied ‐ buprenorphine ‐ is not a full mu receptor agonist | |
| Study group had mixed pain syndromes ‐ both neuropathic and nociceptive; results not presented independently | |
| Non‐neuropathic pain | |
| No control group | |
| Non‐neuropathic pain | |
| No control group | |
| Study group had mixed pain syndromes ‐ both neuropathic and nociceptive; results not presented independently | |
| Study group had mixed pain syndromes ‐ both neuropathic and nociceptive; results not presented independently | |
| Control group did not have neuropathic pain | |
| Abstract only | |
| Non‐neuropathic pain | |
| Combination of opioid plus other drug | |
| Study group had mixed pain syndromes ‐ both neuropathic and nociceptive; results not presented independently | |
| Presented in abstract form only | |
| Study group had mixed pain syndromes ‐ both neuropathic and nociceptive; results not presented independently | |
| Study group had mixed pain syndromes ‐ both neuropathic and nociceptive; results not presented independently | |
| Non‐randomized | |
| Opioid combined with cholecystokinin versus opioid | |
| Opioid studied ‐ buprenorphine ‐ is not a full mu receptor agonist. Non‐neuropathic pain | |
| Abstract only | |
| Study group had mixed pain syndromes ‐ both neuropathic and nociceptive; results not presented independently | |
| Abstract only | |
| Study group had mixed pain syndromes ‐ both neuropathic and nociceptive; results not presented independently | |
| Opioid studied ‐ buprenorphine ‐ is not a full mu receptor agonist | |
| No control group |
RCT = randomized controlled trial
Data and analyses
| Outcome or subgroup title | No. of studies | No. of participants | Statistical method | Effect size |
| 1 Pain intensity post‐opioid/placebo Show forest plot | 6 | 180 | Mean Difference (IV, Random, 95% CI) | ‐15.81 [‐22.54, ‐9.07] |
| Analysis 1.1  Comparison 1 Short‐term Efficacy Studies: opioid vs placebo, Outcome 1 Pain intensity post‐opioid/placebo. | ||||
| 1.1 Peripheral Pain | 4 | 138 | Mean Difference (IV, Random, 95% CI) | ‐15.01 [‐22.97, ‐7.06] |
| 1.2 Central Pain | 2 | 42 | Mean Difference (IV, Random, 95% CI) | ‐17.81 [‐30.48, ‐5.15] |
| 2 % Pain reduction post‐opioid/placebo Show forest plot | 2 | 38 | Mean Difference (IV, Random, 95% CI) | 25.78 [16.91, 34.65] |
| Analysis 1.2 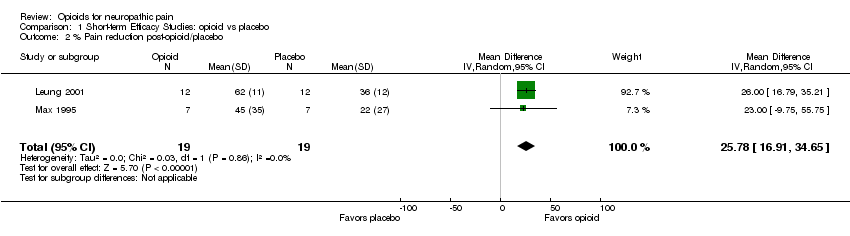 Comparison 1 Short‐term Efficacy Studies: opioid vs placebo, Outcome 2 % Pain reduction post‐opioid/placebo. | ||||
| Outcome or subgroup title | No. of studies | No. of participants | Statistical method | Effect size |
| 1 Number of participants with at least 33% pain relief Show forest plot | 6 | 727 | Risk Difference (M‐H, Random, 95% CI) | 0.25 [0.13, 0.37] |
| Analysis 2.1  Comparison 2 Intermediate‐term Efficacy Studies: Opioid vs. Placebo, Outcome 1 Number of participants with at least 33% pain relief. | ||||
| 2 Number of participants with at least 50% pain relief Show forest plot | 5 | 305 | Risk Difference (M‐H, Random, 95% CI) | 0.17 [0.02, 0.33] |
| Analysis 2.2  Comparison 2 Intermediate‐term Efficacy Studies: Opioid vs. Placebo, Outcome 2 Number of participants with at least 50% pain relief. | ||||
| 3 Pain intensity post‐opioid/placebo Show forest plot | 9 | 725 | Mean Difference (IV, Random, 95% CI) | ‐12.01 [‐15.40, ‐8.62] |
| Analysis 2.3  Comparison 2 Intermediate‐term Efficacy Studies: Opioid vs. Placebo, Outcome 3 Pain intensity post‐opioid/placebo. | ||||
| 4 Evoked pain intensity post‐opioid/placebo Show forest plot | 2 | 148 | Mean Difference (IV, Random, 95% CI) | ‐23.73 [‐34.50, ‐12.96] |
| Analysis 2.4  Comparison 2 Intermediate‐term Efficacy Studies: Opioid vs. Placebo, Outcome 4 Evoked pain intensity post‐opioid/placebo. | ||||
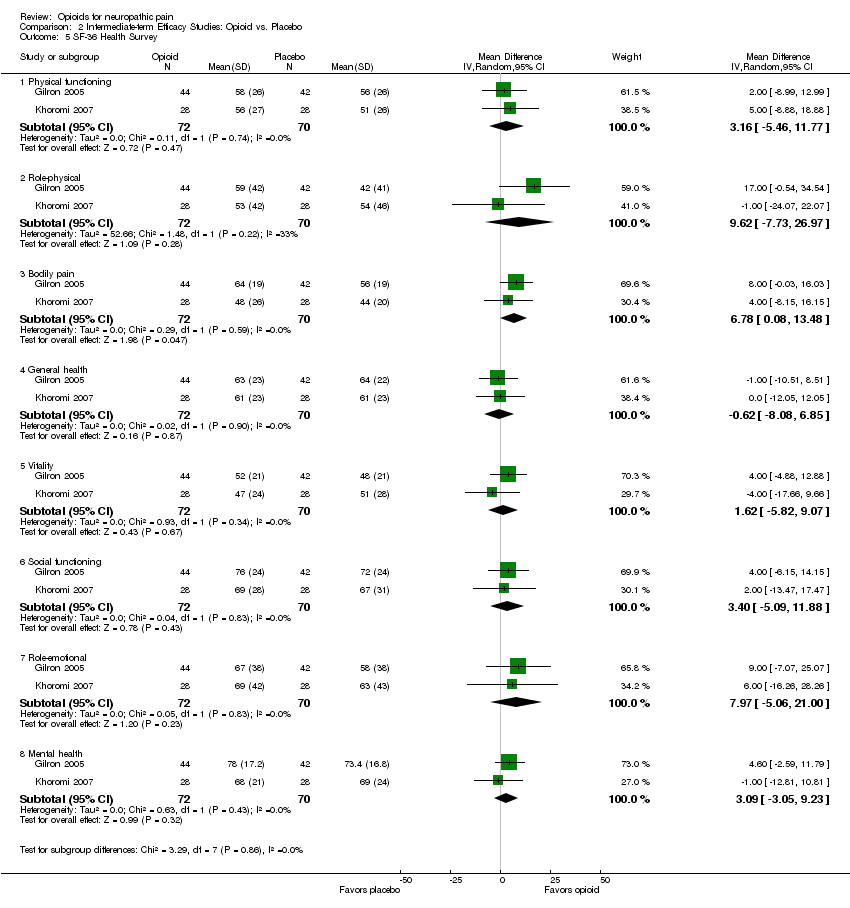
| 5 SF‐36 Health Survey Show forest plot | 2 | Mean Difference (IV, Random, 95% CI) | Subtotals only | |
| Analysis 2.5  Comparison 2 Intermediate‐term Efficacy Studies: Opioid vs. Placebo, Outcome 5 SF‐36 Health Survey. | ||||
| 5.1 Physical functioning | 2 | 142 | Mean Difference (IV, Random, 95% CI) | 3.16 [‐5.46, 11.77] |
| 5.2 Role‐physical | 2 | 142 | Mean Difference (IV, Random, 95% CI) | 9.62 [‐7.73, 26.97] |
| 5.3 Bodily pain | 2 | 142 | Mean Difference (IV, Random, 95% CI) | 6.78 [0.08, 13.48] |
| 5.4 General health | 2 | 142 | Mean Difference (IV, Random, 95% CI) | ‐0.62 [‐8.08, 6.85] |
| 5.5 Vitality | 2 | 142 | Mean Difference (IV, Random, 95% CI) | 1.62 [‐5.82, 9.07] |
| 5.6 Social functioning | 2 | 142 | Mean Difference (IV, Random, 95% CI) | 3.40 [‐5.09, 11.88] |
| 5.7 Role‐emotional | 2 | 142 | Mean Difference (IV, Random, 95% CI) | 7.97 [‐5.06, 21.00] |
| 5.8 Mental health | 2 | 142 | Mean Difference (IV, Random, 95% CI) | 3.09 [‐3.05, 9.23] |
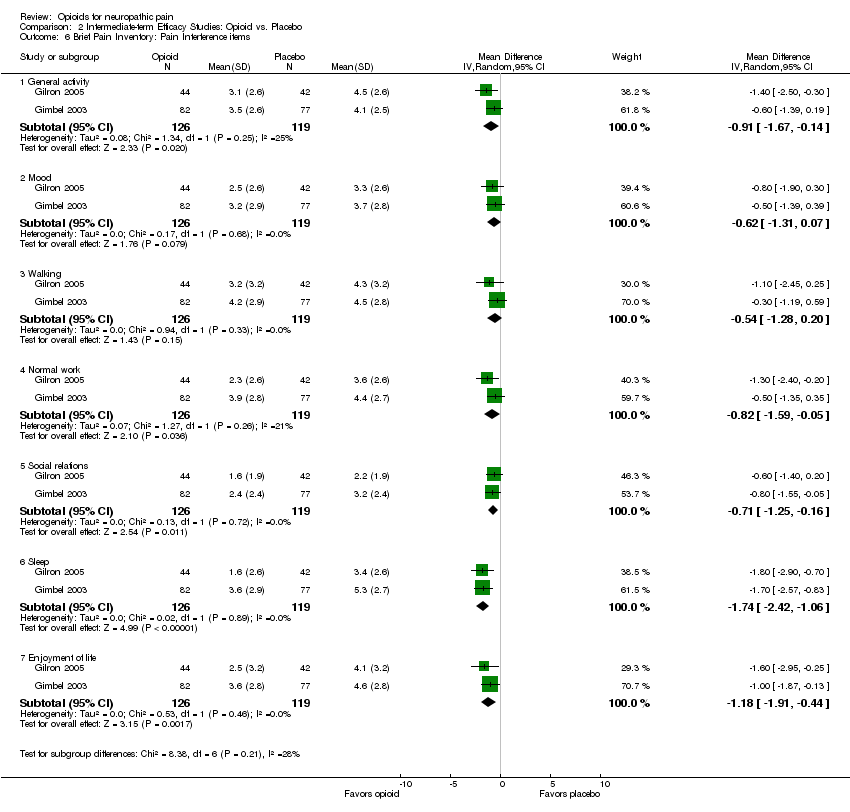
| 6 Brief Pain Inventory: Pain Interference items Show forest plot | 2 | Mean Difference (IV, Random, 95% CI) | Subtotals only | |
| Analysis 2.6  Comparison 2 Intermediate‐term Efficacy Studies: Opioid vs. Placebo, Outcome 6 Brief Pain Inventory: Pain Interference items. | ||||
| 6.1 General activity | 2 | 245 | Mean Difference (IV, Random, 95% CI) | ‐0.91 [‐1.67, ‐0.14] |
| 6.2 Mood | 2 | 245 | Mean Difference (IV, Random, 95% CI) | ‐0.62 [‐1.31, 0.07] |
| 6.3 Walking | 2 | 245 | Mean Difference (IV, Random, 95% CI) | ‐0.54 [‐1.28, 0.20] |
| 6.4 Normal work | 2 | 245 | Mean Difference (IV, Random, 95% CI) | ‐0.82 [‐1.59, ‐0.05] |
| 6.5 Social relations | 2 | 245 | Mean Difference (IV, Random, 95% CI) | ‐0.71 [‐1.25, ‐0.16] |
| 6.6 Sleep | 2 | 245 | Mean Difference (IV, Random, 95% CI) | ‐1.74 [‐2.42, ‐1.06] |
| 6.7 Enjoyment of life | 2 | 245 | Mean Difference (IV, Random, 95% CI) | ‐1.18 [‐1.91, ‐0.44] |
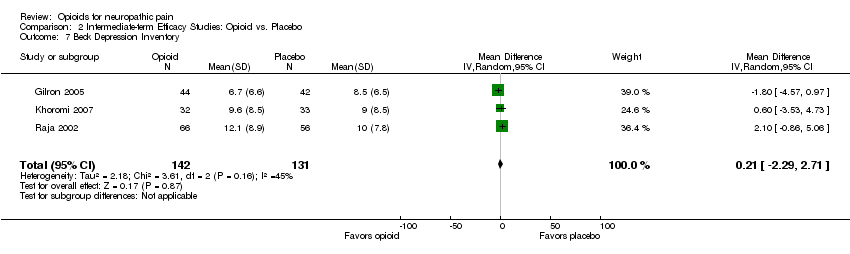
| 7 Beck Depression Inventory Show forest plot | 3 | 273 | Mean Difference (IV, Random, 95% CI) | 0.21 [‐2.29, 2.71] |
| Analysis 2.7  Comparison 2 Intermediate‐term Efficacy Studies: Opioid vs. Placebo, Outcome 7 Beck Depression Inventory. | ||||
| Outcome or subgroup title | No. of studies | No. of participants | Statistical method | Effect size |
| 1 Number of participants with at least 33% pain relief Show forest plot | 3 | 243 | Risk Difference (M‐H, Random, 95% CI) | 0.17 [0.04, 0.31] |
| Analysis 3.1 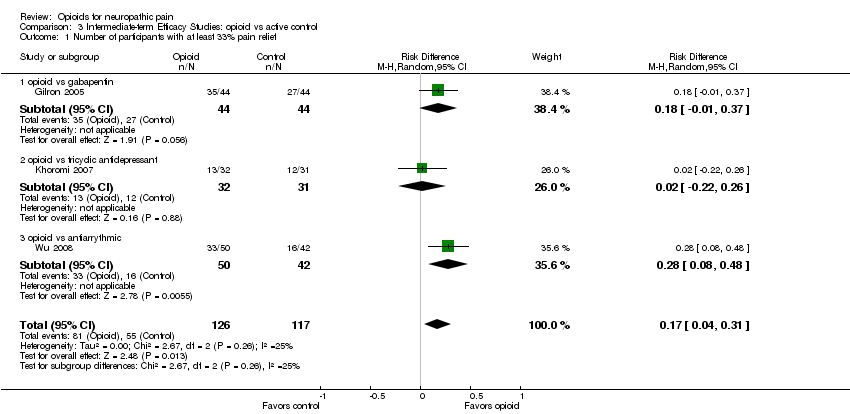 Comparison 3 Intermediate‐term Efficacy Studies: opioid vs active control, Outcome 1 Number of participants with at least 33% pain relief. | ||||
| 1.1 opioid vs gabapentin | 1 | 88 | Risk Difference (M‐H, Random, 95% CI) | 0.18 [‐0.01, 0.37] |
| 1.2 opioid vs tricyclic antidepressant | 1 | 63 | Risk Difference (M‐H, Random, 95% CI) | 0.02 [‐0.22, 0.26] |
| 1.3 opioid vs antiarrythmic | 1 | 92 | Risk Difference (M‐H, Random, 95% CI) | 0.28 [0.08, 0.48] |
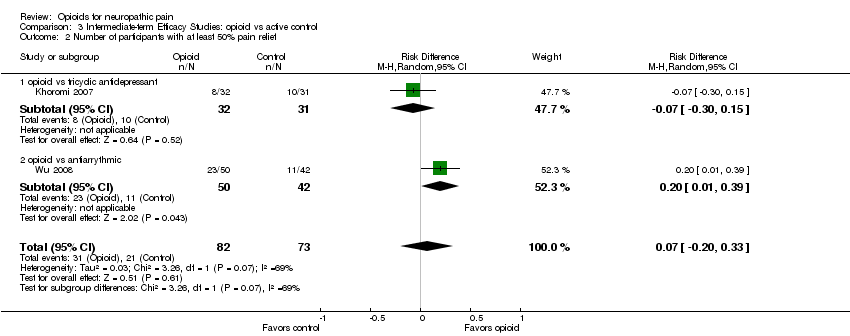
| 2 Number of participants with at least 50% pain relief Show forest plot | 2 | 155 | Risk Difference (M‐H, Random, 95% CI) | 0.07 [‐0.20, 0.33] |
| Analysis 3.2  Comparison 3 Intermediate‐term Efficacy Studies: opioid vs active control, Outcome 2 Number of participants with at least 50% pain relief. | ||||
| 2.1 opioid vs tricyclic antidepressant | 1 | 63 | Risk Difference (M‐H, Random, 95% CI) | ‐0.07 [‐0.30, 0.15] |
| 2.2 opioid vs antiarrythmic | 1 | 92 | Risk Difference (M‐H, Random, 95% CI) | 0.20 [0.01, 0.39] |
| 3 Pain intensity post‐opioid/active control Show forest plot | 4 | 388 | Mean Difference (IV, Random, 95% CI) | ‐7.19 [‐13.13, ‐1.25] |
| Analysis 3.3  Comparison 3 Intermediate‐term Efficacy Studies: opioid vs active control, Outcome 3 Pain intensity post‐opioid/active control. | ||||
| 3.1 opioid vs gabapentin | 1 | 88 | Mean Difference (IV, Random, 95% CI) | ‐5.0 [‐14.40, 4.40] |
| 3.2 opioid vs tricyclic antidepressant | 2 | 208 | Mean Difference (IV, Random, 95% CI) | ‐3.30 [‐13.48, 6.89] |
| 3.3 opioid vs antiarrythmic | 1 | 92 | Mean Difference (IV, Random, 95% CI) | ‐13.0 [‐19.12, ‐6.88] |
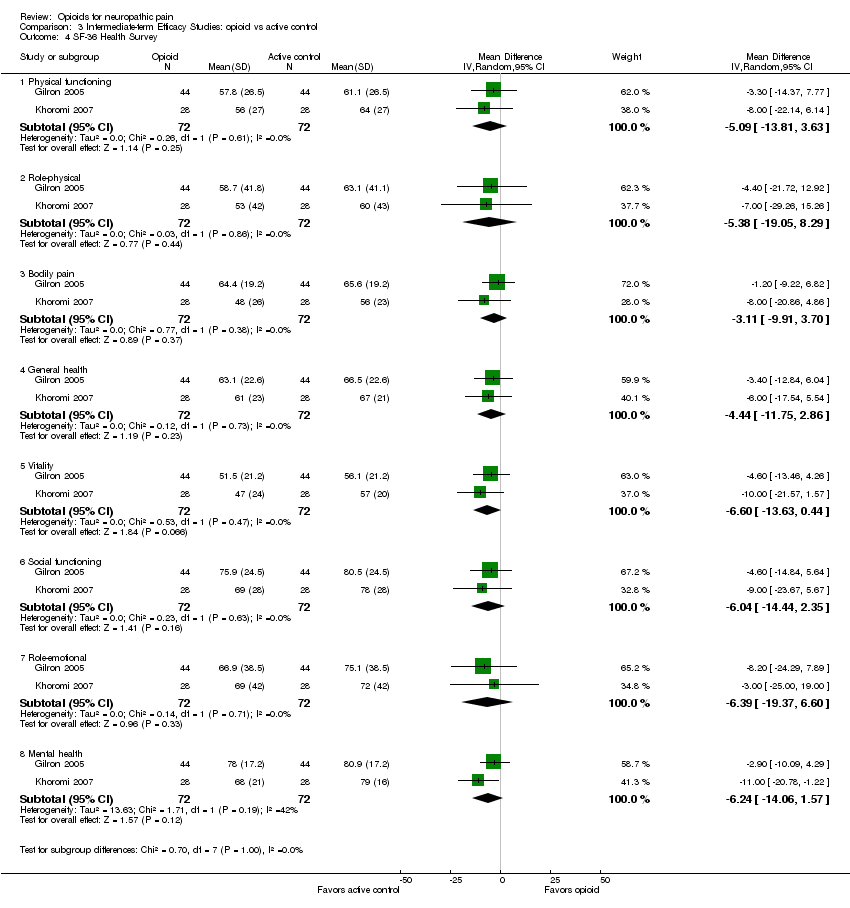
| 4 SF‐36 Health Survey Show forest plot | 2 | Mean Difference (IV, Random, 95% CI) | Subtotals only | |
| Analysis 3.4  Comparison 3 Intermediate‐term Efficacy Studies: opioid vs active control, Outcome 4 SF‐36 Health Survey. | ||||
| 4.1 Physical functioning | 2 | 144 | Mean Difference (IV, Random, 95% CI) | ‐5.09 [‐13.81, 3.63] |
| 4.2 Role‐physical | 2 | 144 | Mean Difference (IV, Random, 95% CI) | ‐5.38 [‐19.05, 8.29] |
| 4.3 Bodily pain | 2 | 144 | Mean Difference (IV, Random, 95% CI) | ‐3.11 [‐9.91, 3.70] |
| 4.4 General health | 2 | 144 | Mean Difference (IV, Random, 95% CI) | ‐4.44 [‐11.75, 2.86] |
| 4.5 Vitality | 2 | 144 | Mean Difference (IV, Random, 95% CI) | ‐6.60 [‐13.63, 0.44] |
| 4.6 Social functioning | 2 | 144 | Mean Difference (IV, Random, 95% CI) | ‐6.04 [‐14.44, 2.35] |
| 4.7 Role‐emotional | 2 | 144 | Mean Difference (IV, Random, 95% CI) | ‐6.39 [‐19.37, 6.60] |
| 4.8 Mental health | 2 | 144 | Mean Difference (IV, Random, 95% CI) | ‐6.24 [‐14.06, 1.57] |
| 5 Beck Depression Inventory Show forest plot | 3 | 276 | Mean Difference (IV, Random, 95% CI) | 1.40 [‐0.38, 3.17] |
| Analysis 3.5  Comparison 3 Intermediate‐term Efficacy Studies: opioid vs active control, Outcome 5 Beck Depression Inventory. | ||||
| 5.1 opioid vs gabapentin | 1 | 88 | Mean Difference (IV, Random, 95% CI) | 0.30 [‐2.46, 3.06] |
| 5.2 opioid vs tricyclic antidepressant | 2 | 188 | Mean Difference (IV, Random, 95% CI) | 2.17 [‐0.14, 4.49] |
| Outcome or subgroup title | No. of studies | No. of participants | Statistical method | Effect size |
| 1 Participants reporting constipation Show forest plot | 10 | 1114 | Risk Difference (M‐H, Random, 95% CI) | 0.25 [0.18, 0.33] |
| Analysis 4.1  Comparison 4 Adverse Events from Intermediate‐term Studies: opioid vs placebo, Outcome 1 Participants reporting constipation. | ||||
| 2 Participants reporting dizziness Show forest plot | 10 | 1114 | Risk Difference (M‐H, Fixed, 95% CI) | 0.14 [0.10, 0.18] |
| Analysis 4.2  Comparison 4 Adverse Events from Intermediate‐term Studies: opioid vs placebo, Outcome 2 Participants reporting dizziness. | ||||
| 3 Participants reporting drowsiness/somnolence Show forest plot | 8 | 738 | Risk Difference (M‐H, Random, 95% CI) | 0.14 [0.03, 0.25] |
| Analysis 4.3 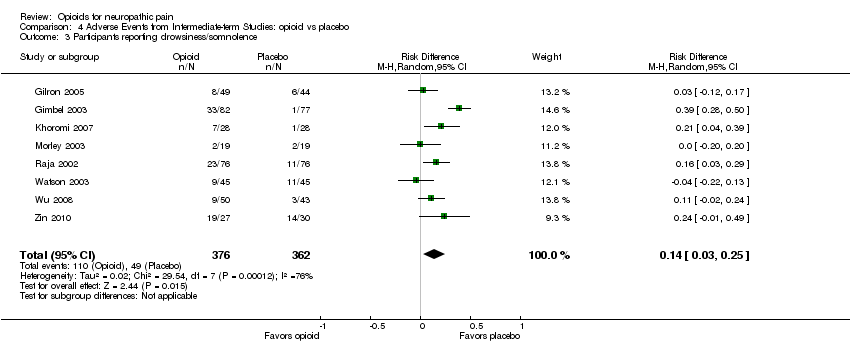 Comparison 4 Adverse Events from Intermediate‐term Studies: opioid vs placebo, Outcome 3 Participants reporting drowsiness/somnolence. | ||||
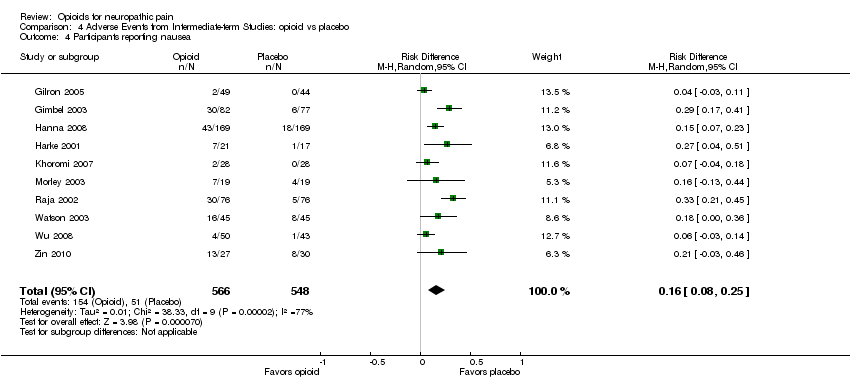
| 4 Participants reporting nausea Show forest plot | 10 | 1114 | Risk Difference (M‐H, Random, 95% CI) | 0.16 [0.08, 0.25] |
| Analysis 4.4  Comparison 4 Adverse Events from Intermediate‐term Studies: opioid vs placebo, Outcome 4 Participants reporting nausea. | ||||
| 5 Participants reporting vomiting Show forest plot | 7 | 813 | Risk Difference (M‐H, Random, 95% CI) | 0.08 [0.01, 0.15] |
| Analysis 4.5  Comparison 4 Adverse Events from Intermediate‐term Studies: opioid vs placebo, Outcome 5 Participants reporting vomiting. | ||||
| 6 Particpants withdrawing due to adverse events Show forest plot | 7 | 867 | Risk Difference (M‐H, Random, 95% CI) | 0.08 [0.04, 0.12] |
| Analysis 4.6  Comparison 4 Adverse Events from Intermediate‐term Studies: opioid vs placebo, Outcome 6 Particpants withdrawing due to adverse events. | ||||
| 7 Participants withdrawing due to lack of efficacy Show forest plot | 5 | 723 | Risk Difference (M‐H, Random, 95% CI) | ‐0.09 [‐0.12, ‐0.05] |
| Analysis 4.7  Comparison 4 Adverse Events from Intermediate‐term Studies: opioid vs placebo, Outcome 7 Participants withdrawing due to lack of efficacy. | ||||
| Outcome or subgroup title | No. of studies | No. of participants | Statistical method | Effect size |
| 1 Participants reporting constipation Show forest plot | 4 | 397 | Risk Difference (M‐H, Random, 95% CI) | 0.29 [0.21, 0.38] |
| Analysis 5.1  Comparison 5 Adverse Events from Intermediate‐term Studies: opioid vs active control, Outcome 1 Participants reporting constipation. | ||||
| 2 Participants reporting dizziness Show forest plot | 4 | 397 | Risk Difference (M‐H, Random, 95% CI) | ‐0.01 [‐0.05, 0.03] |
| Analysis 5.2 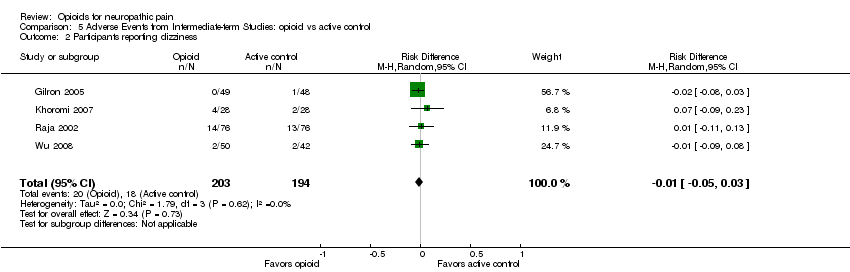 Comparison 5 Adverse Events from Intermediate‐term Studies: opioid vs active control, Outcome 2 Participants reporting dizziness. | ||||
| 3 Participants reporting drowsiness/somnolence Show forest plot | 4 | 397 | Risk Difference (M‐H, Random, 95% CI) | 0.13 [0.06, 0.20] |
| Analysis 5.3  Comparison 5 Adverse Events from Intermediate‐term Studies: opioid vs active control, Outcome 3 Participants reporting drowsiness/somnolence. | ||||
| 4 Participants reporting nausea Show forest plot | 4 | 393 | Risk Difference (M‐H, Random, 95% CI) | 0.13 [‐0.01, 0.26] |
| Analysis 5.4 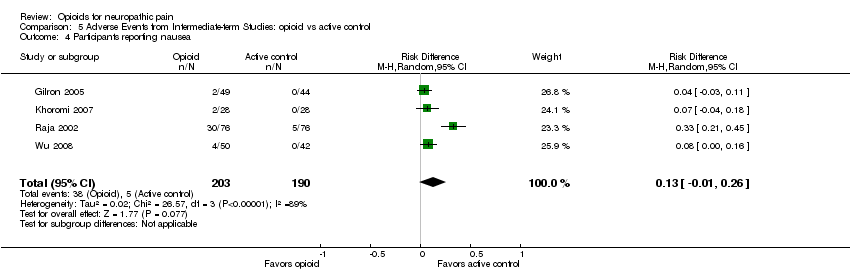 Comparison 5 Adverse Events from Intermediate‐term Studies: opioid vs active control, Outcome 4 Participants reporting nausea. | ||||
| 5 Participants reporting vomiting Show forest plot | 1 | 97 | Risk Difference (M‐H, Random, 95% CI) | 0.0 [‐0.04, 0.04] |
| Analysis 5.5  Comparison 5 Adverse Events from Intermediate‐term Studies: opioid vs active control, Outcome 5 Participants reporting vomiting. | ||||
| 6 Participants withdrawing due to adverse events Show forest plot | 1 | 75 | Risk Difference (M‐H, Random, 95% CI) | 0.06 [‐0.06, 0.19] |
| Analysis 5.6 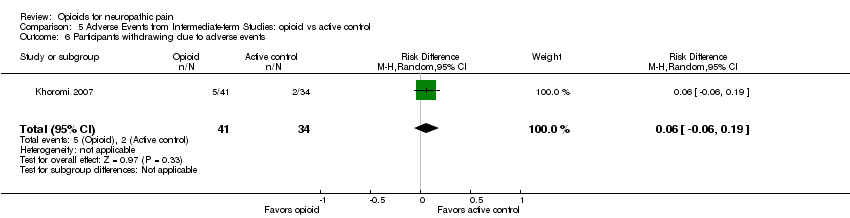 Comparison 5 Adverse Events from Intermediate‐term Studies: opioid vs active control, Outcome 6 Participants withdrawing due to adverse events. | ||||
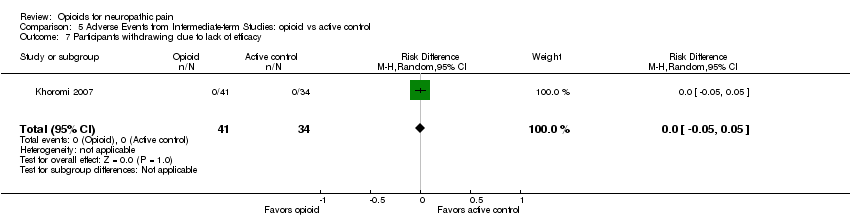
| 7 Participants withdrawing due to lack of efficacy Show forest plot | 1 | 75 | Risk Difference (M‐H, Random, 95% CI) | 0.0 [‐0.05, 0.05] |
| Analysis 5.7  Comparison 5 Adverse Events from Intermediate‐term Studies: opioid vs active control, Outcome 7 Participants withdrawing due to lack of efficacy. | ||||
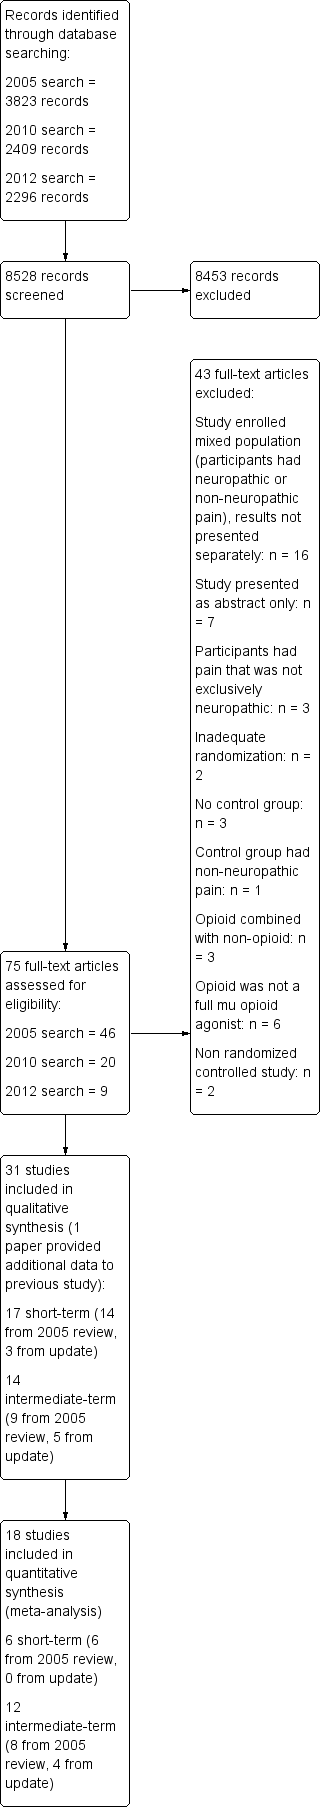
Study flow diagram.
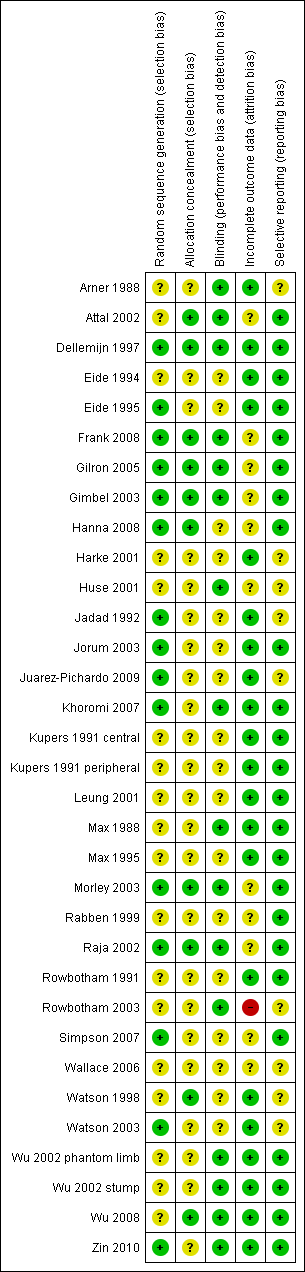
Risk of bias summary: review authors' judgements about each risk of bias item for each included study.
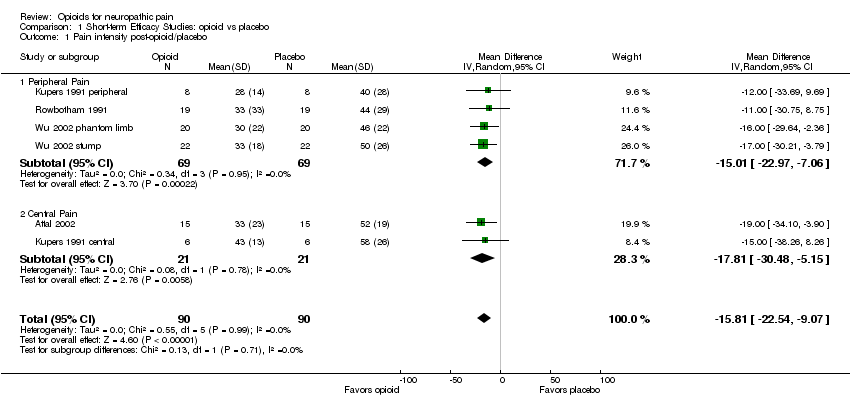
Comparison 1 Short‐term Efficacy Studies: opioid vs placebo, Outcome 1 Pain intensity post‐opioid/placebo.

Comparison 1 Short‐term Efficacy Studies: opioid vs placebo, Outcome 2 % Pain reduction post‐opioid/placebo.

Comparison 2 Intermediate‐term Efficacy Studies: Opioid vs. Placebo, Outcome 1 Number of participants with at least 33% pain relief.

Comparison 2 Intermediate‐term Efficacy Studies: Opioid vs. Placebo, Outcome 2 Number of participants with at least 50% pain relief.
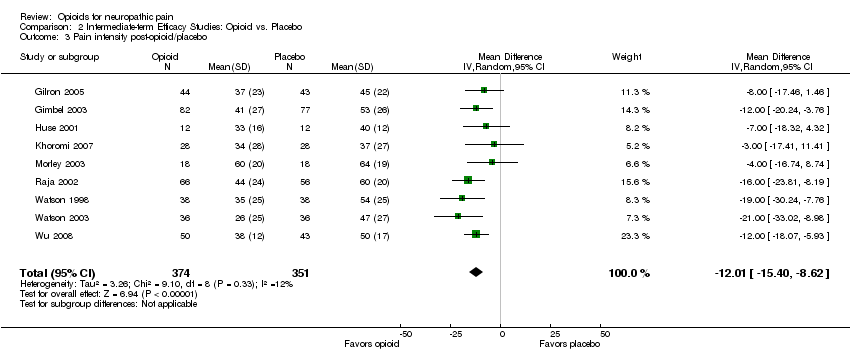
Comparison 2 Intermediate‐term Efficacy Studies: Opioid vs. Placebo, Outcome 3 Pain intensity post‐opioid/placebo.

Comparison 2 Intermediate‐term Efficacy Studies: Opioid vs. Placebo, Outcome 4 Evoked pain intensity post‐opioid/placebo.
Comparison 2 Intermediate‐term Efficacy Studies: Opioid vs. Placebo, Outcome 5 SF‐36 Health Survey.
Comparison 2 Intermediate‐term Efficacy Studies: Opioid vs. Placebo, Outcome 6 Brief Pain Inventory: Pain Interference items.
Comparison 2 Intermediate‐term Efficacy Studies: Opioid vs. Placebo, Outcome 7 Beck Depression Inventory.

Comparison 3 Intermediate‐term Efficacy Studies: opioid vs active control, Outcome 1 Number of participants with at least 33% pain relief.
Comparison 3 Intermediate‐term Efficacy Studies: opioid vs active control, Outcome 2 Number of participants with at least 50% pain relief.

Comparison 3 Intermediate‐term Efficacy Studies: opioid vs active control, Outcome 3 Pain intensity post‐opioid/active control.
Comparison 3 Intermediate‐term Efficacy Studies: opioid vs active control, Outcome 4 SF‐36 Health Survey.

Comparison 3 Intermediate‐term Efficacy Studies: opioid vs active control, Outcome 5 Beck Depression Inventory.

Comparison 4 Adverse Events from Intermediate‐term Studies: opioid vs placebo, Outcome 1 Participants reporting constipation.

Comparison 4 Adverse Events from Intermediate‐term Studies: opioid vs placebo, Outcome 2 Participants reporting dizziness.

Comparison 4 Adverse Events from Intermediate‐term Studies: opioid vs placebo, Outcome 3 Participants reporting drowsiness/somnolence.
Comparison 4 Adverse Events from Intermediate‐term Studies: opioid vs placebo, Outcome 4 Participants reporting nausea.
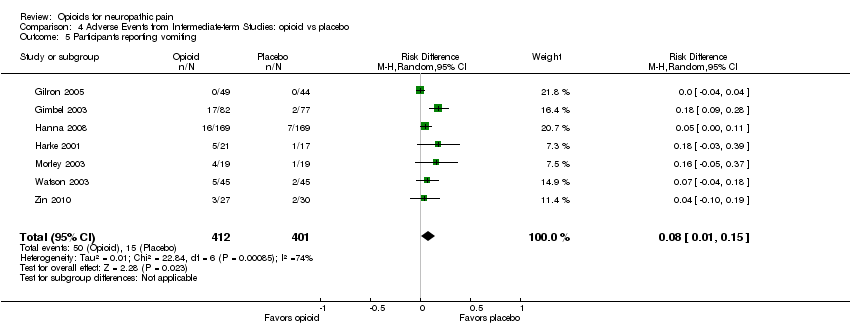
Comparison 4 Adverse Events from Intermediate‐term Studies: opioid vs placebo, Outcome 5 Participants reporting vomiting.

Comparison 4 Adverse Events from Intermediate‐term Studies: opioid vs placebo, Outcome 6 Particpants withdrawing due to adverse events.
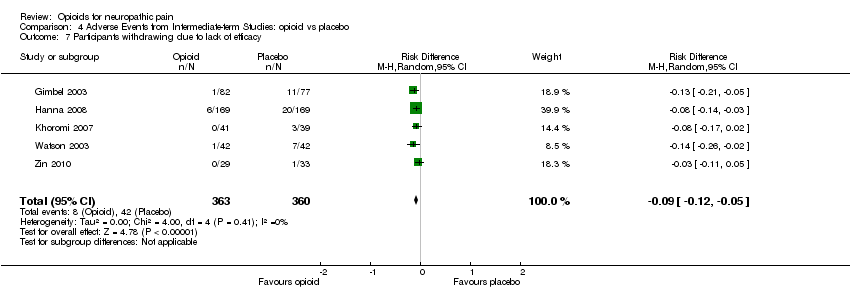
Comparison 4 Adverse Events from Intermediate‐term Studies: opioid vs placebo, Outcome 7 Participants withdrawing due to lack of efficacy.

Comparison 5 Adverse Events from Intermediate‐term Studies: opioid vs active control, Outcome 1 Participants reporting constipation.

Comparison 5 Adverse Events from Intermediate‐term Studies: opioid vs active control, Outcome 2 Participants reporting dizziness.
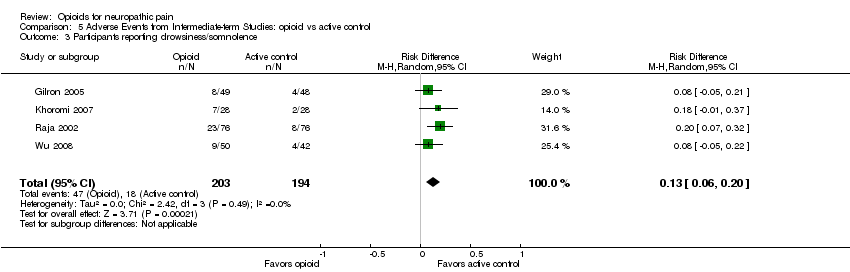
Comparison 5 Adverse Events from Intermediate‐term Studies: opioid vs active control, Outcome 3 Participants reporting drowsiness/somnolence.

Comparison 5 Adverse Events from Intermediate‐term Studies: opioid vs active control, Outcome 4 Participants reporting nausea.
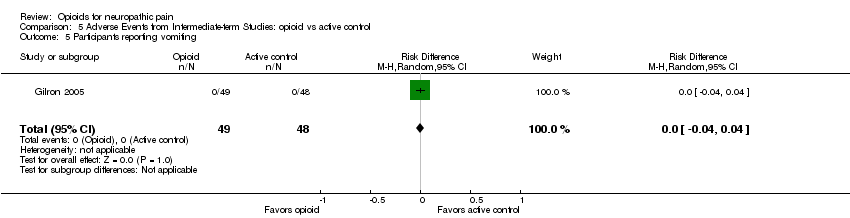
Comparison 5 Adverse Events from Intermediate‐term Studies: opioid vs active control, Outcome 5 Participants reporting vomiting.

Comparison 5 Adverse Events from Intermediate‐term Studies: opioid vs active control, Outcome 6 Participants withdrawing due to adverse events.
Comparison 5 Adverse Events from Intermediate‐term Studies: opioid vs active control, Outcome 7 Participants withdrawing due to lack of efficacy.
| Outcome or subgroup title | No. of studies | No. of participants | Statistical method | Effect size |
| 1 Pain intensity post‐opioid/placebo Show forest plot | 6 | 180 | Mean Difference (IV, Random, 95% CI) | ‐15.81 [‐22.54, ‐9.07] |
| 1.1 Peripheral Pain | 4 | 138 | Mean Difference (IV, Random, 95% CI) | ‐15.01 [‐22.97, ‐7.06] |
| 1.2 Central Pain | 2 | 42 | Mean Difference (IV, Random, 95% CI) | ‐17.81 [‐30.48, ‐5.15] |
| 2 % Pain reduction post‐opioid/placebo Show forest plot | 2 | 38 | Mean Difference (IV, Random, 95% CI) | 25.78 [16.91, 34.65] |
| Outcome or subgroup title | No. of studies | No. of participants | Statistical method | Effect size |
| 1 Number of participants with at least 33% pain relief Show forest plot | 6 | 727 | Risk Difference (M‐H, Random, 95% CI) | 0.25 [0.13, 0.37] |
| 2 Number of participants with at least 50% pain relief Show forest plot | 5 | 305 | Risk Difference (M‐H, Random, 95% CI) | 0.17 [0.02, 0.33] |
| 3 Pain intensity post‐opioid/placebo Show forest plot | 9 | 725 | Mean Difference (IV, Random, 95% CI) | ‐12.01 [‐15.40, ‐8.62] |
| 4 Evoked pain intensity post‐opioid/placebo Show forest plot | 2 | 148 | Mean Difference (IV, Random, 95% CI) | ‐23.73 [‐34.50, ‐12.96] |
| 5 SF‐36 Health Survey Show forest plot | 2 | Mean Difference (IV, Random, 95% CI) | Subtotals only | |
| 5.1 Physical functioning | 2 | 142 | Mean Difference (IV, Random, 95% CI) | 3.16 [‐5.46, 11.77] |
| 5.2 Role‐physical | 2 | 142 | Mean Difference (IV, Random, 95% CI) | 9.62 [‐7.73, 26.97] |
| 5.3 Bodily pain | 2 | 142 | Mean Difference (IV, Random, 95% CI) | 6.78 [0.08, 13.48] |
| 5.4 General health | 2 | 142 | Mean Difference (IV, Random, 95% CI) | ‐0.62 [‐8.08, 6.85] |
| 5.5 Vitality | 2 | 142 | Mean Difference (IV, Random, 95% CI) | 1.62 [‐5.82, 9.07] |
| 5.6 Social functioning | 2 | 142 | Mean Difference (IV, Random, 95% CI) | 3.40 [‐5.09, 11.88] |
| 5.7 Role‐emotional | 2 | 142 | Mean Difference (IV, Random, 95% CI) | 7.97 [‐5.06, 21.00] |
| 5.8 Mental health | 2 | 142 | Mean Difference (IV, Random, 95% CI) | 3.09 [‐3.05, 9.23] |
| 6 Brief Pain Inventory: Pain Interference items Show forest plot | 2 | Mean Difference (IV, Random, 95% CI) | Subtotals only | |
| 6.1 General activity | 2 | 245 | Mean Difference (IV, Random, 95% CI) | ‐0.91 [‐1.67, ‐0.14] |
| 6.2 Mood | 2 | 245 | Mean Difference (IV, Random, 95% CI) | ‐0.62 [‐1.31, 0.07] |
| 6.3 Walking | 2 | 245 | Mean Difference (IV, Random, 95% CI) | ‐0.54 [‐1.28, 0.20] |
| 6.4 Normal work | 2 | 245 | Mean Difference (IV, Random, 95% CI) | ‐0.82 [‐1.59, ‐0.05] |
| 6.5 Social relations | 2 | 245 | Mean Difference (IV, Random, 95% CI) | ‐0.71 [‐1.25, ‐0.16] |
| 6.6 Sleep | 2 | 245 | Mean Difference (IV, Random, 95% CI) | ‐1.74 [‐2.42, ‐1.06] |
| 6.7 Enjoyment of life | 2 | 245 | Mean Difference (IV, Random, 95% CI) | ‐1.18 [‐1.91, ‐0.44] |
| 7 Beck Depression Inventory Show forest plot | 3 | 273 | Mean Difference (IV, Random, 95% CI) | 0.21 [‐2.29, 2.71] |
| Outcome or subgroup title | No. of studies | No. of participants | Statistical method | Effect size |
| 1 Number of participants with at least 33% pain relief Show forest plot | 3 | 243 | Risk Difference (M‐H, Random, 95% CI) | 0.17 [0.04, 0.31] |
| 1.1 opioid vs gabapentin | 1 | 88 | Risk Difference (M‐H, Random, 95% CI) | 0.18 [‐0.01, 0.37] |
| 1.2 opioid vs tricyclic antidepressant | 1 | 63 | Risk Difference (M‐H, Random, 95% CI) | 0.02 [‐0.22, 0.26] |
| 1.3 opioid vs antiarrythmic | 1 | 92 | Risk Difference (M‐H, Random, 95% CI) | 0.28 [0.08, 0.48] |
| 2 Number of participants with at least 50% pain relief Show forest plot | 2 | 155 | Risk Difference (M‐H, Random, 95% CI) | 0.07 [‐0.20, 0.33] |
| 2.1 opioid vs tricyclic antidepressant | 1 | 63 | Risk Difference (M‐H, Random, 95% CI) | ‐0.07 [‐0.30, 0.15] |
| 2.2 opioid vs antiarrythmic | 1 | 92 | Risk Difference (M‐H, Random, 95% CI) | 0.20 [0.01, 0.39] |
| 3 Pain intensity post‐opioid/active control Show forest plot | 4 | 388 | Mean Difference (IV, Random, 95% CI) | ‐7.19 [‐13.13, ‐1.25] |
| 3.1 opioid vs gabapentin | 1 | 88 | Mean Difference (IV, Random, 95% CI) | ‐5.0 [‐14.40, 4.40] |
| 3.2 opioid vs tricyclic antidepressant | 2 | 208 | Mean Difference (IV, Random, 95% CI) | ‐3.30 [‐13.48, 6.89] |
| 3.3 opioid vs antiarrythmic | 1 | 92 | Mean Difference (IV, Random, 95% CI) | ‐13.0 [‐19.12, ‐6.88] |
| 4 SF‐36 Health Survey Show forest plot | 2 | Mean Difference (IV, Random, 95% CI) | Subtotals only | |
| 4.1 Physical functioning | 2 | 144 | Mean Difference (IV, Random, 95% CI) | ‐5.09 [‐13.81, 3.63] |
| 4.2 Role‐physical | 2 | 144 | Mean Difference (IV, Random, 95% CI) | ‐5.38 [‐19.05, 8.29] |
| 4.3 Bodily pain | 2 | 144 | Mean Difference (IV, Random, 95% CI) | ‐3.11 [‐9.91, 3.70] |
| 4.4 General health | 2 | 144 | Mean Difference (IV, Random, 95% CI) | ‐4.44 [‐11.75, 2.86] |
| 4.5 Vitality | 2 | 144 | Mean Difference (IV, Random, 95% CI) | ‐6.60 [‐13.63, 0.44] |
| 4.6 Social functioning | 2 | 144 | Mean Difference (IV, Random, 95% CI) | ‐6.04 [‐14.44, 2.35] |
| 4.7 Role‐emotional | 2 | 144 | Mean Difference (IV, Random, 95% CI) | ‐6.39 [‐19.37, 6.60] |
| 4.8 Mental health | 2 | 144 | Mean Difference (IV, Random, 95% CI) | ‐6.24 [‐14.06, 1.57] |
| 5 Beck Depression Inventory Show forest plot | 3 | 276 | Mean Difference (IV, Random, 95% CI) | 1.40 [‐0.38, 3.17] |
| 5.1 opioid vs gabapentin | 1 | 88 | Mean Difference (IV, Random, 95% CI) | 0.30 [‐2.46, 3.06] |
| 5.2 opioid vs tricyclic antidepressant | 2 | 188 | Mean Difference (IV, Random, 95% CI) | 2.17 [‐0.14, 4.49] |
| Outcome or subgroup title | No. of studies | No. of participants | Statistical method | Effect size |
| 1 Participants reporting constipation Show forest plot | 10 | 1114 | Risk Difference (M‐H, Random, 95% CI) | 0.25 [0.18, 0.33] |
| 2 Participants reporting dizziness Show forest plot | 10 | 1114 | Risk Difference (M‐H, Fixed, 95% CI) | 0.14 [0.10, 0.18] |
| 3 Participants reporting drowsiness/somnolence Show forest plot | 8 | 738 | Risk Difference (M‐H, Random, 95% CI) | 0.14 [0.03, 0.25] |
| 4 Participants reporting nausea Show forest plot | 10 | 1114 | Risk Difference (M‐H, Random, 95% CI) | 0.16 [0.08, 0.25] |
| 5 Participants reporting vomiting Show forest plot | 7 | 813 | Risk Difference (M‐H, Random, 95% CI) | 0.08 [0.01, 0.15] |
| 6 Particpants withdrawing due to adverse events Show forest plot | 7 | 867 | Risk Difference (M‐H, Random, 95% CI) | 0.08 [0.04, 0.12] |
| 7 Participants withdrawing due to lack of efficacy Show forest plot | 5 | 723 | Risk Difference (M‐H, Random, 95% CI) | ‐0.09 [‐0.12, ‐0.05] |
| Outcome or subgroup title | No. of studies | No. of participants | Statistical method | Effect size |
| 1 Participants reporting constipation Show forest plot | 4 | 397 | Risk Difference (M‐H, Random, 95% CI) | 0.29 [0.21, 0.38] |
| 2 Participants reporting dizziness Show forest plot | 4 | 397 | Risk Difference (M‐H, Random, 95% CI) | ‐0.01 [‐0.05, 0.03] |
| 3 Participants reporting drowsiness/somnolence Show forest plot | 4 | 397 | Risk Difference (M‐H, Random, 95% CI) | 0.13 [0.06, 0.20] |
| 4 Participants reporting nausea Show forest plot | 4 | 393 | Risk Difference (M‐H, Random, 95% CI) | 0.13 [‐0.01, 0.26] |
| 5 Participants reporting vomiting Show forest plot | 1 | 97 | Risk Difference (M‐H, Random, 95% CI) | 0.0 [‐0.04, 0.04] |
| 6 Participants withdrawing due to adverse events Show forest plot | 1 | 75 | Risk Difference (M‐H, Random, 95% CI) | 0.06 [‐0.06, 0.19] |
| 7 Participants withdrawing due to lack of efficacy Show forest plot | 1 | 75 | Risk Difference (M‐H, Random, 95% CI) | 0.0 [‐0.05, 0.05] |