Opiáceos para el dolor neuropático
Información
- DOI:
- https://doi.org/10.1002/14651858.CD006146.pub2Copiar DOI

- Base de datos:
-
- Cochrane Database of Systematic Reviews
- Versión publicada:
-
- 29 agosto 2013see what's new
- Tipo:
-
- Intervention
- Etapa:
-
- Review
- Grupo Editorial Cochrane:
-
Grupo Cochrane de Dolor y cuidados paliativos
- Copyright:
-
- Copyright © 2019 The Cochrane Collaboration. Published by John Wiley & Sons, Ltd.
Cifras del artículo
Altmetric:
Citado por:
Autores
Contributions of authors
AM: screened retrieved papers against inclusion criteria, appraised risk of bias and extracted data from papers and wrote parts of the Background in the updated review.
EE: conceived the review and provided clinical perspective. Designed and coordinated review, participated in retrieval of papers, screened retrieved papers against inclusion criteria, appraised quality of papers, extracted data from papers, wrote parts of the updated review (Abstract, Applicability of evidence, Agreements and disagreements with other studies or reviews).
EM: developed the search strategy, organized retrieval of and screened retrieved papers against inclusion criteria in original review, appraised risk of bias of papers, extracted data from papers, meta‐analyzed data, compiled Characteristics of included studies; Characteristics of excluded studies tables. Wrote Methods and Results Section and parts of Discussion (Summary of main results, Overall completeness of evidence, Quality of the evidence; Potential biases in the review process).
Sources of support
Internal sources
-
Richard Saltonstall Charitable Foundation, USA.
-
Rambam Medical Center, Israel.
-
Technion‐Israel Institute of Technology, Israel.
External sources
-
No sources of support supplied
Declarations of interest
EE has received research support from government and industry sources at various times, and consulted for and received lecture fees from various pharmaceutical companies related to analgesics and other healthcare interventions.
Acknowledgements
Dr. Daniel Carr contributed to and secured funding for our original 2006 review. For that review, he provided a methodological, clinical, policy and consumer perspective. He also provided general and editorial advice on the 2006 review.
Caroline Struthers, Jane Hayes and Joanne Abbott all ran updated literature searches for us for the 2013 review.
Version history
| Published | Title | Stage | Authors | Version |
| 2013 Aug 29 | Opioids for neuropathic pain | Review | Ewan D McNicol, Ayelet Midbari, Elon Eisenberg | |
| 2006 Jul 19 | Opioids for neuropathic pain | Review | Elon Eisenberg, Ewan D McNicol, Daniel B Carr | |
Notes
This review is no longer being updated, but is correct at the time of publication. Reviews of the individual opioids are underway and the review will eventually be replaced by an overview.
Keywords
MeSH
Medical Subject Headings (MeSH) Keywords
Medical Subject Headings Check Words
Humans;
PICO
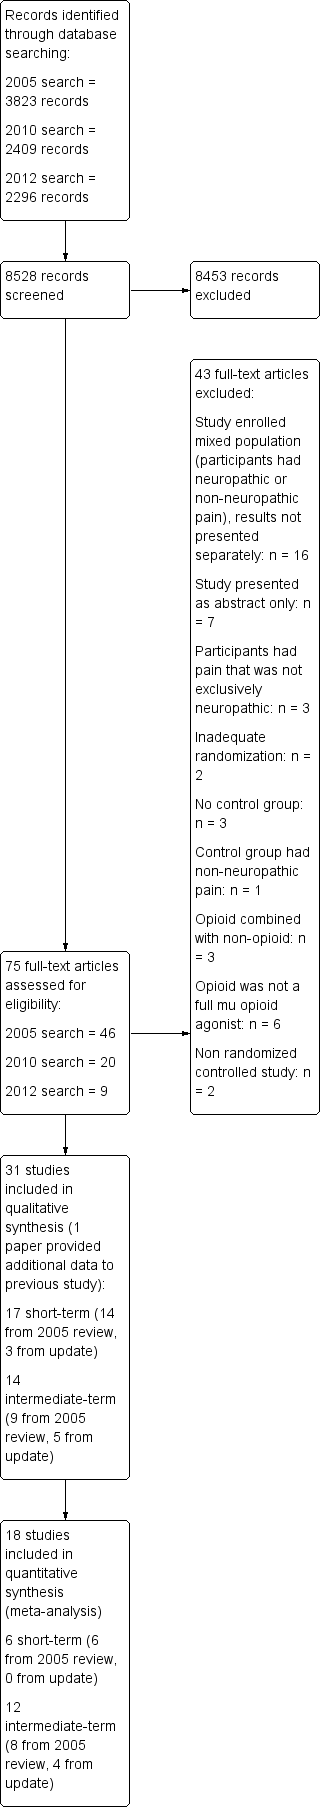
Study flow diagram.
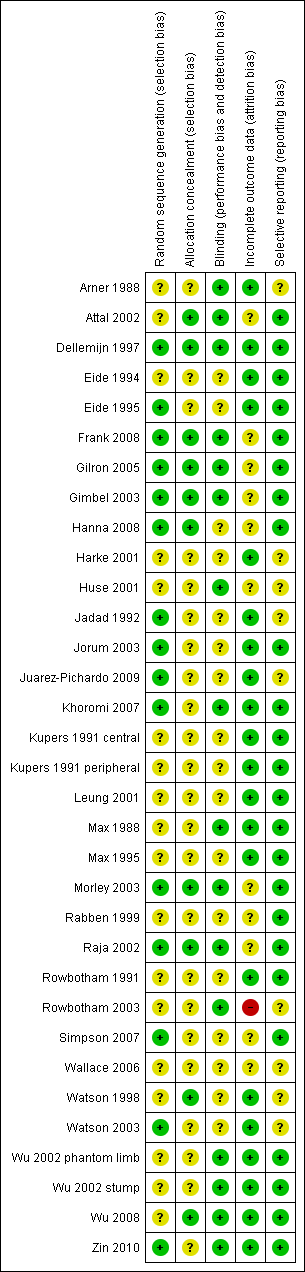
Risk of bias summary: review authors' judgements about each risk of bias item for each included study.
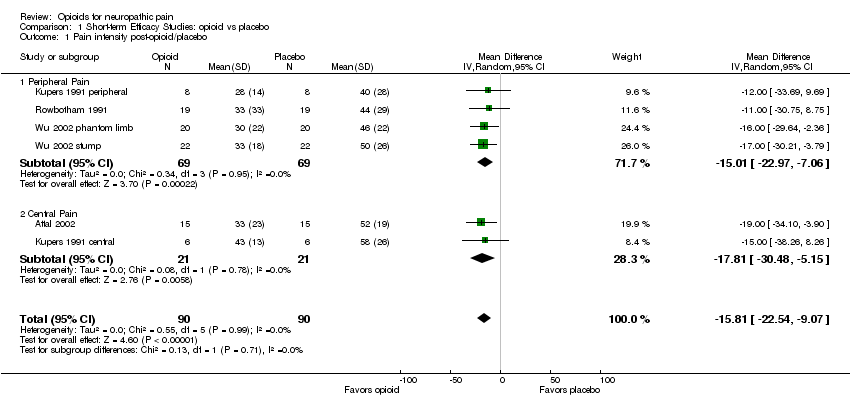
Comparison 1 Short‐term Efficacy Studies: opioid vs placebo, Outcome 1 Pain intensity post‐opioid/placebo.

Comparison 1 Short‐term Efficacy Studies: opioid vs placebo, Outcome 2 % Pain reduction post‐opioid/placebo.

Comparison 2 Intermediate‐term Efficacy Studies: Opioid vs. Placebo, Outcome 1 Number of participants with at least 33% pain relief.

Comparison 2 Intermediate‐term Efficacy Studies: Opioid vs. Placebo, Outcome 2 Number of participants with at least 50% pain relief.
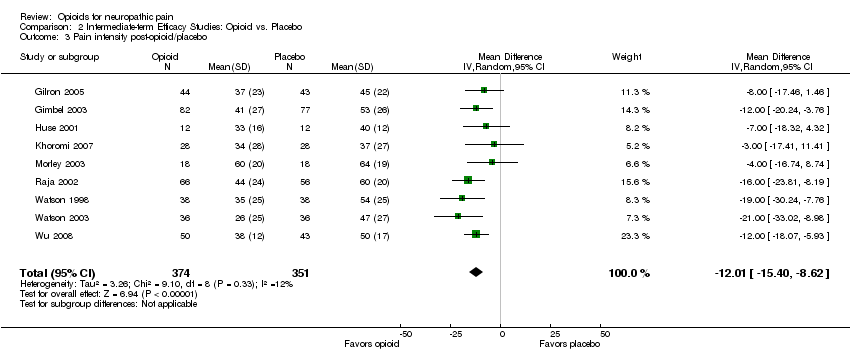
Comparison 2 Intermediate‐term Efficacy Studies: Opioid vs. Placebo, Outcome 3 Pain intensity post‐opioid/placebo.

Comparison 2 Intermediate‐term Efficacy Studies: Opioid vs. Placebo, Outcome 4 Evoked pain intensity post‐opioid/placebo.
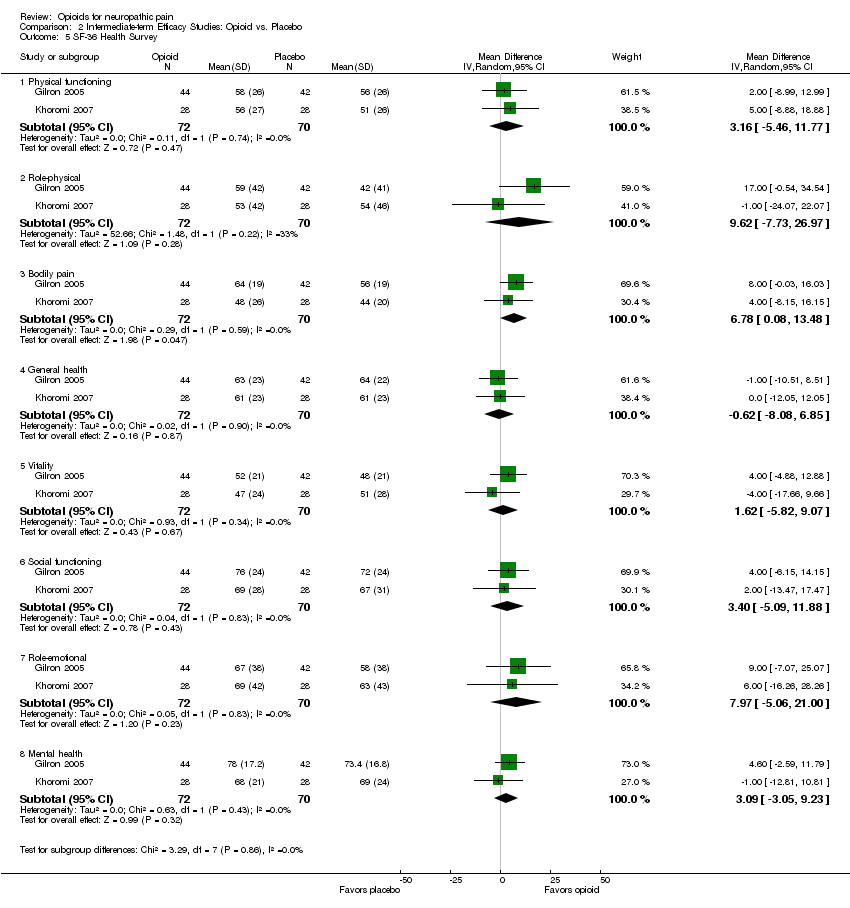
Comparison 2 Intermediate‐term Efficacy Studies: Opioid vs. Placebo, Outcome 5 SF‐36 Health Survey.
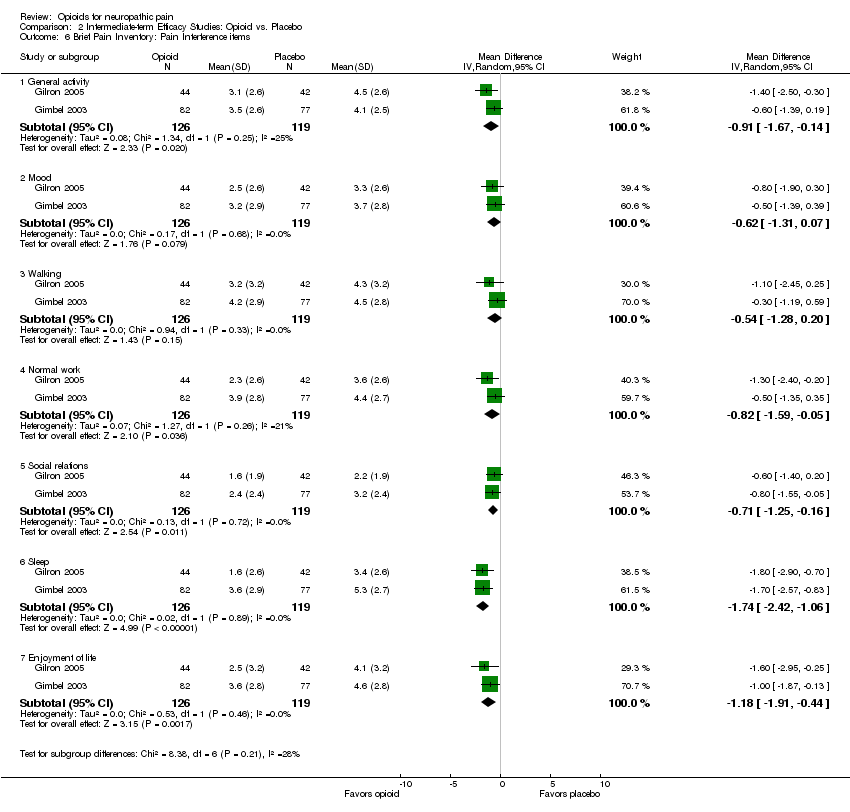
Comparison 2 Intermediate‐term Efficacy Studies: Opioid vs. Placebo, Outcome 6 Brief Pain Inventory: Pain Interference items.
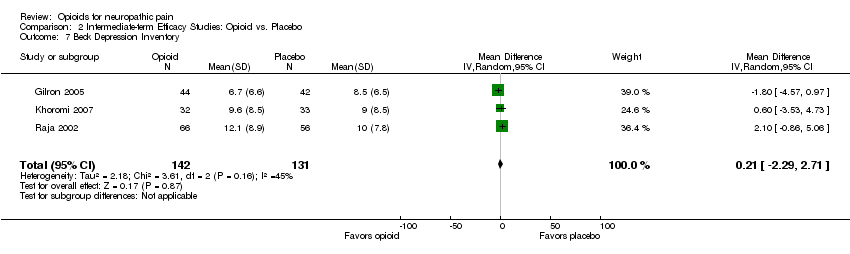
Comparison 2 Intermediate‐term Efficacy Studies: Opioid vs. Placebo, Outcome 7 Beck Depression Inventory.

Comparison 3 Intermediate‐term Efficacy Studies: opioid vs active control, Outcome 1 Number of participants with at least 33% pain relief.
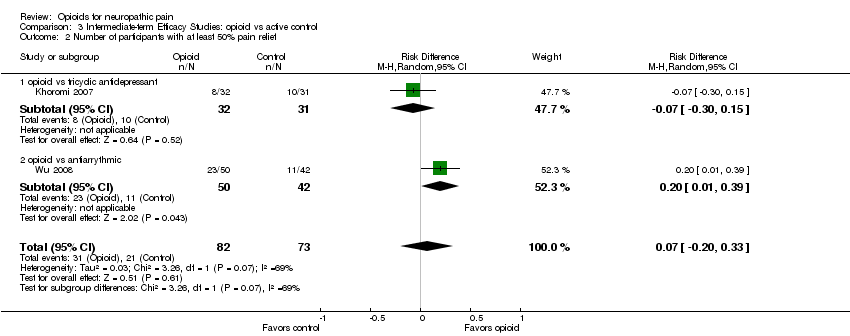
Comparison 3 Intermediate‐term Efficacy Studies: opioid vs active control, Outcome 2 Number of participants with at least 50% pain relief.

Comparison 3 Intermediate‐term Efficacy Studies: opioid vs active control, Outcome 3 Pain intensity post‐opioid/active control.
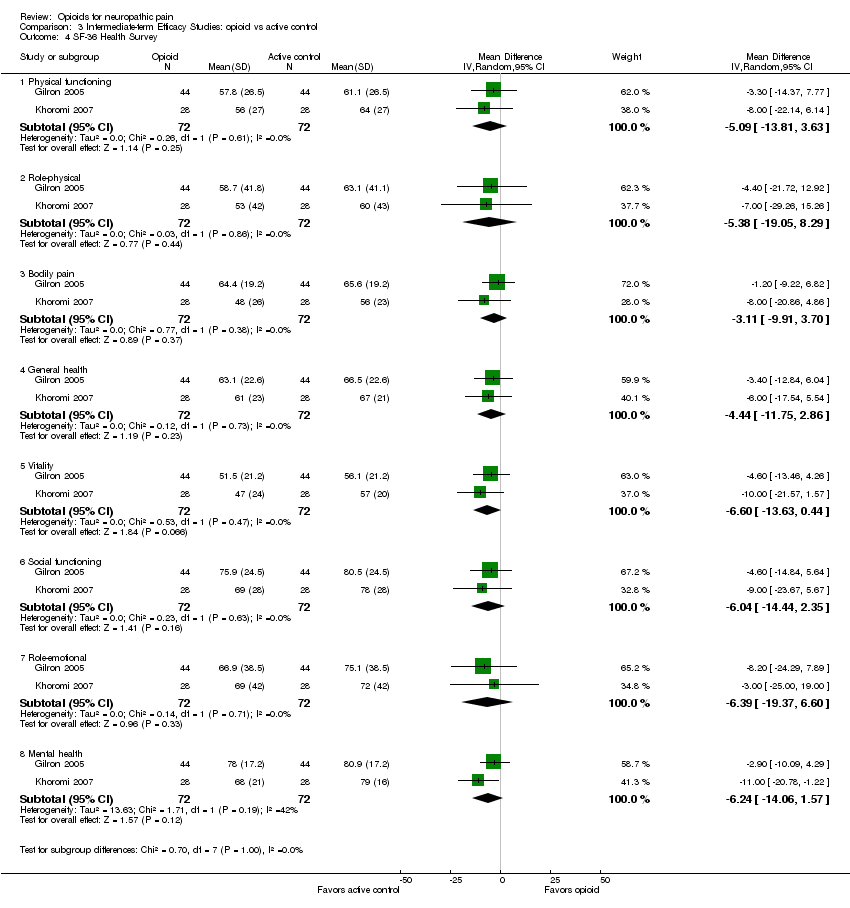
Comparison 3 Intermediate‐term Efficacy Studies: opioid vs active control, Outcome 4 SF‐36 Health Survey.

Comparison 3 Intermediate‐term Efficacy Studies: opioid vs active control, Outcome 5 Beck Depression Inventory.

Comparison 4 Adverse Events from Intermediate‐term Studies: opioid vs placebo, Outcome 1 Participants reporting constipation.

Comparison 4 Adverse Events from Intermediate‐term Studies: opioid vs placebo, Outcome 2 Participants reporting dizziness.

Comparison 4 Adverse Events from Intermediate‐term Studies: opioid vs placebo, Outcome 3 Participants reporting drowsiness/somnolence.
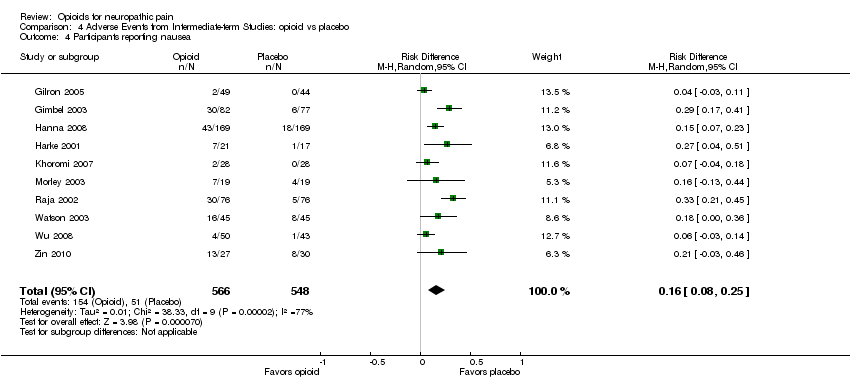
Comparison 4 Adverse Events from Intermediate‐term Studies: opioid vs placebo, Outcome 4 Participants reporting nausea.
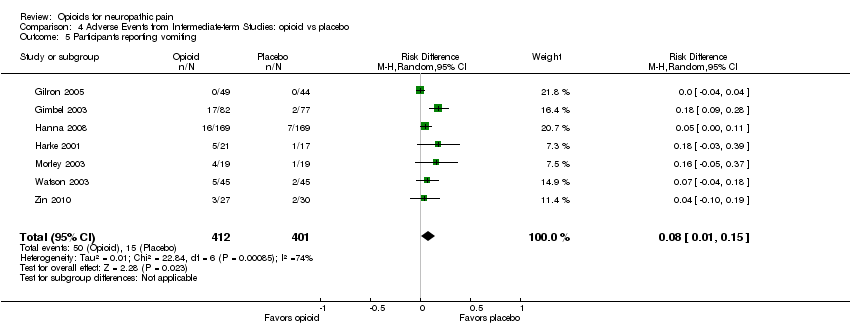
Comparison 4 Adverse Events from Intermediate‐term Studies: opioid vs placebo, Outcome 5 Participants reporting vomiting.

Comparison 4 Adverse Events from Intermediate‐term Studies: opioid vs placebo, Outcome 6 Particpants withdrawing due to adverse events.
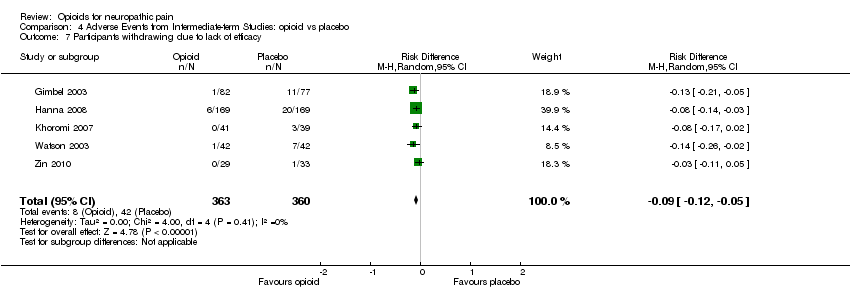
Comparison 4 Adverse Events from Intermediate‐term Studies: opioid vs placebo, Outcome 7 Participants withdrawing due to lack of efficacy.

Comparison 5 Adverse Events from Intermediate‐term Studies: opioid vs active control, Outcome 1 Participants reporting constipation.

Comparison 5 Adverse Events from Intermediate‐term Studies: opioid vs active control, Outcome 2 Participants reporting dizziness.
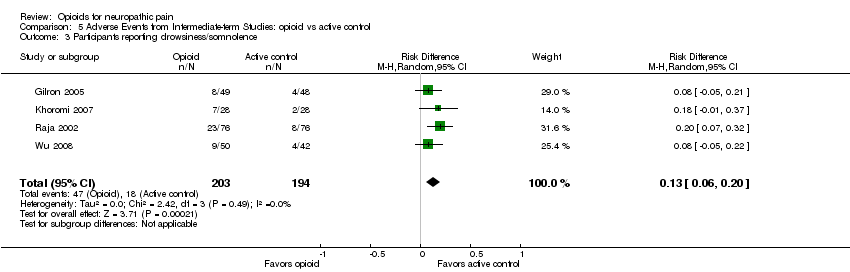
Comparison 5 Adverse Events from Intermediate‐term Studies: opioid vs active control, Outcome 3 Participants reporting drowsiness/somnolence.

Comparison 5 Adverse Events from Intermediate‐term Studies: opioid vs active control, Outcome 4 Participants reporting nausea.
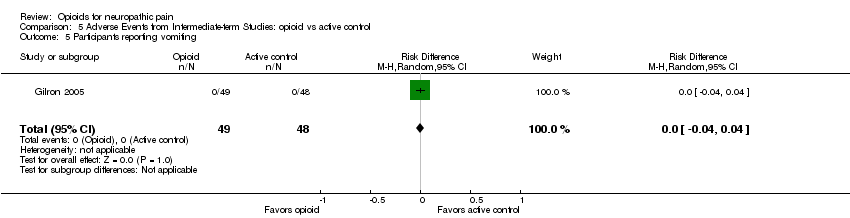
Comparison 5 Adverse Events from Intermediate‐term Studies: opioid vs active control, Outcome 5 Participants reporting vomiting.

Comparison 5 Adverse Events from Intermediate‐term Studies: opioid vs active control, Outcome 6 Participants withdrawing due to adverse events.
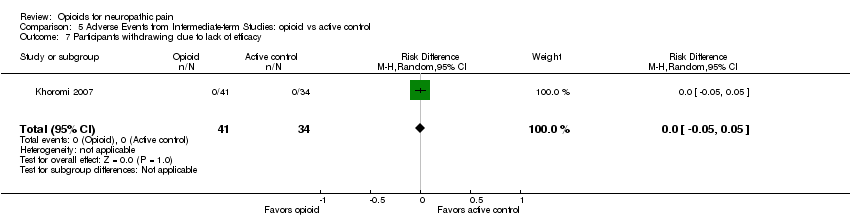
Comparison 5 Adverse Events from Intermediate‐term Studies: opioid vs active control, Outcome 7 Participants withdrawing due to lack of efficacy.
| Outcome or subgroup title | No. of studies | No. of participants | Statistical method | Effect size |
| 1 Pain intensity post‐opioid/placebo Show forest plot | 6 | 180 | Mean Difference (IV, Random, 95% CI) | ‐15.81 [‐22.54, ‐9.07] |
| 1.1 Peripheral Pain | 4 | 138 | Mean Difference (IV, Random, 95% CI) | ‐15.01 [‐22.97, ‐7.06] |
| 1.2 Central Pain | 2 | 42 | Mean Difference (IV, Random, 95% CI) | ‐17.81 [‐30.48, ‐5.15] |
| 2 % Pain reduction post‐opioid/placebo Show forest plot | 2 | 38 | Mean Difference (IV, Random, 95% CI) | 25.78 [16.91, 34.65] |
| Outcome or subgroup title | No. of studies | No. of participants | Statistical method | Effect size |
| 1 Number of participants with at least 33% pain relief Show forest plot | 6 | 727 | Risk Difference (M‐H, Random, 95% CI) | 0.25 [0.13, 0.37] |
| 2 Number of participants with at least 50% pain relief Show forest plot | 5 | 305 | Risk Difference (M‐H, Random, 95% CI) | 0.17 [0.02, 0.33] |
| 3 Pain intensity post‐opioid/placebo Show forest plot | 9 | 725 | Mean Difference (IV, Random, 95% CI) | ‐12.01 [‐15.40, ‐8.62] |
| 4 Evoked pain intensity post‐opioid/placebo Show forest plot | 2 | 148 | Mean Difference (IV, Random, 95% CI) | ‐23.73 [‐34.50, ‐12.96] |
| 5 SF‐36 Health Survey Show forest plot | 2 | Mean Difference (IV, Random, 95% CI) | Subtotals only | |
| 5.1 Physical functioning | 2 | 142 | Mean Difference (IV, Random, 95% CI) | 3.16 [‐5.46, 11.77] |
| 5.2 Role‐physical | 2 | 142 | Mean Difference (IV, Random, 95% CI) | 9.62 [‐7.73, 26.97] |
| 5.3 Bodily pain | 2 | 142 | Mean Difference (IV, Random, 95% CI) | 6.78 [0.08, 13.48] |
| 5.4 General health | 2 | 142 | Mean Difference (IV, Random, 95% CI) | ‐0.62 [‐8.08, 6.85] |
| 5.5 Vitality | 2 | 142 | Mean Difference (IV, Random, 95% CI) | 1.62 [‐5.82, 9.07] |
| 5.6 Social functioning | 2 | 142 | Mean Difference (IV, Random, 95% CI) | 3.40 [‐5.09, 11.88] |
| 5.7 Role‐emotional | 2 | 142 | Mean Difference (IV, Random, 95% CI) | 7.97 [‐5.06, 21.00] |
| 5.8 Mental health | 2 | 142 | Mean Difference (IV, Random, 95% CI) | 3.09 [‐3.05, 9.23] |
| 6 Brief Pain Inventory: Pain Interference items Show forest plot | 2 | Mean Difference (IV, Random, 95% CI) | Subtotals only | |
| 6.1 General activity | 2 | 245 | Mean Difference (IV, Random, 95% CI) | ‐0.91 [‐1.67, ‐0.14] |
| 6.2 Mood | 2 | 245 | Mean Difference (IV, Random, 95% CI) | ‐0.62 [‐1.31, 0.07] |
| 6.3 Walking | 2 | 245 | Mean Difference (IV, Random, 95% CI) | ‐0.54 [‐1.28, 0.20] |
| 6.4 Normal work | 2 | 245 | Mean Difference (IV, Random, 95% CI) | ‐0.82 [‐1.59, ‐0.05] |
| 6.5 Social relations | 2 | 245 | Mean Difference (IV, Random, 95% CI) | ‐0.71 [‐1.25, ‐0.16] |
| 6.6 Sleep | 2 | 245 | Mean Difference (IV, Random, 95% CI) | ‐1.74 [‐2.42, ‐1.06] |
| 6.7 Enjoyment of life | 2 | 245 | Mean Difference (IV, Random, 95% CI) | ‐1.18 [‐1.91, ‐0.44] |
| 7 Beck Depression Inventory Show forest plot | 3 | 273 | Mean Difference (IV, Random, 95% CI) | 0.21 [‐2.29, 2.71] |
| Outcome or subgroup title | No. of studies | No. of participants | Statistical method | Effect size |
| 1 Number of participants with at least 33% pain relief Show forest plot | 3 | 243 | Risk Difference (M‐H, Random, 95% CI) | 0.17 [0.04, 0.31] |
| 1.1 opioid vs gabapentin | 1 | 88 | Risk Difference (M‐H, Random, 95% CI) | 0.18 [‐0.01, 0.37] |
| 1.2 opioid vs tricyclic antidepressant | 1 | 63 | Risk Difference (M‐H, Random, 95% CI) | 0.02 [‐0.22, 0.26] |
| 1.3 opioid vs antiarrythmic | 1 | 92 | Risk Difference (M‐H, Random, 95% CI) | 0.28 [0.08, 0.48] |
| 2 Number of participants with at least 50% pain relief Show forest plot | 2 | 155 | Risk Difference (M‐H, Random, 95% CI) | 0.07 [‐0.20, 0.33] |
| 2.1 opioid vs tricyclic antidepressant | 1 | 63 | Risk Difference (M‐H, Random, 95% CI) | ‐0.07 [‐0.30, 0.15] |
| 2.2 opioid vs antiarrythmic | 1 | 92 | Risk Difference (M‐H, Random, 95% CI) | 0.20 [0.01, 0.39] |
| 3 Pain intensity post‐opioid/active control Show forest plot | 4 | 388 | Mean Difference (IV, Random, 95% CI) | ‐7.19 [‐13.13, ‐1.25] |
| 3.1 opioid vs gabapentin | 1 | 88 | Mean Difference (IV, Random, 95% CI) | ‐5.0 [‐14.40, 4.40] |
| 3.2 opioid vs tricyclic antidepressant | 2 | 208 | Mean Difference (IV, Random, 95% CI) | ‐3.30 [‐13.48, 6.89] |
| 3.3 opioid vs antiarrythmic | 1 | 92 | Mean Difference (IV, Random, 95% CI) | ‐13.0 [‐19.12, ‐6.88] |
| 4 SF‐36 Health Survey Show forest plot | 2 | Mean Difference (IV, Random, 95% CI) | Subtotals only | |
| 4.1 Physical functioning | 2 | 144 | Mean Difference (IV, Random, 95% CI) | ‐5.09 [‐13.81, 3.63] |
| 4.2 Role‐physical | 2 | 144 | Mean Difference (IV, Random, 95% CI) | ‐5.38 [‐19.05, 8.29] |
| 4.3 Bodily pain | 2 | 144 | Mean Difference (IV, Random, 95% CI) | ‐3.11 [‐9.91, 3.70] |
| 4.4 General health | 2 | 144 | Mean Difference (IV, Random, 95% CI) | ‐4.44 [‐11.75, 2.86] |
| 4.5 Vitality | 2 | 144 | Mean Difference (IV, Random, 95% CI) | ‐6.60 [‐13.63, 0.44] |
| 4.6 Social functioning | 2 | 144 | Mean Difference (IV, Random, 95% CI) | ‐6.04 [‐14.44, 2.35] |
| 4.7 Role‐emotional | 2 | 144 | Mean Difference (IV, Random, 95% CI) | ‐6.39 [‐19.37, 6.60] |
| 4.8 Mental health | 2 | 144 | Mean Difference (IV, Random, 95% CI) | ‐6.24 [‐14.06, 1.57] |
| 5 Beck Depression Inventory Show forest plot | 3 | 276 | Mean Difference (IV, Random, 95% CI) | 1.40 [‐0.38, 3.17] |
| 5.1 opioid vs gabapentin | 1 | 88 | Mean Difference (IV, Random, 95% CI) | 0.30 [‐2.46, 3.06] |
| 5.2 opioid vs tricyclic antidepressant | 2 | 188 | Mean Difference (IV, Random, 95% CI) | 2.17 [‐0.14, 4.49] |
| Outcome or subgroup title | No. of studies | No. of participants | Statistical method | Effect size |
| 1 Participants reporting constipation Show forest plot | 10 | 1114 | Risk Difference (M‐H, Random, 95% CI) | 0.25 [0.18, 0.33] |
| 2 Participants reporting dizziness Show forest plot | 10 | 1114 | Risk Difference (M‐H, Fixed, 95% CI) | 0.14 [0.10, 0.18] |
| 3 Participants reporting drowsiness/somnolence Show forest plot | 8 | 738 | Risk Difference (M‐H, Random, 95% CI) | 0.14 [0.03, 0.25] |
| 4 Participants reporting nausea Show forest plot | 10 | 1114 | Risk Difference (M‐H, Random, 95% CI) | 0.16 [0.08, 0.25] |
| 5 Participants reporting vomiting Show forest plot | 7 | 813 | Risk Difference (M‐H, Random, 95% CI) | 0.08 [0.01, 0.15] |
| 6 Particpants withdrawing due to adverse events Show forest plot | 7 | 867 | Risk Difference (M‐H, Random, 95% CI) | 0.08 [0.04, 0.12] |
| 7 Participants withdrawing due to lack of efficacy Show forest plot | 5 | 723 | Risk Difference (M‐H, Random, 95% CI) | ‐0.09 [‐0.12, ‐0.05] |
| Outcome or subgroup title | No. of studies | No. of participants | Statistical method | Effect size |
| 1 Participants reporting constipation Show forest plot | 4 | 397 | Risk Difference (M‐H, Random, 95% CI) | 0.29 [0.21, 0.38] |
| 2 Participants reporting dizziness Show forest plot | 4 | 397 | Risk Difference (M‐H, Random, 95% CI) | ‐0.01 [‐0.05, 0.03] |
| 3 Participants reporting drowsiness/somnolence Show forest plot | 4 | 397 | Risk Difference (M‐H, Random, 95% CI) | 0.13 [0.06, 0.20] |
| 4 Participants reporting nausea Show forest plot | 4 | 393 | Risk Difference (M‐H, Random, 95% CI) | 0.13 [‐0.01, 0.26] |
| 5 Participants reporting vomiting Show forest plot | 1 | 97 | Risk Difference (M‐H, Random, 95% CI) | 0.0 [‐0.04, 0.04] |
| 6 Participants withdrawing due to adverse events Show forest plot | 1 | 75 | Risk Difference (M‐H, Random, 95% CI) | 0.06 [‐0.06, 0.19] |
| 7 Participants withdrawing due to lack of efficacy Show forest plot | 1 | 75 | Risk Difference (M‐H, Random, 95% CI) | 0.0 [‐0.05, 0.05] |