Opioidi za neuropatsku bol
Appendices
Appendix 1. CENTRAL search strategy (pre‐2012)
| #1 | |
| #2 | |
| #3 | |
| #4 | MeSH descriptor Complex Regional Pain Syndromes explode all trees |
| #5 | |
| #6 | |
| #7 | |
| #8 | |
| #9 | |
| #10 | |
| #11 | |
| #12 | |
| #13 | |
| #14 | |
| #15 | |
| #16 | (#1 OR #2 OR #3 OR #4 OR #5 OR #6 OR #7 OR #8 OR #9 OR #10 OR #11 OR #12 OR #13 OR #14 OR #15) |
| #17 | |
| #18 | |
| #19 | |
| #20 | |
| #21 | |
| #22 | (#21)Cochrane Reviews |
| #23 | (#21)Other reviews |
| #24 | (#21)CENTRAL |
Appendix 2. MEDLINE search strategy (pre‐2012)
1. pain.sh.
2. neuralgia.sh.
3. pain, intractable.sh.
4. exp Complex Regional Pain Syndromes/
5. diabetic neuropathies.sh.
6. trigeminal neuralgia.sh.
7. exp somatosensory disorders/
8. (neuropathic adj2 pain).tw.
9. neuralgia.tw.
10. complex regional pain syndrome.tw.
11. reflex sympathetic dystrophy.tw.
12. causalgia.tw.
13. post‐herpetic neuralgia.tw.
14. phantom limb pain.tw.
15. allodynia.tw.
16. 1 or 2 or 3 or 4 or 5 or 6 or 7 or 8 or 9 or 10 or 11 or 12 or 13 or 14 or 15
17. Narcotics/
18. *"Analgesics, Opioid"/
19. (morphine or buprenorphine or codeine or dextromoramide or diphenoxylate or dipipanone or dextropropoxyphene or propoxyphene or diamorphine or dihydrocodeine or alfentanil or fentanyl or remifentanil or meptazinol or methadone or nalbuphine or oxycodone or papaveretum or pentazocine or meperidine or pethidine or phenazocine or hydrocodone or hydromorphone or levorphanol or oxymorphone or butorphanol or dezocine or sufentanil or ketobemidone).mp.
20. 17 or 18 or 19
21. randomized controlled trial.pt.
22. meta‐analysis.pt.
23. controlled‐clinical‐trial.pt.
24. clinical‐trial.pt.
25. random:.ti,ab,sh.
26. (meta‐anal: or metaanaly: or meta analy:).ti,ab,sh.
27. ((doubl: or singl:) and blind:).ti,ab,sh.
28. exp clinical trials/
29. crossover.ti,ab,sh.
30. 21 or 22 or 23 or 24 or 25 or 26 or 27 or 28 or 29
31. Animals/
32. 16 and 20 and 30
33. 32 not 31
[mp=title, original title, abstract, name of substance, mesh subject heading].
Appendix 3. EMBASE search strategy (pre‐2012)
1 PAIN/
2 NEURALGIA/
3 Neuropathic Pain/
4 exp Complex Regional Pain Syndrome/
5 (diabetic adj neuropath$).mp. [mp=title, abstract, subject headings, heading word, drug trade name, original title, device manufacturer, drug manufacturer]
6 Trigeminus Neuralgia/
7 Somatosensory Disorder/
8 (neuropathic adj pain$).mp. [mp=title, abstract, subject headings, heading word, drug trade name, original title, device manufacturer, drug manufacturer]
9 "complex regional pain syndrome$".mp. [mp=title, abstract, subject headings, heading word, drug trade name, original title, device manufacturer, drug manufacturer]
10 neuralgi$.mp. [mp=title, abstract, subject headings, heading word, drug trade name, original title, device manufacturer, drug manufacturer]
11 "reflex sympathetic dystroph$".mp. [mp=title, abstract, subject headings, heading word, drug trade name, original title, device manufacturer, drug manufacturer]
12 causalgi$.mp. [mp=title, abstract, subject headings, heading word, drug trade name, original title, device manufacturer, drug manufacturer]
13 Postherpetic Neuralgia/
14 ("post herpetic neuralgi$" or "post‐herpetic neuralgi$").mp. [mp=title, abstract, subject headings, heading word, drug trade name, original title, device manufacturer, drug manufacturer]
15 Phantom Pain/
16 (phantom adj pain$).mp. [mp=title, abstract, subject headings, heading word, drug trade name, original title, device manufacturer, drug manufacturer]
17 Intractable Pain/
18 (intractable adj pain$).mp. [mp=title, abstract, subject headings, heading word, drug trade name, original title, device manufacturer, drug manufacturer]
19 Allodynia/
20 allodynia.mp. [mp=title, abstract, subject headings, heading word, drug trade name, original title, device manufacturer, drug manufacturer]
21 or/1‐20
22 Narcotic Agent/
23 (narcotic adj agent$).mp. [mp=title, abstract, subject headings, heading word, drug trade name, original title, device manufacturer, drug manufacturer]
24 (analgesic$ adj3 opioid$).mp. [mp=title, abstract, subject headings, heading word, drug trade name, original title, device manufacturer, drug manufacturer]
25 (morphine or buprenorphine or codeine or dextromoramide or diphenoxylate or dipipanone or dextropropoxyphene or propoxyphene or diamorphine or dihydrocodeine or alfentanil or fentanyl or remifentanil or meptazinol or methadone or nalbuphine or oxycodone or papaveretum or pentazocine or meperidine or pethidine or phenazocine or hydrocodone or hydromorphone or levorphanol or oxymorphone or butorphanol or dezocine or sufentanil or ketobemidone).mp.
26 22 or 23 or 24 or 25
27 21 and 26
28 random*.ti,ab.
29 factorial*.ti,ab.
30 (crossover* or cross over* or cross‐over*).ti,ab.
31 placebo*.ti,ab.
32 (doubl* adj blind*).ti,ab.
33 (singl* adj blind*).ti,ab.
34 assign*.ti,ab.
35 allocat*.ti,ab.
36 volunteer*.ti,ab.
37 CROSSOVER PROCEDURE.sh.
38 DOUBLE‐BLIND PROCEDURE.sh.
39 RANDOMIZED CONTROLLED TRIAL.sh.
40 SINGLE BLIND PROCEDURE.sh.
41 or/28‐40
42 ANIMAL/ or NONHUMAN/ or ANIMAL EXPERIMENT/
43 HUMAN/
44 42 and 43
45 42 not 44
46 41 not 45
47 27 and 46
Appendix 4. CENTRAL search strategy 2012
#1 MeSH descriptor: [Pain] this term only
#2 MeSH descriptor: [Neuralgia] this term only
#3 MeSH descriptor: [Pain, Intractable] this term only
#4 MeSH descriptor: [Complex Regional Pain Syndromes] explode all trees
#5 MeSH descriptor: [Diabetic Neuropathies] explode all trees
#6 MeSH descriptor: [Trigeminal Neuralgia] explode all trees
#7 MeSH descriptor: [Somatosensory Disorders] explode all trees
#8 (neuropathic near/2 pain*):ti,ab,kw (Word variations have been searched)
#9 (neuralgia):ti,ab,kw (Word variations have been searched)
#10 (complex regional pain syndrome):ti,ab,kw (Word variations have been searched)
#11 (reflex sympathetic dystrophy):ti,ab,kw (Word variations have been searched)
#12 (causalgia):ti,ab,kw (Word variations have been searched)
#13 (post‐herpetic neuralgia):ti,ab,kw (Word variations have been searched)
#14 (phantom limb pain):ti,ab,kw (Word variations have been searched)
#15 (allodynia):ti,ab,kw (Word variations have been searched)
#16 (#1 or #2 or #3 or #4 or #5 or #6 or #7 or #8 or #9 or #10 or #11 or #12 or #13 or #14 or #15)
#17 MeSH descriptor: [Narcotics] this term only
#18 MeSH descriptor: [Analgesics, Opioid] this term only
#19 (morphine or buprenorphine or codeine or dextromoramide or diphenoxylate or dipipanone or dextropropoxyphene or propoxyphene or diamorphine or dihydrocodeine or alfentanil or fentanyl or remifentanil or meptazinol or methadone or nalbuphine or oxycodone or papaveretum or pentazocine or meperidine or pethidine or phenazocine or hydrocodone or hydromorphone or levorphanol or oxymorphone or butorphanol or dezocine or sufentanil or ketobemidone):ti,ab,kw (Word variations have been searched)
#20 (#17 or #18 or #19)
#21 #16 and #20 from 2010 to 2012
Appendix 5. MEDLINE search strategy 2012
1 Pain/ (103631)
2 neuralgia/ (6938)
3 pain, intractable/ (5344)
4 exp Complex Regional Pain Syndromes/ (4141)
5 diabetic neuropathies/ (11390)
6 trigeminal neuralgia/ (5361)
7 exp somatosensory disorders/ (14530)
8 (neuropathic adj2 pain).tw. (8560)
9 neuralgia.tw. (7586)
10 complex regional pain syndrome.tw. (1303)
11 reflex sympathetic dystrophy.tw. (1481)
12 causalgia.tw. (426)
13 post‐herpetic neuralgia.tw. (486)
14 phantom limb pain.tw. (539)
15 allodynia.tw. (4255)
16 or/1‐15 (148967)
17 Narcotics/ (14099)
18 *"Analgesics, Opioid"/ (17512)
19 (morphine or buprenorphine or codeine or dextromoramide or diphenoxylate or dipipanone or dextropropoxyphene or propoxyphene or diamorphine or dihydrocodeine or alfentanil or fentanyl or remifentanil or meptazinol or methadone or nalbuphine or oxycodone or papaveretum or pentazocine or meperidine or pethidine or phenazocine or hydrocodone or hydromorphone or levorphanol or oxymorphone or butorphanol or dezocine or sufentanil or ketobemidone).tw. (72647)
20 or/17‐19 (87255)
21 randomized controlled trial.pt. (339247)
22 controlled clinical trial.pt. (85403)
23 randomized.ab. (242011)
24 placebo.ab. (135530)
25 drug therapy.fs. (1577150)
26 randomly.ab. (173651)
27 trial.ab. (250716)
28 groups.ab. (1135692)
29 21 or 22 or 23 or 24 or 25 or 26 or 27 or 28 (2936803)
30 exp animals/ not humans.sh. (3795620)
31 29 not 30 (2494786)
32 16 and 20 and 31 (8133)
33 (201008* or 201009* or 201010* or 201011* or 201012* or 2011* or 2012*).ed. (1814643)
34 32 and 33 (1213)
Appendix 6. EMBASE search strategy 2012
1 Pain/ (174379)
2 neuralgia/ (6265)
3 pain, intractable/ (3738)
4 exp Complex Regional Pain Syndromes/ (7151)
5 diabetic neuropathies/ (16484)
6 trigeminal neuralgia/ (8199)
7 exp somatosensory disorders/ (55288)
8 (neuropathic adj2 pain).tw. (13683)
9 neuralgia.tw. (10683)
10 complex regional pain syndrome.tw. (1981)
11 reflex sympathetic dystrophy.tw. (1952)
12 causalgia.tw. (538)
13 post‐herpetic neuralgia.tw. (825)
14 phantom limb pain.tw. (807)
15 allodynia.tw. (6059)
16 or/1‐15 (268307)
17 Narcotics/ (10729)
18 *"Analgesics, Opioid"/ (6948)
19 (morphine or buprenorphine or codeine or dextromoramide or diphenoxylate or dipipanone or dextropropoxyphene or propoxyphene or diamorphine or dihydrocodeine or alfentanil or fentanyl or remifentanil or meptazinol or methadone or nalbuphine or oxycodone or papaveretum or pentazocine or meperidine or pethidine or phenazocine or hydrocodone or hydromorphone or levorphanol or oxymorphone or butorphanol or dezocine or sufentanil or ketobemidone).tw. (98508)
20 or/17‐19 (111821)
21 16 and 20 (17023)
22 random$.tw. (773434)
23 factorial$.tw. (20181)
24 crossover$.tw. (45540)
25 cross over$.tw. (20720)
26 cross‐over$.tw. (20720)
27 placebo$.tw. (186291)
28 (doubl$ adj blind$).tw. (138167)
29 (singl$ adj blind$).tw. (12952)
30 assign$.tw. (215292)
31 allocat$.tw. (72818)
32 volunteer$.tw. (167332)
33 Crossover Procedure/ (35309)
34 double‐blind procedure.tw. (223)
35 Randomized Controlled Trial/ (333591)
36 Single Blind Procedure/ (16539)
37 or/22‐36 (1272131)
38 (animal/ or nonhuman/) not human/ (4520391)
39 37 not 38 (1121112)
40 21 and 39 (3305)
41 (201008* or 201009* or 211010* or 211011* or 201012* or 2011* or 2012*).dd. (2723769)
42 40 and 41 (926)
Appendix 7. Intermediate‐term studies: outcome of treatment
| Study | Diagnosis | Interventions | Outcome
| ||
| Pain Intensity
| Pain Relief
| Functioning/other | |||
| Mixed neuropathic | 1. Dihydrocodeine 2. Nabilone
| Daily VAS 1. BL 58.6 ± 24.1, endpoint not reported 2. BL 59.9 ± 24.4, endpoint not reported
|
| SF36 – significant differences in some subscales HADS ‐NSD
| |
| Diabetic neuropathy | 1. LA morphine 2. Gabapentin 3. Morphine/gabapentin combination 4. Placebo (lorazepam)
| Pain intensity (0 ‐ 10 scale ± SE) at maximum tolerated dose: 3.70 ± 0.34 vs. 4.15 ± 0.33 gabapentin arm vs. 3.06 ± 0.33 combination arm vs. 4.49 ± 0.34 placebo arm (combination lower than morphine arm, P = 0.04, gabapentin arm, p < 0.001, or placebo, P < 0.001. All other comparisons NS). % change in pain intensity greater in combination arm vs. placebo: 20.4%, P = 0.03. All other comparisons NS |
|
| |
| Diabetic neuropathy | 1. LA oxycodone 2. Placebo | VAS: 4.1 ± 0.3 vs 5.3 ± 0.3 NRS (0 ‐ 10) BL ‐ end of treatment 1. 7.9 ± 1.7 – 4.7 ± 2.9 2. 7.8 ± 1.6 ‐ 5.8 ± 2.6
| ≥ 33% reduction in intensity item in NPS: oxycodone 37/82, placebo 20/77. | Satisfaction with medication, sleep quality & 9/14 BPI parameters oxycodone > placebo; Median time to pain < 4: 6 vs. 17 days; % days with mild pain: 47 ± 39 vs 29 ± 37; no difference in RMHI, SIP, SF‐36 | |
| Diabetic neuropathy | 1. LA oxycodone + gabapentin 2. Placebo+ gabapentin | Box scale‐11 pain scores ; PID (BL to end of treatment) 1. 2.1 ± 2.61 2. 1.5 ± 2.38
| Categorical pain relief scale – % good + very good 56% vs. 41% | Sleep Disturbances, SF BPI, MPQ, EuroQol 5D Questionnaire – SSD in favor of oxycodone group. NND Sleep Quality –NSD .NND
| |
| Mixed peripheral | 1. LA morphine 2 Placebo 3. Carbamazepine 4. Placebo | No sig differences between morphine & placebo carbamazepine superior to placebo in NPS and in time without spinal cord stimulator |
|
| |
| Phantom limb | 1. LA morphine 2. Placebo | VAS (0 ‐ 10): 3.3 ± 1.6 vs 4.0 ± 1.2 50% ΔVAS: 42% vs 8% PES sensory: 0.7 ± 0.8 vs 1.7 ± 0.8 PES affective: 0.8 ± 0.6 vs 1.6 ± 0.7 |
| No correlation between ΔVAS and PRSS, Brief Stress Scale or WHYMPI; ‘d2‐test’: 101 ± 19 vs. 106 ± 18 | |
| Chronic lumbar root pain | 1. Morphine 2. nortriptyline 3. Morphine + nortriptyline 4. Placebo | NRS‐average leg pain (0 ‐ 10): BL to end of treatment 1. 4.9 ± 2.4 to 3.4 ±2.8 2. 4.9 ± 2.4 to 3 ± 2.7 3. 4.9 ± 2.4 to 3.4 ± 2.5 4. 4.9 ± 2.4 to 3.7 ± 2.7
NRS‐worst leg pain (0‐10): BL to end of treatment 1. 5.7 ± 2.4 to 4.5 ± 3.1 2. 5.7 ± 2.4 to 3.8 ± 3 3. 5.7 ± 2.4 to 3.8 ± 2.4 4. 5.7 ± 2.4 to 4.6 ± 2.8
| CGPRS (0 ‐ 5) Mod or more pain relief N (%) 1. 13/32 (4%) 2. 12/31 (40%) 3. 18/28 (67%) 4. 11/33 (37%)
| SF36 NSD BDI: BL to end of treatment 1. 8 ± 6.7 to 9.6 ± 8.5 2. 8 ± 6.7 to 7.3 ± 7.1 3. 8 ± 6.7 to 6 ± 5 4. 8 ± 6.7 to 9 ± 8.5
ODI ‐ NSD BDI: BL to end of treatment 1. 30 ± 15 to 25.7 ± 16.5 2. 30 ± 15 to 27.5 ± 16.7 3. 30 ± 15 to 27.4 ± 15.4 4. 30 ± 15 to 30.5 ± 15.9
| |
| Mixed | 1. Methadone low‐dose 2. Placebo 3. Methadone high‐dose 4. Placebo | Low‐dose vs placebo: VAS max : 69 ± 17 vs 74 ± 13 ns VAS ave: 60 ± 20 vs 64 ± 19 ns
High dose vs placebo: VAS max : 64 ± 23 vs 64 ± 27 VAS ave : 58 ± 25 vs 64 ± 22 | Low‐dose vs placebo: VAS : 23 ± 19 vs 15 ± 16 ns
High dose vs placebo: VAS: 32 ± 27 vs 23 ± 21 |
| |
| Postherpetic neuralgia | 1. Morphine or methadone 2. Nortriptyline or desipramine 3. Placebo | VAS: 1. 4.4 ± 2.4 2. 5.1 ± 2.3 3. 6.0 ± 2.0 Both active treatments superior to placebo | %: 1. 38.2 ± 32.2 2. 31.9 ± 30.4 3. 11.2 ± 19.8 Both active treatments superior to placebo | Wechsler Adult Intelligence Scale–Revised slightly worsened with TCA; Sleep improved from baseline with active treatments; All other outcomes unchanged | |
| Mixed neuropathic | 1. Levorphanol high dose 2. Levorphanol low dose | VAS 1. 42.1 ± 26.5 (‐36%) 2. 53.4 ± 24.7 (‐21%) | Categorical pain relief scale ‐ NSD | PMS‐unchanged; SDMT & MPI improved in both groups | |
| Postherpetic neuralgia | 1. LA oxycodone 2. Placebo | Daily VAS: 35 ± 25 vs 54 ± 25 Daily CPS: 1.7 ± 0.7 vs 2.3 ± 0.7 | Daily categorical pain relief scale: 2.9 ± 1.1 vs. 1.9 ± 1.0 | Categorical Disability Scale: 0.3 ± 0.8 vs. 0.7 ± 1.0 Effectiveness scale: 1.8 ± 1.1 vs. 0.7 ± 1.0 POMS & BDI no difference | |
| Diabetic neuropathy | 1. LA oxycodone 2. Placebo | Daily VAS: 26.3 ± 24.7 vs 46.7 ± 26.9 Daily CPS: 1.3 ± 0.9 vs 1.9 ± 0.9 | Categorical pain relief scale: 1.8 ± 1.4 vs. 2.79 ± 1.2 | Overall Pain and Sleep Questionnaire, PDI, SF36 oxycodone superior vs. placebo; NNTB for moderate relief = 2.6 | |
| Post‐amputation Pain | 1.SR Morphine 2.Mexiletine 3.Placebo | Change in overall pain intensity BL ‐ end of treatment; NRS (0 ‐ 10), (95% confidence interval) 1. ‐2.8 (‐3.4 to ‐2.3) 2. ‐1.5 (‐2.2 to ‐0.9) 3. ‐1.4 (‐2.2 to ‐0.6)
| 1. 1. 53% 2. 2. 53% 3. 3. 19%
> 33% PR, N (%) 1.33/50 (66%) 2. 16/42 (38%) 3.19/43 (44%)
> 50% PR, N (%) 1. 23/50 (46%) 2. 11/42 (26%) 3. 13/43 (30%)
| WHYMPI – no differences between groups | |
| Postherpetic Neuralgia
Painful Diabetic Neuropathy | 1. Pregabalin + oxycodone 2. Pregabalin + placebo | VAS (0 ‐ 10) BL‐ end of treatment 1. 6.85 ± 0.3 – 3.59 ± 2.35 2. 6.73 ± 0.29 – 4.03 ± 2.33 | > 50% PR from BL to end of treatment 1. 15/26 (58%) 2. 19/29 (66%) NSD | Sleep Interference Score – NSD; NPS ‐ most subscales NSD; SF36 – most subscales NSD; POMS – NSD; COGNITIVE PERFORMANCE‐TMTB – NSD; PGIC – NSD; CGIC‐ NSD | |
Data are presented as mean ± standard deviation unless specified
ΔVAS = change in VAS from baseline; ‘d2‐test’ = test for attention performance; BDI = Beck Depression Inventory; BL= baseline; BPI = Brief Pain Inventory; CGIC = Clinician global impression of change; CGPRS = Categorical Global Pain Relief Scale; CPS = Categorical Pain Scale; HADS = Hospital Anxiety and Depression Score LA = long‐acting; MPI = Multidimensional Pain Inventory; NND = no numerical data; NPS = Neuropathic Pain scale; ODI = Oswestry Disability Index; PDI = Pain Disability Index; PES = Pain Experience Scale; PGIC = Patient global impression of change; POMS = Profile of Mood States; PR = pain reduction; PRSS = Pain‐Related Self‐Treatment Scale; RMHI = Rand Mental Health Inventory; SA = short acting; SDMT = Symbol‐Digit Modalities Test; SF = Short Form; SF36 = Short Form 36; SIP = Sickness Impact Profile; TCA = tricyclic antidepressants; VAS = visual analog scale; WHYMPI = West Haven‐Yale Multidimensional Pain Inventory
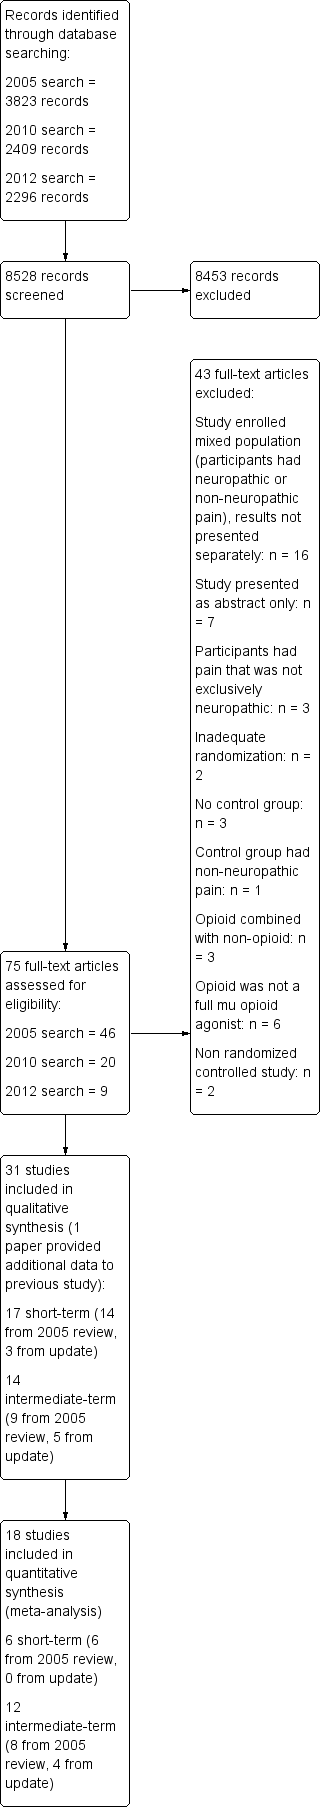
Study flow diagram.
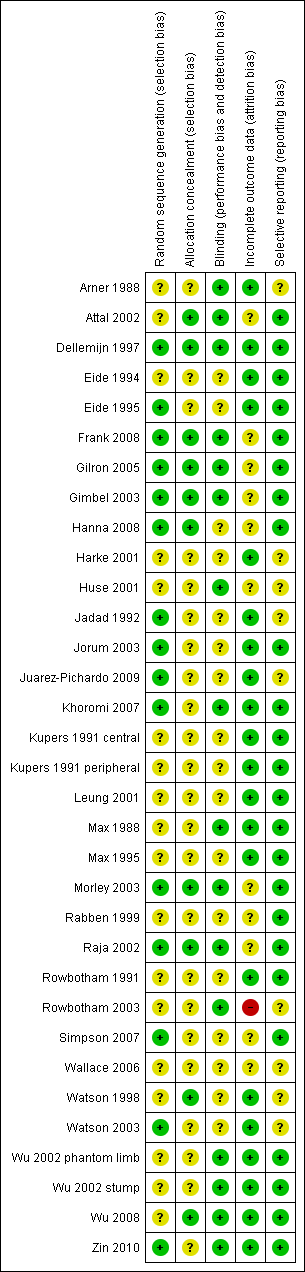
Risk of bias summary: review authors' judgements about each risk of bias item for each included study.
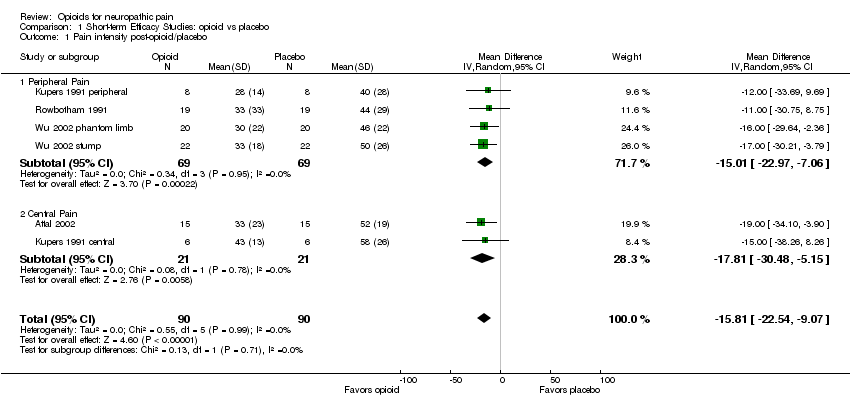
Comparison 1 Short‐term Efficacy Studies: opioid vs placebo, Outcome 1 Pain intensity post‐opioid/placebo.

Comparison 1 Short‐term Efficacy Studies: opioid vs placebo, Outcome 2 % Pain reduction post‐opioid/placebo.

Comparison 2 Intermediate‐term Efficacy Studies: Opioid vs. Placebo, Outcome 1 Number of participants with at least 33% pain relief.

Comparison 2 Intermediate‐term Efficacy Studies: Opioid vs. Placebo, Outcome 2 Number of participants with at least 50% pain relief.
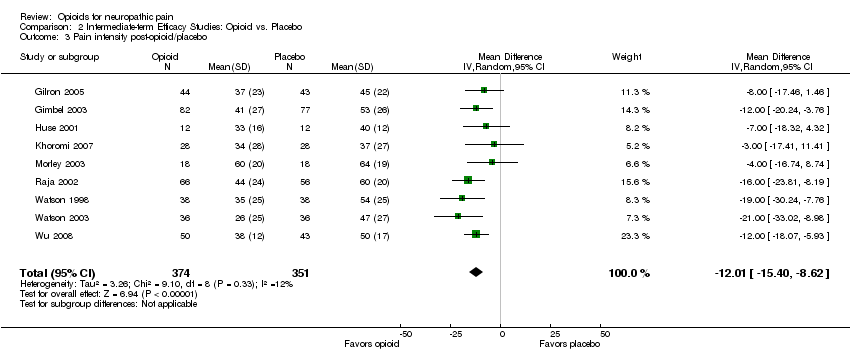
Comparison 2 Intermediate‐term Efficacy Studies: Opioid vs. Placebo, Outcome 3 Pain intensity post‐opioid/placebo.

Comparison 2 Intermediate‐term Efficacy Studies: Opioid vs. Placebo, Outcome 4 Evoked pain intensity post‐opioid/placebo.
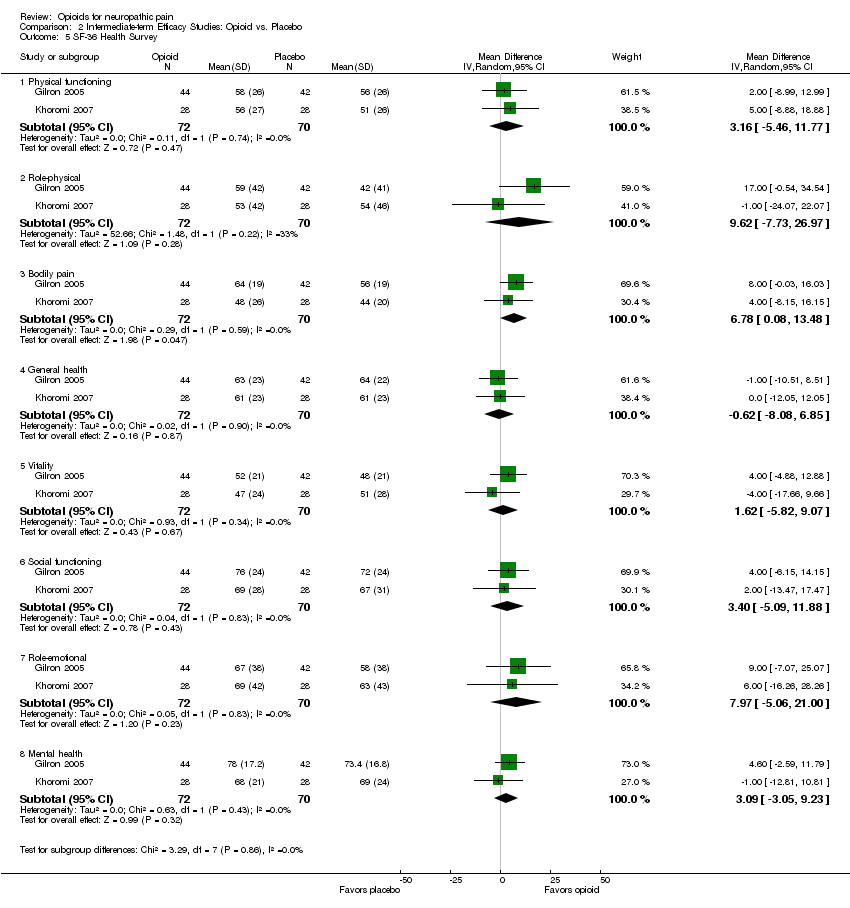
Comparison 2 Intermediate‐term Efficacy Studies: Opioid vs. Placebo, Outcome 5 SF‐36 Health Survey.
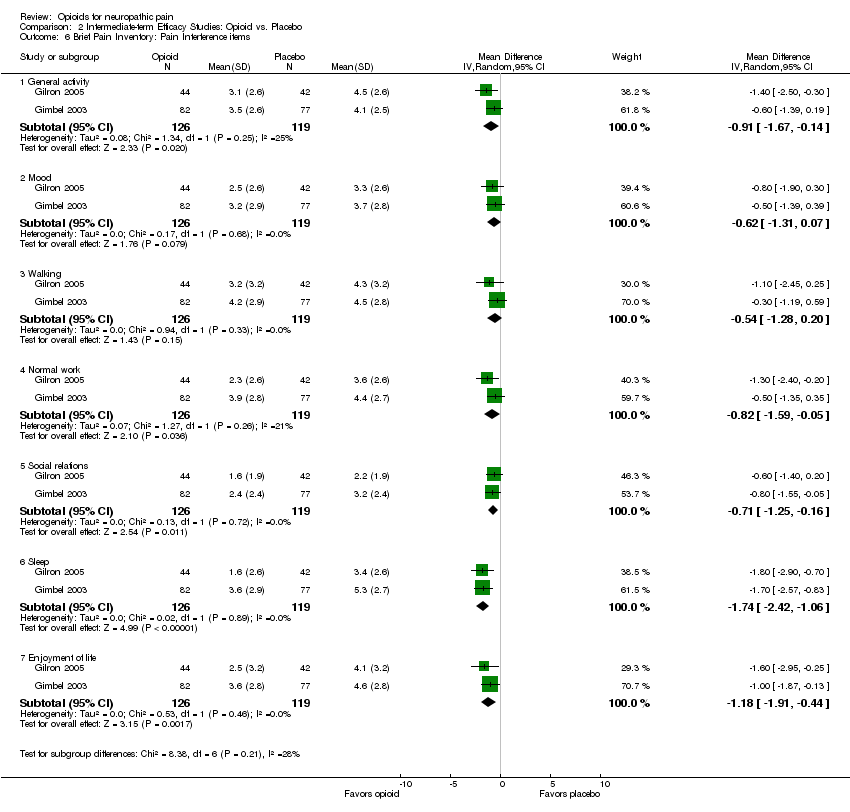
Comparison 2 Intermediate‐term Efficacy Studies: Opioid vs. Placebo, Outcome 6 Brief Pain Inventory: Pain Interference items.
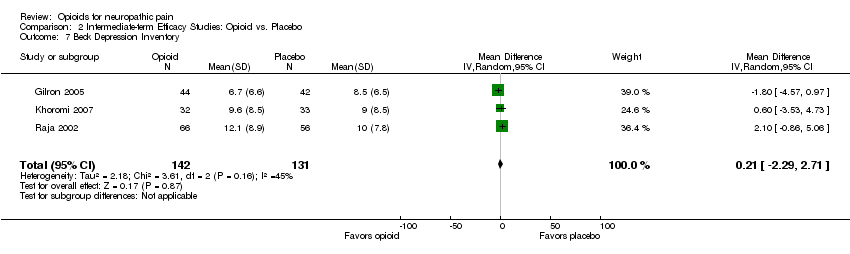
Comparison 2 Intermediate‐term Efficacy Studies: Opioid vs. Placebo, Outcome 7 Beck Depression Inventory.

Comparison 3 Intermediate‐term Efficacy Studies: opioid vs active control, Outcome 1 Number of participants with at least 33% pain relief.
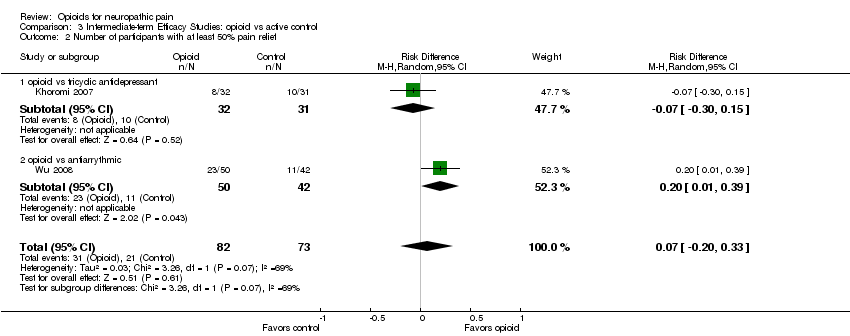
Comparison 3 Intermediate‐term Efficacy Studies: opioid vs active control, Outcome 2 Number of participants with at least 50% pain relief.

Comparison 3 Intermediate‐term Efficacy Studies: opioid vs active control, Outcome 3 Pain intensity post‐opioid/active control.
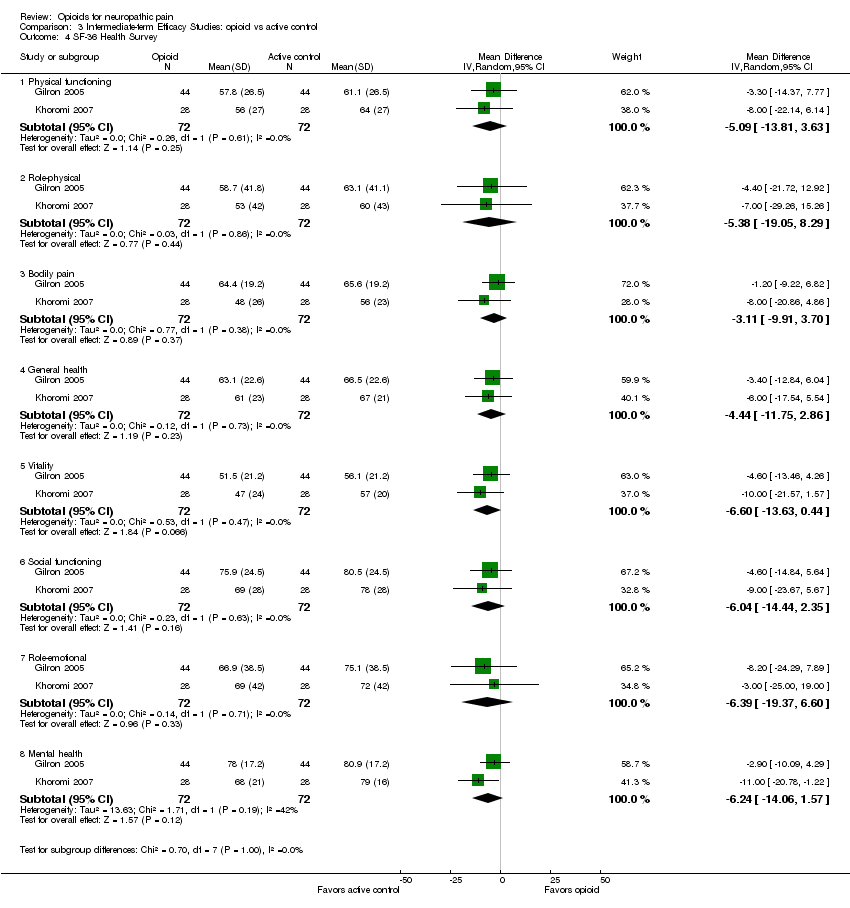
Comparison 3 Intermediate‐term Efficacy Studies: opioid vs active control, Outcome 4 SF‐36 Health Survey.

Comparison 3 Intermediate‐term Efficacy Studies: opioid vs active control, Outcome 5 Beck Depression Inventory.

Comparison 4 Adverse Events from Intermediate‐term Studies: opioid vs placebo, Outcome 1 Participants reporting constipation.

Comparison 4 Adverse Events from Intermediate‐term Studies: opioid vs placebo, Outcome 2 Participants reporting dizziness.

Comparison 4 Adverse Events from Intermediate‐term Studies: opioid vs placebo, Outcome 3 Participants reporting drowsiness/somnolence.
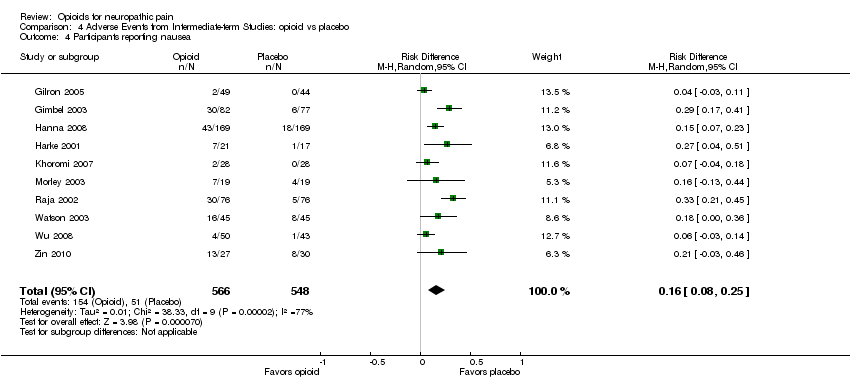
Comparison 4 Adverse Events from Intermediate‐term Studies: opioid vs placebo, Outcome 4 Participants reporting nausea.
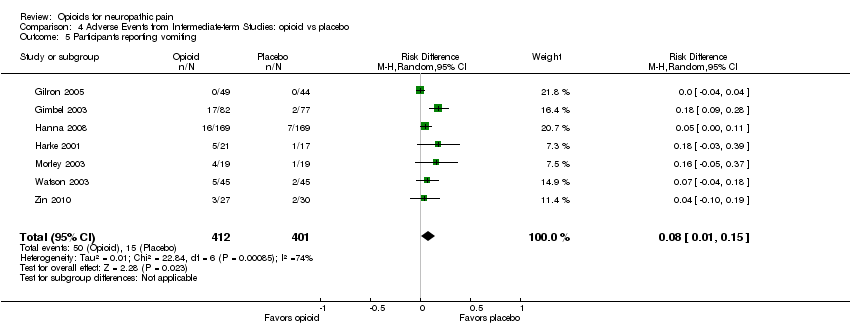
Comparison 4 Adverse Events from Intermediate‐term Studies: opioid vs placebo, Outcome 5 Participants reporting vomiting.

Comparison 4 Adverse Events from Intermediate‐term Studies: opioid vs placebo, Outcome 6 Particpants withdrawing due to adverse events.
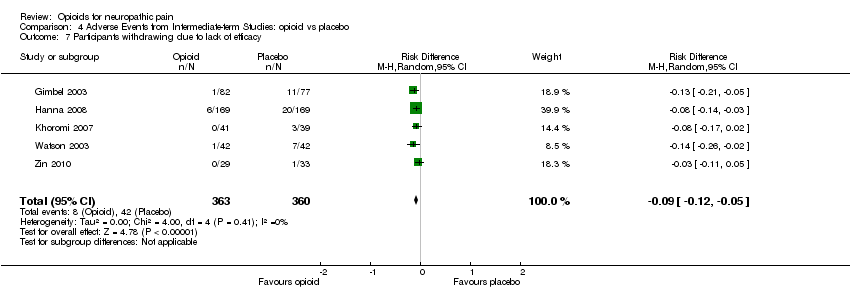
Comparison 4 Adverse Events from Intermediate‐term Studies: opioid vs placebo, Outcome 7 Participants withdrawing due to lack of efficacy.

Comparison 5 Adverse Events from Intermediate‐term Studies: opioid vs active control, Outcome 1 Participants reporting constipation.

Comparison 5 Adverse Events from Intermediate‐term Studies: opioid vs active control, Outcome 2 Participants reporting dizziness.
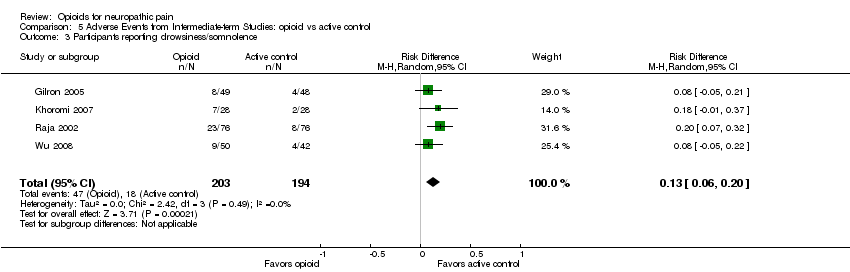
Comparison 5 Adverse Events from Intermediate‐term Studies: opioid vs active control, Outcome 3 Participants reporting drowsiness/somnolence.

Comparison 5 Adverse Events from Intermediate‐term Studies: opioid vs active control, Outcome 4 Participants reporting nausea.
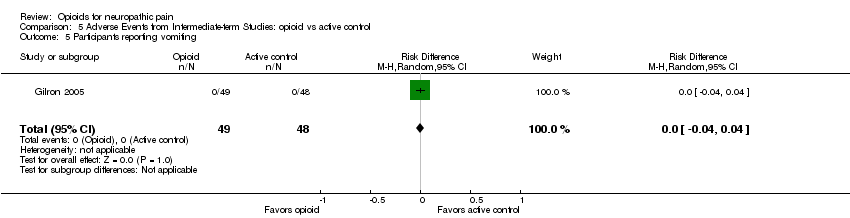
Comparison 5 Adverse Events from Intermediate‐term Studies: opioid vs active control, Outcome 5 Participants reporting vomiting.

Comparison 5 Adverse Events from Intermediate‐term Studies: opioid vs active control, Outcome 6 Participants withdrawing due to adverse events.
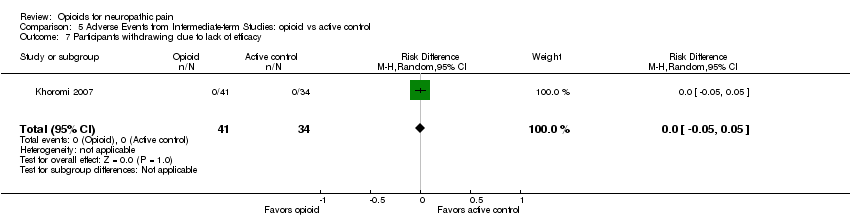
Comparison 5 Adverse Events from Intermediate‐term Studies: opioid vs active control, Outcome 7 Participants withdrawing due to lack of efficacy.
| Outcome or subgroup title | No. of studies | No. of participants | Statistical method | Effect size |
| 1 Pain intensity post‐opioid/placebo Show forest plot | 6 | 180 | Mean Difference (IV, Random, 95% CI) | ‐15.81 [‐22.54, ‐9.07] |
| 1.1 Peripheral Pain | 4 | 138 | Mean Difference (IV, Random, 95% CI) | ‐15.01 [‐22.97, ‐7.06] |
| 1.2 Central Pain | 2 | 42 | Mean Difference (IV, Random, 95% CI) | ‐17.81 [‐30.48, ‐5.15] |
| 2 % Pain reduction post‐opioid/placebo Show forest plot | 2 | 38 | Mean Difference (IV, Random, 95% CI) | 25.78 [16.91, 34.65] |
| Outcome or subgroup title | No. of studies | No. of participants | Statistical method | Effect size |
| 1 Number of participants with at least 33% pain relief Show forest plot | 6 | 727 | Risk Difference (M‐H, Random, 95% CI) | 0.25 [0.13, 0.37] |
| 2 Number of participants with at least 50% pain relief Show forest plot | 5 | 305 | Risk Difference (M‐H, Random, 95% CI) | 0.17 [0.02, 0.33] |
| 3 Pain intensity post‐opioid/placebo Show forest plot | 9 | 725 | Mean Difference (IV, Random, 95% CI) | ‐12.01 [‐15.40, ‐8.62] |
| 4 Evoked pain intensity post‐opioid/placebo Show forest plot | 2 | 148 | Mean Difference (IV, Random, 95% CI) | ‐23.73 [‐34.50, ‐12.96] |
| 5 SF‐36 Health Survey Show forest plot | 2 | Mean Difference (IV, Random, 95% CI) | Subtotals only | |
| 5.1 Physical functioning | 2 | 142 | Mean Difference (IV, Random, 95% CI) | 3.16 [‐5.46, 11.77] |
| 5.2 Role‐physical | 2 | 142 | Mean Difference (IV, Random, 95% CI) | 9.62 [‐7.73, 26.97] |
| 5.3 Bodily pain | 2 | 142 | Mean Difference (IV, Random, 95% CI) | 6.78 [0.08, 13.48] |
| 5.4 General health | 2 | 142 | Mean Difference (IV, Random, 95% CI) | ‐0.62 [‐8.08, 6.85] |
| 5.5 Vitality | 2 | 142 | Mean Difference (IV, Random, 95% CI) | 1.62 [‐5.82, 9.07] |
| 5.6 Social functioning | 2 | 142 | Mean Difference (IV, Random, 95% CI) | 3.40 [‐5.09, 11.88] |
| 5.7 Role‐emotional | 2 | 142 | Mean Difference (IV, Random, 95% CI) | 7.97 [‐5.06, 21.00] |
| 5.8 Mental health | 2 | 142 | Mean Difference (IV, Random, 95% CI) | 3.09 [‐3.05, 9.23] |
| 6 Brief Pain Inventory: Pain Interference items Show forest plot | 2 | Mean Difference (IV, Random, 95% CI) | Subtotals only | |
| 6.1 General activity | 2 | 245 | Mean Difference (IV, Random, 95% CI) | ‐0.91 [‐1.67, ‐0.14] |
| 6.2 Mood | 2 | 245 | Mean Difference (IV, Random, 95% CI) | ‐0.62 [‐1.31, 0.07] |
| 6.3 Walking | 2 | 245 | Mean Difference (IV, Random, 95% CI) | ‐0.54 [‐1.28, 0.20] |
| 6.4 Normal work | 2 | 245 | Mean Difference (IV, Random, 95% CI) | ‐0.82 [‐1.59, ‐0.05] |
| 6.5 Social relations | 2 | 245 | Mean Difference (IV, Random, 95% CI) | ‐0.71 [‐1.25, ‐0.16] |
| 6.6 Sleep | 2 | 245 | Mean Difference (IV, Random, 95% CI) | ‐1.74 [‐2.42, ‐1.06] |
| 6.7 Enjoyment of life | 2 | 245 | Mean Difference (IV, Random, 95% CI) | ‐1.18 [‐1.91, ‐0.44] |
| 7 Beck Depression Inventory Show forest plot | 3 | 273 | Mean Difference (IV, Random, 95% CI) | 0.21 [‐2.29, 2.71] |
| Outcome or subgroup title | No. of studies | No. of participants | Statistical method | Effect size |
| 1 Number of participants with at least 33% pain relief Show forest plot | 3 | 243 | Risk Difference (M‐H, Random, 95% CI) | 0.17 [0.04, 0.31] |
| 1.1 opioid vs gabapentin | 1 | 88 | Risk Difference (M‐H, Random, 95% CI) | 0.18 [‐0.01, 0.37] |
| 1.2 opioid vs tricyclic antidepressant | 1 | 63 | Risk Difference (M‐H, Random, 95% CI) | 0.02 [‐0.22, 0.26] |
| 1.3 opioid vs antiarrythmic | 1 | 92 | Risk Difference (M‐H, Random, 95% CI) | 0.28 [0.08, 0.48] |
| 2 Number of participants with at least 50% pain relief Show forest plot | 2 | 155 | Risk Difference (M‐H, Random, 95% CI) | 0.07 [‐0.20, 0.33] |
| 2.1 opioid vs tricyclic antidepressant | 1 | 63 | Risk Difference (M‐H, Random, 95% CI) | ‐0.07 [‐0.30, 0.15] |
| 2.2 opioid vs antiarrythmic | 1 | 92 | Risk Difference (M‐H, Random, 95% CI) | 0.20 [0.01, 0.39] |
| 3 Pain intensity post‐opioid/active control Show forest plot | 4 | 388 | Mean Difference (IV, Random, 95% CI) | ‐7.19 [‐13.13, ‐1.25] |
| 3.1 opioid vs gabapentin | 1 | 88 | Mean Difference (IV, Random, 95% CI) | ‐5.0 [‐14.40, 4.40] |
| 3.2 opioid vs tricyclic antidepressant | 2 | 208 | Mean Difference (IV, Random, 95% CI) | ‐3.30 [‐13.48, 6.89] |
| 3.3 opioid vs antiarrythmic | 1 | 92 | Mean Difference (IV, Random, 95% CI) | ‐13.0 [‐19.12, ‐6.88] |
| 4 SF‐36 Health Survey Show forest plot | 2 | Mean Difference (IV, Random, 95% CI) | Subtotals only | |
| 4.1 Physical functioning | 2 | 144 | Mean Difference (IV, Random, 95% CI) | ‐5.09 [‐13.81, 3.63] |
| 4.2 Role‐physical | 2 | 144 | Mean Difference (IV, Random, 95% CI) | ‐5.38 [‐19.05, 8.29] |
| 4.3 Bodily pain | 2 | 144 | Mean Difference (IV, Random, 95% CI) | ‐3.11 [‐9.91, 3.70] |
| 4.4 General health | 2 | 144 | Mean Difference (IV, Random, 95% CI) | ‐4.44 [‐11.75, 2.86] |
| 4.5 Vitality | 2 | 144 | Mean Difference (IV, Random, 95% CI) | ‐6.60 [‐13.63, 0.44] |
| 4.6 Social functioning | 2 | 144 | Mean Difference (IV, Random, 95% CI) | ‐6.04 [‐14.44, 2.35] |
| 4.7 Role‐emotional | 2 | 144 | Mean Difference (IV, Random, 95% CI) | ‐6.39 [‐19.37, 6.60] |
| 4.8 Mental health | 2 | 144 | Mean Difference (IV, Random, 95% CI) | ‐6.24 [‐14.06, 1.57] |
| 5 Beck Depression Inventory Show forest plot | 3 | 276 | Mean Difference (IV, Random, 95% CI) | 1.40 [‐0.38, 3.17] |
| 5.1 opioid vs gabapentin | 1 | 88 | Mean Difference (IV, Random, 95% CI) | 0.30 [‐2.46, 3.06] |
| 5.2 opioid vs tricyclic antidepressant | 2 | 188 | Mean Difference (IV, Random, 95% CI) | 2.17 [‐0.14, 4.49] |
| Outcome or subgroup title | No. of studies | No. of participants | Statistical method | Effect size |
| 1 Participants reporting constipation Show forest plot | 10 | 1114 | Risk Difference (M‐H, Random, 95% CI) | 0.25 [0.18, 0.33] |
| 2 Participants reporting dizziness Show forest plot | 10 | 1114 | Risk Difference (M‐H, Fixed, 95% CI) | 0.14 [0.10, 0.18] |
| 3 Participants reporting drowsiness/somnolence Show forest plot | 8 | 738 | Risk Difference (M‐H, Random, 95% CI) | 0.14 [0.03, 0.25] |
| 4 Participants reporting nausea Show forest plot | 10 | 1114 | Risk Difference (M‐H, Random, 95% CI) | 0.16 [0.08, 0.25] |
| 5 Participants reporting vomiting Show forest plot | 7 | 813 | Risk Difference (M‐H, Random, 95% CI) | 0.08 [0.01, 0.15] |
| 6 Particpants withdrawing due to adverse events Show forest plot | 7 | 867 | Risk Difference (M‐H, Random, 95% CI) | 0.08 [0.04, 0.12] |
| 7 Participants withdrawing due to lack of efficacy Show forest plot | 5 | 723 | Risk Difference (M‐H, Random, 95% CI) | ‐0.09 [‐0.12, ‐0.05] |
| Outcome or subgroup title | No. of studies | No. of participants | Statistical method | Effect size |
| 1 Participants reporting constipation Show forest plot | 4 | 397 | Risk Difference (M‐H, Random, 95% CI) | 0.29 [0.21, 0.38] |
| 2 Participants reporting dizziness Show forest plot | 4 | 397 | Risk Difference (M‐H, Random, 95% CI) | ‐0.01 [‐0.05, 0.03] |
| 3 Participants reporting drowsiness/somnolence Show forest plot | 4 | 397 | Risk Difference (M‐H, Random, 95% CI) | 0.13 [0.06, 0.20] |
| 4 Participants reporting nausea Show forest plot | 4 | 393 | Risk Difference (M‐H, Random, 95% CI) | 0.13 [‐0.01, 0.26] |
| 5 Participants reporting vomiting Show forest plot | 1 | 97 | Risk Difference (M‐H, Random, 95% CI) | 0.0 [‐0.04, 0.04] |
| 6 Participants withdrawing due to adverse events Show forest plot | 1 | 75 | Risk Difference (M‐H, Random, 95% CI) | 0.06 [‐0.06, 0.19] |
| 7 Participants withdrawing due to lack of efficacy Show forest plot | 1 | 75 | Risk Difference (M‐H, Random, 95% CI) | 0.0 [‐0.05, 0.05] |