Antihistamínicos H1 para la urticaria espontánea crónica
Información
- DOI:
- https://doi.org/10.1002/14651858.CD006137.pub2Copiar DOI

- Base de datos:
-
- Cochrane Database of Systematic Reviews
- Versión publicada:
-
- 14 noviembre 2014see what's new
- Tipo:
-
- Intervention
- Etapa:
-
- Review
- Grupo Editorial Cochrane:
-
Grupo Cochrane de Piel
- Copyright:
-
- Copyright © 2017 The Cochrane Collaboration. Published by John Wiley & Sons, Ltd.
Cifras del artículo
Altmetric:
Citado por:
Autores
Contributions of authors
Link with editorial base and co‐ordinate contributions from co‐authors, supervision (AS, CB).
Draft protocol (AS, SNC, CC, LB, CH).
Run search (AS, SNC, MS, CB).
Identify relevant titles and abstracts from searches (AS, SNC, MS, CB).
Obtain copies of trials (AS, MS, SNC, CB).
Select trials (AS, SNC, MS, CB, CC).
Extract data from trials (AS, CB, MS, SNC, CC).
Enter data into RevMan (CB, MS, BC).
Carry out data analyses and draft Effects of Interventions section of the review (BC, CB, MS).
Interpret data (BC, CB, MS, SNC).
Draft final review (CB, MS, SNC, BC).
Update review (MS, CB, SNC, BC).
Disclaimer
The views and opinions expressed therein are those of the review authors and do not necessarily reflect those of the National Institute for Health Research (NIHR), the National Health Service (NHS) or the Department of Health, UK.
Sources of support
Internal sources
-
Queen's Medical Centre, UK.
External sources
-
The National Institute for Health Research (NIHR), UK.
The NIHR, UK, is the largest single funder of the Cochrane Skin Group
Declarations of interest
Maulina Sharma: "I have represented the Cochrane Skin Group as a stakeholder for a NICE (National Institute for Health and Care Excellence) scoping workshop for chronic spontaneous urticaria: omalizumab 2014. I have received an honorarium as a speaker for a general practitioner (GP) educational event, which was donated to the charitable funds of the department. I have attended training and continuing medical education (CME) events that may have been sponsored in part by pharmaceutical industry. I have been a subinvestigator for clinical trials conducted in the Department of Dermatology, George Eliot Hospitals NHS Trust, Nuneaton, UK (2005 to 2006), in particular, the CUTE study (NCT00264303). I was not involved in writing of the results and received no payments for my involvement with the clinical trials."
Cathy Bennett: "I am the proprietor of Systematic Research Ltd, a company providing research services; I am an employee of this company and received a consultancy fee for the production of this review. I have also received consultancy fees for other Cochrane reviews and work in evidence‐based medicine."
Stuart N Cohen: Nothing to declare.
Ben Carter: Nothing to declare.
Dr Karsten Weller was a clinical referee: "I received lecture fees or advisory board fees from Novartis, Uriach, FAES, MSD (Essex Pharma), UCB or was involved in clinical studies with drugs from these companies."
Acknowledgements
Many thanks to Dr Gudula Kirtschig and the Cochrane Skin Group for guidance and assistance with this project.
We would also like to thank Dr Chih‐Mei Chen, Dr Amy Stanway, Dr Lynda Binney and Dr Conrad Hauser, who were co‐authors on the protocol for this review.
Dr Jonathan Batchelor, Dr Carsten Flohr, Dr Marcello Di Bonito and Dr Kim Varma provided assistance with translations. Dr Sujoy Ray provided support with data extraction and risk of bias assessments.
We thank the following study investigators, who provided additional details of study results for included trials: Dr Ana Gimenez‐Arneau, Dr Ganesh Dakhale, Dr Gabriele Di Lorenzo, Prof Louis Dubertret, Dr Jean‐Jacques Grob, Dr Sanjeev Handa and Dr Arthur Helbling.
The Cochrane Skin Group editorial base wishes to thank Sam Gibbs, who was the Cochrane Dermatology Editor for this review; Jo Leonardi‐Bee, who was the Statistical Editor; Ching‐Chi Chi, who was Methods Editor; the clinical referees, Clive Grattan and Karsten Weller; and the consumer referee, who wishes to remain anonymous.
Version history
| Published | Title | Stage | Authors | Version |
| 2014 Nov 14 | H1‐antihistamines for chronic spontaneous urticaria | Review | Maulina Sharma, Cathy Bennett, Stuart N Cohen, Ben Carter | |
| 2006 Jul 19 | H1‐antihistamines for chronic urticaria | Protocol | Amy D Stanway, Stuart N Cohen, Chih‐Mei Chen, Conrad Hauser, Lynda Binney | |
Differences between protocol and review
We now use the term chronic spontaneous urticaria.
We changed the wording of the 'Types of participants' criteria to clarify that we mean angio‐oedema without weals rather than angio‐oedema without urticaria, as the latter uses the term ‘urticaria’ as a descriptor rather than a disease. We used 'autoinflammatory syndrome' rather than ‘associated abnormalities,’ as Muckle‐Wells and Schnitzler's syndrome are not urticaria.
We clarified that we have included any first‐generation ('sedating') or second‐generation ('non‐sedating') H1‐antihistamines at any dose (including topical interventions and H2RAs given concomitantly) given as single therapy or as combination therapy. Comparators consisted of no treatment, that is, placebo, or another active (pharmacological) compound. We included studies that compared the same drug but at different doses, but we excluded non‐pharmacological interventions such as acupuncture.
We collected additional data from the reports of studies, such as country and setting, to obtain further information about clinical heterogeneity between our included studies.
We did not carry out subgroup analyses on the basis of first‐generation ('sedating') and second‐generation ('non‐sedating') antihistamines, as included studies with relevant outcome data were too few to allow meaningful comparisons.
We clarified that duration of intervention is categorised as follows: up to two weeks (short‐term) and longer than two weeks up to three months (intermediate‐term). Our analyses are now subgrouped by duration of intervention, as we are not looking for a cure but would like to identify which antihistamine will suppress or give good or excellent response for urticaria immediately and over the longest time.
We excluded studies that investigated the effects of astemizole or terfenadine (withdrawn from use).
We described moderate statistical heterogeneity as > 50% in the protocol, but we revised this in the full review to moderate heterogeneity at I² > 60%.
For some comparisons, we used Fisher's exact test because of the small number of participants,
We had stated that we would use funnel plots when at least three studies were included in the meta‐analysis, but the Cochrane Handbook for Systematic Reviews of Interventions recommends a minimum of 10 studies for sufficient power.
We included in our methods section updated information about assessment of risk of bias using the 'Risk of bias' tool of The Cochrane Collaboration, and details about how we dealt with cross‐over trials are provided in the Unit of analysis issues section.
Notes
We provide brand names as a guide to the consumer and do not endorse any product over another.
Keywords
MeSH
Medical Subject Headings (MeSH) Keywords
Medical Subject Headings Check Words
Humans;
PICO

Study flow diagram.

Risk of bias graph: review authors' judgements about each risk of bias item presented as percentages across all included studies.
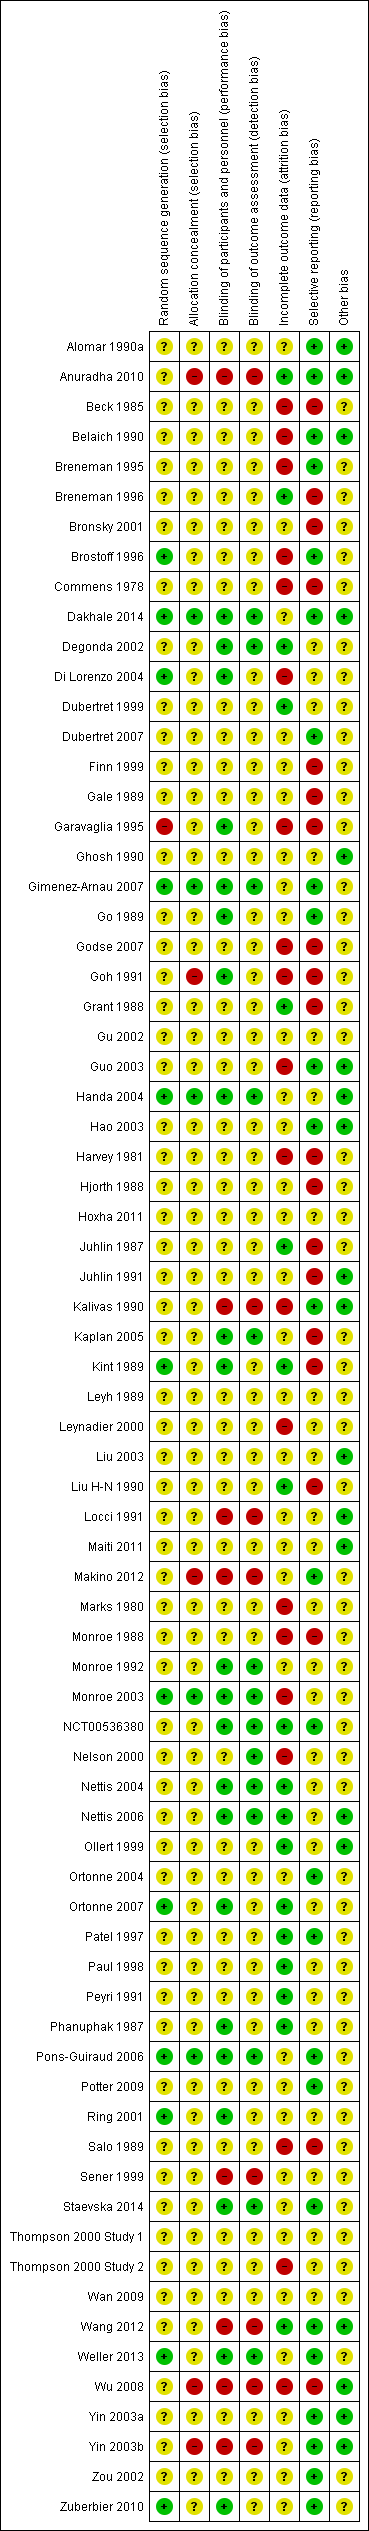
Risk of bias summary: review authors' judgements about each risk of bias item for each included study.

Comparison 1 Loratadine 10 mg versus placebo, Outcome 1 Proportion of participants with 'good' or 'excellent' response whilst taking H1‐antihistamines.

Comparison 2 Loratadine 10 mg versus cetirizine 10 mg, Outcome 1 Proportion of participants with complete suppression of urticaria whilst taking H1‐antihistamines.

Comparison 3 Loratadine 10 mg versus desloratadine 5 mg, Outcome 1 Proportion of participants with complete suppression of urticaria whilst taking H1‐antihistamines.

Comparison 3 Loratadine 10 mg versus desloratadine 5 mg, Outcome 2 Proportion of participants with 'good' or 'excellent' response whilst taking H1‐antihistamines.

Comparison 4 Loratadine 10 mg versus mizolastine 10 mg, Outcome 1 Proportion of participants with complete suppression of urticaria whilst taking H1‐antihistamines.
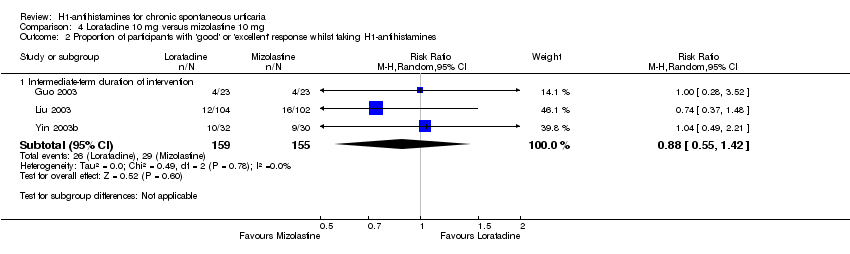
Comparison 4 Loratadine 10 mg versus mizolastine 10 mg, Outcome 2 Proportion of participants with 'good' or 'excellent' response whilst taking H1‐antihistamines.
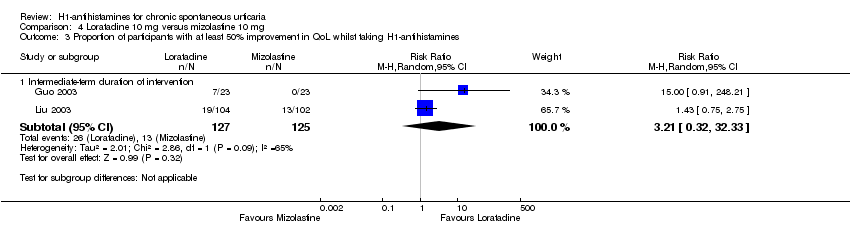
Comparison 4 Loratadine 10 mg versus mizolastine 10 mg, Outcome 3 Proportion of participants with at least 50% improvement in QoL whilst taking H1‐antihistamines.
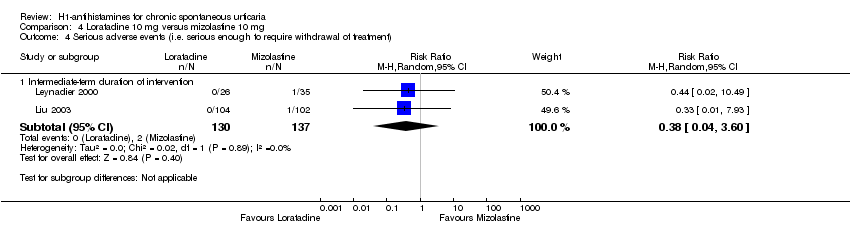
Comparison 4 Loratadine 10 mg versus mizolastine 10 mg, Outcome 4 Serious adverse events (i.e. serious enough to require withdrawal of treatment).
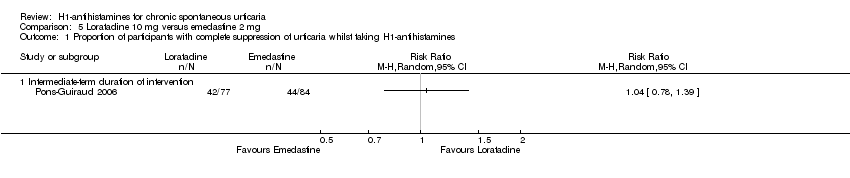
Comparison 5 Loratadine 10 mg versus emedastine 2 mg, Outcome 1 Proportion of participants with complete suppression of urticaria whilst taking H1‐antihistamines.
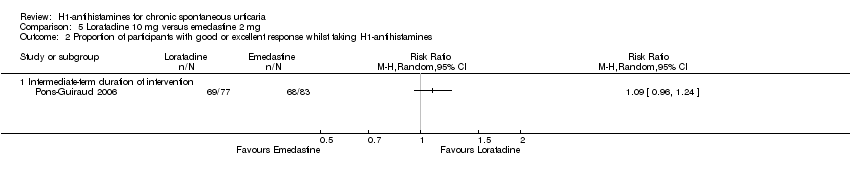
Comparison 5 Loratadine 10 mg versus emedastine 2 mg, Outcome 2 Proportion of participants with good or excellent response whilst taking H1‐antihistamines.
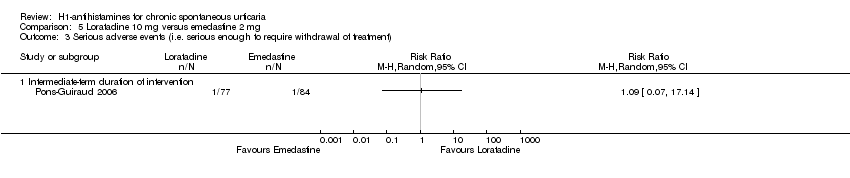
Comparison 5 Loratadine 10 mg versus emedastine 2 mg, Outcome 3 Serious adverse events (i.e. serious enough to require withdrawal of treatment).
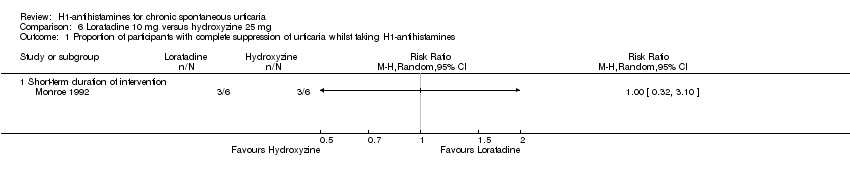
Comparison 6 Loratadine 10 mg versus hydroxyzine 25 mg, Outcome 1 Proportion of participants with complete suppression of urticaria whilst taking H1‐antihistamines.

Comparison 7 Cetirizine 10 to 20 mg versus placebo, Outcome 1 Proportion of participants with complete suppression of urticaria whilst taking H1‐antihistamines.

Comparison 7 Cetirizine 10 to 20 mg versus placebo, Outcome 2 Serious adverse events (i.e. serious enough to require withdrawal of treatment).

Comparison 8 Cetirizine 10 mg versus hydroxyzine 25 mg, Outcome 1 Serious adverse events (i.e. serious enough to require withdrawal of treatment).
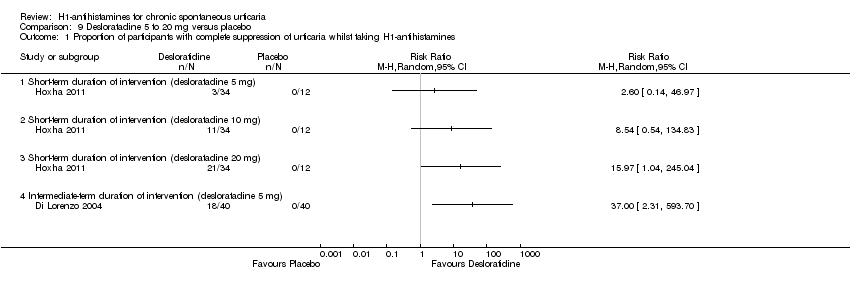
Comparison 9 Desloratadine 5 to 20 mg versus placebo, Outcome 1 Proportion of participants with complete suppression of urticaria whilst taking H1‐antihistamines.

Comparison 9 Desloratadine 5 to 20 mg versus placebo, Outcome 2 Serious adverse events (i.e. serious enough to require withdrawal of treatment).

Comparison 10 Hydroxyzine 25 mg versus placebo, Outcome 1 Serious adverse events (i.e. serious enough to require withdrawal of treatment to withdrawal).

Comparison 11 Levocetirizine 5 to 20 mg versus placebo, Outcome 1 Proportion of participants with complete suppression of urticaria whilst taking H1‐antihistamines.
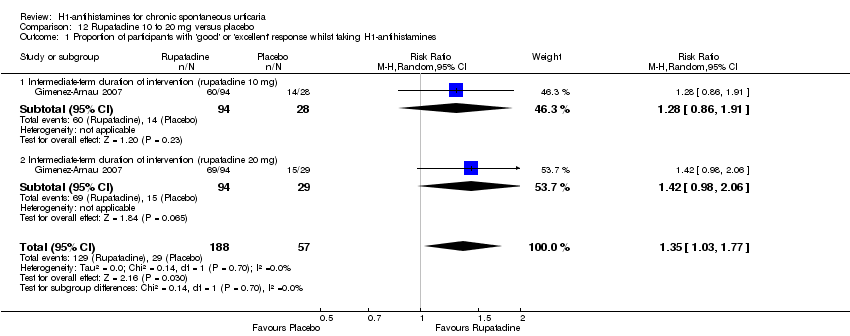
Comparison 12 Rupatadine 10 to 20 mg versus placebo, Outcome 1 Proportion of participants with 'good' or 'excellent' response whilst taking H1‐antihistamines.
| Cetirizine 10 to 20 mg versus placebo for chronic spontaneous urticaria | ||||||
| Patient or population: patients with chronic spontaneous urticaria | ||||||
| Outcomes | Illustrative comparative risks* (95% CI) | Relative effect | Number of participants | Quality of the evidence | Comments | |
| Assumed risk | Corresponding risk | |||||
| Control (placebo) | Cetirizine 10 to 20 mg | |||||
| Complete suppression of urticaria | Study population | RR 2.72 | 178 | ⊕⊕⊝⊝ | Favours cetirizine | |
| 133 per 1000 | 363 per 1000 | |||||
| Moderate | ||||||
| 146 per 1000 | 397 per 1000 | |||||
| Adverse events leading to withdrawal | Study population | RR 3 | 389 | ⊕⊕⊝⊝ | Favours neither intervention nor control | |
| 10 per 1000 | 30 per 1000 | |||||
| Moderate | ||||||
| 14 per 1000 | 42 per 1000 | |||||
| *The basis for the assumed risk (e.g. median control group risk across studies) is provided in footnotes. The corresponding risk (and its 95% confidence interval) is based on the assumed risk in the comparison group and the relative effect of the intervention (and its 95% CI). | ||||||
| GRADE Working Group grades of evidence. | ||||||
| aDesign limitation (risk of bias). | ||||||
| Desloratadine 5 to 20 mg versus placebo for chronic spontaneous urticaria | ||||||
| Patient or population: patients with chronic spontaneous urticaria | ||||||
| Outcomes | Illustrative comparative risks* | Relative effect | Number of participants | Quality of the evidence | Comments | |
| Assumed risk | Corresponding risk | |||||
| Control (placebo) | Desloratadine 5 to 20 mg | |||||
| Complete suppression of urticaria: short‐term duration of intervention (desloratadine 5 mg) | See comment | See comment | Not estimable | 46 | ⊕⊕⊝⊝ | Favours neither intervention nor control Only 1 study, a conference abstract (Hoxha 2011) |
| Complete suppression of urticaria: short‐term duration of intervention (desloratadine 10 mg) | See comment | See comment | Not estimable | 46 | ⊕⊕⊝⊝ | Favours neither intervention nor control Only 1 study, a conference abstract (Hoxha 2011) |
| Complete suppression of urticaria: short‐term duration of intervention (desloratadine 20 mg) | See comment | See comment | Not estimable | 46 | ⊕⊕⊝⊝ | Favours desloratadine Only 1 study, a conference abstract (Hoxha 2011) |
| Complete suppression of urticaria: intermediate‐term duration of intervention (desloratadine 5 mg) | See comment | See comment | Not estimable | 80 | ⊕⊕⊝⊝ | Favours desloratadine Only 1 study (Di Lorenzo 2004) |
| Adverse effects leading to withdrawal: intermediate‐term duration of 5 mg of intervention | Study population | RR 1.46 | 466 | ⊕⊕⊝⊝ | Favours neither intervention nor control | |
| 17 per 1000 | 25 per 1000 | |||||
| Moderate | ||||||
| 18 per 1000 | 26 per 1000 | |||||
| *The basis for the assumed risk (e.g. median control group risk across studies) is provided in footnotes. The corresponding risk (and its 95% confidence interval) is based on the assumed risk in the comparison group and the relative effect of the intervention (and its 95% CI). | ||||||
| GRADE Working Group grades of evidence. | ||||||
| aDesign limitation (risk of bias). | ||||||
| Levocetirizine 5 to 20 mg versus placebo for chronic spontaneous urticaria | ||||||
| Patient or population: patients with chronic spontaneous urticaria | ||||||
| Outcomes | Illustrative comparative risks* | Relative effect | Number of participants | Quality of the evidence | Comments | |
| Assumed risk | Corresponding risk | |||||
| Control (placebo) | Levocetirizine 5 to 20 mg | |||||
| Complete suppression of urticaria: short‐term duration of intervention (levocetirizine 5 mg) | See comment | See comment | Not estimable | 49 | ⊕⊕⊝⊝ | Favours neither intervention nor control Only 1 study, a conference abstract (Hoxha 2011) |
| Complete suppression of urticaria: short‐term duration of intervention (levocetirizine 10 mg) | See comment | See comment | Not estimable | 49 | ⊕⊕⊝⊝ | Favours neither intervention nor control Only 1 study, a conference abstract (Hoxha 2011) |
| Complete suppression of urticaria: short‐term duration of intervention (levocetirizine 20 mg) | See comment | See comment | Not estimable | 49 | ⊕⊕⊝⊝ | Favours levocetirizine Only 1 study, a conference abstract (Hoxha 2011) |
| Complete suppression of urticaria: intermediate‐term duration of intervention (levocetirizine 5 mg) | See comment | See comment | Not estimable | 100 | ⊕⊕⊝⊝ | Favours levocetirizine Only 1 study (Nettis 2006) |
| *The basis for the assumed risk (e.g. median control group risk across studies) is provided in footnotes. The corresponding risk (and its 95% confidence interval) is based on the assumed risk in the comparison group and the relative effect of the intervention (and its 95% CI). | ||||||
| GRADE Working Group grades of evidence. | ||||||
| aDesign limitation (risk of bias). | ||||||
| Rupatadine 10 to 20 mg versus placebo for chronic spontaneous urticaria | ||||||
| Patient or population: patients with chronic spontaneous urticaria | ||||||
| Outcomes | Illustrative comparative risks* (95% CI) | Relative effect | Number of participants | Quality of the evidence | Comments | |
| Assumed risk | Corresponding risk | |||||
| Control (placebo) | Rupatadine 10 to 20 mg | |||||
| Good or excellent response | Study population | RR 1.35 | 245 | ⊕⊕⊝⊝ | Favours rupatadine | |
| 509 per 1000 | 687 per 1000 | |||||
| Moderate | ||||||
| 509 per 1000 | 687 per 1000 | |||||
| *The basis for the assumed risk (e.g. median control group risk across studies) is provided in footnotes. The corresponding risk (and its 95% confidence interval) is based on the assumed risk in the comparison group and the relative effect of the intervention (and its 95% CI). | ||||||
| GRADE Working Group grades of evidence. | ||||||
| aDesign limitation (risk of bias). | ||||||
| Loratadine 10 mg versus placebo for chronic spontaneous urticaria | ||||||
| Patient or population: patients with chronic spontaneous urticaria | ||||||
| Outcomes | Illustrative comparative risks* (95% CI) | Relative effect | Number of participants | Quality of the evidence | Comments | |
| Assumed risk | Corresponding risk | |||||
| Control (placebo) | Loratadine 10 mg | |||||
| Good or excellent response | Study population | RR 1.86 | 124 | ⊕⊕⊝⊝ | Favours neither intervention nor control | |
| 155 per 1000 | 289 per 1000 | |||||
| Moderate | ||||||
| 160 per 1000 | 298 per 1000 | |||||
| *The basis for the assumed risk (e.g. median control group risk across studies) is provided in footnotes. The corresponding risk (and its 95% confidence interval) is based on the assumed risk in the comparison group and the relative effect of the intervention (and its 95% CI). | ||||||
| GRADE Working Group grades of evidence. | ||||||
| aDesign limitation (risk of bias). | ||||||
| Loratadine 10 mg versus cetirizine 10 mg for chronic spontaneous urticaria | ||||||
| Patient or population: patients with chronic spontaneous urticaria | ||||||
| Outcomes | Illustrative comparative risks* (95% CI) | Relative effect | Number of participants | Quality of the evidence | Comments | |
| Assumed risk | Corresponding risk | |||||
| Control (cetirizine 10 mg) | Loratadine 10 mg | |||||
| Complete cessation of urticaria | Study population | RR 1.05 | 103 | ⊕⊕⊝⊝ | Combined short and intermediate‐term duration of intervention. Favours neither intervention nor control | |
| 588 per 1000 | 618 per 1000 | |||||
| Moderate | ||||||
| 574 per 1000 | 603 per 1000 | |||||
| *The basis for the assumed risk (e.g. median control group risk across studies) is provided in footnotes. The corresponding risk (and its 95% confidence interval) is based on the assumed risk in the comparison group and the relative effect of the intervention (and its 95% CI). | ||||||
| GRADE Working Group grades of evidence. | ||||||
| aDesign limitation (risk of bias). | ||||||
| Loratadine 10 mg versus desloratadine 5 mg for chronic spontaneous urticaria | ||||||
| Patient or population: patients with chronic spontaneous urticaria | ||||||
| Outcomes | Illustrative comparative risks* | Relative effect | Number of participants | Quality of the evidence | Comments | |
| Assumed risk | Corresponding risk | |||||
| Control (desloratadine | Loratadine 10 mg | |||||
| Complete suppression of urticaria: intermediate‐term duration of intervention | Study population | RR 0.91 | 369 | ⊕⊕⊝⊝ | Favours neither intervention nor control | |
| 658 per 1000 | 598 per 1000 | |||||
| Moderate | ||||||
| 670 per 1000 | 610 per 1000 | |||||
| Good or excellent response: intermediate‐term duration of intervention | Study population | RR 1.04 | 410 | ⊕⊕⊝⊝ | Favours neither intervention nor control No participants reported a good or excellent response in the loratadine group in Zou 2002 We found low levels of statistical heterogeneity in this analysis I2 = 40%) | |
| 263 per 1000 | 274 per 1000 | |||||
| Moderate | ||||||
| 228 per 1000 | 237 per 1000 | |||||
| *The basis for the assumed risk (e.g. median control group risk across studies) is provided in footnotes. The corresponding risk (and its 95% confidence interval) is based on the assumed risk in the comparison group and the relative effect of the intervention (and its 95% CI). | ||||||
| GRADE Working Group grades of evidence. | ||||||
| aDesign limitation (risk of bias). | ||||||
| Loratadine 10 mg compared to mizolastine 10 mg for chronic spontaneous urticaria | ||||||
| Patient or population: patients with chronic spontaneous urticaria | ||||||
| Outcomes | Illustrative comparative risks* (95% CI) | Relative effect | Number of participants | Quality of the evidence | Comments | |
| Assumed risk | Corresponding risk | |||||
| Control (mizolastine | Loratadine 10 mg | |||||
| Complete cessation of urticaria: intermediate‐term duration of intervention | Study population | RR 0.86 | 316 | ⊕⊝⊝⊝ | Overall, favours neither loratadine nor mizolastine In Guo 2003, more participants in mizolastine group had complete cessation of urticaria than in the other 2 studies (Liu 2003 and Yin 2003b) | |
| 675 per 1000 | 581 per 1000 | |||||
| Moderate | ||||||
| 667 per 1000 | 574 per 1000 | |||||
| Good or excellent response: intermediate‐term duration of intervention | Study population | RR 0.88 | 314 | ⊕⊕⊝⊝ | Favours neither loratadine nor mizolastine | |
| 187 per 1000 | 165 per 1000 | |||||
| Moderate | ||||||
| 174 per 1000 | 153 per 1000 | |||||
| Adverse events leading to withdrawal: intermediate‐term duration of intervention | Study population | RR 0.38 | 267 | ⊕⊕⊝⊝ | Favours neither loratadine nor mizolastine | |
| 15 per 1000 | 6 per 1000 | |||||
| Moderate | ||||||
| 19 per 1000 | 7 per 1000 | |||||
| Proportion of participants with at least 50% improvement in QoL: intermediate‐term duration of intervention | Study population | RR 3.21 | 252 | ⊕⊝⊝⊝ | Favours neither loratadine nor mizolastine No participants in the mizolastine group in Guo 2003 reported at least 50% improvement in QoL | |
| 104 per 1000 | 334 per 1000 | |||||
| Moderate | ||||||
| 64 per 1000 | 205 per 1000 | |||||
| *The basis for the assumed risk (e.g. median control group risk across studies) is provided in footnotes. The corresponding risk (and its 95% confidence interval) is based on the assumed risk in the comparison group and the relative effect of the intervention (and its 95% CI). | ||||||
| GRADE Working Group grades of evidence. | ||||||
| aDesign limitation (risk of bias). | ||||||
| Loratadine 10 mg versus emedastine 2 mg for chronic spontaneous urticaria | ||||||
| Patient or population: patients with chronic spontaneous urticaria | ||||||
| Outcomes | Illustrative comparative risks* (95% CI) | Relative effect | Number of participants | Quality of the evidence | Comments | |
| Assumed risk | Corresponding risk | |||||
| Control (emedastine 2 mg) | Loratadine 10 mg | |||||
| Complete cessation of urticaria: intermediate‐term duration of intervention | Study population | RR 1.04 | 161 | ⊕⊕⊕⊝ | Favours neither loratadine nor emedastine Only 1 study (Pons‐Guiraud 2006) | |
| 524 per 1000 | 545 per 1000 | |||||
| Moderate | ||||||
| 524 per 1000 | 545 per 1000 | |||||
| Good or excellent response: intermediate‐term duration of intervention | Study population | RR 1.09 | 160 | ⊕⊕⊕⊝ | Favours neither loratadine nor emedastine Only 1 study (Pons‐Guiraud 2006) | |
| 819 per 1000 | 893 per 1000 | |||||
| Moderate | ||||||
| 819 per 1000 | 893 per 1000 | |||||
| Adverse events leading to withdrawal: intermediate‐term duration of intervention | Study population | RR 1.09 | 161 | ⊕⊕⊕⊝ | Favours neither loratadine nor emedastine Only 1 study (Pons‐Guiraud 2006) | |
| 12 per 1000 | 13 per 1000 | |||||
| Moderate | ||||||
| 12 per 1000 | 13 per 1000 | |||||
| *The basis for the assumed risk (e.g. median control group risk across studies) is provided in footnotes. The corresponding risk (and its 95% confidence interval) is based on the assumed risk in the comparison group and the relative effect of the intervention (and its 95% CI). | ||||||
| GRADE Working Group grades of evidence. | ||||||
| aRelatively few participants and few events and/or wide confidence intervals. | ||||||
| Loratadine 10 mg versus hydroxyzine 25 mg for chronic spontaneous urticaria | ||||||
| Patient or population: patients with chronic spontaneous urticaria | ||||||
| Outcomes | Illustrative comparative risks* (95% CI) | Relative effect | Number of participants | Quality of the evidence | Comments | |
| Assumed risk | Corresponding risk | |||||
| Control (hydroxyzine 25 mg) | Loratadine 10 mg | |||||
| Complete suppression of urticaria: short‐term duration of intervention | Study population | RR 1 | 12 | ⊕⊕⊝⊝ | Favours neither intervention or control Only 1 study (Monroe 1992) | |
| 500 per 1000 | 500 per 1000 | |||||
| Moderate | ||||||
| 500 per 1000 | 500 per 1000 | |||||
| *The basis for the assumed risk (e.g. median control group risk across studies) is provided in footnotes. The corresponding risk (and its 95% confidence interval) is based on the assumed risk in the comparison group and the relative effect of the intervention (and its 95% CI). | ||||||
| GRADE Working Group grades of evidence. | ||||||
| aDesign limitation (risk of bias). | ||||||
| Cetirizine 10 mg versus hydroxyzine 25 mg for chronic spontaneous urticaria | ||||||
| Patient or population: patients with chronic spontaneous urticaria | ||||||
| Outcomes | Illustrative comparative risks* (95% CI) | Relative effect | Number of participants | Quality of the evidence | Comments | |
| Assumed risk | Corresponding risk | |||||
| Control (hydroxyzine 25 mg) | Cetirizine 10 mg | |||||
| Adverse events leading to withdrawal | Study population | RR 0.78 | 261 | ⊕⊕⊝⊝ | Favours neither cetirizine nor hydroxyzine | |
| 53 per 1000 | 41 per 1000 | |||||
| Moderate | ||||||
| 54 per 1000 | 42 per 1000 | |||||
| *The basis for the assumed risk (e.g. median control group risk across studies) is provided in footnotes. The corresponding risk (and its 95% confidence interval) is based on the assumed risk in the comparison group and the relative effect of the intervention (and its 95% CI). | ||||||
| GRADE Working Group grades of evidence. | ||||||
| aDesign limitation (risk of bias). | ||||||
| Hydroxyzine 25 mg versus placebo for chronic spontaneous urticaria | ||||||
| Patient or population: patients with chronic spontaneous urticaria | ||||||
| Outcomes | Illustrative comparative risks* (95% CI) | Relative effect | Number of participants | Quality of the evidence | Comments | |
| Assumed risk | Corresponding risk | |||||
| Control (placebo) | Hydroxyzine 25 mg | |||||
| Adverse events leading to withdrawal: intermediate‐term duration of intervention | Study population | RR 3.64 | 270 | ⊕⊕⊝⊝ | Favours neither intervention nor control | |
| 14 per 1000 | 53 per 1000 | |||||
| Moderate | ||||||
| 15 per 1000 | 55 per 1000 | |||||
| *The basis for the assumed risk (e.g. median control group risk across studies) is provided in footnotes. The corresponding risk (and its 95% confidence interval) is based on the assumed risk in the comparison group and the relative effect of the intervention (and its 95% CI). | ||||||
| GRADE Working Group grades of evidence. | ||||||
| aDesign limitation (risk of bias). | ||||||
| Outcome or subgroup title | No. of studies | No. of participants | Statistical method | Effect size |
| 1 Proportion of participants with 'good' or 'excellent' response whilst taking H1‐antihistamines Show forest plot | 2 | 124 | Risk Ratio (M‐H, Random, 95% CI) | 1.86 [0.91, 3.79] |
| 1.1 Short‐term duration of intervention (10 mg) | 1 | 12 | Risk Ratio (M‐H, Random, 95% CI) | 3.0 [0.42, 21.30] |
| 1.2 Intermediate‐term duration of intervention (10 mg) | 1 | 112 | Risk Ratio (M‐H, Random, 95% CI) | 1.73 [0.81, 3.72] |
| Outcome or subgroup title | No. of studies | No. of participants | Statistical method | Effect size |
| 1 Proportion of participants with complete suppression of urticaria whilst taking H1‐antihistamines Show forest plot | 2 | 103 | Risk Ratio (M‐H, Random, 95% CI) | 1.05 [0.76, 1.43] |
| 1.1 Short‐term duration of intervention | 1 | 37 | Risk Ratio (M‐H, Random, 95% CI) | 1.13 [0.64, 2.01] |
| 1.2 Intermediate‐term duration of intervention | 1 | 66 | Risk Ratio (M‐H, Random, 95% CI) | 1.01 [0.69, 1.47] |
| Outcome or subgroup title | No. of studies | No. of participants | Statistical method | Effect size |
| 1 Proportion of participants with complete suppression of urticaria whilst taking H1‐antihistamines Show forest plot | 2 | Risk Ratio (M‐H, Random, 95% CI) | Subtotals only | |
| 1.1 Intermediate‐term duration of intervention | 2 | 369 | Risk Ratio (M‐H, Random, 95% CI) | 0.91 [0.78, 1.06] |
| 2 Proportion of participants with 'good' or 'excellent' response whilst taking H1‐antihistamines Show forest plot | 3 | Risk Ratio (M‐H, Random, 95% CI) | Subtotals only | |
| 2.1 Intermediate‐term duration of intervention | 3 | 410 | Risk Ratio (M‐H, Random, 95% CI) | 1.04 [0.64, 1.71] |
| Outcome or subgroup title | No. of studies | No. of participants | Statistical method | Effect size |
| 1 Proportion of participants with complete suppression of urticaria whilst taking H1‐antihistamines Show forest plot | 3 | Risk Ratio (M‐H, Random, 95% CI) | Subtotals only | |
| 1.1 Intermediate‐term duration of intervention | 3 | 316 | Risk Ratio (M‐H, Random, 95% CI) | 0.86 [0.64, 1.16] |
| 2 Proportion of participants with 'good' or 'excellent' response whilst taking H1‐antihistamines Show forest plot | 3 | Risk Ratio (M‐H, Random, 95% CI) | Subtotals only | |
| 2.1 Intermediate‐term duration of intervention | 3 | 314 | Risk Ratio (M‐H, Random, 95% CI) | 0.88 [0.55, 1.42] |
| 3 Proportion of participants with at least 50% improvement in QoL whilst taking H1‐antihistamines Show forest plot | 2 | Risk Ratio (M‐H, Random, 95% CI) | Subtotals only | |
| 3.1 Intermediate‐term duration of intervention | 2 | 252 | Risk Ratio (M‐H, Random, 95% CI) | 3.21 [0.32, 32.33] |
| 4 Serious adverse events (i.e. serious enough to require withdrawal of treatment) Show forest plot | 2 | Risk Ratio (M‐H, Random, 95% CI) | Subtotals only | |
| 4.1 Intermediate‐term duration of intervention | 2 | 267 | Risk Ratio (M‐H, Random, 95% CI) | 0.38 [0.04, 3.60] |
| Outcome or subgroup title | No. of studies | No. of participants | Statistical method | Effect size |
| 1 Proportion of participants with complete suppression of urticaria whilst taking H1‐antihistamines Show forest plot | 1 | Risk Ratio (M‐H, Random, 95% CI) | Totals not selected | |
| 1.1 Intermediate‐term duration of intervention | 1 | Risk Ratio (M‐H, Random, 95% CI) | 0.0 [0.0, 0.0] | |
| 2 Proportion of participants with good or excellent response whilst taking H1‐antihistamines Show forest plot | 1 | Risk Ratio (M‐H, Random, 95% CI) | Totals not selected | |
| 2.1 Intermediate‐term duration of intervention | 1 | Risk Ratio (M‐H, Random, 95% CI) | 0.0 [0.0, 0.0] | |
| 3 Serious adverse events (i.e. serious enough to require withdrawal of treatment) Show forest plot | 1 | Risk Ratio (M‐H, Random, 95% CI) | Totals not selected | |
| 3.1 Intermediate‐term duration of intervention | 1 | Risk Ratio (M‐H, Random, 95% CI) | 0.0 [0.0, 0.0] | |
| Outcome or subgroup title | No. of studies | No. of participants | Statistical method | Effect size |
| 1 Proportion of participants with complete suppression of urticaria whilst taking H1‐antihistamines Show forest plot | 1 | Risk Ratio (M‐H, Random, 95% CI) | Totals not selected | |
| 1.1 Short‐term duration of intervention | 1 | Risk Ratio (M‐H, Random, 95% CI) | 0.0 [0.0, 0.0] | |
| Outcome or subgroup title | No. of studies | No. of participants | Statistical method | Effect size |
| 1 Proportion of participants with complete suppression of urticaria whilst taking H1‐antihistamines Show forest plot | 2 | 178 | Risk Ratio (M‐H, Random, 95% CI) | 2.72 [1.51, 4.91] |
| 1.1 Short‐term duration of intervention (cetirizine 10 mg) | 1 | 56 | Risk Ratio (M‐H, Random, 95% CI) | 2.8 [1.17, 6.73] |
| 1.2 Intermediate‐term duration of intervention (cetirizine 10 mg) | 1 | 122 | Risk Ratio (M‐H, Random, 95% CI) | 2.66 [1.20, 5.90] |
| 2 Serious adverse events (i.e. serious enough to require withdrawal of treatment) Show forest plot | 3 | 389 | Risk Ratio (M‐H, Random, 95% CI) | 3.00 [0.68, 13.22] |
| 2.1 Intermediate‐term duration of intervention (cetirizine 10 mg) | 2 | 247 | Risk Ratio (M‐H, Random, 95% CI) | 4.60 [0.79, 26.67] |
| 2.2 Intermediate‐term duration of intervention (cetirizine 10 to 20 mg) | 1 | 142 | Risk Ratio (M‐H, Random, 95% CI) | 1.06 [0.07, 16.59] |
| Outcome or subgroup title | No. of studies | No. of participants | Statistical method | Effect size |
| 1 Serious adverse events (i.e. serious enough to require withdrawal of treatment) Show forest plot | 2 | 261 | Risk Ratio (M‐H, Random, 95% CI) | 0.78 [0.25, 2.45] |
| 1.1 Intermediate‐term duration of intervention (cetirizine 10 mg) | 1 | 123 | Risk Ratio (M‐H, Random, 95% CI) | 1.05 [0.27, 4.01] |
| 1.2 Intermediate‐term duration of intervention (cetirizine 5 to 25 mg) | 1 | 138 | Risk Ratio (M‐H, Random, 95% CI) | 0.33 [0.04, 3.13] |
| Outcome or subgroup title | No. of studies | No. of participants | Statistical method | Effect size |
| 1 Proportion of participants with complete suppression of urticaria whilst taking H1‐antihistamines Show forest plot | 2 | Risk Ratio (M‐H, Random, 95% CI) | Totals not selected | |
| 1.1 Short‐term duration of intervention (desloratadine 5 mg) | 1 | Risk Ratio (M‐H, Random, 95% CI) | 0.0 [0.0, 0.0] | |
| 1.2 Short‐term duration of intervention (desloratadine 10 mg) | 1 | Risk Ratio (M‐H, Random, 95% CI) | 0.0 [0.0, 0.0] | |
| 1.3 Short‐term duration of intervention (desloratadine 20 mg) | 1 | Risk Ratio (M‐H, Random, 95% CI) | 0.0 [0.0, 0.0] | |
| 1.4 Intermediate‐term duration of intervention (desloratadine 5 mg) | 1 | Risk Ratio (M‐H, Random, 95% CI) | 0.0 [0.0, 0.0] | |
| 2 Serious adverse events (i.e. serious enough to require withdrawal of treatment) Show forest plot | 3 | Risk Ratio (M‐H, Random, 95% CI) | Subtotals only | |
| 2.1 Intermediate‐term duration of 5 mg of intervention | 3 | 466 | Risk Ratio (M‐H, Random, 95% CI) | 1.46 [0.42, 5.10] |
| Outcome or subgroup title | No. of studies | No. of participants | Statistical method | Effect size |
| 1 Serious adverse events (i.e. serious enough to require withdrawal of treatment to withdrawal) Show forest plot | 2 | Risk Ratio (M‐H, Random, 95% CI) | Subtotals only | |
| 1.1 Intermediate‐term duration of intervention | 2 | 270 | Risk Ratio (M‐H, Random, 95% CI) | 3.64 [0.77, 17.23] |
| Outcome or subgroup title | No. of studies | No. of participants | Statistical method | Effect size |
| 1 Proportion of participants with complete suppression of urticaria whilst taking H1‐antihistamines Show forest plot | 2 | Risk Ratio (M‐H, Random, 95% CI) | Totals not selected | |
| 1.1 Short‐term duration of intervention (levocetirizine 5 mg) | 1 | Risk Ratio (M‐H, Random, 95% CI) | 0.0 [0.0, 0.0] | |
| 1.2 Short‐term duration of intervention (levocetirizine 10 mg) | 1 | Risk Ratio (M‐H, Random, 95% CI) | 0.0 [0.0, 0.0] | |
| 1.3 Short‐term duration of intervention (levocetirizine 20 mg) | 1 | Risk Ratio (M‐H, Random, 95% CI) | 0.0 [0.0, 0.0] | |
| 1.4 Intermediate‐term duration of intervention (levocetirizine 5 mg) | 1 | Risk Ratio (M‐H, Random, 95% CI) | 0.0 [0.0, 0.0] | |
| Outcome or subgroup title | No. of studies | No. of participants | Statistical method | Effect size |
| 1 Proportion of participants with 'good' or 'excellent' response whilst taking H1‐antihistamines Show forest plot | 1 | 245 | Risk Ratio (M‐H, Random, 95% CI) | 1.35 [1.03, 1.77] |
| 1.1 Intermediate‐term duration of intervention (rupatadine 10 mg) | 1 | 122 | Risk Ratio (M‐H, Random, 95% CI) | 1.28 [0.86, 1.91] |
| 1.2 Intermediate‐term duration of intervention (rupatadine 20 mg) | 1 | 123 | Risk Ratio (M‐H, Random, 95% CI) | 1.42 [0.98, 2.06] |