H1‐antihistamines for chronic spontaneous urticaria
Abstract
Background
Chronic spontaneous urticaria (CSU) is characterised by the development of crops of red, itchy, raised weals or hives with no identifiable external cause.
Objectives
To assess the effects of H1‐antihistamines for CSU.
Search methods
We searched the following databases up to June 2014: Cochrane Skin Group Specialised Register, CENTRAL (2014, Issue 5), MEDLINE (from 1946), EMBASE (from 1974) and PsycINFO (from 1806). We searched five trials registers and checked articles for references to relevant randomised controlled trials.
Selection criteria
We included randomised controlled trials of H1‐antihistamines for CSU. Interventions included single therapy or a combination of H1‐antihistamines compared with no treatment (placebo) or another active pharmacological compound at any dose.
Data collection and analysis
We used standard methodological procedures as expected by The Cochrane Collaboration.
Our primary outcome measures were proportion of participants with complete suppression of urticaria: 'good or excellent' response, 50% or greater improvement in quality of life measures, and adverse events. We present risk ratios (RR) with 95% confidence intervals (CIs).
Main results
We identified 73 studies (9759 participants); 34 studies provided data for 23 comparisons. The duration of the intervention was up to two weeks (short‐term) or longer than two weeks and up to three months (intermediate‐term).
Cetirizine 10 mg once daily in the short term and in the intermediate term led to complete suppression of urticaria by more participants than was seen with placebo (RR 2.72, 95% CI 1.51 to 4.91). For this same outcome, comparison of desloratadine versus placebo in the intermediate term (5 mg) (RR 37.00, 95% CI 2.31 to 593.70) and in the short term (20 mg) (RR 15.97, 95% CI 1.04 to 245.04) favoured desloratadine, but no differences were seen between 5 mg and 10 mg for short‐term treatment.
Levocetirizine 20 mg per day (short‐term) was more effective for complete suppression of urticaria compared with placebo (RR 20.87, 95% CI 1.37 to 317.60), and at 5 mg was effective in the intermediate term (RR 52.88, 95% CI 3.31 to 843.81) but not in the short term, nor was 10 mg effective in the short term.
Rupatadine at 10 mg and 20 mg in the intermediate term achieved a 'good or excellent response' compared with placebo (RR 1.35, 95% CI 1.03 to 1.77).
Loratadine (10 mg) versus placebo (RR 1.86, 95% CI 0.91 to 3.79) and loratadine (10 mg) versus cetirizine (10 mg) (RR 1.05, 95% CI 0.76 to 1.43) over short‐term and intermediate‐term treatment showed no significant difference for 'good or excellent response' or for complete suppression of urticaria, respectively.
Loratadine (10 mg) versus desloratadine (5 mg) (intermediate‐term) showed no statistically significant difference for complete suppression of urticaria (RR 0.91, 95% CI 0.78 to 1.06) or for 'good or excellent response' (RR 1.04, 95% CI 0.64 to 1.71). For loratadine (10 mg) versus mizolastine (10 mg) (intermediate‐term), no statistically significant difference was seen for complete suppression of urticaria (RR 0.86, 95% CI 0.64 to 1.16) or for 'good or excellent response' (RR 0.88, 95% CI 0.55 to 1.42).
Loratadine (10 mg) versus emedastine (2 mg) (intermediate‐term) showed no statistically significant difference for complete suppression (RR 1.04, 95% CI 0.78 to 1.39) or for 'good or excellent response' (RR 1.09, 95% CI 0.96 to 1.24); the quality of the evidence was moderate for this comparison.
No difference in short‐term treatment was noted between loratadine (10 mg) and hydroxyzine (25 mg) in terms of complete suppression (RR 1.00, 95% CI 0.32 to 3.10).
When desloratadine (5 to 20 mg) was compared with levocetirizine (5 to 20 mg), levocetirizine appeared to be the more effective (P value < 0.02).
In a comparison of fexofenadine versus cetirizine, more participants in the cetirizine group showed complete suppression of urticaria (P value < 0.001).
Adverse events leading to withdrawals were not significantly different in the following comparisons: cetirizine versus placebo at 10 mg and 20 mg (RR 3.00, 95% CI 0.68 to 13.22); desloratadine 5 mg versus placebo (RR 1.46, 95% CI 0.42 to 5.10); loratadine 10 mg versus mizolastine 10 mg (RR 0.38, 95% CI 0.04 to 3.60); loratadine 10 mg versus emedastine 2 mg (RR 1.09, 95% CI 0.07 to 17.14); cetirizine 10 mg versus hydroxyzine 25 mg (RR 0.78, 95% CI 0.25 to 2.45); and hydroxyzine 25 mg versus placebo (RR 3.64, 95% CI 0.77 to 17.23), all intermediate term.
No difference was seen between loratadine 10 mg versus mizolastine 10 mg in the proportion of participants with at least 50% improvement in quality of life (RR 3.21, 95% CI 0.32 to 32.33).
Authors' conclusions
Although the results of our review indicate that at standard doses of treatment, several antihistamines are effective when compared with placebo, all results were gathered from a few studies or, in some cases, from single‐study estimates. The quality of the evidence was affected by the small number of studies in each comparison and the small sample size for many of the outcomes, prompting us to downgrade the quality of evidence for imprecision (unless stated for each comparison, the quality of the evidence was low).
No single H1‐antihistamine stands out as most effective. Cetirizine at 10 mg once daily in the short term and in the intermediate term was found to be effective in completely suppressing urticaria. Evidence is limited for desloratadine given at 5 mg once daily in the intermediate term and at 20 mg in the short term. Levocetirizine at 5 mg in the intermediate but not short term was effective for complete suppression. Levocetirizine 20 mg was effective in the short term, but 10 mg was not. No difference in rates of withdrawal due to adverse events was noted between active and placebo groups. Evidence for improvement in quality of life was insufficient.
PICO
Plain language summary
H1‐antihistamines for chronic spontaneous urticaria
Background
Chronic spontaneous urticaria (CSU) is a condition characterised by a rash of red itchy raised weals or hives, which appear for no identifiable reason. Other names include chronic idiopathic or chronic ordinary urticaria. 'Spontaneous' differentiates this type of urticaria from 'inducible' or 'physical' urticaria, for which there are specific triggers such as cold or pressure. 'Chronic' indicates that the condition has continued for at least six weeks. Hives may be intensely itchy, and the appearance may be unsightly and distressing to sufferers. In some cases, hives can be accompanied by deeper swelling, known as angio‐oedema, which is most common around the eyes and mouth.
Antihistamine drugs, specifically H1 antihistamines, are the mainstay of treatment for urticaria, although they control the condition rather than cure it. Many antihistamines are available to buy without a prescription, including brand names such as Clarityn, Piriton, Zirtek, Benadryl and Phenergan (brand names may differ by country).
Review question
Which H1‐antihistamines are effective and safe for CSU?
Study characteristics
We included 73 randomised controlled trials, with 9759 participants of all ages and looked for complete suppression of urticaria. The duration of the intervention was up to two weeks (short‐term) or longer than two weeks and up to three months (intermediate‐term).
Key results
We investigated clinical trials in which one therapy was compared against another or against placebo (direct comparisons). We found that for general use, 10 mg once daily of cetirizine for short‐term and intermediate‐term duration was effective in completely suppressing urticaria, although not in all individuals. Some benefit may be associated with use of desloratadine at 5 mg for at least an intermediate term and at 20 mg in the short term. Levocetirizine at 5 mg was effective for complete suppression in the intermediate term but not in the short term. A higher dose of 20 mg was effective in the short term, but 10 mg was not.
Adverse events, such as headache or dry mouth, are tolerable with most antihistamines. Evidence is less clear for improvement in quality of life (e.g. reduction in sleep disturbance from itching, less distress from the appearance of hives) as many studies did not address this.
We cannot say whether one antihistamine works better than all the rest, as we did not have head‐to‐head evidence for every possible treatment comparison.
Quality of the evidence
The overall quality of the evidence found for most outcomes was low. Further well‐designed and carefully reported comparative studies are required, if we are to find out how well these medicines work, and if any adverse effects are reported, especially over periods of up to several months.
Authors' conclusions
Summary of findings
| Cetirizine 10 to 20 mg versus placebo for chronic spontaneous urticaria | ||||||
| Patient or population: patients with chronic spontaneous urticaria | ||||||
| Outcomes | Illustrative comparative risks* (95% CI) | Relative effect | Number of participants | Quality of the evidence | Comments | |
| Assumed risk | Corresponding risk | |||||
| Control (placebo) | Cetirizine 10 to 20 mg | |||||
| Complete suppression of urticaria | Study population | RR 2.72 | 178 | ⊕⊕⊝⊝ | Favours cetirizine | |
| 133 per 1000 | 363 per 1000 | |||||
| Moderate | ||||||
| 146 per 1000 | 397 per 1000 | |||||
| Adverse events leading to withdrawal | Study population | RR 3 | 389 | ⊕⊕⊝⊝ | Favours neither intervention nor control | |
| 10 per 1000 | 30 per 1000 | |||||
| Moderate | ||||||
| 14 per 1000 | 42 per 1000 | |||||
| *The basis for the assumed risk (e.g. median control group risk across studies) is provided in footnotes. The corresponding risk (and its 95% confidence interval) is based on the assumed risk in the comparison group and the relative effect of the intervention (and its 95% CI). | ||||||
| GRADE Working Group grades of evidence. | ||||||
| aDesign limitation (risk of bias). | ||||||
| Desloratadine 5 to 20 mg versus placebo for chronic spontaneous urticaria | ||||||
| Patient or population: patients with chronic spontaneous urticaria | ||||||
| Outcomes | Illustrative comparative risks* | Relative effect | Number of participants | Quality of the evidence | Comments | |
| Assumed risk | Corresponding risk | |||||
| Control (placebo) | Desloratadine 5 to 20 mg | |||||
| Complete suppression of urticaria: short‐term duration of intervention (desloratadine 5 mg) | See comment | See comment | Not estimable | 46 | ⊕⊕⊝⊝ | Favours neither intervention nor control Only 1 study, a conference abstract (Hoxha 2011) |
| Complete suppression of urticaria: short‐term duration of intervention (desloratadine 10 mg) | See comment | See comment | Not estimable | 46 | ⊕⊕⊝⊝ | Favours neither intervention nor control Only 1 study, a conference abstract (Hoxha 2011) |
| Complete suppression of urticaria: short‐term duration of intervention (desloratadine 20 mg) | See comment | See comment | Not estimable | 46 | ⊕⊕⊝⊝ | Favours desloratadine Only 1 study, a conference abstract (Hoxha 2011) |
| Complete suppression of urticaria: intermediate‐term duration of intervention (desloratadine 5 mg) | See comment | See comment | Not estimable | 80 | ⊕⊕⊝⊝ | Favours desloratadine Only 1 study (Di Lorenzo 2004) |
| Adverse effects leading to withdrawal: intermediate‐term duration of 5 mg of intervention | Study population | RR 1.46 | 466 | ⊕⊕⊝⊝ | Favours neither intervention nor control | |
| 17 per 1000 | 25 per 1000 | |||||
| Moderate | ||||||
| 18 per 1000 | 26 per 1000 | |||||
| *The basis for the assumed risk (e.g. median control group risk across studies) is provided in footnotes. The corresponding risk (and its 95% confidence interval) is based on the assumed risk in the comparison group and the relative effect of the intervention (and its 95% CI). | ||||||
| GRADE Working Group grades of evidence. | ||||||
| aDesign limitation (risk of bias). | ||||||
| Levocetirizine 5 to 20 mg versus placebo for chronic spontaneous urticaria | ||||||
| Patient or population: patients with chronic spontaneous urticaria | ||||||
| Outcomes | Illustrative comparative risks* | Relative effect | Number of participants | Quality of the evidence | Comments | |
| Assumed risk | Corresponding risk | |||||
| Control (placebo) | Levocetirizine 5 to 20 mg | |||||
| Complete suppression of urticaria: short‐term duration of intervention (levocetirizine 5 mg) | See comment | See comment | Not estimable | 49 | ⊕⊕⊝⊝ | Favours neither intervention nor control Only 1 study, a conference abstract (Hoxha 2011) |
| Complete suppression of urticaria: short‐term duration of intervention (levocetirizine 10 mg) | See comment | See comment | Not estimable | 49 | ⊕⊕⊝⊝ | Favours neither intervention nor control Only 1 study, a conference abstract (Hoxha 2011) |
| Complete suppression of urticaria: short‐term duration of intervention (levocetirizine 20 mg) | See comment | See comment | Not estimable | 49 | ⊕⊕⊝⊝ | Favours levocetirizine Only 1 study, a conference abstract (Hoxha 2011) |
| Complete suppression of urticaria: intermediate‐term duration of intervention (levocetirizine 5 mg) | See comment | See comment | Not estimable | 100 | ⊕⊕⊝⊝ | Favours levocetirizine Only 1 study (Nettis 2006) |
| *The basis for the assumed risk (e.g. median control group risk across studies) is provided in footnotes. The corresponding risk (and its 95% confidence interval) is based on the assumed risk in the comparison group and the relative effect of the intervention (and its 95% CI). | ||||||
| GRADE Working Group grades of evidence. | ||||||
| aDesign limitation (risk of bias). | ||||||
| Rupatadine 10 to 20 mg versus placebo for chronic spontaneous urticaria | ||||||
| Patient or population: patients with chronic spontaneous urticaria | ||||||
| Outcomes | Illustrative comparative risks* (95% CI) | Relative effect | Number of participants | Quality of the evidence | Comments | |
| Assumed risk | Corresponding risk | |||||
| Control (placebo) | Rupatadine 10 to 20 mg | |||||
| Good or excellent response | Study population | RR 1.35 | 245 | ⊕⊕⊝⊝ | Favours rupatadine | |
| 509 per 1000 | 687 per 1000 | |||||
| Moderate | ||||||
| 509 per 1000 | 687 per 1000 | |||||
| *The basis for the assumed risk (e.g. median control group risk across studies) is provided in footnotes. The corresponding risk (and its 95% confidence interval) is based on the assumed risk in the comparison group and the relative effect of the intervention (and its 95% CI). | ||||||
| GRADE Working Group grades of evidence. | ||||||
| aDesign limitation (risk of bias). | ||||||
| Loratadine 10 mg versus placebo for chronic spontaneous urticaria | ||||||
| Patient or population: patients with chronic spontaneous urticaria | ||||||
| Outcomes | Illustrative comparative risks* (95% CI) | Relative effect | Number of participants | Quality of the evidence | Comments | |
| Assumed risk | Corresponding risk | |||||
| Control (placebo) | Loratadine 10 mg | |||||
| Good or excellent response | Study population | RR 1.86 | 124 | ⊕⊕⊝⊝ | Favours neither intervention nor control | |
| 155 per 1000 | 289 per 1000 | |||||
| Moderate | ||||||
| 160 per 1000 | 298 per 1000 | |||||
| *The basis for the assumed risk (e.g. median control group risk across studies) is provided in footnotes. The corresponding risk (and its 95% confidence interval) is based on the assumed risk in the comparison group and the relative effect of the intervention (and its 95% CI). | ||||||
| GRADE Working Group grades of evidence. | ||||||
| aDesign limitation (risk of bias). | ||||||
| Loratadine 10 mg versus cetirizine 10 mg for chronic spontaneous urticaria | ||||||
| Patient or population: patients with chronic spontaneous urticaria | ||||||
| Outcomes | Illustrative comparative risks* (95% CI) | Relative effect | Number of participants | Quality of the evidence | Comments | |
| Assumed risk | Corresponding risk | |||||
| Control (cetirizine 10 mg) | Loratadine 10 mg | |||||
| Complete cessation of urticaria | Study population | RR 1.05 | 103 | ⊕⊕⊝⊝ | Combined short and intermediate‐term duration of intervention. Favours neither intervention nor control | |
| 588 per 1000 | 618 per 1000 | |||||
| Moderate | ||||||
| 574 per 1000 | 603 per 1000 | |||||
| *The basis for the assumed risk (e.g. median control group risk across studies) is provided in footnotes. The corresponding risk (and its 95% confidence interval) is based on the assumed risk in the comparison group and the relative effect of the intervention (and its 95% CI). | ||||||
| GRADE Working Group grades of evidence. | ||||||
| aDesign limitation (risk of bias). | ||||||
| Loratadine 10 mg versus desloratadine 5 mg for chronic spontaneous urticaria | ||||||
| Patient or population: patients with chronic spontaneous urticaria | ||||||
| Outcomes | Illustrative comparative risks* | Relative effect | Number of participants | Quality of the evidence | Comments | |
| Assumed risk | Corresponding risk | |||||
| Control (desloratadine | Loratadine 10 mg | |||||
| Complete suppression of urticaria: intermediate‐term duration of intervention | Study population | RR 0.91 | 369 | ⊕⊕⊝⊝ | Favours neither intervention nor control | |
| 658 per 1000 | 598 per 1000 | |||||
| Moderate | ||||||
| 670 per 1000 | 610 per 1000 | |||||
| Good or excellent response: intermediate‐term duration of intervention | Study population | RR 1.04 | 410 | ⊕⊕⊝⊝ | Favours neither intervention nor control No participants reported a good or excellent response in the loratadine group in Zou 2002 We found low levels of statistical heterogeneity in this analysis I2 = 40%) | |
| 263 per 1000 | 274 per 1000 | |||||
| Moderate | ||||||
| 228 per 1000 | 237 per 1000 | |||||
| *The basis for the assumed risk (e.g. median control group risk across studies) is provided in footnotes. The corresponding risk (and its 95% confidence interval) is based on the assumed risk in the comparison group and the relative effect of the intervention (and its 95% CI). | ||||||
| GRADE Working Group grades of evidence. | ||||||
| aDesign limitation (risk of bias). | ||||||
| Loratadine 10 mg compared to mizolastine 10 mg for chronic spontaneous urticaria | ||||||
| Patient or population: patients with chronic spontaneous urticaria | ||||||
| Outcomes | Illustrative comparative risks* (95% CI) | Relative effect | Number of participants | Quality of the evidence | Comments | |
| Assumed risk | Corresponding risk | |||||
| Control (mizolastine | Loratadine 10 mg | |||||
| Complete cessation of urticaria: intermediate‐term duration of intervention | Study population | RR 0.86 | 316 | ⊕⊝⊝⊝ | Overall, favours neither loratadine nor mizolastine In Guo 2003, more participants in mizolastine group had complete cessation of urticaria than in the other 2 studies (Liu 2003 and Yin 2003b) | |
| 675 per 1000 | 581 per 1000 | |||||
| Moderate | ||||||
| 667 per 1000 | 574 per 1000 | |||||
| Good or excellent response: intermediate‐term duration of intervention | Study population | RR 0.88 | 314 | ⊕⊕⊝⊝ | Favours neither loratadine nor mizolastine | |
| 187 per 1000 | 165 per 1000 | |||||
| Moderate | ||||||
| 174 per 1000 | 153 per 1000 | |||||
| Adverse events leading to withdrawal: intermediate‐term duration of intervention | Study population | RR 0.38 | 267 | ⊕⊕⊝⊝ | Favours neither loratadine nor mizolastine | |
| 15 per 1000 | 6 per 1000 | |||||
| Moderate | ||||||
| 19 per 1000 | 7 per 1000 | |||||
| Proportion of participants with at least 50% improvement in QoL: intermediate‐term duration of intervention | Study population | RR 3.21 | 252 | ⊕⊝⊝⊝ | Favours neither loratadine nor mizolastine No participants in the mizolastine group in Guo 2003 reported at least 50% improvement in QoL | |
| 104 per 1000 | 334 per 1000 | |||||
| Moderate | ||||||
| 64 per 1000 | 205 per 1000 | |||||
| *The basis for the assumed risk (e.g. median control group risk across studies) is provided in footnotes. The corresponding risk (and its 95% confidence interval) is based on the assumed risk in the comparison group and the relative effect of the intervention (and its 95% CI). | ||||||
| GRADE Working Group grades of evidence. | ||||||
| aDesign limitation (risk of bias). | ||||||
| Loratadine 10 mg versus emedastine 2 mg for chronic spontaneous urticaria | ||||||
| Patient or population: patients with chronic spontaneous urticaria | ||||||
| Outcomes | Illustrative comparative risks* (95% CI) | Relative effect | Number of participants | Quality of the evidence | Comments | |
| Assumed risk | Corresponding risk | |||||
| Control (emedastine 2 mg) | Loratadine 10 mg | |||||
| Complete cessation of urticaria: intermediate‐term duration of intervention | Study population | RR 1.04 | 161 | ⊕⊕⊕⊝ | Favours neither loratadine nor emedastine Only 1 study (Pons‐Guiraud 2006) | |
| 524 per 1000 | 545 per 1000 | |||||
| Moderate | ||||||
| 524 per 1000 | 545 per 1000 | |||||
| Good or excellent response: intermediate‐term duration of intervention | Study population | RR 1.09 | 160 | ⊕⊕⊕⊝ | Favours neither loratadine nor emedastine Only 1 study (Pons‐Guiraud 2006) | |
| 819 per 1000 | 893 per 1000 | |||||
| Moderate | ||||||
| 819 per 1000 | 893 per 1000 | |||||
| Adverse events leading to withdrawal: intermediate‐term duration of intervention | Study population | RR 1.09 | 161 | ⊕⊕⊕⊝ | Favours neither loratadine nor emedastine Only 1 study (Pons‐Guiraud 2006) | |
| 12 per 1000 | 13 per 1000 | |||||
| Moderate | ||||||
| 12 per 1000 | 13 per 1000 | |||||
| *The basis for the assumed risk (e.g. median control group risk across studies) is provided in footnotes. The corresponding risk (and its 95% confidence interval) is based on the assumed risk in the comparison group and the relative effect of the intervention (and its 95% CI). | ||||||
| GRADE Working Group grades of evidence. | ||||||
| aRelatively few participants and few events and/or wide confidence intervals. | ||||||
| Loratadine 10 mg versus hydroxyzine 25 mg for chronic spontaneous urticaria | ||||||
| Patient or population: patients with chronic spontaneous urticaria | ||||||
| Outcomes | Illustrative comparative risks* (95% CI) | Relative effect | Number of participants | Quality of the evidence | Comments | |
| Assumed risk | Corresponding risk | |||||
| Control (hydroxyzine 25 mg) | Loratadine 10 mg | |||||
| Complete suppression of urticaria: short‐term duration of intervention | Study population | RR 1 | 12 | ⊕⊕⊝⊝ | Favours neither intervention or control Only 1 study (Monroe 1992) | |
| 500 per 1000 | 500 per 1000 | |||||
| Moderate | ||||||
| 500 per 1000 | 500 per 1000 | |||||
| *The basis for the assumed risk (e.g. median control group risk across studies) is provided in footnotes. The corresponding risk (and its 95% confidence interval) is based on the assumed risk in the comparison group and the relative effect of the intervention (and its 95% CI). | ||||||
| GRADE Working Group grades of evidence. | ||||||
| aDesign limitation (risk of bias). | ||||||
| Cetirizine 10 mg versus hydroxyzine 25 mg for chronic spontaneous urticaria | ||||||
| Patient or population: patients with chronic spontaneous urticaria | ||||||
| Outcomes | Illustrative comparative risks* (95% CI) | Relative effect | Number of participants | Quality of the evidence | Comments | |
| Assumed risk | Corresponding risk | |||||
| Control (hydroxyzine 25 mg) | Cetirizine 10 mg | |||||
| Adverse events leading to withdrawal | Study population | RR 0.78 | 261 | ⊕⊕⊝⊝ | Favours neither cetirizine nor hydroxyzine | |
| 53 per 1000 | 41 per 1000 | |||||
| Moderate | ||||||
| 54 per 1000 | 42 per 1000 | |||||
| *The basis for the assumed risk (e.g. median control group risk across studies) is provided in footnotes. The corresponding risk (and its 95% confidence interval) is based on the assumed risk in the comparison group and the relative effect of the intervention (and its 95% CI). | ||||||
| GRADE Working Group grades of evidence. | ||||||
| aDesign limitation (risk of bias). | ||||||
| Hydroxyzine 25 mg versus placebo for chronic spontaneous urticaria | ||||||
| Patient or population: patients with chronic spontaneous urticaria | ||||||
| Outcomes | Illustrative comparative risks* (95% CI) | Relative effect | Number of participants | Quality of the evidence | Comments | |
| Assumed risk | Corresponding risk | |||||
| Control (placebo) | Hydroxyzine 25 mg | |||||
| Adverse events leading to withdrawal: intermediate‐term duration of intervention | Study population | RR 3.64 | 270 | ⊕⊕⊝⊝ | Favours neither intervention nor control | |
| 14 per 1000 | 53 per 1000 | |||||
| Moderate | ||||||
| 15 per 1000 | 55 per 1000 | |||||
| *The basis for the assumed risk (e.g. median control group risk across studies) is provided in footnotes. The corresponding risk (and its 95% confidence interval) is based on the assumed risk in the comparison group and the relative effect of the intervention (and its 95% CI). | ||||||
| GRADE Working Group grades of evidence. | ||||||
| aDesign limitation (risk of bias). | ||||||
Background
Description of the condition
Urticaria is a condition characterised by the development of a rash of red itchy raised weals or hives that blanch with pressure. The main associated symptom is itching, which may be intense. Although individual weals typically come and go within 24 hours, the overall condition may persist, with fresh crops of weals occurring on other areas of the body, even as the original lesions resolve. In some cases, the weals are accompanied by deeper swelling, known as angio‐oedema. If recurrent crops of urticaria continue to occur for longer than six weeks, the condition is known as chronic urticaria (to distinguish this from the more common acute urticaria, for which a cause is more often identified) (James 2011; Sarbijt 2014). Chronic spontaneous urticaria may occur at any age (Hellgren 1972). Recent publications show a female‐to‐male predominance of 2:1 (Gaig 2004) with a prevalence of between 0.5% and 1% (Maurer 2011).
Causes
A careful history and physical examination are important, but an underlying cause is never identified in most individuals with chronic urticaria (Grattan 2001; Charlesworth 2002). In such cases, the condition has also been called 'chronic idiopathic urticaria.' This term was replaced by 'chronic ordinary urticaria' to include the subset of people who appear to have autoimmune disease, with a circulating antibody that is able to bind to mast cells, thereby causing histamine release and weal formation. This group makes up about 30% of those with chronic urticaria, but such individuals tend to respond in the same way to treatment as those with non‐autoimmune urticaria (Hauser 2003). Current consensus is to use the term 'chronic spontaneous urticaria' (Maurer 2013), which describes the behaviour of the disease rather than assuming a particular level of knowledge of its pathogenesis. By contrast, when a trigger for urticaria can be identified, the term 'inducible' is now preferred. In practice, chronic spontaneous urticaria covers the population of individuals who were previously labelled as having chronic idiopathic or ordinary urticaria. Most of the extant literature employs these outmoded terms. We therefore deemed it appropriate to include such studies, whilst adhering to the term 'chronic spontaneous urticaria (CSU)' throughout our review.
Impact
The severity of urticaria varies between individuals. Some of those with the condition have several attacks each day for many months; others may have an attack every week or every month. This can be a very debilitating condition, particularly if the attacks are frequent. The inability to predict an attack and the lack of an identifiable cause are often sources of great frustration. Historically it has been reported that after 10 years, at least 20% of those with urticaria still suffer from it (Champion 1969; Humphreys 1998) and that half of those with chronic urticaria and angio‐oedema still had chronic urticaria at five years (Champion 1969). However, the condition is rarely permanent, and recent surveys suggest a higher chance of disease remission (Kozel 2001).
Description of the intervention
The aim of treatment is to suppress urticarial activity completely. In some individuals, only symptomatic improvement can be achieved by reducing the severity and frequency of attacks. H1‐antihistamines (commonly called 'antihistamines,' which are available over the counter for various complaints, including hay fever and allergies) form the basis of treatment, providing symptomatic relief for many affected individuals. Older (or 'first‐generation') H1‐antihistamines (e.g. hydroxyzine) are no longer recommended for use in chronic urticaria, as they are more sedating than the newer 'second generation' of antihistamines (e.g. cetirizine) and carry a higher risk of side effects such as dry mouth, blurred vision, headache, glaucoma and urinary retention.
Antihistamines may have to be taken over extended periods of time to control the disease. High doses of H1‐antihistamines may be required to obtain sufficient symptom control in urticaria. Adverse effects of H1‐antihistamines vary between individuals, and some of those with the condition may tolerate one antihistamine better than another (Nolen 1997). Terfenadine and astemizole have been associated with cardiac arrhythmias (DuBuske 1999) in a small proportion of people and have been withdrawn from the market. Oral corticosteroids have an occasional role as rescue therapy in severe exacerbations of chronic urticaria.
Other treatments for difficult to control CSU include H2‐antihistamines (also known as H2‐receptor antagonists, or H2RAs) such as ranitidine (these are not commonly referred to as antihistamines and are usually used for acid‐related stomach conditions). (This class of medications was systematically reviewed in Fedorowicz 2012.) Other interventions include the leukotriene receptor antagonist montelukast, immunosuppressive agents (e.g. ciclosporin), diets and food avoidance, doxepin and the anti‐immunoglobulin E (IgE) monoclonal antibody omalizumab.
Why it is important to do this review
Patients with chronic spontaneous urticaria can be difficult to treat. Many of those with the condition do not respond to initial treatment, and clear guidance is needed on which antihistamines to use, appropriate dosing regimens and likely responses. As treatment is usually aimed at reducing symptoms and improving the lives of people with CSU, evidence regarding quality of life was sought so an important outcome for this review could be assessed.
Many randomised controlled trials (RCTs) related to the use of antihistamines in CSU have been conducted. We sought to investigate:
-
whether one antihistamine is superior to another;
-
if combination therapy is superior to monotherapy;
-
whether high‐dose therapy is superior to standard doses;
-
the duration of benefit from H1‐antihistamines;
-
risks and side effects of H1‐antihistamines when used in the treatment of individuals with chronic urticaria; and
-
the effects of treatment on quality of life.
We have provided an assessment of the level and quality of currently available evidence, and we have identified areas that require further research on this important condition.
Objectives
To assess the effects of H1‐antihistamines for chronic spontaneous urticaria (CSU).
Methods
Criteria for considering studies for this review
Types of studies
We included only RCTs that evaluated the effectiveness of H1‐antihistamines compared with placebo or another active treatment (including another H1‐antihistamine) and those that compared different doses. We did not include studies of other designs.
Types of participants
Participants were individuals of any age (children and adults) who had been clinically diagnosed with CSU. The following were excluded.
-
Participants with urticaria of less than six weeks' duration;
-
Participants with immune complex urticaria (urticarial vasculitis or serum sickness), papular urticaria, angio‐oedema without weals or contact urticaria; and
-
Participants with predominantly physical or cholinergic urticaria, or other urticaria with a clearly identifiable causative agent (e.g. medication), and those with auto‐inflammatory syndromes (e.g. Muckle‐Wells syndrome, Schnitzler's syndrome).
Types of interventions
Any first‐generation ('sedating') or second‐generation ('non‐sedating') H1‐antihistamines in current use, given at any dose (including topical interventions and H2RAs given concomitantly). We specifically excluded studies that would yield comparison data only for terfenadine and astemizole, as these drugs have been withdrawn because of safety issues. Interventions could be given as single therapy or combination therapy. Comparators consisted of no treatment (i.e. placebo) or another active compound.
Duration of the intervention was categorised as follows: up to two weeks (short‐term), longer than two weeks and up to three months (intermediate‐term) and longer than three months (long‐term).
Types of outcome measures
Primary outcomes
-
Proportion of participants with complete suppression of urticaria whilst taking H1‐antihistamines.
-
Proportion of participants with 'good' or 'excellent' response to H1‐antihistamines whilst taking H1‐antihistamines.
-
Proportion of participants with 50% or greater improvement in quality of life measurements whilst taking H1‐antihistamines.
The above measures were based predominantly on participant self‐reporting because of the transient nature of urticaria. We looked at participant and clinician assessments separately and in combination.
Secondary outcomes
-
Serious adverse events (i.e. serious enough to require withdrawal of treatment).
-
Minor participant‐reported adverse events not requiring withdrawal of treatment.
-
Proportion of participants who relapse within one month of stopping H1‐antihistamines.
Search methods for identification of studies
We aimed to identify all relevant RCTs regardless of language or publication status (published, unpublished, in press or in progress).
Electronic searches
We revised our draft search strategy to update the names of specific H1‐antihistamines used to treat urticaria.
We searched the following databases up to 3 June 2014.
-
Cochrane Skin Group Specialised Register (strategy in Appendix 1).
-
Cochrane Central Register of Controlled Trials (CENTRAL) (2014, Issue 5) (strategy in Appendix 2).
-
MEDLINE via OVID (from 1946) (strategy in Appendix 3).
-
EMBASE via OVID (from 1974) (strategy in Appendix 4).
-
PsycINFO via OVID (from 1806) (strategy in Appendix 5).
Trials registers
We searched the following trials registers on 9 June 2014.
For the first three registers listed, we used the following search string: 'chronic idiopathic urticaria AND anti‐histamine AND placebo.' For the EU Clinical Trials Register and the World Health Organization International Clinical Trials Registry, we used the phrase 'chronic idiopathic urticaria.'
-
metaRegister of Controlled Trials (www.controlled‐trials.com).
-
US National Institutes of Health Ongoing Trials Register (www.clinicaltrials.gov).
-
Australian New Zealand Clinical Trials Registry (www.anzctr.org.au).
-
World Health Organization International Clinical Trials Registry platform (www.who.int/trialsearch).
-
EU Clinical Trials Register (https://www.clinicaltrialsregister.eu/).
Searching other resources
References from published papers
We checked the bibliographies of reviews on treatment of individuals with CSU to look for additional references to relevant RCTs.
Adverse effects
We did not perform a separate search for adverse effects of the target intervention. We considered adverse and side effects described in the included studies. We checked the bibliographies of review articles to look for additional references to relevant reports of adverse effects.
Data collection and analysis
Selection of studies
We included in this review only RCTs evaluating H1‐antihistamines for chronic urticaria. We sought advice from translators when the study report was written in a language other than English. At least two review authors (MS, CB and SNC) assessed all titles and abstracts identified by the searches. These review authors independently assessed each included study to determine whether the predefined selection criteria had been met, and they resolved differences of opinion through discussion within the review team. We listed the excluded studies and the reasons for their exclusion in the Characteristics of excluded studies section of the review and presented the study flow chart in PRISMA (Preferred Reporting Items for Systematic Reviews and Meta‐Analyses) (Figure 1).

Study flow diagram.
Data extraction and management
Three review authors (MS, CB and SNC) extracted data independently using a data extraction form, and disagreements on data extraction were resolved by consensus. In the case of studies written in Chinese, German or another foreign language, a translator extracted data, and MS and SNC checked the numerical outcomes. We contacted principal investigators of trials and asked them to provide missing data when possible. Review authors (MS, CB and BC) checked and entered the data (numerical outcomes data and non‐numerical data) into RevMan 2014.
Assessment of risk of bias in included studies
At least two review authors (MS, CB and SNC) independently assessed the risk of bias in included studies using the risk of bias assessment tool provided in Chapter 8 of theCochrane Handbook for Systematic Reviews of Interventions (Higgins 2011). We compared the evaluations and discussed and resolved inconsistencies between review authors' decisions.
We rated the following domains separately for each of the included studies as 'low risk of bias,' 'high risk of bias' and 'unclear' if the risk of bias was uncertain or unknown. These assessments are reported in the 'Risk of bias' table for each individual study in the Characteristics of included studies section of the review.
-
Allocation sequence was adequately generated ('sequence generation').
-
Allocation was adequately concealed ('allocation concealment').
-
Knowledge of allocated interventions was adequately prevented during the study ('blinding').
-
Incomplete outcome data were adequately addressed.
-
Reports of the study were free of suggestions of selective outcome reporting.
-
The study was apparently free of other sources of bias that could put it at high risk of bias (i.e. potential conflicts of interest, pharmaceutical funding/support or both).
We also categorised and reported the overall risk of bias of each of the included studies according to the following.
-
Low risk of bias: plausible bias unlikely to seriously alter the results if all criteria were met.
-
Unclear risk of bias: plausible bias that raises some doubt about the results if one or more criteria were assessed as unclear.
-
High risk of bias: plausible bias that seriously weakens confidence in the results if one or more criteria were not met.
We reported these assessments in the Risk of bias in included studies section of this review.
Measures of treatment effect
We planned to present continuous outcomes on the original scale as reported in each individual study. We will report standardised mean differences (SMDs) for continuous data in future updates (i.e. if similar outcomes are reported using different scales, we will standardise these by dividing the estimated coefficient by its standard deviation (SD) to permit comparisons between scales).
We presented dichotomous outcomes data as risk ratios (RRs) along with their associated 95% confidence intervals (CIs); we analysed these in RevMan using the Mantel‐Haenszel test, unless stated otherwise.
Unit of analysis issues
Cross‐over studies
We planned to analyse cross‐over studies using first period data only, unless an adequate washout between periods took place and baseline data were presented for each period.
Multi‐armed studies
To ensure that analyses from these studies were not falsely powered, we partitioned the number of participants analysed in the comparison arm into each pair‐wise comparison; thus a three‐arm study with 30 participants in each arm that resulted in two pair‐wise comparisons of placebo versus A and placebo versus B was allocated the following numbers of participants: 15 versus 30, and 15 versus 30. Mean and standard deviation summary statistics for comparator participants remained unchanged.
Dealing with missing data
We attempted to contact investigators to retrieve missing data. We reanalysed data according to a treatment by allocation principle when possible, and in accordance with Section 16.2.2 of the Cochrane Handbook for Systematic Reviews of Interventions (Higgins 2011). If data were not reported and study authors had conducted a per‐protocol analysis, we assessed whether there was any imbalance in the dropout rate between trial arms to determine the potential impact of bias. In the absence of intention‐to‐treat data, we used available case population data (per protocol) and reported these accordingly.
Assessment of heterogeneity
We assessed clinical heterogeneity by examining trial conditions (i.e. characteristics of the studies, similarity between types of participants and the interventions). We assessed the degree of statistical heterogeneity between studies using the I² statistic. We reported heterogeneity as important if it was at least moderate to substantial by the I² statistic > 60% (Higgins 2011). If this could be explained by clinical reasoning and a coherent argument could be made for combining the studies, we conducted a meta‐analysis. In many cases, heterogeneity could not be adequately explained, and we did not pool the data.
Clinical diversity among the studies included in this review, as well as the limited number of studies that could be combined for each intervention, allowed us to assess heterogeneity between studies for only one of the comparisons.
Assessment of reporting biases
We planned to carry out assessments of reporting bias when at least 10 studies were included in a meta‐analysis, according to the recommendations on testing for funnel plot asymmetry as described in Section 10.4.3.1 of the Cochrane Handbook for systematic Reviews of Interventions (Higgins 2011). We planned to explore possible sources of asymmetry by performing an additional sensitivity analysis.
Data synthesis
Review authors (MS, CB and BC) analysed the data in RevMan 2014 and reported them in accordance with the advice provided in Chapter 9 of the Cochrane Handbook for Systematic Reviews of Interventions (Higgins 2011). If we were able to identify more than one study that was clinically similar and exhibited not less than moderate heterogeneity, we pooled the data into a meta‐analysis using a random‐effects model, and we carried out a sensitivity analysis using a fixed‐effect model to assess the degree of heterogeneity.
For some comparisons, we carried out reanalysis using Fisher's exact test because of the small number of participants,
Subgroup analysis and investigation of heterogeneity
We conducted subgroup analyses based on the duration of the intervention. Duration of the intervention was categorised as follows: up to two weeks (short‐term) and longer than two weeks up to three months (intermediate‐term).
Sensitivity analysis
We planned to conduct sensitivity analyses for primary outcome measures to assess the effects of including only those studies with low risk of bias and to assess the robustness of the results of this review. Included studies with low risk of bias were too few to permit this analysis.
Results
Description of studies
Results of the search
We identified 1080 records in total through our electronic database searches up to June 2014. We identified an additional 45 potential study reports from databases of clinical trials in progress and from bibliographical searches. In total we screened 1125 records and excluded 841 on the basis of examination of titles and abstracts. We examined the remaining 284 records in detail. Sixteen records could not be obtained in full text, and we list these in the Characteristics of studies awaiting classification tables. Fourteen studies were listed as ongoing (see Characteristics of ongoing studies), and we will include these in future updates if the results become available (Figure 1). We excluded 169 studies accounting for 172 records. The remaining 82 records described 73 studies, which were included.
At each stage of the selection process, at least two review authors independently reviewed the search results and selected trials for inclusion. The final list was agreed upon by two review authors (MS and SNC), with involvement of a third review author (CB) if necessary to resolve disagreements.
Included studies
Design
All included studies were randomised, and none was of quasi‐randomised design.
Some unusual designs were reported: Garavaglia 1995 reported a randomised trial in which dropouts were replaced with new recruits. It was unclear whether the new participants were randomly assigned or were simply assigned to the intervention group of the most recent dropout. Thompson 2000 Study 1 and Thompson 2000 Study 2 reported two trials within the same study report; it is unclear why the results from both studies were not aggregated and presented as a single two‐centre trial, as trial conditions were the same. Wang 2012 was a dose reduction study, and Weller 2013 selected a single body area for each participant. Staevska 2014 employed a cross‐over trial design but after randomisation and initial in‐hospital treatment assessment tested the effectiveness and tolerability of levocetirizine versus hydroxyzine in an alternate‐day regimen. After five days, participants from arms 1 and 2 were crossed over to the alternative treatment without washout between phases.
Twenty‐six of the included trials were multi‐centre in design (Belaich 1990; Breneman 1995; Breneman 1996; Bronsky 2001; Brostoff 1996; Dubertret 1999; Finn 1999; Gale 1989; Gimenez‐Arnau 2007; Godse 2007; Grant 1988; Gu 2002; Hao 2003; Kalivas 1990; Kaplan 2005; Kint 1989; Monroe 1988; Monroe 2003; Nelson 2000; Ollert 1999; Ortonne 2007; Paul 1998; Peyri 1991; Pons‐Guiraud 2006; Potter 2009; Zuberbier 2010).
Fourteen included studies were of a cross‐over design. However, none of these contributed data to the meta‐analyses in this review, although we discuss the results narratively below (Commens 1978; Gale 1989; Go 1989; Goh 1991; Harvey 1981; Hjorth 1988; Juhlin 1987; Juhlin 1991; Kint 1989; Leyh 1989; Liu H‐N 1990; Marks 1980; Salo 1989; Staevska 2014).
Sample sizes
We included 73 studies with a total of 9759 randomly assigned participants. Details of all included studies are provided in the Characteristics of included studies tables. Sample sizes ranged from several hundred, for example, 886 (Potter 2009), 525 (Zuberbier 2010), 468 (Nelson 2000), 334 (Gimenez‐Arnau 2007) and 314 NCT00536380) to fewer than 25 (Gale 1989; Harvey 1981; Juhlin 1987; Leyh 1989; Liu H‐N 1990; Marks 1980; Salo 1989).
Setting
Most studies were carried out in a secondary care setting, including hospital clinics, research clinics and dermatology centres. None were based in primary care.
Studies were carried out mostly, but not exclusively, in Europe and the USA. Outside these continents, Anuradha 2010; Dakhale 2014; Ghosh 1990; Godse 2007; Handa 2004 and Maiti 2011 were undertaken in India. Gu 2002; Hao 2003; Liu 2003; Wang 2012; Wu 2008; Yin 2003a; Yin 2003b and Zou 2002 were undertaken in China, and Makino 2012 in Japan. Garavaglia 1995 and Zuberbier 2010 were carried out in Argentina, Goh 1991 in Singapore and Liu H‐N 1990 and Wan 2009 in Taiwan. Marks 1980 took place in Australia, Monroe 2003 in the USA and Chile and Phanuphak 1987 in Thailand. The location was not stated for Patel 1997, although the study authors worked in American and Canadian research centres.
Participants
The total number of participants randomly assigned was 9759. Participants consisted of adults (i.e. over 18 years old) or mixed groups including adolescents (i.e. over 12 years old). Most participants were female.
The inclusion criteria were tightly defined as CSU, alternatively described as chronic idiopathic or ordinary urticaria, of at least six weeks' duration. In Hjorth 1988, the diagnosis was not clearly defined, and investigators may have included some participants with atopic dermatitis. In Wang 2012, disease duration and symptoms were comparable but were not defined clearly in the study. Dakhale 2014; Finn 1999; Grant 1988; Kaplan 2005; Monroe 2003; Nelson 2000; Ortonne 2004 and Pons‐Guiraud 2006 excluded participants who were previously unresponsive to antihistamines, and in the Ghosh 1990 study, all participants were previously refractory to antihistamine treatment.
Interventions and comparisons
Intervention
H1‐antihistamines usually are classified as first or second generation, according to their chemical structure and properties. First‐generation antihistamines may cause sedation and can be useful for treating sleep disturbance due to itching. Second‐generation antihistamines are less sedating, as the molecule is less likely to cross the blood‐brain barrier; however, they are not without the possibility of sedative effects, and some (particularly terfenadine and astemizole) may also cause irregularities in heart rhythm (cardiac arrhythmia). A category of third‐generation antihistamines has been used to describe some of the later antihistamines. This term is not generally accepted, as such agents do not differ sufficiently from earlier drugs in terms of desirable and undesirable effects (Holgate 2003). In our analyses (of those trials that yielded outcome data), we included the following.
First‐generation antihistamines
-
Hydroxyzine.
-
Pheniramine.
Second‐generation antihistamines
-
Cetirizine.
-
Desloratadine.
-
Ebastine.
-
Emedastine.
-
Fexofenadine.
-
Levocetirizine.
-
Loratadine.
-
Ketotifen.
-
Mizolastine.
-
Rupatadine.
Other interventions
Di Lorenzo 2004 used montelukast, a non‐H1‐antihistamine intervention, as the comparator with desloratadine. Montelukast is a leukotriene receptor antagonist (LTRA). Ghosh 1990 used as a comparator doxepin, a sedative tricyclic antidepressant that has antihistaminic properties.
Duration of intervention
Interventions were categorised by duration as follows: up to two weeks (short‐term), longer than two weeks and up to three months (intermediate‐term) and longer than three months (long‐term). Seventeen studies were short‐term (Commens 1978; Go 1989; Goh 1991; Harvey 1981; Hjorth 1988; Juhlin 1987; Juhlin 1991; Kint 1989; Leyh 1989; Leynadier 2000; Locci 1991; Monroe 1992; Patel 1997; Peyri 1991; Phanuphak 1987; Salo 1989; Staevska 2014); the duration of intervention was not explicitly stated in Hoxha 2011, but we categorised this as short‐term on the basis of information given in the abstract report. One study (Weller 2013) was of very short duration (five hours). The remaining 55 studies were categorised as having an intermediate‐term duration of intervention. None of the studies had an intervention period categorised as long‐term.
Comparisons
A total of 73 trials met our inclusion criteria. Of these, only 34 trials provided outcome data for the following comparisons.
-
Loratadine 10 mg versus placebo (Belaich 1990; Monroe 1992).
-
Loratadine 10 mg versus cetirizine 10 mg (Patel 1997; Yin 2003b).
-
Loratadine 10 mg versus desloratadine 5 mg (Gu 2002; Hao 2003; Zou 2002).
-
Loratadine 10 mg versus mizolastine 10 mg (Guo 2003; Leynadier 2000; Liu 2003; Yin 2003b).
-
Loratadine 10 mg versus emedastine 2 mg (Pons‐Guiraud 2006).
-
Loratadine 10 mg versus hydroxyzine 25 mg (Monroe 1992).
-
Cetirizine 10 mg versus placebo (Breneman 1995; Breneman 1996; Go 1989; Kalivas 1990)..
-
Cetirizine 10 mg versus hydroxyzine 25 mg (Breneman 1996; Kalivas 1990).
-
Cetirizine 10 mg versus fexofenadine 180 mg (Handa 2004).
-
Cetirizine 10 mg versus levocetirizine 5 mg (Yin 2003a).
-
Cetirizine 10 mg versus mizolastine 10 mg (Yin 2003b).
-
Desloratadine 5 mg to 20 mg versus placebo (Di Lorenzo 2004; Hoxha 2011; Monroe 2003; Nettis 2004; Ortonne 2007; Ring 2001).
-
Hydroxyzine 25 mg versus placebo (Breneman 1996; Kalivas 1990; Monroe 1992).
-
Levocetirizine 5 mg to 20 mg versus placebo (Hoxha 2011; Nettis 2006).
-
Rupatadine 10 mg to 20 mg versus placebo (Gimenez‐Arnau 2007).
-
Desloratadine 5 mg to 20 mg versus levocetirizine 5 to 20 mg (Hoxha 2011; Potter 2009).
-
Ebastine 10 mg versus placebo (Peyri 1991).
-
Desloratadine 5 mg versus montelukast 10 mg (Di Lorenzo 2004).
-
Fexofenadine 180 mg versus placebo (Kaplan 2005).
-
Ketotifen 1 mg versus placebo (Phanuphak 1987).
-
Cetirizine 5 mg and hydroxyzine 25 mg versus placebo (Wan 2009).
-
Azelastine 2 mg versus azelastine 4 mg (Wu 2008).
-
Doxepin 10 mg versus pheniramine 22.5 mg (Ghosh 1990).
A number of studies compared interventions that could not be included in our analyses because the outcomes measured did not fit our inclusion criteria.
-
Acrivastine 4 mg, placebo, clemastine 1 mg (Leynadier 2000).
-
Acrivastine 8 mg, chlorphen(ir)amine maleate 4 mg (Gale 1989).
-
Acrivastine 8 mg, clemastine 1 mg, placebo (Juhlin 1987).
-
Acrivastine 8 mg, hydroxyzine hydrochloride 20 mg (Salo 1989).
-
Azelastine 2 mg, azelastine 4 mg, azelastine and cimetidine (H2RA) 2 mg (Wu 2008).
-
Cetirizine 10 mg, placebo (Juhlin 1991).
-
Cetirizine 10 mg plus placebo, terfenadine 60 mg, placebo (Go 1989; Kint 1989).
-
Cetirizine 10 mg, terfenadine 120 mg, placebo (Garavaglia 1995).
-
Cetirizine 10 mg, placebo (cross‐over) (Goh 1991); non‐cross‐over (Alomar 1990a).
-
Cetirizine 10 mg versus rupatadine 10 mg (Dakhale 2014).
-
Chlorphen(ir)amine 4 mg, chlorphen(ir)amine 4 mg plus cimetidine 400 mg (H1 + H2 antagonist), placebo (Marks 1980)
-
Cimetidine 200 mg plus chlorphen(ir)amine 4 mg, chlorphen(ir)amine 4 mg plus placebo, placebo (Commens 1978).
-
Desloratadine 5 mg, placebo (Bronsky 2001; Monroe 2003; Ortonne 2004; Ortonne 2007Ring 2001).
-
Desloratadine 5 mg, desloratadine 10 mg, desloratadine 20 mg (NCT00536380).
-
Desloratadine 5 mg, desloratadine 20 mg (Weller 2013).
-
Desloratadine 5 mg and placebo, desloratadine 5 mg and montelukast 10 mg, placebo (Nettis 2004).
-
Fexofenadine 60 mg, 120 mg, 180 mg and 240 mg; placebo (Paul 1988).
-
Fexofenadine 60 mg, placebo (Thompson 2000 Study 1; Thompson 2000 Study 2).
-
Fexofenadine HCl 180 mg, levocetirizine 5 mg (Godse 2007).
-
Fexofenadine HCl 20 mg, 60 mg,120 mg and 240 mg; placebo (Finn 1999; Nelson 2000).
-
Fexofenadine 180 mg, placebo (Degonda 2002).
-
Hydroxyzine plus terbutaline (beta agonist) (25 mg plus 5 mg), hydroxyzine plus cyproheptadine (25 mg plus 4 mg), hydroxyzine plus chlorphen(ir)amine (25 mg plus 4 mg), hydroxyzine plus cimetidine (H2RA) (25 mg plus 300 mg), hydroxyzine plus placebo (25 mg ) (Harvey 1981).
-
Ketotifen 1 mg, fluoxetine 20 mg (selective serotonin reuptake inhibitor–type antidepressant) (Sener 1999).
-
Levocetirizine 5 mg, bilastine 20 mg (Zuberbier 2010).
-
Levocetirizine 5 mg, desloratadine 5 mg (Potter 2009).
-
Levocetirizine 20 mg, levocetirizine 15 mg plus hydroxyzine 50 mg (Staevska 2014).
-
Loratadine 10 mg, levocetirizine 5 mg (Anuradha 2010).
-
Loratadine 10 mg, placebo (Monroe 1988).
-
Mizolastine 10 mg, loratadine 10 mg, placebo (Dubertret 1999).
-
Mizolastine 10 mg, placebo (Brostoff 1996; Ollert 1999).
-
Mizolastine 10 mg in decreasing dose, mizolastine 10 mg daily (Wang 2012).
-
Nifedipine 10 mg, chlorphen(ir)amine 4 mg (Liu H‐N 1990).
-
Olopatadine 10 mg, olopatadine 5 mg, no medication (Makino 2012).
-
Oxatomide 30 mg, clemastine 1 mg (Beck 1985).
-
Oxatomide gel 5%, dechlorpheniramine cream (Locci 1991).
-
Rupatadine 10 mg, levocetirizine 5 mg (Maiti 2011).
-
Rupatadine 10 mg, rupatadine 20 mg, placebo (Gimenez‐Arnau 2007).
-
Rupatadine 5 mg, rupatadine 10 mg, rupatadine 20 mg, placebo (Dubertret 2007).
-
Terfenadine 60 mg, clemastine 1 mg, placebo (Hjorth 1988).
-
Terfenadine 60 mg, chlorphen(ir)amine 4 mg, placebo (Grant 1988).
Outcomes
Timing of outcome assessment varied considerably. Studies reported outcomes assessed at baseline and at the end of the intervention period, with interim outcome assessments performed in some studies. If a study reported serial times of duration of intervention for the same participants, to reduce bias, we summarised these only at the latest time point.
Nine studies reported outcomes measured after the treatment period had ended (Di Lorenzo 2004; Ghosh 1990; Go 1989; Nettis 2006; Pons‐Guiraud 2006; Potter 2009; Thompson 2000 Study 1; Thompson 2000 Study 2; Yin 2003b).
Outcomes included measures of weals, redness and itching assessed through both participant diaries or reports and clinician assessments, as well as size of weals and assessment of redness based on visual analogue scales. Numbers of participants experiencing improvement or cessation of symptoms were also reported.
Few of the studies directly reported our prespecified review outcomes (Objectives).
Few studies reported quality of life measures: Degonda 2002 provided participant‐assessed summaries of changes in quality of life, and Maiti 2011 provided modified Dermatology Life Quality Index (DLQI) scores. Nettis 2004 and Nettis 2006 also provided quality of life assessment based on the DLQI. Potter 2009 reported the results of a self‐administered DLQI questionnaire; Staevska 2014 and Zuberbier 2010 also reported DLQI results. Ortonne 2007 reported disruption of sleep and daily activities, and Staevska 2014 reported effects on quality of nighttime sleep. Thompson 2000 Study 1 and Thompson 2000 Study 2 commented on significant improvements in DLQI with fexofenadine.
Excluded studies
We excluded 169 studies. These consisted of studies that described only chronic urticaria unless the text mentioned or provided details that confirmed a diagnosis of chronic spontaneous or idiopathic or ordinary urticaria. Studies that were conducted with only terfenadine or astemizole were excluded because the medications had already been withdrawn for safety reasons. Further details can be found in Characteristics of excluded studies.
Ongoing studies and studies awaiting assessment
We identified 14 ongoing studies through our searches of clinical trials databases. Further details may be found in the Characteristics of ongoing studies tables. Data from these studies if available will be included in future updates of the review.
We identified 16 studies awaiting assessment, because we were unable to obtain full‐text copies at the time of writing of this review. Further details are available in the tables of Characteristics of studies awaiting classification.
Risk of bias in included studies
In this review, we included 'Risk of bias' assessments. Please see Figure 2, which shows our judgements about each 'Risk of bias' item expressed as percentages of included studies in each category of risk, and Figure 3, which shows the judgement for each domain by study. When 'Risk of bias' information was missing from the trial report, we contacted the principal investigators of studies published from 2001 onwards to ask for missing information.

Risk of bias graph: review authors' judgements about each risk of bias item presented as percentages across all included studies.

Risk of bias summary: review authors' judgements about each risk of bias item for each included study.
For studies with items judged as 'unclear,' we requested clarification from trial investigators, but no further information was forthcoming at the time that this review was prepared. No study provided complete clarity on every item in our 'Risk of bias' assessment, indicating widespread suboptimal reporting of methodology or results. Of the 73 included studies, 37 (50%) had at least one domain that we rated as at high risk of bias.
Allocation
The randomisation process and concealment of allocation are the most important and sensitive indicators that bias has been minimised in clinical trials. In one of the included studies (Garavaglia 1995), we assessed risk of bias as high, as the report of the study stated that the participant group was "randomly divided (by triplets) into three groups," using a preestablished randomisation list. As participants who dropped out were replaced with new participants, it is unclear whether the trial design is truly randomised, and whether new participants were randomly assigned de novo or were assigned to the group of the most recent dropout. We were unable to obtain further information from trial investigators to clarify this. Among all 73 included studies, only 12 (Brostoff 1996; Dakhale 2014; Di Lorenzo 2004; Gimenez‐Arnau 2007; Handa 2004; Kint 1989; Monroe 2003; Ortonne 2007; Pons‐Guiraud 2006; Ring 2001; Weller 2013; Zuberbier 2010) clearly described adequate randomisation methods. For the rest, the method of randomisation was not described or was unclear, and either we were unable to obtain further information or the trial was published before 2001 and we did not attempt to do so.
Five studies demonstrated adequate concealment of allocation using codes sealed within envelopes (Dakhale 2014; Gimenez‐Arnau 2007; Handa 2004; Monroe 2003; Pons‐Guiraud 2006). We assessed five of the studies to be at high risk of bias, as no attempt to conceal allocation was made (Anuradha 2010; Goh 1991; Makino 2012; Wu 2008; Yin 2003b). (Of these, Anuradha 2010; Wu 2008 and Yin 2003b were explicitly open‐label trials).
Blinding
Eight studies (Anuradha 2010; Kalivas 1990; Locci 1991; Makino 2012; Sener 1999; Wang 2012; Wu 2008; Yin 2003b) did not blind participants or personnel to the intervention being studied so were classed at high risk of bias. Twenty‐two studies (Dakhale 2014; Degonda 2002; Di Lorenzo 2004; Garavaglia 1995; Gimenez‐Arnau 2007; Go 1989; Goh 1991; Handa 2004; Kaplan 2005; Kint 1989; Monroe 1992; Monroe 2003; NCT00536380; Nettis 2004; Nettis 2006; Ortonne 2007; Phanuphak 1987; Pons‐Guiraud 2006; Ring 2001; Staevska 2014; Weller 2013; Zuberbier 2010) adequately blinded participants and personnel to the intervention so were judged at low risk of bias. In the remaining 45, it was unclear whether blinding was adequate. In Goh 1991, participants appear to have been adequately blinded as to the identity of the medication studied.
Only 14 of the included trials demonstrated adequate blinding of outcome assessment (Dakhale 2014; Degonda 2002; Di Lorenzo 2004; Gimenez‐Arnau 2007; Handa 2004; Kaplan 2005; Monroe 1992; Monroe 2003; Nelson 2000; Nettis 2004; Nettis 2006; Pons‐Guiraud 2006; Staevska 2014; Weller 2013); eight studies did not attempt this and were judged at high risk of bias (Anuradha 2010; Kalivas 1990; Locci 1991; Makino 2012; Sener 1999; Wang 2012; Wu 2008; Yin 2003b). For the remaining 51 studies, we rated risk of bias due to blinding of outcome assessment as unclear.
Incomplete outcome data
Some study investigators analysed their study data to show that the numbers of participants who dropped out or were withdrawn were not significantly different from the numbers analysed, but this did not mean that bias was absent, as there may have been imbalance between groups, or the reasons for dropout might have differed between groups (e.g. adverse events, lack of efficacy).
The high rate of attrition in the included trials was a problem and a potential source of bias. In 20 trials, the distribution or high number of dropouts or losses to follow‐up could have introduced bias (Beck 1985; Belaich 1990; Breneman 1995; Brostoff 1996; Commens 1978; Di Lorenzo 2004; Garavaglia 1995; Godse 2007; Goh 1991; Guo 2003; Harvey 1981; Kalivas 1990; Leynadier 2000; Marks 1980; Monroe 1988; Monroe 2003; Nelson 2000; Salo 1989; Thompson 2000 Study 2; Wu 2008); we rated these as at high risk).
A high level of dropout was a feature of seven of the included studies. In Brostoff 1996 51% of participants failed to complete the study, and Breneman 1995 had 27.3% dropouts; in Commens 1978 24% dropped out. In the four‐arm study of Di Lorenzo 2004, 38.8% of participants overall dropped out after randomisation with high losses to follow‐up, particularly in the placebo group (88%) and the montelukast group (68%). Garavaglia 1995 experienced high levels of dropout and recruited additional participants into the trial in an attempt to compensate. In Monroe 2003 19% dropped out of the desloratadine group and 31% from the placebo group. A total of 34% dropped out from the Salo 1989 study.
Eighteen studies were rated as having low risk of attrition bias (Anuradha 2010; Breneman 1996; Degonda 2002; Dubertret 1999; Grant 1988; Juhlin 1987; Kint 1989; Liu H‐N 1990; NCT00536380; Nettis 2004; Nettis 2006; Ollert 1999; Ortonne 2007; Patel 1997; Paul 1998; Peyri 1991; Phanuphak 1987; Wang 2012). In many trials, attrition data were poorly reported or were absent; despite our attempts to request further information from trial investigators, we judged the remaining 35 as having unclear risk of bias.
Selective reporting
We judged that 24 studies were at low risk of bias (Alomar 1990a; Anuradha 2010; Belaich 1990; Breneman 1995; Brostoff 1996; Dakhale 2014; Dubertret 2007; Gimenez‐Arnau 2007; Go 1989; Guo 2003; Hao 2003; Kalivas 1990; Makino 2012; NCT00536380; Nettis 2004; Nettis 2006; Ortonne 2007; Patel 1997; Phanuphak 1987; Pons‐Guiraud 2006; Ring 2001; Staevska 2014; Weller 2013; Zuberbier 2010).
We judged that 20 studies could have introduced an element of bias through selective outcome reporting (Beck 1985; Breneman 1996; Bronsky 2001; Commens 1978; Finn 1999; Gale 1989; Garavaglia 1995; Godse 2007; Goh 1991; Grant 1988; Harvey 1981; Hjorth 1988; Juhlin 1987; Juhlin 1991; Kaplan 2005; Kint 1989; Liu H‐N 1990; Monroe 1988; Salo 1989; Wu 2008). Specifically, in Beck 1985 and in Breneman 1996, outcomes were reported only in graph form or by percentage and statistical difference (with no participant numbers stated). Similarly, in Commens 1978, Gale 1989 and Godse 2007, the results for numbers of participants in each group were not reported—only mean scores with standard deviations. In Grant 1988 and Hjorth 1988, results were presented in graph form only. In Monroe 1988 only percentages and P values were given, and the origin of the P values was not stated. Salo 1989 provided only mean scores, and investigators offered a subjective judgement as to the best treatment. In Bronsky 2001 scores were given on different days; Harvey 1981 did not report adverse event results; and in Finn 1999 the analysis included results only for participants with baseline and at least one postbaseline mean pruritus score, thus a true intention‐to‐treat analysis was not provided. Juhlin 1987 states that both physician and participant self‐assessments were carried out, but the study report provides only participant perceptions with no objective data. In Juhlin 1991, extensive laboratory tests were carried out (for adverse events) but were not reported. Kaplan 2005 combined DLQI score results from two weeks and four weeks and did not provide separate scores for each time point; as we were unable to obtain the disaggregated data, we could not use these conflated interim and endpoint outcome results. Kint 1989 did not report results clearly, and as rescue medication was permitted, we could not be sure that any benefits were due to the study medications. We were unable to determine the duration of follow‐up in Liu H‐N 1990, and it was unclear whether concomitant medications were permitted, or whether study participants were compliant. Garavaglia 1995 reported no results for the placebo arm.
For the remaining 29 studies, information was insufficient to allow a judgement to be reached; we rated these as having unclear risk of bias for this domain.
Other potential sources of bias
We assessed whether each study appeared to be free of other sources of bias that could put it at high risk of bias (e.g. potential conflicts of interest, pharmaceutical funding or support). We judged studies as having unclear risk when the extent to which other factors may have introduced bias could not be determined. Of the 73 included studies, most reports were unclear in terms of other bias (Figure 2). This was the result of insufficient information to assess whether risk of bias existed in some studies (Bronsky 2001; Hoxha 2011; Marks 1980; Monroe 1988; Ortonne 2004; Sener 1999; Staevska 2014), or it reflected baseline imbalance between groups (e.g. Breneman 1995; Finn 1999). In the remaining studies judged as unclear, potential bias may have been present in the form of industry sponsorship and funding.
A total of 19 studies for which no funding or sponsorship was declared were assessed as having low risk of bias, as we detected no other bias.
Effects of interventions
See: Summary of findings for the main comparison Cetirizine 10 to 20 mg versus placebo for chronic spontaneous urticaria; Summary of findings 2 Desloratadine 5 to 20 mg versus placebo for chronic spontaneous urticaria; Summary of findings 3 Levocetirizine 5 to 20 mg versus placebo for chronic spontaneous urticaria; Summary of findings 4 Rupatadine 10 to 20 mg versus placebo for chronic spontaneous urticaria; Summary of findings 5 Loratadine 10 mg versus placebo for chronic spontaneous urticaria; Summary of findings 6 Loratadine 10 mg versus cetirizine 10 mg for chronic spontaneous urticaria; Summary of findings 7 Loratadine 10 mg versus desloratadine 5 mg for chronic spontaneous urticaria; Summary of findings 8 Loratadine 10 mg versus mizolastine 10 mg for chronic spontaneous urticaria; Summary of findings 9 Loratadine 10 mg versus emedastine 2 mg for chronic spontaneous urticaria; Summary of findings 10 Loratadine 10 mg versus hydroxyzine 25 mg for chronic spontaneous urticaria; Summary of findings 11 Cetirizine 10 mg versus hydroxyzine 25 mg for chronic spontaneous urticaria; Summary of findings 12 Hydroxyzine 25 mg versus placebo for chronic spontaneous urticaria
We have indicated in this section when our 23 comparisons of interventions addressed our prespecified outcomes (for details of outcomes, please see Types of outcome measures).
Numbers given show the total numbers of participants included in the analysis. When it was possible to calculate an effect size, we reported this with the 95% confidence interval. When the calculated effect size was statistically significant (P value < 0.05), we stated whether the result favoured the intervention group or the control condition. In the text below, an I² statistical value for heterogeneity is reported as high if it exceeds 50%.
We have summarised the results of included studies that could not be combined in meta‐analyses because of differences between studies in terms of design. We present the results of studies that could not be pooled in meta‐analyses using data and information derived from the reports of individual studies (along with P values when applicable).
Comparison 1
Loratadine 10 mg versus placebo
Two studies that compared these interventions were identified (Belaich 1990; Monroe 1992). Both studies reported short‐term and intermediate‐term interventions that favoured loratadine.
Primary outcome 2: proportion of participants with 'good' or 'excellent' response whilst taking H1‐antihistamines
Short‐term duration of intervention
In this subgroup we found only one relevant trial (Monroe 1992) (n = 12, risk ratio (RR) 3.0, 95% confidence interval (CI) 0.42 to 21.3; Analysis 1.1) (no statistically significant difference).
Intermediate‐term duration of intervention
In this subgroup we found only one relevant trial (Belaich 1990) (n = 112, RR 1.73, 95% CI 0.81 to 3.72) (no statistically significant difference). The study report states that 22/60 (loratadine) and 5/52 (placebo) participants experienced complete cessation of urticaria following an intermediate‐term duration of the intervention and that loratadine was significantly more effective than placebo (P value < 0.01).
Our meta‐analysis of Monroe 1992 and Belaich 1990, combining data from short‐ and intermediate‐term durations of intervention (n = 124), found that loratadine may increase the chance that a participant will experience a good response, expressed as RR of 1.86 (95% CI 0.91 to 3.79; P value 0.09; I² = 0%; Analysis 1.1), but this difference was not statistically significant.
Comparison 2
Loratadine 10 mg versus cetirizine 10 mg
Two studies that compared these interventions were identified (Patel 1997; Yin 2003b) (n = 103). The individual studies reported similar proportions of participants with complete suppression of urticaria.
Primary outcome 1: proportion of participants with complete suppression of urticaria whilst taking H1‐antihistamines
Short‐term duration of intervention
In this subgroup we found only one relevant trial (Patel 1997). No statistically significant difference between groups was noted (RR 1.13, 95% CI 0.64 to 2.01; participants = 37; I2 = 0%); Analysis 2.1).
Intermediate‐term duration of intervention
In this subgroup we found only one relevant trial (Yin 2003b). No statistically significant difference between groups was noted (RR 1.01, 95% CI 0.69 to 1.47; participants = 66; I2 = 0%; Analysis 2.1).
Overall, combining data from both studies (RR 1.05, 95% CI 0.76 to 1.43; n = 103; I2 = 0%); Analysis 2.1) yielded no evidence of a difference in rates of complete cessation of urticaria. Data from Yin 2003b showed that an additional proportion of participants experienced at least a good response following treatment with either drug (10/32 in the loratadine arm and 11/34 in the cetirizine arm).
Comparison 3
Loratadine 10 mg versus desloratadine 5 mg
Three studies that compared these interventions were identified (Gu 2002; Hao 2003; Zou 2002). Zou 2002 reported no significant differences in efficacy between desloratadine 5 mg once daily for four weeks and loratadine 10 mg once daily for four weeks.
Primary outcome 1: proportion of participants with complete suppression of urticaria whilst taking H1‐antihistamines
Intermediate‐term duration of intervention
Individual studies reported similar proportions of participants with complete suppression of urticaria. Comparing loratadine with desloratadine (Gu 2002; Hao 2003) revealed no significant differences between loratadine 10 mg and desloratadine 5 mg for complete suppression of disease (RR 0.91, 95% CI 0.78 to 1.06; P value 0.22; I² = 0%; Analysis 3.1).
Primary outcome 2: proportion of participants with 'good' or 'excellent' response whilst taking H1‐antihistamines
Intermediate‐term duration of intervention
In this subgroup we found three relevant trials (Guo 2003; Hao 2003; Zou 2002) (n = 410). Individual studies reported similar proportions of participants with at least good response to treatment. No significant differences between loratadine 10 mg and desloratadine 5 mg were noted (RR 1.04, 95% CI 0.64 to 1.71; Analysis 3.2), and moderate heterogeneity was exhibited (I² = 40%; P value 0.191).
Primary outcome 3: proportion of participants with 50% or greater improvement in quality of life measurements whilst taking H1‐antihistamines
Hao 2003 reported that at four weeks, 16/106 (loratadine) and 9/105 (desloratadine) participants described at least 50% improvement in quality of life (QoL) (P value 0.25).
Secondary outcome 2: minor participant‐reported adverse events not requiring withdrawal of treatment
All three studies (Guo 2003; Hao 2003; Zou 2002) individually concluded that desloratadine was a safe and effective treatment for CSU. However, we were unable to pool data on adverse events in a meta‐analysis. Desloratadine was found to be at least as effective as loratadine in each individual study but was not compared with placebo. Therefore it may be the case that desloratadine is as effective as loratadine, but this is assumed through speculative non‐superiority to loratadine.
We were unable to combine adverse effect data in a meta‐analysis because the study reports are unclear about the number of participants presenting with adverse effects in each group at each time point. Zou 2002 reported that in the desloratadine group, four participants had side effects: one severe headache, one dry mouth and two sleepiness. In the loratadine group, one participant had dry mouth and three experienced sleepiness. Hao 2003 reported that adverse effect rates of desloratadine and loratadine were 11.32% and 13.21%, respectively. The main side effects included dry mouth, dizziness and headache. Gu 2002 reported that no serious adverse effects were recorded for the duration of the study.
Comparison 4
Loratadine 10 mg versus mizolastine 10 mg
Four studies that compared these interventions were identified (Guo 2003; Leynadier 2000; Liu 2003; Yin 2003b).
The authors of Guo 2003 reported that scores for pruritus and weal number, size and persistence in the mizolastine group were much lower than those in the loratadine group (P value < 0.05). They concluded that mizolastine could be considered the preferred treatment for CSU (Guo 2003).
Primary outcome 1: proportion of participants with complete suppression of urticaria whilst taking H1‐antihistamines
Intermediate‐term duration of intervention
In this subgroup we found three relevant trials (Guo 2003; Liu 2003; Yin 2003b) (n = 316). These studies reported similar proportions of participants with complete suppression of urticaria, and no significant difference between loratadine 10 mg and mizolastine 10 mg was noted (RR 0.86, 95% CI 0.64 to 1.16; Analysis 4.1); heterogeneity was substantial (I² = 55%; P value 0.11; Analysis 4.1).
Primary outcome 2: proportion of participants with 'good' or 'excellent' response whilst taking H1‐antihistamines
These three studies also reported the proportions of participants experiencing at least a good response to treatment. In comparing loratadine with mizolastine, we found no significant differences between loratadine 10 mg and mizolastine 10 mg (RR 0.88, 95% CI 0.55 to 1.42; Analysis 4.2; P value 0.78; I² = 0%).
Primary outcome 3: proportion of participants with 50% or greater improvement in quality of life measurements whilst taking H1‐antihistamines
Intermediate‐term duration of intervention
In this subgroup we found two relevant trials (Guo 2003; Liu 2003) (n = 252). These studies reported the proportions of participants who experienced improvement in QoL of at least 50%. This amounted to 26/125 and 13/127 (loratadine and mizolastine, respectively). No significant difference between loratadine 10 mg and mizolastine 10 mg was reported in either study; when data were pooled (RR 3.21, 95% CI 0.32 to 32.33; Analysis 4.3), important levels of heterogeneity were noted (Chi² = 2.86; df = 1; P value 0.091; I² = 65%).
Secondary outcome 1: serious adverse events (i.e. serious enough to require withdrawal of treatment)
Liu 2003 reported that the incidences of adverse events for mizolastine and loratadine were 28.6% and 25.5%, respectively; no statistically significant differences between the two groups were noted (Chi2 = 0.25; P value 0.62).
Leynadier 2000 reported minor adverse events requiring withdrawal: in the mizolastine group, fatigue (n = 2) and drowsiness (n = 1); in the loratadine group, drowsiness (n = 1), dizziness (n = 1) and rhinitis (n = 1).
Guo 2003 reported that data on one participant were excluded from the analysis, but it is unclear whether this occurred because of withdrawal due to adverse effects. No clear data about adverse effects were presented, although study authors noted that no differences between the two groups were noted. Adverse effects included dry mouth, sleepiness and lethargy, but the numbers in each group experiencing these effects were not stated.
Intermediate‐term duration of intervention
Two studies (Leynadier 2000; Liu 2003) reported the numbers of participants who experienced an adverse event that led to withdrawal: One participant in the mizolastine group in Liu 2003 had severe diarrhoea, and one in Leynadier 2000 had painful erythema of the hands. In comparing loratadine with mizolastine in 267 participants, we found no significant differences between loratadine 10 mg and mizolastine 10 mg (RR 0.38, 95% CI 0.04 to 3.6; P value 0.40; I² value 0%; Analysis 4.4) in terms of the numbers of participants withdrawing because of an adverse event.
Comparison 5
Loratadine 10 mg versus emedastine 2 mg
We report the results of our analysis of a single study for this comparison (Pons‐Guiraud 2006).
The study report states that the key finding was that no significant differences between treatments at four weeks were noted by investigators or participants. Mean symptom scores improved significantly from baseline in both groups. The study authors state: "Also the proportion of patients with no symptoms at the end of treatment was similar (emedastine 52.4% versus loratadine 54.5% P = 0.41) and so was the proportion of patients with mild symptoms (total score ≤ 8) (emedastine 92.9% versus loratadine 96.1% P = 0.37)"; they also comment: "After 28 days of treatment mean symptom scores recorded in patients improved significantly versus baseline both with emedastine and loratadine (both P < 0.00005, t test for paired samples). No significant difference between groups was found (P = 0.48 for intensity of erythema, P = 0.30 for number of hives, P = 0.39 for size of the largest hive, P = 0.45 for the extent of the skin area involved and P = 0.19 for the overall assessment of urticaria symptoms)."
Primary outcome 1: proportion of participants with complete suppression of urticaria whilst taking H1‐antihistamines
Intermediate‐term duration of intervention
Among 161 participants after four weeks of therapy in Pons‐Guiraud 2006, no difference between loratadine 10 mg and emedastine 2 mg was noted for complete cessation of urticaria (RR 1.04, 95% CI 0.78 to 1.39; Analysis 5.1).
Primary outcome 2: proportion of participants with 'good' or 'excellent' response whilst taking H1‐antihistamines
Intermediate‐term duration of intervention
Among 160 participants after four weeks of therapy in Pons‐Guiraud 2006, no difference between loratadine 10 mg and emedastine 2 mg was noted for good or excellent response (RR 1.09, 95% CI 0.96 to 1.24; Analysis 5.2).
Secondary outcome 1: serious adverse events (i.e. serious enough to require withdrawal of treatment)
Intermediate‐term duration of intervention
In an analysis of 161 participants in total, one participant in each group withdrew because of adverse effects. The study report states: "Two patients were withdrawn because of serious adverse events: a suicide attempt not related to study treatment (loratadine) and a bilateral fracture of the calcaneum following a fall, which led to hospitalisation, in the emedastine group. Although the patient who fell was taking a number of medicinal products besides emedastine (paracetamol, hydroxyzine, enoxaparin, ketoprofen and omeprazole), the causal relationship with emedastine was not ruled out and considered possible."
In our analysis, no statistically significant differences between groups were noted (RR 1.09, 95% CI 0.07 to 17.14; Analysis 5.3).
Comparison 6
Loratadine 10 mg versus hydroxyzine 25 mg
Primary outcome 1: proportion of participants with complete suppression of urticaria whilst taking H1‐antihistamines
Short‐term duration of intervention
One study that compared these interventions was identified (Monroe 1992). The number of participants who experienced marked or complete relief of symptoms was 3/6 with loratadine and 3/6 with hydroxyzine (RR 1.00, 95% CI 0.32 to 3.10; Analysis 6.1).
This study reported that total symptoms score value decreased by 43% in the loratadine group and by 47% in the hydroxyzine group, although actual mean scores for each group were not reported.
Secondary outcome 2: minor participant‐reported adverse events not requiring withdrawal of treatment
Overall in Monroe 1992, eight of 20 participants in the hydroxyzine group and one of 20 in the loratadine group (some with dermatitis rather than CSU) reported sedation, a minor adverse event that did not require withdrawal of the drug; the study report states that differences between groups were significant (P value 0.02).
Comparison 7
Cetirizine 10 mg versus placebo
Four studies that compared these interventions were identified (Breneman 1995; Breneman 1996; Go 1989; Kalivas 1990).
Primary outcome 1: proportion of participants with complete suppression of urticaria whilst taking H1‐antihistamines
Short‐term duration of intervention
In this subgroup we found only one relevant trial (Go 1989) (n = 56). A statistically significant difference between cetirizine 10 mg to 20 mg and placebo was reported (RR 2.80, 95% CI 1.17 to 6.73; Analysis 7.1).
Intermediate‐term duration of intervention
In this subgroup we found only one relevant trial (Breneman 1995) (n = 122). A statistically significant difference between cetirizine 10 mg to 20 mg and placebo was reported (RR 2.66, 95% CI 1.2 to 5.9; Analysis 7.1).
Meta‐analysis
Combining the results of two studies across short‐term and Intermediate‐term durations of intervention revealed that 32/88 and 12/90 participants experienced complete cessation of urticaria following treatment (cetirizine and placebo, respectively) (RR 2.72, 95% CI 1.51 to 4.91; P value < 0.001; I² = 0%; Analysis 7.1). Thus, strong evidence showed that cetirizine increased the chance of complete cessation of disease.
Primary outcome 2: proportion of participants with 'good' or 'excellent' response whilst taking H1‐antihistamines
One study (Breneman 1995) reported that at least a good response following treatment was seen in 45/60 and 29/62 participants (cetirizine and placebo, respectively) (P value 0.001).
Secondary outcome 1: serious adverse events (i.e. serious enough to require withdrawal of treatment)
Intermediate‐term duration of intervention
In this subgroup we found two relevant trials (Breneman 1995; Breneman 1996) (n = 247). No significant differences between cetirizine 10 mg to 20 mg and placebo were reported (RR 4.6, 95% CI 0.79 to 26.67; Analysis 7.2).
Intermediate‐term duration of intervention
In this subgroup we found only one relevant trial (Kalivas 1990) (n = 142). No significant differences between cetirizine 10 mg to 20 mg and placebo were reported (RR 1.06, 95% CI 0.07 to 16.59; Analysis 7.2).
Meta‐analysis
These three studies (Breneman 1995; Breneman 1996; Kalivas 1990) of 389 participants in total, reported that seven participants withdrew because of adverse events whilst taking cetirizine, and two withdrew whilst taking placebo (RR 3.00, 95% CI 0.68 to 13.22; P value 0.15; I² = 0%; Analysis 7.2). This does not constitute adequate evidence to suggest that cetirizine is associated with increased risk of withdrawal due to an adverse event.
Comparison 8
Cetirizine 10 mg versus hydroxyzine 25 mg
Efficacy was not reported in a form commensurate with the outcome measures of our review in either of the two studies that compared these interventions (Breneman 1996; Kalivas 1990).
Secondary outcome 1: serious adverse events (i.e. serious enough to require withdrawal of treatment)
Intermediate‐term duration of intervention (cetirizine 10 mg)
In this subgroup we found only one relevant trial (Breneman 1996) (n = 123). No significant differences between cetirizine 10 mg and hydroxyzine 25 mg were noted (RR 1.05, 95% CI 0.27 to 4.01; Analysis 8.1).
Intermediate‐term duration of intervention (cetirizine 5 mg to 25 mg)
In this subgroup we found only one relevant trial (Kalivas 1990) (n = 138). No significant differences between cetirizine 10 mg and hydroxyzine 25 mg were noted (RR 0.33, 95% CI 0.04 to 3.13; Analysis 8.1).
Meta‐analysis
Both studies reported the numbers of participants who withdrew because of an adverse event. Combining the two (n= 260 participants) (RR of withdrawal 0.78, 95% CI 0.25 to 2.45; P value 0.67; I² = 0%; Analysis 8.1) revealed no evidence of a difference.
Comparison 9
Cetirizine 10 mg versus fexofenadine 180 mg
One study that compared these interventions was identified (Handa 2004). No analysis was possible for this comparison.
Primary outcome 1: proportion of participants with complete suppression of urticaria whilst taking H1‐antihistamines
The key finding was that at four weeks, 27/59 participants in the cetirizine group had complete suppression of urticaria compared with 2/57 in the fexofenadine group (P value < 0.001). According to the study authors, partial improvement was seen in a further 19 participants in each group. No improvement was noted among six participants in the cetirizine group and 24 in the fexofenadine group.
Secondary outcome 2: minor participant‐reported adverse events not requiring withdrawal of treatment
Minor adverse events noted in the cetirizine group included drowsiness (four), constipation (three), epigastric pain (two) and cough (two). In the fexofenadine group, drowsiness was experienced by two participants; headache, swollen feet and abdominal pain were reported by one participant.
Comparison 10
Cetirizine 10 mg versus levocetirizine 5 mg
One study that compared these interventions was identified (Yin 2003a). No analysis was possible for this comparison.
Primary outcome 1: proportion of participants with complete suppression of urticaria whilst taking H1‐antihistamines
This study reported that 16/22 and 19/22 participants had complete suppression of urticaria following treatment with cetirizine and levocetirizine, respectively, at 28 days (P value 0.309). A further two participants had at least a good response to cetirizine and one to levocetirizine, but without complete clearance. Overall there was no statistically significant difference in clinical efficacy between the two groups was noted (P value > 0.05).
Secondary outcome 1: serious adverse events (i.e. serious enough to require withdrawal of treatment)
No participants withdrew from this study as the result of an adverse event.
Comparison 11
Cetirizine 10 mg versus mizolastine 10 mg
One study that compared these interventions was identified (Yin 2003b). No analysis was possible for this comparison.
Primary outcome 1: proportion of participants with complete suppression of urticaria whilst taking H1‐antihistamines
This study reported that 21/34 and 20/30 participants had complete suppression of urticaria following treatment with cetirizine and mizolastine, respectively (P value 0.600). This study also reported that a further 11/34 and 9/30 had a good response to treatment.
Comparison 12
Desloratadine 5 mg to 20 mg versus placebo
Six studies that compared these interventions were identified (Di Lorenzo 2004; Hoxha 2011; Monroe 2003; Nettis 2004; Ortonne 2007; Ring 2001). Ortonne 2007 did not provide outcome data on efficacy that could be included in our meta‐analyses.
Primary outcome 1: proportion of participants with complete suppression of urticaria whilst taking H1‐antihistamines
Two studies (Di Lorenzo 2004; Hoxha 2011) reported on complete suppression of urticaria. A short‐term duration of intervention was used in one study (Hoxha 2011), which investigated three doses compared with placebo and reported that 4/34, 11/34, 21/34 and 0/36 (desloratadine 5 mg, 10 mg and 20 mg and placebo) achieved resolution of symptoms. Following an intermediate‐term duration of intervention, one study (Di Lorenzo 2004) reported complete suppression of urticaria in 18/40 (desloratadine 5 mg) and 0/40 (placebo) (additional data supplied by investigator); the report of the study states that the difference between the total symptom scores for the desloratadine and placebo groups was statistically significant (P value < 0.001).
These data from Hoxha 2011 suggest an association between dosage and an increased chance of complete suppression of urticaria. We did not pool data across all dosages and durations of intervention (Analysis 9.1), but as no participants allocated to placebo exhibited suppression of urticaria, Fisher's exact test was used to compare the two interventions (53/142 desloratadine and 0/76 placebo), resulting in a 95% CI for the odds ratio (OR) of between 7.12 and infinity (P value < 0.001),
Additional data obtained from the principal investigator of Di Lorenzo 2004 revealed that 22/40 in the intervention group and 0/40 in the placebo group experienced an 'excellent' response (P value < 0.001).
Primary outcome 3: proportion of participants with 50% or greater improvement in quality of life measurements whilst taking H1‐antihistamines
The numbers of participants who exhibited improvement in QoL (Ortonne 2007) were 34/49 and 23/36 in the desloratadine 5 mg and placebo groups, respectively. The study report states: "Desloratadine treatment was associated with significantly greater improvements from baseline to day 42 compared with placebo in DLQI overall score (–6 versus –2.2 points; P < 0.002) and VQ‐Dermato score (18.5 versus 29.1 points; P = 0.009)."
Secondary outcome 1: serious adverse events (i.e. serious enough to require withdrawal of treatment)
Intermediate‐term duration of 5 mg of intervention
In this subgroup we found three relevant trials (n = 466).
Three studies (Monroe 2003; Nettis 2004; Ring 2001) of 466 participants, reported similar numbers of participants who withdrew as the result of adverse events, totalling 6/236 and 4/230 (desloratadine 5 mg and placebo, respectively). No significant difference between desloratadine 5 mg and placebo were noted (RR 1.46, 95% CI 0.42 to 5.1; Analysis 9.2).
Differences between the three studies were examined: Monroe 2003 excluded participants with previous lack of response to antihistamines, but this exclusion criterion was not stated in the reports of Nettis 2004 and Ring 2001.
Comparison 13
Hydroxyzine 25 mg versus placebo
Three studies that compared these interventions were identified (Breneman 1996; Kalivas 1990; Monroe 1992). Efficacy was not reported in Breneman 1995 or Kalivas 1990 in a form commensurate with the outcome measures of our review.
Primary outcome 1: proportion of participants with complete suppression of urticaria whilst taking H1‐antihistamines
Short‐term duration of intervention
One study (Monroe 1992) stated that 3/6 and 1/6 participants exhibited at least a good response (marked or complete relief of symptoms) following treatment (hydroxyzine and placebo, respectively). After a reanalysis using Fisher's exact test because of the small number of participants, no difference between interventions was reported (P value 0.27).
The study report stated that for this outcome, differences between the placebo group and the two treated groups (hydroxyzine and loratadine) were statistically significant (P value < 0.05). The small number of included participants limits firm conclusions that can be drawn from this outcome.
Secondary outcome 1: serious adverse events (i.e. serious enough to require withdrawal of treatment)
Intermediate‐term duration of intervention
In a meta‐analysis of Breneman 1996 and Kalivas 1990 (n = 270), the pooled RR was 3.64 (95% CI 0.77 to 17.23; P value 0.10; I² = 0%; Analysis 10.1). Therefore little evidence of differences between interventions was found.
Comparison 14
Levocetirizine 5 mg to 20 mg versus placebo
Two studies that compared these interventions were identified (Hoxha 2011; Nettis 2006).
Primary outcome 1: proportion of participants with complete suppression of urticaria whilst taking H1‐antihistamines
Following a short‐term duration of intervention, Hoxha 2011 reported complete suppression of urticaria as 9/37, 17/37, 30/37 and 0/37 (levocetirizine 5 mg, 10 mg, 20 mg and placebo). In one intermediate‐term duration of intervention study (Nettis 2006), complete suppression was noted in 27/51 and 0/51 participants (levocetirizine 5 mg and placebo). No participants in the placebo arm achieved complete suppression of urticaria (Analysis 11.1).
Analysis of the total counts was carried out with Fisher's exact test; the 95% CI for the OR was between 11.12 and infinity (P value < 0.001), suggesting that use of levocetirizine at least 5 mg increased the chance of complete suppression of CSU.
Secondary outcome 1: serious adverse events (i.e. serious enough to require withdrawal of treatment)
No withdrawals due to adverse events were seen in either arm following treatment (0/51 and 0/49, levocetirizine 5 mg and placebo; Nettis 2006). No serious adverse events were noted with levocetirizine (at any dose) in the study by Hoxha 2011.
No data are available on the adverse events that followed when a higher than standard dosage (10 mg and 20 mg per day) of levocetirizine was prescribed.
Comparison 15
Rupatadine 10 mg to 20 mg versus placebo
Primary outcome 2: proportion of participants with 'good' or 'excellent' response whilst taking H1‐antihistamines
Intermediate‐term duration of intervention (rupatadine 10 mg)
In this subgroup we found only one relevant trial (Gimenez‐Arnau 2007) (n = 122). No significant difference between rupatadine 10 mg and placebo was reported (RR 1.28, 95% CI 0.86 to 1.91; Analysis 12.1).
Intermediate‐term duration of intervention (rupatadine 20 mg)
In this subgroup we found only one relevant trial (Gimenez‐Arnau 2007) (n = 123). No significant difference between rupatadine 20 mg and placebo was reported (RR 1.42, 95% CI 0.98 to 2.06; Analysis 12.1).
Meta‐analysis
The pooled RR between rupatadine (at both doses) and placebo in 245 participants was 1.35 (95% CI 1.03 to 1.77; P value 0.03; I² = 0%; Analysis 12.1); thus rupatadine increased the chance of a good response, but little evidence was found to indicate that 10 mg is more effective than 20 mg.
Comparison 16
Desloratadine 5 mg to 20 mg versus levocetirizine 5 mg to 20 mg
Two studies that compared these interventions were identified (Hoxha 2011; Potter 2009). No meta‐analysis was possible for this comparison.
Primary outcome 1: proportion of participants with complete suppression of urticaria whilst taking H1‐antihistamines
In Hoxha 2011, a three‐arm study, 107 participants were randomly assigned to double‐blind treatment with levocetirizine, desloratadine or placebo (37/34/36). Treatment started at a dose of 5 mg and then was increased weekly to 10 mg and 20 mg. The numbers of participants who exhibited complete suppression of urticaria following a week at each dose were as follows: 9/37, 17/37 and 30/37 (levocetirizine 5 mg, 10 mg and 20 mg) and 4/34, 11/34 and 21/34 (desloratadine 5 mg, 10 mg and 20 mg).
Primary outcome 2: proportion of participants with 'good' or 'excellent' response whilst taking H1‐antihistamines
A total of 294/438 and 256/448 participants in Potter 2009 exhibited at least a good response following treatment with levocetirizine 5 mg and desloratadine 5 mg. The report of the study states that levocetirizine "Decreased pruritus duration and the mean CSU composite scores to a significantly greater extent than desloratadine during the first week (P=0.002 and 0.005, respectively) and over the entire study (P=0.009 and P<0.05, respectively)."
Secondary outcome 2: minor participant‐reported adverse events not requiring withdrawal of treatment
No serious adverse effects occurred with desloratadine. The authors of Hoxha 2011 concluded that increasing the dose of either drug up to four‐fold was beneficial without compromising safety, and that levocetirizine appeared to be more effective than desloratadine (P value < 0.02).
Comparison 17
Ebastine 10 mg versus placebo
One study that compared these interventions was identified (Peyri 1991).
Primary outcome 1: proportion of participants with complete suppression of urticaria whilst taking H1‐antihistamines
In this study, 38/91 and 22/86 participants (ebastine and placebo, respectively) exhibited complete suppression of urticaria following an intermediate‐term duration of intervention (Fisher's exact test P value 0.13). According to the investigators' assessment, overall efficacy was good or moderate in 76/95 participants (80%) treated with ebastine compared with 52/102 participants (51%) treated with placebo (P value < 0.001). Study investigators concluded that ebastine could be an affective alternative to other non‐sedating antihistamines.
Secondary outcome 1: serious adverse events (i.e. serious enough to require withdrawal of treatment)
A similar number of participants in each group withdrew from this study because of an adverse event: 2/91 and 3/86 (ebastine and placebo, respectively; Fisher's exact test P value 0.68).
Comparison 18
Desloratadine 5 mg versus montelukast 10 mg
One study that compared these interventions was identified (Di Lorenzo 2004). No analysis was possible for this comparison.
In the desloratadine group, 18/40 achieved complete suppression of CSU and 22/40 had an excellent response, whilst in the montelukast group, 4/40 achieved remission and 1/40 had an excellent response (P value 0.008 and P value < 0.001). It is interesting to note that 33/40 in the montelukast group showed no change with the intervention, and two individuals actually felt worse. Significant differences in total symptoms score, pruritus, number of hives and size of largest hive were noted (P value < 0.001, P value < 0.001, P value 0.017 and P value 0.003, respectively). Similar significant difference were noted between groups of desloratadine plus montelukast versus montelukast alone (P value < 0.001, P value < 0.001, P value 0.01 and P value 0.003). No difference was found between the group treated with desloratadine alone and the group treated with desloratadine plus montelukast.
Secondary outcome 2: minor participant‐reported adverse events not requiring withdrawal of treatment
Adverse events were noted to be of low incidence and mild in all groups. Withdrawals, reported in large numbers in this study, appear to have been due to lack of efficacy in the groups not receiving desloratadine—not to adverse effects.
Comparison 19
Fexofenadine 180 mg versus placebo
One study that compared this intervention was identified (Kaplan 2005). No analysis was possible for this comparison.
Primary outcome 1: proportion of participants with complete suppression of urticaria whilst taking H1‐antihistamines
No significant differences in complete suppression were reported between the interventions: 6/91 and 19/162 (placebo and fexofenadine, respectively; P value 0.272).
Primary outcome 2: proportion of participants with 'good' or 'excellent' response whilst taking H1‐antihistamines
However, a difference was suggested between the proportions of participants who experienced at least a good response (11/91 and 57/162, placebo and fexofenadine, respectively; P value < 0.001). This study excluded participants who were previously unresponsive to antihistamines, so this result may not be generalisable.
Secondary outcome 2: minor participant‐reported adverse events not requiring withdrawal of treatment
Whether any participants required treatment withdrawal as the result of adverse effects was not stated, although one individual in the fexofenadine group required hospital admission for asthma. We conclude that this event is not likely to have been related to the intervention.
Comparison 20
Ketotifen 1 mg versus placebo
One study that compared these interventions was identified (Phanuphak 1987). No analysis was possible for this comparison.
Primary outcome 2: proportion of participants with 'good' or 'excellent' response whilst taking H1‐antihistamines
A total of 12/16 (ketotifen) and 2/14 (placebo) participants reported at least a good response (P value < 0.005). Notably, participants were permitted to take a different H1‐antihistamine, chlorpheniramine 4 mg as required up to six‐hourly, then were randomly assigned to ketotifen or placebo and were still allowed to take chlorpheniramine concomitantly. Investigators recorded the number of chlorpheniramine tablets taken, but this information was not reported explicitly. Study investigators noted that the requirement for chlorpheniramine dropped in significantly more participants taking ketotifen than placebo (94% vs 7%). It is still possible that positive results in the ketotifen group might have been caused by this alone, or by taking a combination of ketotifen and chlorpheniramine.
Secondary outcome 2: minor participant‐reported adverse events not requiring withdrawal of treatment
No participants were withdrawn from either treatment as the result of an adverse event.
Comparison 21
Cetirizine 5 mg and hydroxyzine 25 mg (CH) versus placebo
These interventions were compared in one study on the clinical efficacy of a leukotriene receptor antagonist (LRA) plus an H1‐antihistamine, an H1‐antihistamine plus H2RA, two H1‐antihistamines in combination and placebo for treating participants with CSU (Wan 2009). We compared only the H1‐antihistamine combination and placebo arms. No analysis was possible for this comparison.
Primary outcome 2: proportion of participants with 'good' or 'excellent' response whilst taking H1‐antihistamines
This study reported that 7/30 participants in the CH group and 0/30 in the placebo group experienced at least a good response following treatment after an intermediate‐term duration of intervention (P value 0.01). Investigators concluded: "The combination of LRA and H1 receptor antagonist is promising for CSU treatment and is reasonably well tolerated by participants. The combination of H1‐ and H2‐receptor antagonists provided the greatest treatment efficacy by the measures used in this small study."
Comparison 22
Azelastine 2 mg versus azelastine 4 mg
One study that compared these interventions was identified (Wu 2008). No analysis was possible for this comparison.
Primary outcome 1: proportion of participants with complete suppression of urticaria whilst taking H1‐antihistamines
This study reported that 21/34 (2 mg) and 27/33 (4 mg) participants experienced complete suppression of CSU following an intermediate intervention (P value 0.103).
Primary outcome 2: proportion of participants with 'good' or 'excellent' response whilst taking H1‐antihistamines
A further 6/34 (2 mg) and 4/33 (4 mg) participants exhibited good or excellent response to treatment over the same period (P value 0.637).
Comparison 23
Doxepin 10 mg versus pheniramine 22.5 mg
One study that compared these interventions was identified, although participants previously non‐responsive to antihistamines were excluded (Ghosh 1990). No analysis was possible for this comparison.
Primary outcome 1: proportion of participants with complete suppression of urticaria whilst taking H1‐antihistamines
Following an intermediate‐term duration of intervention, 8/28 and 3/28 participants experienced complete suppression of urticaria (doxepin and pheniramine, respectively; P value < 0.001). Within seven days of treatment cessation, symptoms recurred in three of the participants (37.5%) who had taken doxepin and in all three who had taken pheniramine (P value 1.00).
Secondary outcome 2: minor participant‐reported adverse events not requiring withdrawal of treatment
Although drowsiness and dry mouth were commonly reported in both groups (doxepin 37.5% and 64.3%, respectively; pheniramine 60.7% and 46.4%, respectively), no withdrawals from this study were reported.
Sensitivity and subgroup analyses
Only one comparison consisting of two studies (n = 260) compared hydroxyzine first‐generation ('sedating') and cetirizine second‐generation ('non‐sedating') antihistamines individually (see Comparison 8). No difference in adverse effects leading to withdrawal was reported between these two groups (RR 0.78, 95% CI 0.25 to 2.45; Analysis 8.1).
Discussion
Summary of main results
This review included 73 randomised studies with 9759 participants. For inclusion in our review, we would have preferred all studies to define their inclusion criteria explicitly as individuals with urticaria for a duration of at least six weeks, with the exclusion of those with inducible urticaria. To avoid excluding multiple studies that were likely to be relevant, we included studies that clearly stated the diagnosis under investigation as chronic spontaneous (or idiopathic or ordinary) urticaria, with nothing included in the paper to contradict this.
All studies were carried out in a secondary care setting, which included hospitals, research centres and dermatology centres. Participants were adults or were 12 years of age or older, and most were female.
Seventeen studies looked at short‐term response to treatment of up to 2 weeks' duration, whilst 55 assessed intermediate response (longer than two weeks to three months). One study did not mention the duration of treatment or follow‐up. No study looked at a long‐term response of three months and beyond. Chronic spontaneous urticaria (CSU) can persist for years, and it would be useful for future studies to address whether treatments are effective over a longer period.
Considerable variation was noted in the interventions and comparators used in included studies; this limited the number of analyses that we could carry out. Additionally, pooling of data was not feasible for most of the treatment options, as the outcomes reported were not comparable. Of the 23 comparisons we were able to make, 10 provided outcome data that could be combined in meta‐analyses. Thus most of our findings are based on results from individual trials.
Evidence suggests that some antihistamines appear to be more effective than placebo in achieving complete suppression of urticaria. This is the case for cetirizine 10 mg in the short term and in the intermediate term. Levocetirizine 20 mg over the short term also appears to be effective for complete suppression of urticaria (Hoxha 2011); however Hoxha 2011 has been published only as a conference abstract, and a fuller report or further information was unavailable at the time of writing of this review. The Nettis 2006 study found levocetirizine 5 mg to be considerably more likely to lead to complete suppression of urticaria over an intermediate‐term duration than Hoxha 2011 over a short duration. Given that this information was derived from only two studies, each with some factors carrying an unclear risk of bias, it may be the case that levocetirizine is more beneficial when used for a longer duration.
Rupatadine in the study of Gimenez‐Arnau 2007 was effective (good or excellent response) at 10 mg or 20 mg when compared against placebo. However, no difference was demonstrated between doses.
Meta‐analyses assessing response to treatment with loratadine 10 mg indicate that its efficacy was not significantly different from that of placebo in the short and intermediate time frame (intervention for up to three months) for the outcome of 'good or excellent response' (Belaich 1990; Monroe 1992).
Comparisons of desloratadine versus placebo suggested a possible relationship between dose, duration and response: Lower doses (5 mg) with a shorter intervention period led to similar results, but a longer duration of a low dose (5 mg) or a shorter duration of a higher dose (20 mg) led to a higher rate of complete suppression of urticaria. In Hoxha 2011, different doses of desloratadine 5 mg to 20 mg were compared with doses of levocetirizine 5 mg to 20 mg; study investigators concluded: "increasing dose up to four‐fold in both active groups was beneficial without compromising safety. Levocetirizine appeared to be more effective than desloratadine" (P value < 0.02).
In comparisons of more than one active intervention, no significant difference was found between loratadine 10 mg and cetirizine 10 mg at short‐ or intermediate‐term durations in bringing about complete suppression of urticaria (Patel 1997; Yin 2003b).
Similarly, for loratadine 10 mg versus desloratadine 5 mg for complete suppression of urticaria and for good or excellent response, no statistically significant difference was noted between groups over an intermediate term of intervention (Gu 2002; Zou 2002).
For loratadine 10 mg versus mizolastine 10 mg, again with an intermediate term of intervention, no statistically significant difference was noted between groups for complete suppression of urticaria and for 'good or excellent response' (Guo 2003; Liu 2003; Liu H‐N 1990; Yin 2003b). Loratadine 10 mg versus emedastine 2 mg (one study; n = 161) showed no statistically significant difference for complete suppression or good or excellent response, or for withdrawals due to adverse effects (Pons‐Guiraud 2006).
We investigated the frequency with which adverse events led to withdrawal of treatment. No significant differences were observed in efficacy or adverse events compared with placebo in the intermediate term for cetirizine (doses from 5 mg to 20 mg) (Breneman 1995; Breneman 1996; Kalivas 1990), desloratadine (5 mg) (Monroe 2003; Nettis 2004; Ring 2001) or hydroxyzine (25 mg) (Breneman 1996; Kalivas 1990).
For withdrawals in comparisons of two active interventions, no significant differences were noted between loratadine 10 mg and mizolastine 10 mg (Leynadier 2000; Liu 2003), loratadine 10 mg and emedastine 2 mg (Pons‐Guiraud 2006), cetirizine 10 mg and hydroxyzine 25 mg (Breneman 1996) and cetirizine 5 mg to 25 mg and hydroxyzine 25 mg (Kalivas 1990).
Quality of life was assessed in one comparison of two trials (Guo 2003; Liu 2003), but no difference was noted between loratadine 10 mg and mizolastine 10 mg in the proportion of participants with at least 50% improvement in quality of life.
Overall completeness and applicability of evidence
The studies that met our criteria for inclusion in this review were conducted all over the world. We searched exhaustively and identified studies conducted in many disparate populations, including those in the USA, Australia, various European countries, South America, China, Taiwan and India. We also searched for reports on clinical trials in progress and for data from completed but unpublished clinical trials. Translation of all relevant non‐English studies was conducted, and data were extracted and included. Most Japanese studies defined CSU as lasting four weeks or longer, and as this differed from our more generally recognised definition of CSU as lasting six weeks or longer, they could not be included. Evidence within this review should be applicable to all populations in which antihistamines are used for the treatment of CSU.
After discussion and consensus, we excluded studies that compared terfenadine and astemizole unless other comparison trial arms included interventions. These drugs are no longer in use for the treatment of urticaria because of safety concerns.
It is interesting to note that eight studies excluded participants previously unresponsive to antihistamines. The effect of this is that a subset of those with CSU who were more likely to be refractory to the intervention were screened out. These may be individuals with more severe disease. This could have a large effect on observed efficacy of an antihistamine in this trial, although it does not render in‐trial comparisons of different antihistamines completely invalid.
The duration of CSU varies among individuals, although the mean duration may be prolonged (three to five years), and a small proportion of people can have CSU for longer than 20 years (Demera 2001; Kaplan 2005). It was disappointing to note that the duration of interventions used in the studies included in this review was relatively short (up to six weeks), and longer‐term data are not available.
It would also have been of interest to analyse each study by itch, weal numbers and angio‐oedema separately, as itch is a different symptom from swellings, even though both are mediated by histamine. Some of the original product licences for classical antihistamines were based on itch suppression rather than reduction in wealing. Itch is often the most troublesome symptom for people in terms of impairment of quality of life because of its effect on sleep and its general propensity to cause distress. In clinical practice, patients may refer to improvement in itch but not weals (or the opposite) rather than both, so treatment effects should ideally be reported separately rather than as an overall assessment of improvement. Furthermore, physician‐rated scales of itch are a contradiction, as it is only the individual with the symptom who can rate this. In our review, we were unable to look at itch or weal numbers separately because not all of the included studies reported these consistently. and our focus was on urticaria rather than angio‐oedema. We were reluctant to undertake further subgroup analyses because the likelihood of false‐positive significance tests increases as more subgroup analyses are performed.
Quality of the evidence
The included studies had notable methodological limitations; only 12 were clearly adequately randomised, and the randomisation method used in the rest was unclear or at high risk. Only four described adequate allocation concealment; in the remaining studies, this was unclear or was judged to confer high risk of selection bias. Blinding of participants and personnel was adequate in only 20 studies, and blinding of outcome assessors was adequate in 14. Twenty studies were at risk of bias from incomplete reporting of outcome data (attrition bias), and 20 studies were at high risk of selective reporting bias. We detected other sources of bias including baseline imbalance within groups and potential bias from industry sponsorship or funding in 55 of the included studies, but the extent to which these factors may have introduced bias was unclear. It is therefore important to emphasise that any conclusions that we have drawn are reliant on primary studies with varying degrees of bias. Risk of bias should be considered when these results are interpreted (Figure 2), and findings derived from studies with high or unclear risk of bias should be viewed with caution.
Although we included a large number of studies, only a few for each comparison reported outcome data that could be incorporated in meta‐analyses. Several studies included small numbers of participants. We have drawn limited conclusions from single study analyses, or we have reported the results of the trial narratively or we have presented results from small meta‐analyses of up to three studies (e.g. loratadine vs desloratadine, n = 410 from three studies; loratadine vs mizolastine, n = 204 from three studies).
Some studies showed some statistical heterogeneity, for example, for the comparison of loratadine versus desloratadine, and loratadine versus mizolastine. We give reasons for downgrading the quality of the body of evidence for each comparison in the 'Summary of findings' tables (summary of findings Table for the main comparison; summary of findings Table 2; summary of findings Table 3; summary of findings Table 4; summary of findings Table 5; summary of findings Table 6; summary of findings Table 7; summary of findings Table 8; summary of findings Table 9; summary of findings Table 10; summary of findings Table 11; summary of findings Table 12) (as described in the footnotes of each table). Overall, the quality of evidence in each comparison was rated as low in most studies or of moderate quality, meaning that further research is likely to have an important impact on our confidence in the estimate of effect and may change the estimate. The current body of evidence does not, therefore, allow robust conclusions.
Potential biases in the review process
Risk of bias was assessed for all studies. Although we requested additional details of trial conditions from study investigators, in many cases we were unable to determine whether randomisation and allocation concealment methods were adequate. Overall, a high proportion of the included studies were assessed as having unclear or high risk of bias. Most although not all trials published within the past 10 years provided enough information to enable full assessment of risk of bias. Many studies were at high risk of attrition bias as the result of dropouts and losses to follow‐up. This could often be attributed to participants who did not experience symptomatic relief in the placebo arm of trials.
Of the 73 included studies with 9759 randomly assigned participants, 31 were stated to be sponsored by the pharmaceutical industry, and six through research grants or non‐profit organisations. It is unclear whether sponsorship was a source of bias in these trials.
We attempted to minimise publication bias by seeking out results of unpublished trials. This review included 73 studies, of which 35 provided outcome data for 23 comparisons. Therefore, even though we have included a large number of studies, clinical diversity and variation in the ways in which results were reported led to only a few meta‐analyses. Whilst every effort was made to minimise the introduction of bias in this review, clinically divergent interventions led to wide confidence intervals and potentially imprecise results. Sensitivity analysis was not possible for primary outcomes measures for studies at low risk of bias, as studies were too few to permit assessment of the results of the review in this way.
Although the evidence for cetirizine is somewhat more robust than for other antihistamines, it should be borne in mind that cetirizine was effective in suppressing urticaria completely in only some participants. Bias may be present here because cetirizine has been on the market for a long time and more data are available for this agent in comparison with other drugs.
We were unable to include data from studies of participants with varying types of urticaria if no disaggregated data specific to the participants with CSU were available. Although some such studies may provide valuable information, we excluded them, as any conclusions that we derived from studies with mixed populations may not be applicable to populations with CSU.
The clinical heterogeneity that was present in the included studies in terms of populations, interventions and outcomes contributed to difficulties in pooling data for analysis. In some cases, smaller unpublished studies that reported outcomes that fit our inclusion criteria contributed data to several meta‐analyses (e.g. Hoxha 2011).
Agreements and disagreements with other studies or reviews
Kavosh 2011 reviewed second‐generation H1‐antihistamines and found that limited data on comparisons of antihistamines led to the recommendation to use cetirizine in preference to fexofenadine. In our review, the main finding from the key study (Handa 2004) was that at four weeks, 27/59 participants in the cetirizine group had complete suppression of urticaria as compared with 2/57 in the fexofenadine group (P value < 0.001). However, this result was derived from only 116 participants and no meta‐analysis was possible, so the finding may not be wholly conclusive.
The findings of this review are broadly in agreement with those of the Kavosh 2011 review, which recommended use of levocetirizine in preference to desloratadine. In our review, two studies were identified that compared these interventions (Hoxha 2011; Potter 2009). In Hoxha 2011, study investigators concluded: "Increasing dose up to four‐fold in both active groups was beneficial without compromising safety. Levocetirizine appeared to be more effective than desloratadine" (P value < 0.02). However, this study was published only as a conference abstract, and we were unable to obtain study data from study investigators. Participants in Potter 2009 demonstrated at least good response following treatment with levocetirizine 5 mg and desloratadine 5 mg. Levocetirizine "...decreased pruritus duration and the mean CSU composite scores to a significantly greater extent than desloratadine during the first week (P=0.002 and 0.005, respectively) and over the entire study (P=0.009 and P<0.05, respectively)." No meta‐analysis was possible for this comparison.
Other studies have investigated treatment with H1‐antihistamines at higher than recommended licensed doses (e.g. Finn 1999; Nelson 2000; Weller 2013). In our review, one study compared different doses of fexofenadine, but the outcomes did not fit our criteria (Nelson 2000). Furthermore, in this trial, participants previously unresponsive to antihistamines were excluded.
A review by Church 2012 concluded that three clinical studies (Hong 2010; Potter 2009; Staevska 2010) suggested that H1‐antihistamines, or at least desloratadine and levocetirizine, are efficacious in the treatment of CSU. However, we excluded Hong 2010 and Staevska 2010 from our review, as they included participants outside our inclusion criteria. We agree with the authors of Church 2012 that an independent multi‐centre study could provide valuable information about the relative efficacy of these interventions. Currently available evidence for use of higher doses of H1‐antihistamines for CSU is limited, and no long‐term data are available for any of the trials.
Guidelines of the British Association of Dermatologists for management of urticaria (Grattan 2007) suggested that patients should be offered the choice of at least two non‐sedating H1‐antihistamines, and that benefits of increasing the dose to above the licensed limit may outweigh risks, but we found limited evidence in our included studies to support this approach.

Study flow diagram.

Risk of bias graph: review authors' judgements about each risk of bias item presented as percentages across all included studies.
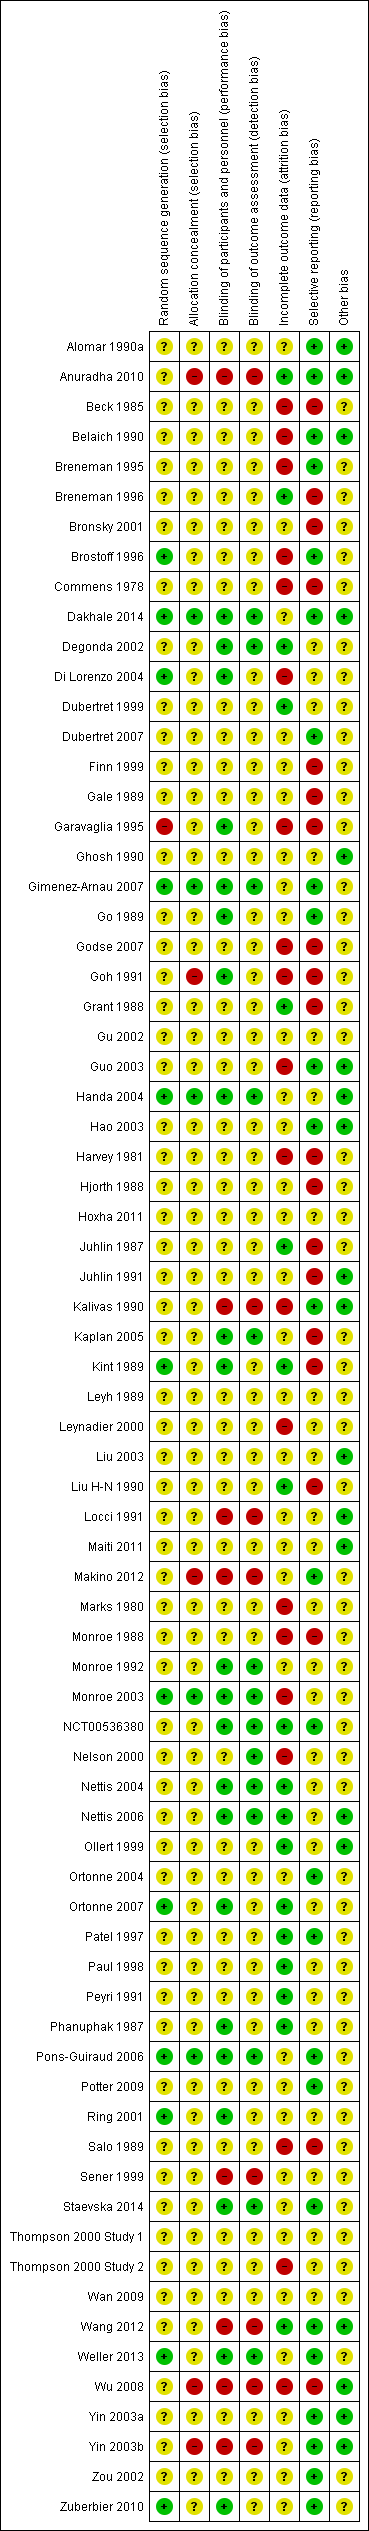
Risk of bias summary: review authors' judgements about each risk of bias item for each included study.

Comparison 1 Loratadine 10 mg versus placebo, Outcome 1 Proportion of participants with 'good' or 'excellent' response whilst taking H1‐antihistamines.

Comparison 2 Loratadine 10 mg versus cetirizine 10 mg, Outcome 1 Proportion of participants with complete suppression of urticaria whilst taking H1‐antihistamines.

Comparison 3 Loratadine 10 mg versus desloratadine 5 mg, Outcome 1 Proportion of participants with complete suppression of urticaria whilst taking H1‐antihistamines.

Comparison 3 Loratadine 10 mg versus desloratadine 5 mg, Outcome 2 Proportion of participants with 'good' or 'excellent' response whilst taking H1‐antihistamines.

Comparison 4 Loratadine 10 mg versus mizolastine 10 mg, Outcome 1 Proportion of participants with complete suppression of urticaria whilst taking H1‐antihistamines.
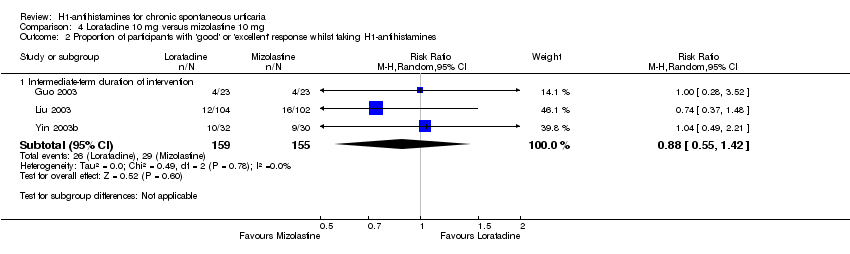
Comparison 4 Loratadine 10 mg versus mizolastine 10 mg, Outcome 2 Proportion of participants with 'good' or 'excellent' response whilst taking H1‐antihistamines.
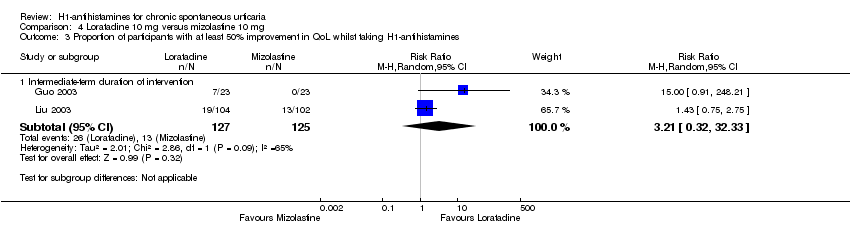
Comparison 4 Loratadine 10 mg versus mizolastine 10 mg, Outcome 3 Proportion of participants with at least 50% improvement in QoL whilst taking H1‐antihistamines.
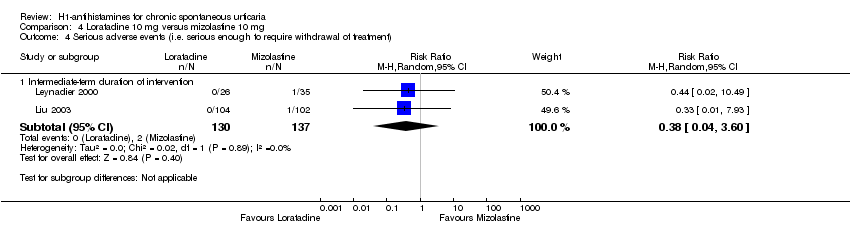
Comparison 4 Loratadine 10 mg versus mizolastine 10 mg, Outcome 4 Serious adverse events (i.e. serious enough to require withdrawal of treatment).
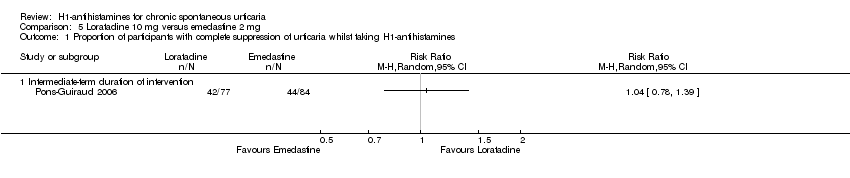
Comparison 5 Loratadine 10 mg versus emedastine 2 mg, Outcome 1 Proportion of participants with complete suppression of urticaria whilst taking H1‐antihistamines.
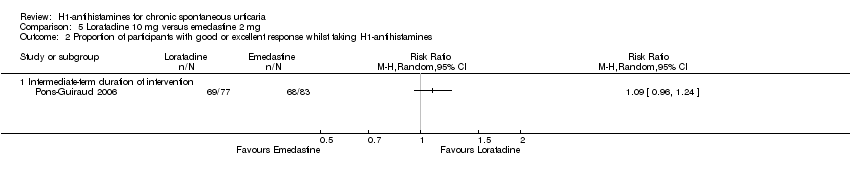
Comparison 5 Loratadine 10 mg versus emedastine 2 mg, Outcome 2 Proportion of participants with good or excellent response whilst taking H1‐antihistamines.
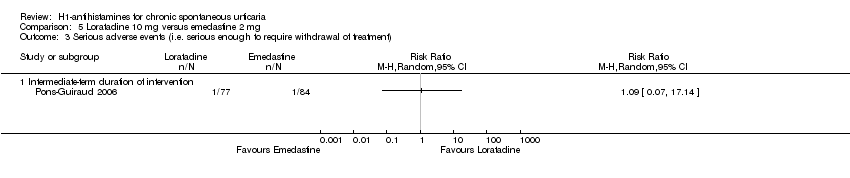
Comparison 5 Loratadine 10 mg versus emedastine 2 mg, Outcome 3 Serious adverse events (i.e. serious enough to require withdrawal of treatment).
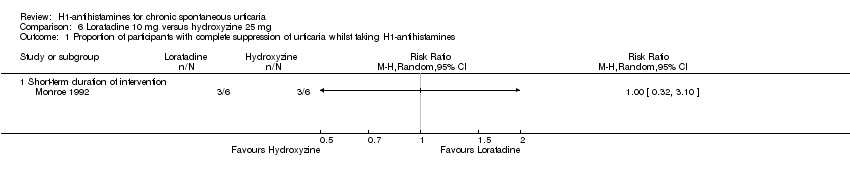
Comparison 6 Loratadine 10 mg versus hydroxyzine 25 mg, Outcome 1 Proportion of participants with complete suppression of urticaria whilst taking H1‐antihistamines.

Comparison 7 Cetirizine 10 to 20 mg versus placebo, Outcome 1 Proportion of participants with complete suppression of urticaria whilst taking H1‐antihistamines.

Comparison 7 Cetirizine 10 to 20 mg versus placebo, Outcome 2 Serious adverse events (i.e. serious enough to require withdrawal of treatment).

Comparison 8 Cetirizine 10 mg versus hydroxyzine 25 mg, Outcome 1 Serious adverse events (i.e. serious enough to require withdrawal of treatment).
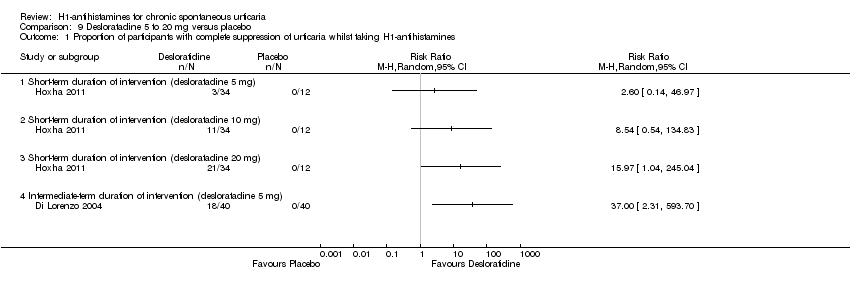
Comparison 9 Desloratadine 5 to 20 mg versus placebo, Outcome 1 Proportion of participants with complete suppression of urticaria whilst taking H1‐antihistamines.

Comparison 9 Desloratadine 5 to 20 mg versus placebo, Outcome 2 Serious adverse events (i.e. serious enough to require withdrawal of treatment).

Comparison 10 Hydroxyzine 25 mg versus placebo, Outcome 1 Serious adverse events (i.e. serious enough to require withdrawal of treatment to withdrawal).

Comparison 11 Levocetirizine 5 to 20 mg versus placebo, Outcome 1 Proportion of participants with complete suppression of urticaria whilst taking H1‐antihistamines.
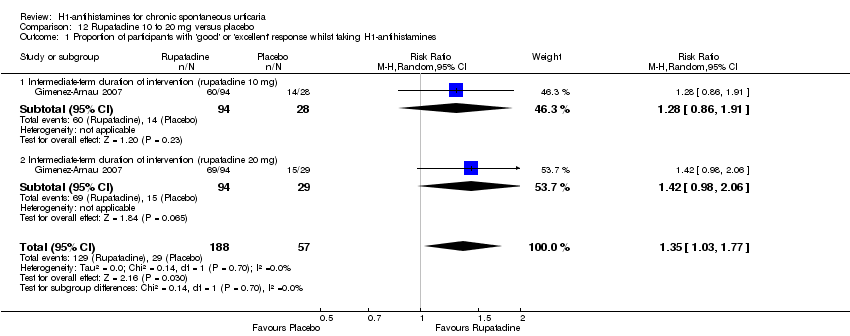
Comparison 12 Rupatadine 10 to 20 mg versus placebo, Outcome 1 Proportion of participants with 'good' or 'excellent' response whilst taking H1‐antihistamines.
| Cetirizine 10 to 20 mg versus placebo for chronic spontaneous urticaria | ||||||
| Patient or population: patients with chronic spontaneous urticaria | ||||||
| Outcomes | Illustrative comparative risks* (95% CI) | Relative effect | Number of participants | Quality of the evidence | Comments | |
| Assumed risk | Corresponding risk | |||||
| Control (placebo) | Cetirizine 10 to 20 mg | |||||
| Complete suppression of urticaria | Study population | RR 2.72 | 178 | ⊕⊕⊝⊝ | Favours cetirizine | |
| 133 per 1000 | 363 per 1000 | |||||
| Moderate | ||||||
| 146 per 1000 | 397 per 1000 | |||||
| Adverse events leading to withdrawal | Study population | RR 3 | 389 | ⊕⊕⊝⊝ | Favours neither intervention nor control | |
| 10 per 1000 | 30 per 1000 | |||||
| Moderate | ||||||
| 14 per 1000 | 42 per 1000 | |||||
| *The basis for the assumed risk (e.g. median control group risk across studies) is provided in footnotes. The corresponding risk (and its 95% confidence interval) is based on the assumed risk in the comparison group and the relative effect of the intervention (and its 95% CI). | ||||||
| GRADE Working Group grades of evidence. | ||||||
| aDesign limitation (risk of bias). | ||||||
| Desloratadine 5 to 20 mg versus placebo for chronic spontaneous urticaria | ||||||
| Patient or population: patients with chronic spontaneous urticaria | ||||||
| Outcomes | Illustrative comparative risks* | Relative effect | Number of participants | Quality of the evidence | Comments | |
| Assumed risk | Corresponding risk | |||||
| Control (placebo) | Desloratadine 5 to 20 mg | |||||
| Complete suppression of urticaria: short‐term duration of intervention (desloratadine 5 mg) | See comment | See comment | Not estimable | 46 | ⊕⊕⊝⊝ | Favours neither intervention nor control Only 1 study, a conference abstract (Hoxha 2011) |
| Complete suppression of urticaria: short‐term duration of intervention (desloratadine 10 mg) | See comment | See comment | Not estimable | 46 | ⊕⊕⊝⊝ | Favours neither intervention nor control Only 1 study, a conference abstract (Hoxha 2011) |
| Complete suppression of urticaria: short‐term duration of intervention (desloratadine 20 mg) | See comment | See comment | Not estimable | 46 | ⊕⊕⊝⊝ | Favours desloratadine Only 1 study, a conference abstract (Hoxha 2011) |
| Complete suppression of urticaria: intermediate‐term duration of intervention (desloratadine 5 mg) | See comment | See comment | Not estimable | 80 | ⊕⊕⊝⊝ | Favours desloratadine Only 1 study (Di Lorenzo 2004) |
| Adverse effects leading to withdrawal: intermediate‐term duration of 5 mg of intervention | Study population | RR 1.46 | 466 | ⊕⊕⊝⊝ | Favours neither intervention nor control | |
| 17 per 1000 | 25 per 1000 | |||||
| Moderate | ||||||
| 18 per 1000 | 26 per 1000 | |||||
| *The basis for the assumed risk (e.g. median control group risk across studies) is provided in footnotes. The corresponding risk (and its 95% confidence interval) is based on the assumed risk in the comparison group and the relative effect of the intervention (and its 95% CI). | ||||||
| GRADE Working Group grades of evidence. | ||||||
| aDesign limitation (risk of bias). | ||||||
| Levocetirizine 5 to 20 mg versus placebo for chronic spontaneous urticaria | ||||||
| Patient or population: patients with chronic spontaneous urticaria | ||||||
| Outcomes | Illustrative comparative risks* | Relative effect | Number of participants | Quality of the evidence | Comments | |
| Assumed risk | Corresponding risk | |||||
| Control (placebo) | Levocetirizine 5 to 20 mg | |||||
| Complete suppression of urticaria: short‐term duration of intervention (levocetirizine 5 mg) | See comment | See comment | Not estimable | 49 | ⊕⊕⊝⊝ | Favours neither intervention nor control Only 1 study, a conference abstract (Hoxha 2011) |
| Complete suppression of urticaria: short‐term duration of intervention (levocetirizine 10 mg) | See comment | See comment | Not estimable | 49 | ⊕⊕⊝⊝ | Favours neither intervention nor control Only 1 study, a conference abstract (Hoxha 2011) |
| Complete suppression of urticaria: short‐term duration of intervention (levocetirizine 20 mg) | See comment | See comment | Not estimable | 49 | ⊕⊕⊝⊝ | Favours levocetirizine Only 1 study, a conference abstract (Hoxha 2011) |
| Complete suppression of urticaria: intermediate‐term duration of intervention (levocetirizine 5 mg) | See comment | See comment | Not estimable | 100 | ⊕⊕⊝⊝ | Favours levocetirizine Only 1 study (Nettis 2006) |
| *The basis for the assumed risk (e.g. median control group risk across studies) is provided in footnotes. The corresponding risk (and its 95% confidence interval) is based on the assumed risk in the comparison group and the relative effect of the intervention (and its 95% CI). | ||||||
| GRADE Working Group grades of evidence. | ||||||
| aDesign limitation (risk of bias). | ||||||
| Rupatadine 10 to 20 mg versus placebo for chronic spontaneous urticaria | ||||||
| Patient or population: patients with chronic spontaneous urticaria | ||||||
| Outcomes | Illustrative comparative risks* (95% CI) | Relative effect | Number of participants | Quality of the evidence | Comments | |
| Assumed risk | Corresponding risk | |||||
| Control (placebo) | Rupatadine 10 to 20 mg | |||||
| Good or excellent response | Study population | RR 1.35 | 245 | ⊕⊕⊝⊝ | Favours rupatadine | |
| 509 per 1000 | 687 per 1000 | |||||
| Moderate | ||||||
| 509 per 1000 | 687 per 1000 | |||||
| *The basis for the assumed risk (e.g. median control group risk across studies) is provided in footnotes. The corresponding risk (and its 95% confidence interval) is based on the assumed risk in the comparison group and the relative effect of the intervention (and its 95% CI). | ||||||
| GRADE Working Group grades of evidence. | ||||||
| aDesign limitation (risk of bias). | ||||||
| Loratadine 10 mg versus placebo for chronic spontaneous urticaria | ||||||
| Patient or population: patients with chronic spontaneous urticaria | ||||||
| Outcomes | Illustrative comparative risks* (95% CI) | Relative effect | Number of participants | Quality of the evidence | Comments | |
| Assumed risk | Corresponding risk | |||||
| Control (placebo) | Loratadine 10 mg | |||||
| Good or excellent response | Study population | RR 1.86 | 124 | ⊕⊕⊝⊝ | Favours neither intervention nor control | |
| 155 per 1000 | 289 per 1000 | |||||
| Moderate | ||||||
| 160 per 1000 | 298 per 1000 | |||||
| *The basis for the assumed risk (e.g. median control group risk across studies) is provided in footnotes. The corresponding risk (and its 95% confidence interval) is based on the assumed risk in the comparison group and the relative effect of the intervention (and its 95% CI). | ||||||
| GRADE Working Group grades of evidence. | ||||||
| aDesign limitation (risk of bias). | ||||||
| Loratadine 10 mg versus cetirizine 10 mg for chronic spontaneous urticaria | ||||||
| Patient or population: patients with chronic spontaneous urticaria | ||||||
| Outcomes | Illustrative comparative risks* (95% CI) | Relative effect | Number of participants | Quality of the evidence | Comments | |
| Assumed risk | Corresponding risk | |||||
| Control (cetirizine 10 mg) | Loratadine 10 mg | |||||
| Complete cessation of urticaria | Study population | RR 1.05 | 103 | ⊕⊕⊝⊝ | Combined short and intermediate‐term duration of intervention. Favours neither intervention nor control | |
| 588 per 1000 | 618 per 1000 | |||||
| Moderate | ||||||
| 574 per 1000 | 603 per 1000 | |||||
| *The basis for the assumed risk (e.g. median control group risk across studies) is provided in footnotes. The corresponding risk (and its 95% confidence interval) is based on the assumed risk in the comparison group and the relative effect of the intervention (and its 95% CI). | ||||||
| GRADE Working Group grades of evidence. | ||||||
| aDesign limitation (risk of bias). | ||||||
| Loratadine 10 mg versus desloratadine 5 mg for chronic spontaneous urticaria | ||||||
| Patient or population: patients with chronic spontaneous urticaria | ||||||
| Outcomes | Illustrative comparative risks* | Relative effect | Number of participants | Quality of the evidence | Comments | |
| Assumed risk | Corresponding risk | |||||
| Control (desloratadine | Loratadine 10 mg | |||||
| Complete suppression of urticaria: intermediate‐term duration of intervention | Study population | RR 0.91 | 369 | ⊕⊕⊝⊝ | Favours neither intervention nor control | |
| 658 per 1000 | 598 per 1000 | |||||
| Moderate | ||||||
| 670 per 1000 | 610 per 1000 | |||||
| Good or excellent response: intermediate‐term duration of intervention | Study population | RR 1.04 | 410 | ⊕⊕⊝⊝ | Favours neither intervention nor control No participants reported a good or excellent response in the loratadine group in Zou 2002 We found low levels of statistical heterogeneity in this analysis I2 = 40%) | |
| 263 per 1000 | 274 per 1000 | |||||
| Moderate | ||||||
| 228 per 1000 | 237 per 1000 | |||||
| *The basis for the assumed risk (e.g. median control group risk across studies) is provided in footnotes. The corresponding risk (and its 95% confidence interval) is based on the assumed risk in the comparison group and the relative effect of the intervention (and its 95% CI). | ||||||
| GRADE Working Group grades of evidence. | ||||||
| aDesign limitation (risk of bias). | ||||||
| Loratadine 10 mg compared to mizolastine 10 mg for chronic spontaneous urticaria | ||||||
| Patient or population: patients with chronic spontaneous urticaria | ||||||
| Outcomes | Illustrative comparative risks* (95% CI) | Relative effect | Number of participants | Quality of the evidence | Comments | |
| Assumed risk | Corresponding risk | |||||
| Control (mizolastine | Loratadine 10 mg | |||||
| Complete cessation of urticaria: intermediate‐term duration of intervention | Study population | RR 0.86 | 316 | ⊕⊝⊝⊝ | Overall, favours neither loratadine nor mizolastine In Guo 2003, more participants in mizolastine group had complete cessation of urticaria than in the other 2 studies (Liu 2003 and Yin 2003b) | |
| 675 per 1000 | 581 per 1000 | |||||
| Moderate | ||||||
| 667 per 1000 | 574 per 1000 | |||||
| Good or excellent response: intermediate‐term duration of intervention | Study population | RR 0.88 | 314 | ⊕⊕⊝⊝ | Favours neither loratadine nor mizolastine | |
| 187 per 1000 | 165 per 1000 | |||||
| Moderate | ||||||
| 174 per 1000 | 153 per 1000 | |||||
| Adverse events leading to withdrawal: intermediate‐term duration of intervention | Study population | RR 0.38 | 267 | ⊕⊕⊝⊝ | Favours neither loratadine nor mizolastine | |
| 15 per 1000 | 6 per 1000 | |||||
| Moderate | ||||||
| 19 per 1000 | 7 per 1000 | |||||
| Proportion of participants with at least 50% improvement in QoL: intermediate‐term duration of intervention | Study population | RR 3.21 | 252 | ⊕⊝⊝⊝ | Favours neither loratadine nor mizolastine No participants in the mizolastine group in Guo 2003 reported at least 50% improvement in QoL | |
| 104 per 1000 | 334 per 1000 | |||||
| Moderate | ||||||
| 64 per 1000 | 205 per 1000 | |||||
| *The basis for the assumed risk (e.g. median control group risk across studies) is provided in footnotes. The corresponding risk (and its 95% confidence interval) is based on the assumed risk in the comparison group and the relative effect of the intervention (and its 95% CI). | ||||||
| GRADE Working Group grades of evidence. | ||||||
| aDesign limitation (risk of bias). | ||||||
| Loratadine 10 mg versus emedastine 2 mg for chronic spontaneous urticaria | ||||||
| Patient or population: patients with chronic spontaneous urticaria | ||||||
| Outcomes | Illustrative comparative risks* (95% CI) | Relative effect | Number of participants | Quality of the evidence | Comments | |
| Assumed risk | Corresponding risk | |||||
| Control (emedastine 2 mg) | Loratadine 10 mg | |||||
| Complete cessation of urticaria: intermediate‐term duration of intervention | Study population | RR 1.04 | 161 | ⊕⊕⊕⊝ | Favours neither loratadine nor emedastine Only 1 study (Pons‐Guiraud 2006) | |
| 524 per 1000 | 545 per 1000 | |||||
| Moderate | ||||||
| 524 per 1000 | 545 per 1000 | |||||
| Good or excellent response: intermediate‐term duration of intervention | Study population | RR 1.09 | 160 | ⊕⊕⊕⊝ | Favours neither loratadine nor emedastine Only 1 study (Pons‐Guiraud 2006) | |
| 819 per 1000 | 893 per 1000 | |||||
| Moderate | ||||||
| 819 per 1000 | 893 per 1000 | |||||
| Adverse events leading to withdrawal: intermediate‐term duration of intervention | Study population | RR 1.09 | 161 | ⊕⊕⊕⊝ | Favours neither loratadine nor emedastine Only 1 study (Pons‐Guiraud 2006) | |
| 12 per 1000 | 13 per 1000 | |||||
| Moderate | ||||||
| 12 per 1000 | 13 per 1000 | |||||
| *The basis for the assumed risk (e.g. median control group risk across studies) is provided in footnotes. The corresponding risk (and its 95% confidence interval) is based on the assumed risk in the comparison group and the relative effect of the intervention (and its 95% CI). | ||||||
| GRADE Working Group grades of evidence. | ||||||
| aRelatively few participants and few events and/or wide confidence intervals. | ||||||
| Loratadine 10 mg versus hydroxyzine 25 mg for chronic spontaneous urticaria | ||||||
| Patient or population: patients with chronic spontaneous urticaria | ||||||
| Outcomes | Illustrative comparative risks* (95% CI) | Relative effect | Number of participants | Quality of the evidence | Comments | |
| Assumed risk | Corresponding risk | |||||
| Control (hydroxyzine 25 mg) | Loratadine 10 mg | |||||
| Complete suppression of urticaria: short‐term duration of intervention | Study population | RR 1 | 12 | ⊕⊕⊝⊝ | Favours neither intervention or control Only 1 study (Monroe 1992) | |
| 500 per 1000 | 500 per 1000 | |||||
| Moderate | ||||||
| 500 per 1000 | 500 per 1000 | |||||
| *The basis for the assumed risk (e.g. median control group risk across studies) is provided in footnotes. The corresponding risk (and its 95% confidence interval) is based on the assumed risk in the comparison group and the relative effect of the intervention (and its 95% CI). | ||||||
| GRADE Working Group grades of evidence. | ||||||
| aDesign limitation (risk of bias). | ||||||
| Cetirizine 10 mg versus hydroxyzine 25 mg for chronic spontaneous urticaria | ||||||
| Patient or population: patients with chronic spontaneous urticaria | ||||||
| Outcomes | Illustrative comparative risks* (95% CI) | Relative effect | Number of participants | Quality of the evidence | Comments | |
| Assumed risk | Corresponding risk | |||||
| Control (hydroxyzine 25 mg) | Cetirizine 10 mg | |||||
| Adverse events leading to withdrawal | Study population | RR 0.78 | 261 | ⊕⊕⊝⊝ | Favours neither cetirizine nor hydroxyzine | |
| 53 per 1000 | 41 per 1000 | |||||
| Moderate | ||||||
| 54 per 1000 | 42 per 1000 | |||||
| *The basis for the assumed risk (e.g. median control group risk across studies) is provided in footnotes. The corresponding risk (and its 95% confidence interval) is based on the assumed risk in the comparison group and the relative effect of the intervention (and its 95% CI). | ||||||
| GRADE Working Group grades of evidence. | ||||||
| aDesign limitation (risk of bias). | ||||||
| Hydroxyzine 25 mg versus placebo for chronic spontaneous urticaria | ||||||
| Patient or population: patients with chronic spontaneous urticaria | ||||||
| Outcomes | Illustrative comparative risks* (95% CI) | Relative effect | Number of participants | Quality of the evidence | Comments | |
| Assumed risk | Corresponding risk | |||||
| Control (placebo) | Hydroxyzine 25 mg | |||||
| Adverse events leading to withdrawal: intermediate‐term duration of intervention | Study population | RR 3.64 | 270 | ⊕⊕⊝⊝ | Favours neither intervention nor control | |
| 14 per 1000 | 53 per 1000 | |||||
| Moderate | ||||||
| 15 per 1000 | 55 per 1000 | |||||
| *The basis for the assumed risk (e.g. median control group risk across studies) is provided in footnotes. The corresponding risk (and its 95% confidence interval) is based on the assumed risk in the comparison group and the relative effect of the intervention (and its 95% CI). | ||||||
| GRADE Working Group grades of evidence. | ||||||
| aDesign limitation (risk of bias). | ||||||
| Outcome or subgroup title | No. of studies | No. of participants | Statistical method | Effect size |
| 1 Proportion of participants with 'good' or 'excellent' response whilst taking H1‐antihistamines Show forest plot | 2 | 124 | Risk Ratio (M‐H, Random, 95% CI) | 1.86 [0.91, 3.79] |
| 1.1 Short‐term duration of intervention (10 mg) | 1 | 12 | Risk Ratio (M‐H, Random, 95% CI) | 3.0 [0.42, 21.30] |
| 1.2 Intermediate‐term duration of intervention (10 mg) | 1 | 112 | Risk Ratio (M‐H, Random, 95% CI) | 1.73 [0.81, 3.72] |
| Outcome or subgroup title | No. of studies | No. of participants | Statistical method | Effect size |
| 1 Proportion of participants with complete suppression of urticaria whilst taking H1‐antihistamines Show forest plot | 2 | 103 | Risk Ratio (M‐H, Random, 95% CI) | 1.05 [0.76, 1.43] |
| 1.1 Short‐term duration of intervention | 1 | 37 | Risk Ratio (M‐H, Random, 95% CI) | 1.13 [0.64, 2.01] |
| 1.2 Intermediate‐term duration of intervention | 1 | 66 | Risk Ratio (M‐H, Random, 95% CI) | 1.01 [0.69, 1.47] |
| Outcome or subgroup title | No. of studies | No. of participants | Statistical method | Effect size |
| 1 Proportion of participants with complete suppression of urticaria whilst taking H1‐antihistamines Show forest plot | 2 | Risk Ratio (M‐H, Random, 95% CI) | Subtotals only | |
| 1.1 Intermediate‐term duration of intervention | 2 | 369 | Risk Ratio (M‐H, Random, 95% CI) | 0.91 [0.78, 1.06] |
| 2 Proportion of participants with 'good' or 'excellent' response whilst taking H1‐antihistamines Show forest plot | 3 | Risk Ratio (M‐H, Random, 95% CI) | Subtotals only | |
| 2.1 Intermediate‐term duration of intervention | 3 | 410 | Risk Ratio (M‐H, Random, 95% CI) | 1.04 [0.64, 1.71] |
| Outcome or subgroup title | No. of studies | No. of participants | Statistical method | Effect size |
| 1 Proportion of participants with complete suppression of urticaria whilst taking H1‐antihistamines Show forest plot | 3 | Risk Ratio (M‐H, Random, 95% CI) | Subtotals only | |
| 1.1 Intermediate‐term duration of intervention | 3 | 316 | Risk Ratio (M‐H, Random, 95% CI) | 0.86 [0.64, 1.16] |
| 2 Proportion of participants with 'good' or 'excellent' response whilst taking H1‐antihistamines Show forest plot | 3 | Risk Ratio (M‐H, Random, 95% CI) | Subtotals only | |
| 2.1 Intermediate‐term duration of intervention | 3 | 314 | Risk Ratio (M‐H, Random, 95% CI) | 0.88 [0.55, 1.42] |
| 3 Proportion of participants with at least 50% improvement in QoL whilst taking H1‐antihistamines Show forest plot | 2 | Risk Ratio (M‐H, Random, 95% CI) | Subtotals only | |
| 3.1 Intermediate‐term duration of intervention | 2 | 252 | Risk Ratio (M‐H, Random, 95% CI) | 3.21 [0.32, 32.33] |
| 4 Serious adverse events (i.e. serious enough to require withdrawal of treatment) Show forest plot | 2 | Risk Ratio (M‐H, Random, 95% CI) | Subtotals only | |
| 4.1 Intermediate‐term duration of intervention | 2 | 267 | Risk Ratio (M‐H, Random, 95% CI) | 0.38 [0.04, 3.60] |
| Outcome or subgroup title | No. of studies | No. of participants | Statistical method | Effect size |
| 1 Proportion of participants with complete suppression of urticaria whilst taking H1‐antihistamines Show forest plot | 1 | Risk Ratio (M‐H, Random, 95% CI) | Totals not selected | |
| 1.1 Intermediate‐term duration of intervention | 1 | Risk Ratio (M‐H, Random, 95% CI) | 0.0 [0.0, 0.0] | |
| 2 Proportion of participants with good or excellent response whilst taking H1‐antihistamines Show forest plot | 1 | Risk Ratio (M‐H, Random, 95% CI) | Totals not selected | |
| 2.1 Intermediate‐term duration of intervention | 1 | Risk Ratio (M‐H, Random, 95% CI) | 0.0 [0.0, 0.0] | |
| 3 Serious adverse events (i.e. serious enough to require withdrawal of treatment) Show forest plot | 1 | Risk Ratio (M‐H, Random, 95% CI) | Totals not selected | |
| 3.1 Intermediate‐term duration of intervention | 1 | Risk Ratio (M‐H, Random, 95% CI) | 0.0 [0.0, 0.0] | |
| Outcome or subgroup title | No. of studies | No. of participants | Statistical method | Effect size |
| 1 Proportion of participants with complete suppression of urticaria whilst taking H1‐antihistamines Show forest plot | 1 | Risk Ratio (M‐H, Random, 95% CI) | Totals not selected | |
| 1.1 Short‐term duration of intervention | 1 | Risk Ratio (M‐H, Random, 95% CI) | 0.0 [0.0, 0.0] | |
| Outcome or subgroup title | No. of studies | No. of participants | Statistical method | Effect size |
| 1 Proportion of participants with complete suppression of urticaria whilst taking H1‐antihistamines Show forest plot | 2 | 178 | Risk Ratio (M‐H, Random, 95% CI) | 2.72 [1.51, 4.91] |
| 1.1 Short‐term duration of intervention (cetirizine 10 mg) | 1 | 56 | Risk Ratio (M‐H, Random, 95% CI) | 2.8 [1.17, 6.73] |
| 1.2 Intermediate‐term duration of intervention (cetirizine 10 mg) | 1 | 122 | Risk Ratio (M‐H, Random, 95% CI) | 2.66 [1.20, 5.90] |
| 2 Serious adverse events (i.e. serious enough to require withdrawal of treatment) Show forest plot | 3 | 389 | Risk Ratio (M‐H, Random, 95% CI) | 3.00 [0.68, 13.22] |
| 2.1 Intermediate‐term duration of intervention (cetirizine 10 mg) | 2 | 247 | Risk Ratio (M‐H, Random, 95% CI) | 4.60 [0.79, 26.67] |
| 2.2 Intermediate‐term duration of intervention (cetirizine 10 to 20 mg) | 1 | 142 | Risk Ratio (M‐H, Random, 95% CI) | 1.06 [0.07, 16.59] |
| Outcome or subgroup title | No. of studies | No. of participants | Statistical method | Effect size |
| 1 Serious adverse events (i.e. serious enough to require withdrawal of treatment) Show forest plot | 2 | 261 | Risk Ratio (M‐H, Random, 95% CI) | 0.78 [0.25, 2.45] |
| 1.1 Intermediate‐term duration of intervention (cetirizine 10 mg) | 1 | 123 | Risk Ratio (M‐H, Random, 95% CI) | 1.05 [0.27, 4.01] |
| 1.2 Intermediate‐term duration of intervention (cetirizine 5 to 25 mg) | 1 | 138 | Risk Ratio (M‐H, Random, 95% CI) | 0.33 [0.04, 3.13] |
| Outcome or subgroup title | No. of studies | No. of participants | Statistical method | Effect size |
| 1 Proportion of participants with complete suppression of urticaria whilst taking H1‐antihistamines Show forest plot | 2 | Risk Ratio (M‐H, Random, 95% CI) | Totals not selected | |
| 1.1 Short‐term duration of intervention (desloratadine 5 mg) | 1 | Risk Ratio (M‐H, Random, 95% CI) | 0.0 [0.0, 0.0] | |
| 1.2 Short‐term duration of intervention (desloratadine 10 mg) | 1 | Risk Ratio (M‐H, Random, 95% CI) | 0.0 [0.0, 0.0] | |
| 1.3 Short‐term duration of intervention (desloratadine 20 mg) | 1 | Risk Ratio (M‐H, Random, 95% CI) | 0.0 [0.0, 0.0] | |
| 1.4 Intermediate‐term duration of intervention (desloratadine 5 mg) | 1 | Risk Ratio (M‐H, Random, 95% CI) | 0.0 [0.0, 0.0] | |
| 2 Serious adverse events (i.e. serious enough to require withdrawal of treatment) Show forest plot | 3 | Risk Ratio (M‐H, Random, 95% CI) | Subtotals only | |
| 2.1 Intermediate‐term duration of 5 mg of intervention | 3 | 466 | Risk Ratio (M‐H, Random, 95% CI) | 1.46 [0.42, 5.10] |
| Outcome or subgroup title | No. of studies | No. of participants | Statistical method | Effect size |
| 1 Serious adverse events (i.e. serious enough to require withdrawal of treatment to withdrawal) Show forest plot | 2 | Risk Ratio (M‐H, Random, 95% CI) | Subtotals only | |
| 1.1 Intermediate‐term duration of intervention | 2 | 270 | Risk Ratio (M‐H, Random, 95% CI) | 3.64 [0.77, 17.23] |
| Outcome or subgroup title | No. of studies | No. of participants | Statistical method | Effect size |
| 1 Proportion of participants with complete suppression of urticaria whilst taking H1‐antihistamines Show forest plot | 2 | Risk Ratio (M‐H, Random, 95% CI) | Totals not selected | |
| 1.1 Short‐term duration of intervention (levocetirizine 5 mg) | 1 | Risk Ratio (M‐H, Random, 95% CI) | 0.0 [0.0, 0.0] | |
| 1.2 Short‐term duration of intervention (levocetirizine 10 mg) | 1 | Risk Ratio (M‐H, Random, 95% CI) | 0.0 [0.0, 0.0] | |
| 1.3 Short‐term duration of intervention (levocetirizine 20 mg) | 1 | Risk Ratio (M‐H, Random, 95% CI) | 0.0 [0.0, 0.0] | |
| 1.4 Intermediate‐term duration of intervention (levocetirizine 5 mg) | 1 | Risk Ratio (M‐H, Random, 95% CI) | 0.0 [0.0, 0.0] | |
| Outcome or subgroup title | No. of studies | No. of participants | Statistical method | Effect size |
| 1 Proportion of participants with 'good' or 'excellent' response whilst taking H1‐antihistamines Show forest plot | 1 | 245 | Risk Ratio (M‐H, Random, 95% CI) | 1.35 [1.03, 1.77] |
| 1.1 Intermediate‐term duration of intervention (rupatadine 10 mg) | 1 | 122 | Risk Ratio (M‐H, Random, 95% CI) | 1.28 [0.86, 1.91] |
| 1.2 Intermediate‐term duration of intervention (rupatadine 20 mg) | 1 | 123 | Risk Ratio (M‐H, Random, 95% CI) | 1.42 [0.98, 2.06] |