| Respiratory muscle training compared with control for cystic fibrosis |
| Patient or population: adults and children with cystic fibrosis Settings: outpatients Intervention: respiratory muscle trainingₑ Comparison: controlₑ |
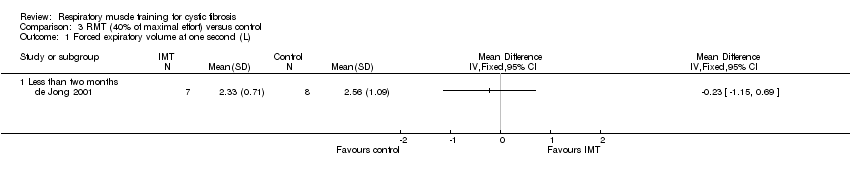
| FEV1: % predicted Follow‐up: 6‐12 weeks | No significant differences between the respiratory muscle training group and the control group were reported in any study. | NA | 145 (7 studies including 2 cross‐over studies) | ⊕⊝⊝⊝
very low2,3 | Studies reported FEV1 as % predicted, litres or z score. One study with respiratory muscle training level 30% of maximal effort reported a significant improvement within the training group. |
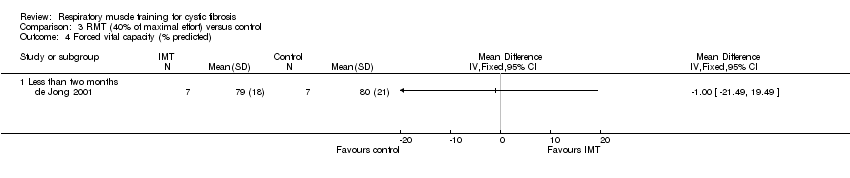
| FVC: % predicted Follow‐up: 6‐12 weeks | No significant differences between the respiratory muscle training group and the control group were reported in any study. | NA | 114 (5 studies including 1 cross‐over study) | ⊕⊝⊝⊝
very low2,3 | Studies reported FVC as % predicted, litres or z score. One study with respiratory muscle training level 30% of maximal effort reported a significant improvement within the training group. |
| Exercise capacity: VO2max (mL/kg/min) Follow‐up: 6‐12 weeks | No significant differences between the respiratory muscle training group and the control group were reported in any study. | NA | 54 (3 studies including 1 cross‐over study) | ⊕⊝⊝⊝
very low2,3 | One study with an unspecified level of resistance reported a significant improvement within the respiratory muscle training group. |
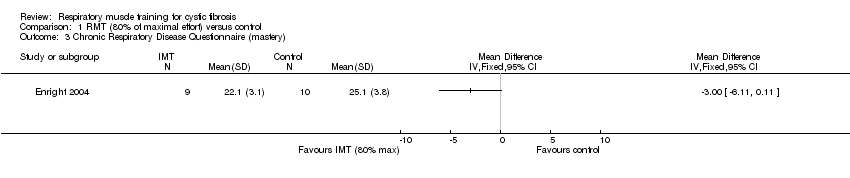
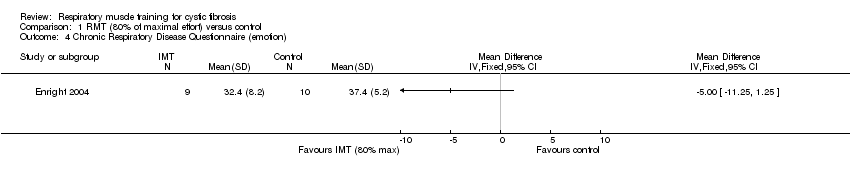
| HRQoL: total score Follow‐up: 8 weeks | Two studies reported no significant differences between the respiratory muscle training group and the control group. One study reported significant improvements in the parameters of mastery and emotion in the respiratory muscle training group compared to the control group. | NA | 69 (3 studies including 1 cross‐over study) | ⊕⊝⊝⊝
very low2,3 | Two studies used the Chronic Respiratory Disease Questionnaire (CRDQ) and one study used the cystic fibrosis questionnaire (CFQ). |
| Respiratory muscle function: maximal inspiratory pressure (PImax) Follow‐up: 6‐10 weeks | Significant improvements were observed in all respiratory muscle training groups. Two studies reported no significant differences between the respiratory muscle training group and the control group. | NA | 51 (3 studies including 1 cross‐over study) | ⊕⊕⊝⊝
low2 | |
| Respiratory muscle function: inspiratory capacity Follow‐up: NA | | NA | |
| *The basis for the assumed risk (e.g. the median control group risk across studies) is provided in footnotes. The corresponding risk (and its 95% confidence interval) is based on the assumed risk in the comparison group and the relative effect of the intervention (and its 95% CI).
CI: confidence interval; FEV1: forced expiratory volume in 1 second; FVC: forced vital capacity; HRQoL: health related quality of life;NA: not applicable; VO₂max: maximal oxygen uptake. |
| GRADE Working Group grades of evidence
High quality: Further research is very unlikely to change our confidence in the estimate of effect.
Moderate quality: Further research is likely to have an important impact on our confidence in the estimate of effect and may change the estimate.
Low quality: Further research is very likely to have an important impact on our confidence in the estimate of effect and is likely to change the estimate.
Very low quality: We are very uncertain about the estimate. |