نقش پیش‐درمانی با قرصهای خوراکی پیشگیری از بارداری، پروژستوژن یا استروژن برای پروتکلهای تحریک تخمدان در زنانی که از روشهای کمک‐باروری استفاده میکنند
چکیده
پیشینه
میان زنان نابارور تحت فناوری کمک‐باروری (assisted reproductive technology; ART)، قرصهای هورمونی که پیش از تحریک تخمدان تجویز میشوند ممکن است نتایج را بهبود بخشند.
اهداف
تعیین اینکه پیش‐درمانی با قرصهای خوراکی پیشگیری از بارداری (combined oral contraceptive pill; COCP) یا با پروژستوژن یا استروژن بهتنهایی در پروتکلهای تحریک تخمدان تاثیری بر پیامدهای زوجهای نابارور تحت ART دارد یا خیر.
روشهای جستوجو
بانکهای اطلاعاتی زیر را از ابتدا تا ژانویه 2017 جستوجو کردیم: پایگاه ثبت تخصصی گروه زنان و باروری در کاکرین، پایگاه ثبت مرکزی مطالعات آنلاین کاکرین (CRSO)؛ MEDLINE؛ Embase؛ CINAHL و PsycINFO. همچنین فهرست منابع مقالات مرتبط و پایگاههای ثبت کارآزماییهای در حال انجام را جستوجو کردیم.
معیارهای انتخاب
کارآزماییهای تصادفیسازی و کنترل شده (randomised controlled trials; RCTs) از پیش‐درمانی هورمونی در زنان تحت ART.
گردآوری و تجزیهوتحلیل دادهها
از پروسیجرهای روششناسی استاندارد توصیه شده توسط کاکرین استفاده کردیم. پیامدهای اولیه ما، تولد زنده یا بارداری پایدار و سقط جنین بودند.
نتایج اصلی
ما 29 RCT (4701 زن) را از پیش‐درمانی با COCP، پروژستوژنها یا استروژنها در مقابل عدم پیش‐درمانی یا پیش‐درمانیهای جایگزین، در چرخههای آگونیست یا آنتاگونیست هورمون آزاد کننده گنادوتروفین (GnRH) وارد کردیم. بهطور کلی، کیفیت شواهد از بسیار پائین تا متوسط رتبهبندی شد. محدودیتهای اصلی خطر سوگیری (bias) و عدم دقت بودند. اکثر مطالعات روشهای خود را با جزئیات کافی توصیف نکردند.
قرصهای خوراکی پیشگیری از بارداری در مقابل عدم پیش‐درمانی
با چرخههای آنتاگونیست در هر دو گروه، میزان تولد زنده یا بارداری پایدار در گروه پیش‐درمانی کمتر بود (OR: 0.74؛ 95% CI؛ 0.58 تا 0.95؛ 6 RCT؛ 1335 زن؛ I2 = 0%؛ شواهد با کیفیت متوسط). شواهد کافی وجود نداشت تا مشخص شود که گروهها از نظر نرخ از دست رفتن بارداری (OR: 1.36؛ 95% CI؛ 0.82 تا 2.26؛ 5 RCT؛ 868 زن؛ I2 = 0%؛ شواهد با کیفیت متوسط)، بارداری چند‐قلویی (OR: 2.21؛ 95 % CI؛ 0.53 تا 9.26؛ 2 RCT؛ 125 زن؛ I2 = 0%؛ شواهد با کیفیت پائین)، سندرم تحریک بیش از حد تخمدان (ovarian hyperstimulation syndrome; OHSS) (OR: 0.98؛ 95% CI؛ 0.28 تا 3.40؛ 2 RCT؛ 642 زن؛ I2 = 0%، شواهد با کیفیت پائین)، یا تشکیل کیست تخمدان (OR: 0.47؛ 95% CI؛ 0.08 تا 2.75؛ 1 RCT؛ 64 زن؛ شواهد با کیفیت بسیار پائین) با هم متفاوت بودند یا خیر.
در COCP همراه با چرخههای آنتاگونیست در مقابل عدم پیش‐درمانی در چرخههای آگونیست، شواهد کافی وجود نداشت تا مشخص شود این گروهها در نرخ تولد زنده یا بارداری پایدار (OR: 0.89؛ 95% CI؛ 0.64 تا 1.25؛ 4 RCT؛ 724 زن؛ I2 = 0%؛ شواهد با کیفیت متوسط)، بارداری چند‐قلویی (OR: 1.36؛ 95% CI؛ 0.85 تا 2.19؛ 4 RCT؛ 546 زن؛ I2 = 0%؛ شواهد با کیفیت متوسط)، یا OHSS (OR: 0.63؛ 95% CI؛ 0.20 تا 1.96؛ 2 RCT؛ 290 زن، I2 = 0%) با هم تفاوت داشتند یا خیر، اما میزان از دست رفتن بارداری در گروه پیش‐درمانی کمتر بود (OR: 0.40؛ 95% CI؛ 0.22 تا 0.72؛ 5 RCT؛ 780 زن؛ I2 = 0%؛ شواهد با کیفیت متوسط). دادههای مناسب برای تجزیهوتحلیل در مورد تشکیل کیست تخمدانی وجود نداشت.
یک مطالعه کوچک که COCP را با عدم پیش‐درمانی در چرخههای آگونیست مقایسه کرد، هیچ تفاوت واضحی را بین گروهها برای هیچ یک از پیامدهای گزارش شده نشان نداد.
پروژستوژن در مقابل عدم پیش‐درمانی
همه مطالعات از پروتکل یکسانی (آنتاگونیست، آگونیست یا گنادوتروفین) در هر دو گروه استفاده کردند. شواهد کافی برای تعیین هرگونه تفاوت در نرخ تولد زنده یا بارداری پایدار وجود نداشت (آگونیست: OR: 1.35؛ 95% CI؛ 0.69 تا 2.65؛ 2 RCT؛ 222 زن؛ I2 = 24%؛ شواهد با کیفیت پائین؛ آنتاگونیست: OR: 0.67؛ 95% CI؛ 0.18 تا 2.54؛ 1 RCT؛ 47 زن؛ شواهد با کیفیت پائین؛ گنادوتروفینها: OR: 0.63؛ 95% CI؛ 0.09 تا 4.23؛ 1 RCT؛ 42 زن؛ شواهد با کیفیت بسیار پائین)، از دست رفتن بارداری (آگونیست: OR: 2.26؛ 95% CI؛ 0.67 تا 7.55؛ 222 زن؛ 2 RCT؛ I2 = 0%؛ شواهد با کیفیت پائین؛ آنتاگونیست: OR: 0.36؛ 95% CI؛ 0.06 تا 2.09؛ 1 RCT؛ 47 زن؛ شواهد با کیفیت پائین؛ گنادوتروفینها: OR: 1.00؛ 95% CI؛ 0.06 تا 17.12؛ 1 RCT؛ 42 زن؛ شواهد با کیفیت بسیار پائین) یا بارداری چند‐قلویی (آگونیست: دادهای در دسترس نبود؛ آنتاگونیست: OR: 1.05؛ 95% CI؛ 0.06 تا 17.76؛ 1 RCT؛ 47 زن؛ شواهد با کیفیت پائین؛ گنادوتروفینها: اطلاعاتی در دسترس نبود). سه مطالعه، که همگی از چرخههای آگونیست استفاده کردند، تشکیل کیست تخمدانی را گزارش کردند: نرخ آن در گروه پیش‐درمانی کمتر بود (OR: 0.16؛ 95% CI؛ 0.08 تا 0.32؛ 374 زن؛ I2 = 1%؛ شواهد با کیفیت متوسط). هیچ اطلاعاتی در مورد OHSS وجود نداشت.
استروژن در مقابل عدم پیش‐درمانی
در چرخههای آنتاگونیست یا آگونیست، شواهد کافی برای تعیین اینکه تفاوتی بین گروهها از نظر نرخ تولد زنده یا بارداری پایدار وجود داشت یا خیر، به دست نیامد (آنتاگونیست در مقابل آنتاگونیست: OR: 0.79؛ 95% CI؛ 0.53 تا 1.17؛ 2 RCT؛ 502 زن؛ I2 = 0%؛ شواهد با کیفیت پائین؛ آنتاگونیست در مقابل آگونیست: OR: 0.88؛ 95% CI؛ 0.51 تا 1.50؛ 2 RCT؛ 242 زن؛ I2 = 0%؛ شواهد با کیفیت بسیار پائین)، از دست رفتن بارداری (آنتاگونیست در مقابل آنتاگونیست: RR: 0.16؛ 95% CI؛ 0.02 تا 1.47؛ 1 RCT؛ 49 زن؛ شواهد با کیفیت بسیار پائین؛ آنتاگونیست در مقابل آگونیست: OR: 1.59؛ 95% CI؛ 0.62 تا 4.06؛ 1 RCT؛ 220 زن؛ شواهد با کیفیت بسیار پائین)، بارداری چند‐قلویی (آنتاگونیست در مقابل آنتاگونیست: دادهای در دسترس نبود؛ آنتاگونیست در مقابل آگونیست: OR: 2.24؛ 95% CI؛ 0.09 تا 53.59؛ 1 RCT؛ 22 زن؛ شواهد با کیفیت بسیار پائین) یا OHSS (آنتاگونیست در مقابل آنتاگونیست: دادهای در دسترس نبود؛ آنتاگونیست در مقابل آگونیست: OR: 1.54؛ 95% CI؛ 0.25 تا 9.42؛ 1 RCT؛ 220 زن). تشکیل کیست تخمدان گزارش نشد.
مقایسههای سر‐به‐سر
COCP با پروژستوژن (1 RCT؛ 44 زن)، و با استروژن (2 RCT؛ 146 زن) مقایسه شد، و پروژستوژن با استروژن (1 RCT؛ 48 زن)، با چرخه آنتاگونیست در هر دو گروه مقایسه شد. COCP در چرخه آگونیست با استروژن در چرخه آنتاگونیست (1 RCT؛ 25 زن) مقایسه شد. دادهها اندک بودند، اما شواهد روشنی وجود نداشت که نشان دهد هر یک از گروهها از نظر نرخ تولد زنده یا بارداری پایدار، از دست رفتن بارداری یا سایر عوارض جانبی متفاوت هستند.
نتیجهگیریهای نویسندگان
میان زنانی که تحت تحریک تخمدان در پروتکلهای آنتاگونیست قرار گرفتند، پیش‐درمانی با COCP در مقایسه با عدم پیش‐درمانی با نرخ کمتر تولد زنده یا بارداری پایدار همراه بود. شواهد کافی برای تعیین اینکه نرخ تولد زنده یا بارداری پایدار تحت تاثیر پیش‐درمانی با پروژستوژنها یا استروژنها، یا پیش‐درمانی با COCP با استفاده از پروتکلهای تحریک دیگر قرار گرفت یا خیر، وجود نداشت. یافتههای مربوط به عوارض جانبی نامشخص بودند، با این تفاوت که پیش‐درمانی با پروژسترون ممکن است خطر کیستهای تخمدانی را در چرخههای آگونیست کاهش دهد، و COCP در چرخههای آنتاگونیست میتواند خطر از دست رفتن بارداری را در مقایسه با عدم پیش‐درمانی در چرخههای آگونیست کاهش دهد.
PICO
خلاصه به زبان ساده
نقش پیش‐درمانی در چرخههای لقاح آزمایشگاهی/تزریق اسپرم داخل سیتوپلاسم
سوال مطالعه مروری
هدف از این مرور ارزیابی تاثیر پیش‐درمانی با یک قرص خوراکی پیشگیری از بارداری ترکیبی (combined oral contraceptive pill; COCP) یا با پروژستوژن یا استروژن بهتنهایی بر پیامدهای بارداری در زوجهایی با قدرت باروری پائین و تحت فناوری کمک باروری (assisted reproductive technology; ART) بود.
پیشینه
لقاح آزمایشگاهی (IVF؛ ترکیب تخمک با اسپرم خارج از بدن) و تزریق درون سیتوپلاسمی اسپرم (ICSI؛ تزریق یک اسپرم مستقیما به داخل تخمک) تکنیکهای مهمی برای زنانی هستند که برای باردار شدن با مشکل مواجه هستند. چرخههای IVF و ICSI شامل چند مرحله هستند. ابتدا زن برای تحریک تخمدانهای خود در تولید سلولهای تخمک (که تحریک تخمدان نامیده میشود) هورمون‐درمانی دریافت میکند. هنگامی که چند سلول تخمک برای بارور شدن به اندازه کافی بالغ میشوند، بیمار یک تزریق تکی هورمون دریافت میکند. این امر باعث میشود که تخمدانها سلولهای تخمک را آزاد کنند، بنابراین میتوانند توسط پزشک جمعآوری شود. سپس تخمکها در خارج از بدن زن بارور شده و تبدیل به جنین میشوند. در نهایت یک یا دو جنین به داخل رحم منتقل میشود.
پیش از اولین مرحله در چرخههای IVF یا ICSI (هورمون‐درمانی)، میتوان پیش‐درمانی را با COCP انجام داد. COCP حاوی پروژسترون و استروژن است. پیش از هورمون‐درمانی میتوان از پیش‐درمانی با پروژستوژن یا استروژن بهتنهایی نیز استفاده کرد. این پیش‐درمانها تولید هورمون را توسط خود بیمار سرکوب میکنند. این وضعیت ممکن است پاسخ زن را به هورمون‐درمانی در چرخههای IVF/ICSI بهبود بخشد. در این مسیر، عوارض جانبی مانند تشکیل کیست (کیسه پر از مایع که در تخمدان زن ایجاد میشود) و تعداد سقطها ممکن است کاهش یابد و پیامدهای بارداری بهبود یابد.
ویژگیهای مطالعه
این مرور کاکرین شامل 30 کارآزمایی تصادفیسازی و کنترل شده (مطالعات بالینی که در آنها افراد بهطور تصادفی در یکی از دو یا چند گروه درمانی قرار میگیرند) بود که به ارزیابی پیش‐درمانی با COCP، پروژستوژن یا استروژن در 5096 زن تحت ART پرداختند. شواهد تا ژانویه 2017 بهروز است.
نتایج کلیدی
میان زنانی که تحت تحریک تخمدان در پروتکلهای آنتاگونیست قرار گرفتند، پیش‐درمانی با COCP در مقایسه با عدم پیش‐درمانی با نرخ کمتر تولد زنده یا بارداری پایدار همراه بود. شواهد کافی برای تعیین اینکه نرخ تولد زنده یا بارداری پایدار تحت تاثیر پیش‐درمانی با پروژستوژنها یا استروژنها، یا پیش‐درمانی با COCP با استفاده از پروتکلهای تحریک دیگر قرار گرفت یا خیر، وجود نداشت. یافتههای مربوط به عوارض جانبی نامشخص بودند، با این تفاوت که پیش‐درمانی با پروژسترون ممکن است خطر کیستهای تخمدانی را در چرخههای آگونیست کاهش دهد، و COCP در چرخههای آنتاگونیست میتواند خطر از دست رفتن بارداری را در مقایسه با عدم پیش‐درمانی در چرخههای آگونیست کاهش دهد.
کیفیت شواهد
کیفیت کلی شواهد از بسیار پائین تا متوسط رتبهبندی شد. مشکلات اصلی وجود خطر سوگیری (bias) و عدم دقت بودند. اکثر مطالعات روشهای خود را با جزئیات کافی توصیف نکردند.
Authors' conclusions
Summary of findings
| Combined oral contraceptive pill compared to no pretreatment for ovarian stimulation protocols for women undergoing assisted reproductive techniques | ||||||
| Population: women undergoing ART Settings: ART clinic Intervention: COCP Comparison: no pretreatment | ||||||
| Outcomes | Illustrative comparative risks* (95% CI) | Relative effect | No of participants | Quality of the evidence | Comments | |
| Assumed risk1 | Corresponding risk | |||||
| No pretreatment | COCP | |||||
| Live birth or ongoing pregnancy (COCP + Ant vs Ant) | 270 per 1000 | 215 per 1000 | OR 0.74 | 1335 | ⊕⊕⊕⊝ | ‐ |
| Live birth or ongoing pregnancy (COCP + Ant vs Ag) | 296 per 1000 | 273 per 1000 | OR 0.89 | 724 | ⊕⊕⊕⊝ | ‐ |
| Pregnancy loss (COCP + Ant vs Ant) | 64 per 1000 | 85 per 1000 | OR 1.36 | 868 | ⊕⊕⊕⊝ | ‐ |
| Pregnancy loss (COCP + Ant vs Ag) | 103 per 1000 | 44 per 1000 | OR 0.40 | 780 | ⊕⊕⊕⊝ | ‐ |
| Multiple pregnancy rate (COCP + Ant vs Ant) | 47 per 1000 | 98 per 1000 | OR 2.21 | 125 | ⊕⊕⊝⊝ | ‐ |
| Multiple pregnancy rate (COCP + Ant vs Ag) | 147 per 1000 | 189 per 1000 | OR 1.36 | 546 | ⊕⊕⊕⊝ | ‐ |
| OHSS rate (COCP + Ant vs Ant) | 16 per 1000 | 16 per 1000 (4 to 52) | OR 0.98 (0.28 to 3.40) | 642 (2 studies) | ⊕⊕⊝⊝ | ‐ |
| OHSS rate (COCP + Ant vs Ag) | 55 per 1000 | 35 per 1000 (11 to 102) | OR 0.63 (0.20 to 1.96) | 290 (2 studies) | ⊕⊕⊝⊝ | ‐ |
| *The basis for the assumed risk (e.g. the median control group risk across studies) is provided in footnotes. The corresponding risk (and its 95% confidence interval) is based on the assumed risk in the comparison group and the relative effect of the intervention (and its 95% CI). | ||||||
| GRADE Working Group grades of evidence | ||||||
| 1 Mean baseline risk of control group. | ||||||
| Progestogen compared to placebo or no pretreatment for ovarian stimulation protocols for women undergoing assisted reproductive techniques | ||||||
| Patient or population: ovarian stimulation protocols for women undergoing ART Settings: Intervention: progestogen Comparison: placebo or no pretreatment | ||||||
| Outcomes | Illustrative comparative risks* (95% CI) | Relative effect | No of participants | Quality of the evidence | Comments | |
| Assumed risk1 | Corresponding risk | |||||
| Placebo or no pretreatment | Prog | |||||
| Live birth or ongoing pregnancy (Prog + Ag vs Ag) | 170 per 1000 | 217 per 1000 | OR 1.35 | 222 | ⊕⊕⊝⊝ | ‐ |
| Live birth or ongoing pregnancy (Prog + Ant vs Ant) | 292 per 1000 | 217 per 1000 | OR 0.67 | 47 | ⊕⊕⊝⊝ | ‐ |
| Pregnancy loss (Prog + Ag vs Ag) | 36 per 1000 | 78 per 1000 | OR 2.26 | 222 | ⊕⊕⊝⊝ | ‐ |
| Pregnancy loss (Prog + Ant vs Ant) | 208 per 1000 | 86 per 1000 | OR 0.36 | 47 | ⊕⊕⊝⊝ | ‐ |
| Multiple pregnancy rate (Prog + Ag vs Ag) | No data available | ‐ | ‐ | |||
| Multiple pregnancy rate (Prog + Ant vs Ant) | 42 per 1000 | 44 per 1000 | OR 1.05 | 47 | ⊕⊕⊝⊝ | ‐ |
| OHSS rate (Prog + Ag vs Ag) | No data available | ‐ | ‐ | |||
| OHSS rate (Prog + Ant vs Ant) | No data available | ‐ | ‐ | |||
| *The basis for the assumed risk (e.g. the median control group risk across studies) is provided in footnotes. The corresponding risk (and its 95% confidence interval) is based on the assumed risk in the comparison group and the relative effect of the intervention (and its 95% CI). | ||||||
| GRADE Working Group grades of evidence | ||||||
| 1 Mean baseline risk of control group. | ||||||
| Oestrogencompared to no pretreatment for ovarian stimulation protocols for women undergoing assisted reproductive techniques | ||||||
| Patient or population: ovarian stimulation protocols for women undergoing ART Settings: Intervention: oestrogen Comparison: no pretreatment | ||||||
| Outcomes | Illustrative comparative risks* (95% CI) | Relative effect | No of Participants | Quality of the evidence | Comments | |
| Assumed risk1 | Corresponding risk | |||||
| No pretreatment | Oestr | |||||
| Live birth or ongoing pregnancy (Oestr + Ant vs Ant) | 299 per 1000 | 252 per 1000 | OR 0.79 | 502 | ⊕⊕⊕⊝ | ‐ |
| Live birth or ongoing pregnancy (Oestr + Ant vs Ag) | 350 per 1000 | 322 per 1000 | OR 0.88 | 242 | ⊕⊝⊝⊝ | ‐ |
| Pregnancy loss (Oestr + Ant vs Ant) | 208 per 1000 | 40 per 1000 | OR 0.16 | 49 | ⊕⊝⊝⊝ | ‐ |
| Pregnancy loss (Oestr + Ant vs Ag) | 72 per 1000 | 110 per 1000 | OR 1.59 | 220 | ⊕⊝⊝⊝ | ‐ |
| Multiple pregnancy rate (Oestr + Ant vs Ant) | No data available | ‐ | ‐ | |||
| Multiple pregnancy rate (Oestr + Ant vs Ag) | Not calculable ‐ see comment | OR 2.24 | 22 | ⊕⊝⊝⊝ | Only 2 events (both in oestrogen group) | |
| OHSS rate (Oestr + Ant vs Ant) | No data available | ‐ | ‐ | |||
| OHSS rate (Oestr + Ant vs Ag) | 18 per 1000 | 27 per 1000 (5 to 147) | OR 1.54 (0.25 to 9.42) | 220 (1 study) | ⊕⊝⊝⊝ | ‐ |
| *The basis for the assumed risk (e.g. the median control group risk across studies) is provided in footnotes. The corresponding risk (and its 95% confidence interval) is based on the assumed risk in the comparison group and the relative effect of the intervention (and its 95% CI). | ||||||
| GRADE Working Group grades of evidence | ||||||
| 1 Mean baseline risk of control group. | ||||||
Background
For definitions of terminology see our Glossary (Appendix 1).
Description of the condition
For subfertile women, assisted reproductive techniques (ART) such as in vitro fertilisation (IVF) and intra‐cytoplasmic sperm injection (ICSI) can be a way to achieve pregnancy. Pregnancy and live birth rates are higher with IVF than with expectant management (Pandian 2005).
An IVF cycle has the following stages: ovarian stimulation, oocyte retrieval, fertilisation of the egg and transfer of the embryo. Ovarian stimulation involves the administration of gonadotrophins. These hormones stimulate growth and maturation of the follicle. Gonadotrophins include follicle‐stimulating hormone (FSH) and luteinising hormone (LH). There are two different gonadotrophin preparations; human menopausal gonadotrophin (hMG) which consists of both FSH and LH, and a more recent therapy, recombinant follicle‐stimulating hormone (rFSH). There is insufficient evidence of a difference between these treatments in ongoing pregnancy or live birth rate and other aspects with relation to IVF (Van Wely 2003).
There are a number of undesirable events associated with gonadotrophin therapy that can complicate treatment and outcomes: ovarian hyperstimulation syndrome (OHSS), premature LH‐surge and multiple pregnancy (Dodson 1989). In some women undergoing IVF therapy, these problems occur because the endogenous FSH and LH production is too dominant (Awadalla 1987). Gonadotrophin‐releasing hormone analogues (GnRHa) are administered to inhibit the production of endogenous FSH and LH (Awadalla 1987; Dodson 1989). Gonadotrophin‐releasing hormone (GnRH) is a hormone that occurs naturally in the woman's body and that regulates the production of gonadotrophins. There are two different types of GnRHa: agonists or antagonists. The difference lies in their mechanism of action. GnRH agonists bind to the GnRH receptors in the pituitary gland and initially stimulate the release of gonadotrophins ('flare‐up'). Negative feedback causes a decrease in the number of GnRH receptors, which results in the release of fewer gonadotrophins. In a traditional treatment protocol, GnRH agonists are administered prior to commencing gonadotrophins, ensuring that the flare‐up will be over by the time gonadotrophins are injected. Conversely, GnRH antagonists can be started after gonadotrophin therapy has been administered because they bind competitively to the receptor, causing immediate suppression of the endogenous production of FSH and LH (Tarlatzis 2006). Therefore, GnRHa can prevent a premature LH‐surge and synchronise the follicle cohort.
The authors of one Cochrane Review comparing GnRH agonist cycles with GnRH antagonist cycles concluded that GnRH antagonists are associated with a substantial reduction in OHSS without reducing the likelihood of achieving live birth (Al‐Inany 2016).
When a few follicles reach maturity after gonadotrophin stimulation and GnRHa treatment, human chorionic gonadotrophin (hCG) is administered to trigger ovulation and 34 to 36 hours later, oocyte retrieval is undertaken and the egg is fertilised outside the body. Following fertilisation, the embryos are either transferred on day two or three (cleavage stage) or on day five or six (blastocyst stage). Luteal phase support is typically provided as a progestogen or a hCG treatment, or as a combination.
Description of the intervention
Oral contraceptive pills (OCP) are widely used by women of different ages to prevent pregnancy. They are also indicated for a range of menstrual and gynaecological conditions, such as acne vulgaris, polycystic ovary syndrome (PCOS) and menorrhagia (Arowojolu 2007; Harwood 2007; Irvine 1999). Combined oral contraceptive pills (COCP) consisting of oestrogen and progestogen reduce the women's own production of FSH and LH by way of a negative feedback (Cohen 1979; Gaspard 1984). The COCP suppresses gonadal function and, in the absence of an LH‐surge, no flare‐up or premature ovulation will occur. Only progestogen has a contraceptive effect (Erkkola 2007). Progestogen has the ability to slow GnRH pulsatility of the pituitary gland, thereby reducing gonadotrophin surges and, according to dose, inhibiting ovulation (Anderson 1990; Erkkola 2007; Le Nestour 1993; Moudgal 1985). Oestrogen is added to the COCP to regulate the bleeding patterns, though it is also capable of reducing FSH levels (De Ziegler 1998; Le Nestour 1993).
Most of progestogen‐only pills do not inhibit ovulation although higher doses of progestogen may do so (Erkkola 2007).
How the intervention might work
The COCP given prior to gonadotrophin in an IVF cycle assists synchronisation of follicular development and prevents occurrence of spontaneous LH‐surges (Gonen 1990). Huirne reported similar data as well as a reduction of the occurrence of large follicles prior to day eight (Huirne 2006a). In another study, both the COCP and progestogen had a suppressive effect on LH and FSH secretion. However, oestrogen administration (at 4 mg/day) did not suppress serum LH and FSH concentrations (Cédrin‐Durnerin 2007).
The resulting pituitary suppression of COCPs in GnRH antagonist cycles is associated with slower follicular growth and lower serum oestradiol levels than in antagonist cycles with no pretreatment in the early part of the cycle. This results in a longer duration of rFSH stimulation and a higher total rFSH consumption than in antagonist cycles without pretreatment (Cédrin‐Durnerin 2007).
COCP pretreatment in an ovarian stimulation protocol before IVF can reduce cyst formation, shorten the length of GnRHa treatment and reduce the amount of gonadotrophin needed, without negatively affecting the pregnancy rate (Biljan 1998a). Pituitary suppression seems to occur earlier with progestogen pretreatment and fewer ovarian cysts are formed, when compared with no pretreatment (Engmann 1999). COCP pretreatment can be used for scheduling oocyte retrieval on days of the working week, which is important with antagonist cycles (Barmat 2005; Gonen 1990; Huirne 2006b). Scheduling is of benefit for the clinicians and people in the laboratory, since these people usually do not work on weekends.
Why it is important to do this review
There is some debate regarding the effects of the COCP upon pregnancy rate. Higher rates of clinical pregnancy and live birth have been reported when dual suppression protocols and GnRHa were compared to a GnRHa protocol without the use of oral contraceptives in non‐randomised studies (Damario 1997; Keltz 2007). However, other non‐randomised studies have found no evidence of effect with regard to pregnancy rate (Bellver 2007; Galera 2004).
There is a lack of consensus regarding whether pretreatment with COCP in ovarian stimulation protocols improves rates of pregnancy and live birth. Furthermore, the effects of pretreatment with progestogen or oestrogen alone on IVF outcomes is unclear. The results of many small RCTs can be pooled in a systematic review and may provide a more definitive answer regarding the role of the COCP, progestogens or oestrogens in ART.
Objectives
To determine whether pretreatment with the combined oral contraceptive pill or with a progestogen or oestrogen alone in ovarian stimulation protocols affects outcomes in subfertile couples undergoing ART.
Methods
Criteria for considering studies for this review
Types of studies
We included only randomized controlled trials (RCTs) in this review. We included both published and unpublished studies and we excluded trials with quasi‐randomisation.
We excluded cross‐over trials unless pre‐crossover data were available; this type of design is inappropriate in this context.
Types of participants
Women of any age with subfertility, regardless of any cause, undergoing ART.
We only excluded two types of participants from this review. The first was women with premature ovarian failure, because these women require a different ovarian stimulation protocol. The second was women who participated in ovarian stimulation protocols as oocyte donors.
Types of interventions
Pretreatment with COCPs, progestogens or oestrogens versus no pretreatment or alternative pretreatments, in GnRH agonist or antagonist cycles. We excluded studies that compared different doses of the same pretreatment.
Types of outcome measures
Primary outcomes
-
Live birth or ongoing pregnancy (in studies not reporting live birth) per woman randomized.
-
Live birth defined as the delivery of a foetus with signs of life after 20 completed weeks of gestational age, counted as live birth event. When there were multiple live births (e.g. twins or triplets), we counted these as one live birth event (Griffin 2002).
-
Ongoing pregnancy defined as evidence of a gestational sac with foetal heart motion at 12 weeks or later, confirmed with ultrasound. When there were multiple gestational sacs in one woman, we counted these as one ongoing pregnancy (Griffin 2002).
-
-
Pregnancy loss (miscarriage) per woman randomized ‐ defined as the sum of the number of spontaneous abortions (pregnancy loss before 20 completed weeks of gestation) and the number of stillbirths (pregnancy loss after 20 completed weeks of gestation) (Griffin 2002).
Secondary outcomes
-
Clinical pregnancy rate per woman randomized ‐ defined as evidence of a gestational sac with foetal heart motion at six weeks or later, confirmed with ultrasound. When there were multiple gestational sacs in one woman, we counted these as one clinical pregnancy (Griffin 2002).
-
Multiple pregnancy rate per woman randomized.
-
OHSS rate per woman randomized, as defined in the included studies.
-
Number of oocytes retrieved per woman randomized.
-
Days of gonadotrophin treatment per woman randomized.
-
Amount of gonadotrophins administered per woman randomized.
-
Ovarian cyst formation rate per woman randomized ‐ defined as any intraovarian sonolucent structure with a mean diameter of 15 mm or more confirmed with ultrasound at least one week after start pituitary suppression (Biljan 1998a).
Search methods for identification of studies
We obtained all studies that described (or might have described) RCTs of pretreatment with COCP, progestogen or oestrogen therapy prior to GnRHa (agonists or antagonists) and gonadotrophins or gonadotrophins alone in women undergoing IVF, using the following search strategies.
Electronic searches
We searched the following electronic databases:
-
the Cochrane Gynaecology and Fertility Group (CGF) Specialised Register, searched on Procite platform from inception to 16 January 2017 (Appendix 2);
-
Cochrane Central Register of Studies Online (CENTRAL CRSO) searched 16 January 2017 on web platform (Appendix 3);
-
MEDLINE; searched on Ovid platform 1946 to 16 January 2017 (Appendix 4). We combined this search with the Cochrane highly sensitive search strategy for identifying randomized trials (Higgins 2011);
-
Embase; searched on Ovid platform 1980 to 16 January 2017 (Appendix 5). We combined this search with trial filters developed by the Scottish Intercollegiate Guidelines Network (SIGN);
-
PsycINFO; searched on the Ovid platform from 1806 to 16 January 2017 (Appendix 6);
-
Cumulative Index to Nursing and Allied Health Literature (CINAHL Plus); searched on the Ebsco platform from 1982 to 16 January 2017 (Appendix 7). We combined this search with trial filters developed by the Scottish Intercollegiate Guidelines Network (SIGN).
We place no restrictions by language. We managed output of these searches with the reference manager, Endnote (EndNote). Through this program, duplicates can be found and removed.
Searching other resources
In addition, we searched some other resources than the electronic databases mentioned above to obtain more relevant trials. We accessed all the websites on 13 January 2017, except for OpenSIGLE.
-
Trial registers for ongoing and registered trials: Current Controlled Trials (www.controlled‐trials.com), ClinicalTrials.gov (clinicaltrials.gov), and the World Health Organization (WHO) International Trials Registry Platform Search Portal (www.who.int/trialsearch) (Appendix 8).
-
The Virtual Health Library.
-
Citation indexes (scientific.thomson.com/products/sci).
-
PubMed (www.ncbi.nlm.nih.gov/pubmed); we combined this search with random control filters for PubMed (Higgins 2011).
-
Conference abstracts on the ISI Web of Knowledge (isiwebofknowledge.com).
-
Open System for Information on Grey Literature (opensigle.inist.fr, accessed on 16 January 2017).
-
Reference lists of appropriate studies.
-
Handsearching of the abstracts of the 32nd annual meeting of the European Society of Human Reproduction and Embryology in Helsinki (Finland), 3 to 6 July 2016 (ESHRE 2016).
Data collection and analysis
Selection of studies
Two review authors (ROA, AL) independently scanned the titles and abstracts of all the studies found with the search to exclude those that did not meet the inclusion criteria. We discussed any disagreement or doubt, whether a study was eligible for inclusion or not, with a third review author (CF) to achieve consensus. We obtained the full text of those RCTs deemed eligible for inclusion where possible, and subjected them to critical appraisal of their risk of bias. Where appropriate, we included them in this systematic review.
Subsequently, we constructed a Characteristics of included studies table for those trials considered suitable for inclusion. We produced a Characteristics of excluded studies table for those that did not satisfy the inclusion criteria. In this table, we listed the reasons for exclusion.
Data extraction and management
Two review authors (ROA, AL) independently extracted the data using data extraction forms, which we designed for this particular review (Appendix 9; Appendix 10). We resolved any discrepancies by discussion and the help of a third review author (CF).
The data extraction forms included risk of bias criteria and methodological details. The information about the studies is included in the review and presented in the Characteristics of included studies table. We managed the data using Review Manager 5 software (RevMan 2014).
Assessment of risk of bias in included studies
We assessed and reported on the risk of bias of included studies in accordance with the Cochrane Handbook for Systematic Reviews of Interventions (Higgins 2011), which recommends the explicit reporting of the following domains.
-
Sequence generation
Was sequence generation adequate (e.g. use of a random number table, a computer random number generator or coin tossing) or unclear (insufficient information about the process of sequence generation)?
-
Allocation concealment
Was allocation concealment adequate (e.g. use of central allocation or opaque sealed envelopes), inadequate (e.g. use of an open random allocation schedule, date of birth or case record number) or unclear (insufficient information about the process of allocation concealment)?
-
Blinding of participants, providers and outcome assessors
Was blinding adequate (e.g. participants and researchers were all blinded and it was unlikely that blinding could have been broken, either participants or some researchers were not blinded but outcome assessment was blinded or no blinding was used but this was not likely to influence outcomes), inadequate (e.g. no blinding or incomplete blinding and outcomes were likely to be influenced by this) or unclear (insufficient information about the process of blinding)?
-
Incomplete outcome data
Were outcome data addressed adequately (e.g. there were no missing outcome data, reasons for missing outcome data were unlikely to be related to true outcome or missing outcome data were balanced in numbers across intervention groups), inadequate (e.g. reasons for missing outcome data were likely to be related to true outcome) or unclear (insufficient information about the process of addressing outcome data)?
-
Selective outcome reporting
Was the study free of selective reporting? Adequate (e.g. the study protocol was available and all prespecified outcomes were reported or the study protocol was not available but it was clear that all prespecified outcomes were reported), inadequate (e.g. not all prespecified primary outcomes were reported) or unclear (insufficient information about the process of outcome reporting).
-
Other sources of bias for RCTs
Was the study free of other bias? Adequate (the study seemed to be free of other bias, e.g. comparable demographic characteristics between treatment groups), inadequate (e.g. extreme baseline imbalance, a potential source of bias related to the specific study design used or early stopping) or unclear (insufficient information about other sources of bias).
By using a simple form (Appendix 9; Appendix 10), two review authors separately assessed these domains as 'low' (indicating a low risk of bias), 'unclear' (indicating an uncertain risk of bias) or 'high' (indicating a high risk of bias).
The assessments of the two review authors (ROA, AL) were compared and we resolved any discrepancies in the interpretation of the risk of bias of a study by discussion with a third review author (CF). We did not exclude any study as a result of a rating of 'Unclear' or 'High'. Where it was unclear, we contacted authors of studies about the methods used and also sought any missing data.
We presented the results of the risk of bias assessment in the Characteristics of included studies table, including commentary about each of the domains. This led to a methodological quality summary (Figure 1; Figure 2).

Methodological quality graph: review authors' judgements about each methodological quality item presented as percentages across all included studies.

Methodological quality summary: review authors' judgements about each methodological quality item for each included study.
Measures of treatment effect
For dichotomous data, we expressed results for each study as odds ratios (OR) with 95% confidence intervals (CI). For continuous variables, we reported the data as mean differences (MD) with 95% CIs.
Unit of analysis issues
To avoid analysis errors, we only pooled data that reported outcomes per woman randomized. Studies that reported 'per cycle' data were eligible for inclusion but were not included in the analyses; however, additional information was provided on such studies narratively.
Dealing with missing data
In case of missing data in the included studies, we contacted the original investigators by e‐mail or post to request relevant missing information. If we did not receive a reply, we sent a reminder to the authors two weeks later. Furthermore, we contacted the members of the CGF group to ask if they know any of the authors personally or have contact details.
We reported the data according to intention‐to‐treat (ITT) where possible. We reported live birth and ongoing pregnancy as a single outcome (i.e. live birth or ongoing pregnancy due to non‐reporting of live birth data by some studies who reported data on ongoing pregnancy). However, where a study reported data on both outcomes, we only included data for live birth in the analysis.
Assessment of heterogeneity
Before any meta‐analysis was done, we judged whether there was sufficient similarity between the eligible studies in their design and clinical characteristics to ensure that pooling was valid. We assessed statistical heterogeneity in the results of trials using the Chi2 test. A low P value (or a large Chi2 statistic relative to its degree of freedom) potentially provides evidence of heterogeneity of intervention effects and shows that results are not influenced by chance alone (Higgins 2011).
We used the I2 statistic to assess the impact of the heterogeneity on the meta‐analysis. We interpreted the result of the I2 statistic as follows:
-
0% to 40%: might not be important;
-
30% to 60%: may represent moderate heterogeneity;
-
50% to 90%: may represent substantial heterogeneity; and
-
75% to 100%: considerable heterogeneity (Higgins 2011).
If we found marked clinical or statistical heterogeneity (I2 more than 50%), we explored reasons for this heterogeneity using a sensitivity analysis.
Assessment of reporting biases
In view of the difficulty of detecting and correcting for publication bias and other reporting biases, we aimed to minimise their potential impact by ensuring a comprehensive search for eligible studies and by being alert for duplication of data. If there were 10 or more studies in an analysis, we intended to use a funnel plot to explore the possibility of small‐study effects (a tendency for estimates of the intervention effect to be more beneficial in smaller studies), but, due to the small number of studies per analysis, this was not possible.
Data synthesis
We carried out statistical analysis using Review Manager 5 (RevMan 2014). We used fixed‐effect meta‐analysis for combining data where studies were sufficiently similar.
Comparisons were grouped separately by type of pretreatment (COCP, progesterone, oestrogen) and type of comparator (no pretreatment or alternative pretreatment) and the primary analysis was subgrouped by type of downregulation (antagonist or agonist).
Subgroup analysis and investigation of heterogeneity
Where data were available, we subgrouped the data to determine the separate evidence within the following subgroups.
-
Types of downregulating agents:
-
GnRH agonist in study group versus GnRH agonist in control group;
-
GnRH antagonist in study group versus GnRH antagonist in control group;
-
GnRH antagonist in study group versus GnRH agonist in control group;
-
GnRH agonist in study group versus GnRH antagonist in control group.
-
-
Women who were low responders (i.e. who responded poorly to controlled ovarian hyperstimulation).
Where we detected substantial heterogeneity (I2 greater than 50%), we explored possible explanations in sensitivity analyses. We took any statistical heterogeneity into consideration when interpreting the results especially if there were any variations in the direction of effect estimates.
Sensitivity analysis
We intended to conduct sensitivity analysis for the primary outcomes (live births or ongoing pregnancies and pregnancy losses) to determine whether the conclusions were robust to the choice of statistical model (fixed versus random) or summary effect measure (OR or risk ratio).
Overall quality of the body of evidence: 'Summary of findings' table
We prepared 'Summary of findings' tables using GRADEpro (GRADEpro GDT 2014) and Cochrane methods. These tables evaluated the overall quality of the body of evidence for the main review outcomes:
-
live birth or ongoing pregnancy;
-
pregnancy loss;
-
multiple pregnancy;
-
OHSS.
The tables evaluated the main review comparisons:
-
COCP compared to no pretreatment;
-
progestogen compared to no pretreatment;
-
oestrogen compared to no pretreatment.
We assessed the quality of the evidence using GRADE criteria: risk of bias, consistency of effect, imprecision, indirectness and publication bias). Two review authors (ROA, AL) independently made judgements about evidence quality (high, moderate, low or very low) and resolved disagreements by discussion. Judgements were justified, documented and incorporated into reporting of results for each outcome.
Results
Description of studies
Results of the search
After searching the electronic databases, we found 1792 studies: 609 studies in the GF specialized register of controlled trials, 166 studies in CENTRAL, 511 studies in MEDLINE, 463 studies in Embase, 19 studies in CINAHL and 24 studies in PsycINFO. After removing the duplicates and searching other resources, there were 1528 studies left. We retrieved 137 full‐text articles of which 29 studies (42 references) were included and 87 studies (95 references) were excluded. For further details on included/excluded studies, see Characteristics of included studies and Characteristics of excluded studies tables. The process involved in the screening and selection of eligible studies for inclusion is shown in the PRISMA flow chart (Moher 2009) (Figure 3).

Study PRISMA flow chart
Included studies
Nine of the included studies were identified from the searches carried out in 2015 and 2016 (Blockeel 2012; Cédrin‐Durnerin 2012; Garcia‐Velasco 2011; Hauzman 2013; Kim 2011; Lukaszuk 2015; Nyboe Andersen 2011; Porrati 2010; Vilela 2011). The remaining 20 studies were identified from the previous updates of the review.
The following is a summary of the methods, participants, interventions and outcomes of the included studies. Full details of these domains (for each study separately) are in the Characteristics of included studies table.
Methods
We included 29 trials, with 4702 women randomized to treatment (Aston 1995; Biljan 1998b; Blockeel 2012; Cédrin‐Durnerin 2007; Cédrin‐Durnerin 2012; Daly 2002; Ditkoff 1996; Engmann 1999; Fanchin 2003; Franco Jr 2003; Garcia‐Velasco 2011; Hauzman 2013; Hugues 1994; Huirne 2006a; Huirne 2006c; Hwang 2004; Kim 2011; Kolibianakis 2006; Lukaszuk 2015; Nyboe Andersen 2011; Obruca 2002; Porrati 2010; Raoofi 2008; Rombauts 2006; Salat‐Baroux 1988; Shaker 1995; Tan 2001; Vilela 2011; Ye 2009). Two of the included studies were three‐arm parallel RCTs (Kim 2011; Rombauts 2006), one was a four‐arm RCT (Cédrin‐Durnerin 2007), and the remaining 26 studies were two‐arm parallel RCTs.
The largest trials were Kolibianakis 2006 (504 women), Cédrin‐Durnerin 2012 (472 women), Nyboe Andersen 2011 (442 women), Rombauts 2006 (351 women), Lukaszuk 2015 (298 women), Garcia‐Velasco 2011 (228 women), Ye 2009 (220 women) and Vilela 2011 (210 women). The remainder included fewer than 200 women. Only one study used a cross‐over design and reported pre‐cross‐over data (Daly 2002). The remaining 28 trials used a parallel design. Four studies were conducted in multiple centres (Cédrin‐Durnerin 2007; Huirne 2006a; Huirne 2006c; Rombauts 2006).
The trials took place in (or authors came from): Argentina (Porrati 2010; Vilela 2011); France (Cédrin‐Durnerin 1996; Cédrin‐Durnerin 2007; Cédrin‐Durnerin 2012; Fanchin 2003; Hugues 1994; Salat‐Baroux 1988); UK (Aston 1995; Shaker 1995); Canada (Biljan 1998b; Tan 2001); UK and Canada (Engmann 1999); USA (Daly 2002; Ditkoff 1996); USA and Europe (Nyboe Andersen 2011); Austria (Obruca 2002); Belgium (Blockeel 2012; Kolibianakis 2006); Brazil (Franco Jr 2003); China (Ye 2009); Iran (Raoofi 2008); South Korea (Kim 2011); Taiwan (Hwang 2004); Australia, Denmark, Jordan and Norway (Rombauts 2006); the Netherlands and Belgium (Huirne 2006a); Spain (Garcia‐Velasco 2011; Hauzman 2013); Poland (Lukaszuk 2015); Egypt, Iran, the Netherlands, Belgium, France and Austria (Huirne 2006c).
Of the 29 included studies, 13 performed and adhered to a power calculation (Aston 1995; Biljan 1998b; Cédrin‐Durnerin 2012; Engmann 1999; Fanchin 2003; Huirne 2006a; Huirne 2006c; Hwang 2004; Kim 2011; Kolibianakis 2006; Lukaszuk 2015; Nyboe Andersen 2011; Rombauts 2006). Seven studies did not adhere to a power calculation (Cédrin‐Durnerin 2007; Ditkoff 1996; Franco Jr 2003; Hauzman 2013; Raoofi 2008; Salat‐Baroux 1988; Shaker 1995), and in other studies this was unclear because there was only an abstract available or it was not reported.
Participants
Inclusion criteria
Of the 29 studies, 25 RCTs included women with a regular IVF/ICSI indication while four RCTs included women who had special indications for IVF: one trial included women who were low responders (i.e. women who respond poorly to controlled ovarian hyperstimulation (Kim 2011)); one included women with limited ovarian reserve (Daly 2002); one included women with PCOS (Hwang 2004); and another one included women with an ovarian cyst of over 5 mm in diameter or an endometrial thickness of over 5 mm and serum oestradiol concentration greater than 100 pmol/L after 14 days of GnRH agonist treatment (Shaker 1995).
Twenty‐one studies mentioned an age limit as an inclusion criteria. Eight studies only included women aged 38 years or less (Blockeel 2012; Cédrin‐Durnerin 2007; Cédrin‐Durnerin 2012; Franco Jr 2003; Hauzman 2013; Huirne 2006a; Salat‐Baroux 1988; Ye 2009). Nine studies only included women aged 39 years or less (Fanchin 2003; Garcia‐Velasco 2011; Huirne 2006c; Hwang 2004; Kolibianakis 2006; Nyboe Andersen 2011; Porrati 2010; Rombauts 2006; Vilela 2011). One study included women less than 40 years (Lukaszuk 2015). The other three studies used age limits above 40 years of age: one study used an upper limit of 41 years of age (Daly 2002), one study an upper limit of 42 years of age (Cédrin‐Durnerin 1996), and one study used an upper limit of 44 years of age (Engmann 1999). Six of these 21 studies defined lower limits of 18 years of age (Engmann 1999; Hauzman 2013; Huirne 2006a; Huirne 2006c; Nyboe Andersen 2011; Rombauts 2006).
Other common inclusion criteria were the presence of regular menstrual cycles (Blockeel 2012; Cédrin‐Durnerin 2007; Cédrin‐Durnerin 2012; Fanchin 2003; Garcia‐Velasco 2011; Hauzman 2013; Huirne 2006a; Nyboe Andersen 2011; Rombauts 2006; Ye 2009), and a body mass index (BMI) between 18 kg/m2 and 25 kg/m2 (Ye 2009), or less than 30 kg/m2 (Blockeel 2012; Cédrin‐Durnerin 2007; Cédrin‐Durnerin 2012; Fanchin 2003; Hauzman 2013; Huirne 2006a; Kolibianakis 2006; Rombauts 2006).
Exclusion criteria
Nine studies excluded women with an evidence of poor response. Two studies defined poor response as any previous ART cycles with less than three oocytes (Huirne 2006a; Huirne 2006c), Huirne 2006a also excluded women if they had a history of three or more consecutive ART cycles without a clinical pregnancy. One study defined poor response as development of fewer than four follicles in previous IVF or ICSI cycles (Blockeel 2012). Three studies defined poor response as fewer than five oocytes in a previous IVF attempt or fewer than five follicles in a spontaneous cycle (Cédrin‐Durnerin 2007; Cédrin‐Durnerin 2012; Hauzman 2013), and one study defined poor response as more than three unsuccessful controlled ovarian stimulation cycles or a history of low or no ovarian response during FSH/hMG (Rombauts 2006). Two studies did not mention how they defined poor response to ovarian stimulation (Garcia‐Velasco 2011; Kolibianakis 2006).
Other common exclusion criteria were: a high baseline serum FSH level (Cédrin‐Durnerin 2007; Cédrin‐Durnerin 2012; Ditkoff 1996; Engmann 1999; Huirne 2006a; Hwang 2004; Kolibianakis 2006; Nyboe Andersen 2011), evidence of ovarian cysts or endometrioma (Aston 1995; Engmann 1999; Kolibianakis 2006), and PCOS (Blockeel 2012; Garcia‐Velasco 2011; Hauzman 2013; Huirne 2006a; Kim 2011; Porrati 2010; Rombauts 2006; Vilela 2011).
Interventions
Three of the 29 studies had more than two study arms and were used in more than one comparison (four arms: Cédrin‐Durnerin 2007; three arms: Kim 2011; Rombauts 2006).
Combined oral contraceptive pill versus placebo or no pretreatment
In 17 trials (with 19 comparisons), the study group received pretreatment with a COCP, while the control group received no pretreatment. None of these studies used a placebo in the control group. Ten trials used ethinyl oestradiol as the oestrogen component in a daily dose of 30 μg (Cédrin‐Durnerin 2007; Garcia‐Velasco 2011; Huirne 2006a; Huirne 2006c; Kim 2011; Kolibianakis 2006; Nyboe Andersen 2011; Obruca 2002; Raoofi 2008; Rombauts 2006); seven trials used desogestrel 150 μg daily (Cédrin‐Durnerin 2007; Garcia‐Velasco 2011; Kolibianakis 2006; Nyboe Andersen 2011; Obruca 2002; Raoofi 2008; Rombauts 2006); three trials used levonorgestrel 150 μg daily as the progestogen component (Huirne 2006a; Huirne 2006c; Kim 2011); one trial used Diane‐35, which contained ethinyl oestradiol 35 μg and cyproterone acetate 2 mg (Hwang 2004); and two trials used a combination of ethinyl oestradiol 20 μg and levonorgestrel 100 μg (Porrati 2010; Vilela 2011). For other studies, there were not enough data available on the type of COCP used.
The starting days of pretreatment in 10 of the trials varied from cycle day one to five. Five studies started COCP pretreatment on cycle day one (Biljan 1998b; Kolibianakis 2006; Obruca 2002; Raoofi 2008; Rombauts 2006); two studies started the pretreatment on cycle day two or three (Cédrin‐Durnerin 2007; Huirne 2006a); one study started the pretreatment on a variable cycle day from one to five (Huirne 2006c); and one study started the pretreatment on cycle day five (Hwang 2004). There were not enough data available from five trials on the start day of pretreatment (Garcia‐Velasco 2011; Kim 2011; Nyboe Andersen 2011; Porrati 2010; Vilela 2011).
The duration of pretreatment in the 17 trials varied from 12 days to three consecutive cycles. Five studies used a fixed duration of 14 days of pretreatment (Biljan 1998b; Kolibianakis 2006; Raoofi 2008), or 21 days of pretreatment (Kim 2011; Porrati 2010); five studies used a variable duration of pretreatment of 12 to 16 days (Garcia‐Velasco 2011), 14 to 21 days (Nyboe Andersen 2011), 14 to 25 days (Vilela 2011), and 14 to 28 days (Huirne 2006a; Rombauts 2006). Three other studies used a variable duration of around two or three weeks minimum to around four weeks maximum (Cédrin‐Durnerin 2007, 15 to 21 days; Obruca 2002, 18 to 28 days; Huirne 2006c, 21 to 28 days). Hwang 2004 used the longest pretreatment duration of three consecutive cycles.
Two studies used agonists in both treatment groups. One study used buserelin acetate (long protocol) (Biljan 1998b) and one used a depot of triptorelin acetate (Raoofi 2008).
Ten studies used antagonists in both treatment groups. Four studies used ganirelix acetate (Blockeel 2012; Cédrin‐Durnerin 2007; Kolibianakis 2006; Rombauts 2006); three studies used cetrorelix acetate (Obruca 2002; Porrati 2010; Vilela 2011); one study used antide (Huirne 2006a); one study, a three‐arm parallel RCT, used cerotide in two of the treatment arms and a GnRH agonist in the second control arm (Kim 2011), and one study did not mention which GnRH antagonist was used (Nyboe Andersen 2011).
Four trials used an antagonist in the study group and an agonist in the control group. Two trials used cetrorelix acetate as antagonist and buserelin acetate as agonist (Huirne 2006c; Hwang 2004), and one used ganirelix acetate as antagonist and nafarelin acetate as agonist (Rombauts 2006). The other study did not mention which antagonists and agonists were used (Garcia‐Velasco 2011).
Progestogen versus placebo or no pretreatment
In seven trials, the study group was given a pretreatment with a progestogen, while the control group received placebo (Aston 1995), or no pretreatment (Cédrin‐Durnerin 2007; Ditkoff 1996; Engmann 1999; Hugues 1994; Salat‐Baroux 1988; Shaker 1995). Four studies used norethisterone 10 mg daily (Cédrin‐Durnerin 2007; Ditkoff 1996; Engmann 1999; Hugues 1994), one study used medroxyprogesterone acetate 10 mg daily (Aston 1995), and one study used ethynodiol acetate 4 mg daily (Salat‐Baroux 1988). Another study used a single injection of 100 mg, but did not mention what type of progestogen they used (Shaker 1995).
The starting days of pretreatment in all seven trials varied from cycle day one to 19. Two studies started the pretreatment with progestogen on cycle day one (Ditkoff 1996; Engmann 1999), two studies on cycle day 15 (Cédrin‐Durnerin 2007; Salat‐Baroux 1988), one study on cycle day 16 or 17 (Shaker 1995), and one study on cycle day 19 (Aston 1995). There were not enough data available from one study on the start day of pretreatment (Hugues 1994).
The duration of progestogen pretreatment varied from one to 21 days. In one study, the women received one single injection (Shaker 1995). One study used a duration of pretreatment of five days (Engmann 1999), one study used seven days (Aston 1995), and one study used eight days (Ditkoff 1996). Two trials used a variable duration of 10 to 15 days (Cédrin‐Durnerin 2007; Hugues 1994), and one trial used 11 to 17 days (Salat‐Baroux 1988).
Six trials used an agonist in both treatment groups. Three studies used buserelin acetate (Aston 1995; Engmann 1999; Shaker 1995), one study used triptorelin (Cédrin‐Durnerin 1996), one study used leuprolide acetate (Ditkoff 1996), and one study used dTRP6‐LHRH (Hugues 1994).
One trial used an antagonist (ganirelix acetate) in both treatment groups (Cédrin‐Durnerin 2007).
One trial did not use GnRH analogues for pituitary desensitisation. Women that participated in this study only received pure FSH and hMG (Salat‐Baroux 1988).
Oestrogen versus placebo or no pretreatment
In five trials, the study group was given a pretreatment with oestrogen, while the control group received no pretreatment. Three studies used 17β‐oestradiol (Cédrin‐Durnerin 2007; Cédrin‐Durnerin 2012; Fanchin 2003), and two studies used oestradiol valerate (Franco Jr 2003; Ye 2009). All these studies used 4 mg daily.
The starting days of pretreatment varied from cycle day 15 to 21. One study started the pretreatment on cycle day 20 (Fanchin 2003), and two on cycle day 21 (Franco Jr 2003; Ye 2009). One study started pretreatment seven days before the presumed onset of menses and administered up to the next Thursday after the occurrence of menstrual bleeding (Cédrin‐Durnerin 2012). One remaining study started the pretreatment 10 days before the presumed menses (Cédrin‐Durnerin 2007).
The duration of pretreatment varied from 10 to 17 days. In two studies the duration varied from 7 to 15 days (Cédrin‐Durnerin 2007; Cédrin‐Durnerin 2012). Three studies used a fixed duration of pretreatment of 10 days (Ye 2009), 11 days (Fanchin 2003), and 14 days (Franco Jr 2003).
Three trials used an antagonist in both treatment groups, one trial used ganirelix acetate (Cédrin‐Durnerin 2007), one trial used cetrorelix acetate (Fanchin 2003), and one trial did not report the name of the antagonist (Cédrin‐Durnerin 2012).
Two trials used an antagonist in the intervention group and an agonist in the control group, one trial used ganirelix acetate in the intervention group and nafarelin acetate in the control group (Franco Jr 2003), and one study used cetrotide in the intervention group and triptoreline in the control group (Ye 2009).
Combined oral contraceptive pill versus progestogen
There was only one study that compared COCP with progestogen (Cédrin‐Durnerin 2007). The women in the COCP group received ethinyl oestradiol 30 μg plus desogestrel 150 μg daily and the women in the progestogen group received norethisterone 10 mg daily. This study started the COCP pretreatment on cycle day two or three with a duration of 15 to 21 days. The progestogen pretreatment was started on cycle day 15 with a duration of 10 to 15 days. Both groups received the GnRH antagonist, ganirelix acetate.
Combined oral contraceptive pill versus oestrogen
Four trials compared a pretreatment of COCP with a pretreatment of oestrogen. One trial used ethinyl oestradiol 30 μg plus desogestrel 150 μg daily as a COCP and micronised 17β‐oestradiol 4 mg daily as oestrogen pretreatment (Cédrin‐Durnerin 2007). The COCP pretreatment started on cycle day two or three with a duration of 15 to 21 days. The oestrogen pretreatment started 10 days before the presumed menses with a duration of 10 to 15 days and both groups received the GnRH antagonist, ganirelix acetate. Another study used ethinyl oestradiol 30 μg plus levonorgestrel 150 μg daily as a COCP and oestradiol valerate 4 mg daily as oestrogen pretreatment (Hauzman 2013). The COCP pretreatment started on cycle day one or two and continued for 12 to 16 days. The oestrogen pretreatment started from day 20 of menstrual cycle for five to 12 days until the day before starting stimulation and both groups received the GnRH antagonist, ganirelix acetate. One study used ethinyl oestradiol plus desogestrel as COCP starting from day two to four of the cycle but their doses were not reported (Lukaszuk 2015). In the control group, women were pretreated with oral oestradiol 2 mg twice daily from the day 20 of the natural cycle to day one to four of the new cycle. Both groups received the GnRH agonist, triptorelin. One study did not mention which COCP was used, but used ethinyl oestradiol 2 mg as an oestrogen pretreatment (Daly 2002). This study only described that the oestrogen pretreatment was administered in the luteal phase of the preparation cycle, but did not report the exact starting days and durations of pretreatment. The COCP group received the GnRH agonist, leuprolide acetate, and the oestrogen group received the GnRH antagonist, ganirelix acetate.
Progestogen versus oestrogen
There was only one study that compared progestogen with oestrogen (Cédrin‐Durnerin 2007). The women in the progestogen group received norethisterone 10 mg daily and the women in the oestrogen group received micronised 17β‐oestradiol 4 mg daily. This study started the progestogen pretreatment on cycle day 15 with a duration of 10 to 15 days. The oestrogen pretreatment started 10 days before the presumed menses with also a duration of 10 to 15 days. Both groups received the GnRH antagonist, ganirelix acetate.
Outcomes
Primary outcome
Fifteen studies reported the number of live births or ongoing pregnancies (Cédrin‐Durnerin 2007; Cédrin‐Durnerin 2012; Daly 2002; Ditkoff 1996; Engmann 1999; Franco Jr 2003; Garcia‐Velasco 2011; Hauzman 2013; Huirne 2006a; Huirne 2006c; Kim 2011; Kolibianakis 2006; Nyboe Andersen 2011; Rombauts 2006; Ye 2009). Three studies defined ongoing pregnancy as a positive heart activity at a gestational age of 12 weeks (Huirne 2006a; Huirne 2006c; Kim 2011). One study used the same definition but did not mention when they performed the ultrasound scan (Ditkoff 1996). Two studies defined ongoing pregnancy as a pregnancy developing beyond 12 weeks (Cédrin‐Durnerin 2007; Kolibianakis 2006), and one study defined ongoing pregnancy as a pregnancy assessed by ultrasound at 12 to 16 weeks or later (Rombauts 2006). The remaining studies did not mention how they assessed ongoing pregnancy (Cédrin‐Durnerin 2012; Daly 2002; Engmann 1999; Franco Jr 2003; Garcia‐Velasco 2011; Hauzman 2013; Nyboe Andersen 2011; Ye 2009).
Ten studies reported the number of pregnancy losses. One study described this as the proportion of women with initially positive hCG in whom pregnancy failed to develop beyond 12 weeks of gestation (Kolibianakis 2006). The other nine studies did not describe a definition (Daly 2002; Engmann 1999; Franco Jr 2003; Garcia‐Velasco 2011; Hwang 2004; Kim 2011; Rombauts 2006; Salat‐Baroux 1988; Ye 2009).
Secondary outcomes
Twenty‐one studies reported the number of clinical pregnancies. Three studies defined clinical pregnancy as the presence of one or more foetal hearts confirmed with ultrasound, performed at least four weeks after embryo transfer (Fanchin 2003 or from six weeks after embryo transfer (Franco Jr 2003; Kim 2011). Two other studies used the same definition, but one of these also included the foetal sacs without heart activity (Huirne 2006c), and the other performed the ultrasound scan at seven weeks after embryo transfer (Hwang 2004). One study defined clinical pregnancy as the presence of one or more intrauterine sacs confirmed with ultrasound, at a gestational age of six weeks (Huirne 2006a). In one study, we used a positive pregnancy test with evidence of a gestational sac to define clinical pregnancy, because no clinical or ongoing pregnancy rate was available (Engmann 1999). One study defined clinical pregnancy as the evidence of a clinical gestational sac (Ditkoff 1996). In the other 12 studies, it was unclear how they defined this outcome (Aston 1995; Blockeel 2012; Cédrin‐Durnerin 2007; Cédrin‐Durnerin 2012; Daly 2002; Garcia‐Velasco 2011; Hauzman 2013; Nyboe Andersen 2011; Obruca 2002; Porrati 2010; Salat‐Baroux 1988; Ye 2009). If no clinical pregnancy rates were reported, we used the ongoing pregnancy rates (if available) for our analysis.
Ten studies reported the number of oocytes retrieved (Cédrin‐Durnerin 2007; Ditkoff 1996; Franco Jr 2003; Huirne 2006a; Huirne 2006c; Hwang 2004; Kim 2011; Obruca 2002; Rombauts 2006; Salat‐Baroux 1988). One study only mentioned the number of cumulus‐oocyte complexes (Kolibianakis 2006), and two studies mentioned the number of mature oocytes or follicles (Engmann 1999; Fanchin 2003), but we assumed that this meant the same as the number of oocytes retrieved and, therefore, we pooled the data of these studies.
Thirteen studies reported the number of days of gonadotrophin treatment (Blockeel 2012; Ditkoff 1996; Engmann 1999; Franco Jr 2003; Hauzman 2013; Huirne 2006a; Huirne 2006c; Hwang 2004; Kim 2011; Kolibianakis 2006; Porrati 2010; Rombauts 2006; Vilela 2011).
Thirteen studies reported the amount of gonadotrophins administered (Blockeel 2012; Cédrin‐Durnerin 2007; Cédrin‐Durnerin 2012; Fanchin 2003; Franco Jr 2003; Hauzman 2013; Huirne 2006a; Huirne 2006c; Kim 2011; Kolibianakis 2006; Porrati 2010; Rombauts 2006; Vilela 2011). Two studies reported the amount of gonadotrophins administered in the number of ampoules used, but we could not use these data in our analysis (Ditkoff 1996; Engmann 1999).
Other adverse outcomes
Six studies reported the number of women with ovarian cysts. In one study, we used the number of functional ovarian cysts with a diameter of 10 mm or more, measured after one week of GnRH agonist treatment (Engmann 1999). Three studies defined an ovarian cyst as an intraovarian sonolucent structure with a mean diameter of 14 mm or more, measured after seven days (Aston 1995) or eight days (Ditkoff 1996) of pituitary suppression, or on a day not specified (Franco Jr 2003). One study did not mention how they defined ovarian cyst formation and when they measured this (Huirne 2006a). One study only reported cyst formation as a reason for cycle cancellation, but it was unclear if there were more cysts formed that did not lead to cycle cancellation (Salat‐Baroux 1988). We did not use these data in our analysis.
Six studies reported the number of multiple pregnancies. One study defined multiple pregnancies as multiple clinical pregnancies (Huirne 2006c). One study described the number of ongoing or live born twin pregnancies (Hwang 2004). Four studies did not describe when the number of multiple pregnancies was measured (Cédrin‐Durnerin 2007; Franco Jr 2003; Garcia‐Velasco 2011; Kim 2011).
Five studies reported the number of women with OHSS. Two study used the WHO classification criteria to diagnose OHSS and divided the women in categories of mild (grade I), moderate (grade II) or severe (grade III) (Nyboe Andersen 2011; Rombauts 2006); the other three studies did not mention how they diagnosed OHSS (Franco Jr 2003; Hwang 2004; Ye 2009).
Six studies did not contribute data to the analyses: two of these studies reported 'per cycle' data and the numbers of cycles were not equivalent to the numbers of participants (Biljan 1998b; Shaker 1995); outcomes reported included clinical pregnancy rate, number of days of GnRH agonist and number of oocytes retrieved. One study reported outcome data in denominators other than 'per woman' such as 'per cycle', 'per embryo transfer' (Lukaszuk 2015), outcomes reported included clinical pregnancy, number of oocyte retrieved, multiple pregnancy, duration of stimulation days. Three studies had no available outcome data relevant to the review (Hugues 1994; Raoofi 2008; Tan 2001).
Excluded studies
A total of 86 studies that described pretreatments with COCPs, progestogens or oestrogens were not eligible for inclusion for various reasons. Some of these studies had multiple reasons for exclusion, but we reported the most important reason. Full details of reasons for exclusion can be found in the Characteristics of excluded studies table.
-
Twenty studies did not randomise their participants using standardized randomization procedures such as a computer or a random number table (Benadiva 1988; Cédrin‐rDurnerin 1995; Cohen 1987; Copperman 2003; Couzinet 1995; Ditkoff 1997; Forman 1991; Frydman 1986; Galera 2004; Godin 2003; Gonen 1990; Lindheim 1996; Neal 1993; Palomba 2008; Schoolcraft 1997; Surrey 1989; Tarlatzis 1993; Wang 2016; Weisman 1989; Yokota 2006).
-
Twenty‐four studies used a retrospective design (al‐Mizyen 2000; Bellver 2007; Bendikson 2006; Biljan 1998c; Chung 2006; Damario 1997; Dickey 2001; Duvan 2008; Frederick 2004; Gonzalez 1995; Keltz 2007; Kovacs 2001; Leondires 1999; Loutradis 2003; Min 2005; Mirkin 2003; Pados 1995; Pinkas 2008; Ramsewak 2005; Talebian 2004; Talebian 2007; Wei 2016; Yoshida 2005; Zhao 2008).
-
In five studies, participants served as their own controls in previous cycles (Branigan 1998; Fanchin 2003b; Fisch 1996; Mulangi 1997; Surrey 1998).
-
There was insufficient information in five studies to determine their true randomization status (Aghahosseini 2011; Bakas 2014; Davar 2014; Engels 2011; Merviel 2015).
-
Three studies used a cross‐over design and there were no available pre‐cross‐over data (Cédrin‐Durnerin 1996; Fanchin 2001; Wang 2008).
-
Eight studies used a single‐arm design (Brodt 1993; De Ziegler 1999; Gerli 1989; Hugues 1992; Meldrum 2002; Meldrum 2008; Sanghvi 2002; Tehraninejad 2010).
-
Nine studies compared two (or more) different dosages, timings or ways of administration of the same pretreatment (Davy 2004; Gomez 2000; Haydardedeoglu 2012; Karande 2004; Kreiner 2007; Lewin 2002; Liu 2011; Mashiach 1989; Russell 1997).
-
Two studies used interventions that were administered for luteal phase support and not for pretreatment (Ghanem 2015; Rashidi 2011).
-
In three studies, women only received ovarian stimulation, but no embryo transfer was performed as part of an ART cycle (Anderson 1990; Letterie 2000; Steinkampf 1991).
-
In two studies, the women were oocyte donors (Doody 2001; Martinez 2006).
-
In one study, the women had premature ovarian failure (Tartagni 2007).
-
In two studies, pretreatment was not stopped before oocyte retrieval, but continued to be used as luteal phase support (Greco 2016; Jung 2000).
-
In one study, the main comparison was mild versus standard stimulation (with pretreatment in one group) (Youssef 2017).
Risk of bias in included studies
A complete overview of classification of risk of bias domains can be found in the Characteristics of included studies table and in Figure 1 and Figure 2.
Allocation
Eighteen studies were at low risk of random sequence generation: 13 of these studies used computer generated random numbers to randomise the women (Biljan 1998b; Blockeel 2012; Engmann 1999; Fanchin 2003; Garcia‐Velasco 2011; Hauzman 2013; Huirne 2006a; Huirne 2006c; Hwang 2004; Kim 2011; Kolibianakis 2006; Lukaszuk 2015; Ye 2009), four studies used a table of random numbers (Cédrin‐Durnerin 2007; Cédrin‐Durnerin 2012; Franco Jr 2003; Shaker 1995), and one study accomplished the randomization by tossing a coin (Ditkoff 1996). In the remaining 11 studies, there was insufficient information on the methods used in random sequence generation; they were thus rated at unclear risk of bias with respect to random sequence generation.
If randomization is not done correctly, there might be a difference in baseline characteristics between the women in the treatment groups. This may influence the outcomes measured in the trial. Therefore, it is important that the method of randomization is reported. Due to the high number of included studies that did not report the method of randomization (15/33 studies), there might be a higher risk of bias.
Fourteen studies were at low risk of allocation concealment: eight studies used sealed envelopes to conceal the allocation (Biljan 1998b; Blockeel 2012; Cédrin‐Durnerin 2007; Cédrin‐Durnerin 2012; Garcia‐Velasco 2011; Hauzman 2013; Hwang 2004; Shaker 1995); in five studies the allocation was done by a third party (Aston 1995, hospital pharmacy and numbered bottles; Engmann 1999, clinic nurses and sealed envelopes; Fanchin 2003, independent person; Huirne 2006a, independent person from independent monitoring company; Rombauts 2006, central remote allocation); one study centralised the randomization process (Ditkoff 1996).
Two studies were classified at high risk of allocation concealment, because they reported that the sequence of allocation was not concealed (Franco Jr 2003; Kolibianakis 2006). In the remaining 14 studies, there was insufficient information to make a conclusive judgement with respect to allocation concealment and these were rated at unclear risk of bias in this domain.
Most of the outcomes of this review were objectively assessed; thus a poorly designed allocation concealment method is not likely to have a big influence on these outcomes. For example, the number of live births is not likely to be influenced by the clinician if he or she knows which treatment the woman receives. However, some outcomes, such as OHSS, are diagnosed on clinical symptoms and so there might be a more important risk of bias when the clinician was aware of the treatment assigned to each woman. Nevertheless, outcomes that are objectively assessed may be influenced indirectly if allocation is not concealed.
Blinding
One study was at low risk of blinding because it was described as double blind and placebo controlled (Aston 1995).
In 20 studies, there was insufficient information with respect to blinding of clinicians, participants and outcome assessors; these studies were assessed at unclear risk with regard to blinding (Biljan 1998b; Blockeel 2012; Cédrin‐Durnerin 2012; Engmann 1999; Fanchin 2003; Franco Jr 2003; Garcia‐Velasco 2011; Hauzman 2013; Hugues 1994; Huirne 2006c; Hwang 2004; Kim 2011; Lukaszuk 2015; Obruca 2002; Porrati 2010; Rombauts 2006; Salat‐Baroux 1988; Shaker 1995; Tan 2001; Vilela 2011).
The remaining eight studies were at high risk of bias because they were described as either open label or not blinded with personnel and participants having knowledge of the treatment allocation.
Poor blinding is less likely to influence the objective outcomes such as live birth, but it might have a bigger influence on the diagnosis of OHSS.
Incomplete outcome data
Of the 29 studies, 13 were at low risk of attrition bias (Blockeel 2012; Ditkoff 1996; Engmann 1999; Hauzman 2013; Huirne 2006a; Huirne 2006c; Kim 2011; Kolibianakis 2006; Nyboe Andersen 2011; Porrati 2010; Rombauts 2006; Vilela 2011; Ye 2009). In these trials, the proportions of, and reasons for, withdrawals were balanced between the treatment groups or data were analyzed using an ITT basis where all women randomized at baseline were included in the analysis.
In 10 studies, there were insufficient information with respect to the proportions of, and reasons for, withdrawals or losses to follow‐up and data were not analyzed on an ITT basis; these studies were rated at unclear risk of attrition bias (Biljan 1998b; Cédrin‐Durnerin 2007; Daly 2002; Garcia‐Velasco 2011; Hugues 1994; Lukaszuk 2015; Obruca 2002; Raoofi 2008; Shaker 1995; Tan 2001).
The remaining six studies were at high risk of attrition bias because the proportions of, and reasons for, withdrawals were not balanced between the treatment groups and data were not analyzed by ITT.
Incomplete outcome data can bias the results of our review, especially with regard to adverse outcomes. For example, a study might have withdrawals due to OHSS that they do not report. Also imbalances in reasons for withdrawal can occur because of differences in interventions between the study group and control group. For example, when there are more withdrawals due to OHSS in the control group, this can be in favour of the intervention used in the study group. The risk of bias might increase if authors do not report this.
Selective reporting
We were unable to retrieve the protocol of any of the included studies to examine whether all prespecified outcomes were reported. However, we examined the Methods sections of the studies to determine whether outcomes planed in the Methods section were eventually reported. In this regard, we classified 16 studies at low risk of selective reporting because these trials reported data on all the outcomes mentioned in the 'Methods' section of their publication (Blockeel 2012; Cédrin‐Durnerin 2012; Engmann 1999; Garcia‐Velasco 2011; Hauzman 2013; Huirne 2006a; Huirne 2006c; Hwang 2004; Kim 2011; Kolibianakis 2006; Lukaszuk 2015; Nyboe Andersen 2011; Porrati 2010; Rombauts 2006; Shaker 1995; Ye 2009). In two studies, there was insufficient information in the 'Methods' sections to make a conclusive judgement with respect to selective reporting of outcomes; therefore, they were rated at unclear risk of reporting bias (Raoofi 2008; Vilela 2011). In the remaining 11 studies, there was evidence of selective reporting as data were not reported on all the outcomes pre‐specified in the protocol or Methods section.
Other potential sources of bias
For other potential sources of bias, we examined the baseline demographic characteristics of participants, such as age and BMI, to determine whether there was substantial imbalance in baseline demographic characteristics between the treatment groups. In this regard, 22 studies were at low risk of bias in this domain because of the absence of substantial imbalance between in baseline demographic characteristics between the treatment groups (Aston 1995; Biljan 1998b; Blockeel 2012; Cédrin‐Durnerin 2007; Cédrin‐Durnerin 2012; Ditkoff 1996; Engmann 1999; Fanchin 2003; Franco Jr 2003; Garcia‐Velasco 2011; Hauzman 2013; Huirne 2006a; Huirne 2006c; Hwang 2004; Kim 2011; Kolibianakis 2006; Lukaszuk 2015; Nyboe Andersen 2011; Rombauts 2006; Salat‐Baroux 1988; Shaker 1995; Ye 2009).
The remaining seven studies were rated as being at unclear risk due to insufficient information to make a conclusive judgement with respect to baseline demographic characteristics in the treatment groups.
Effects of interventions
See: Summary of findings for the main comparison Combined oral contraceptive pill compared to no pretreatment for ovarian stimulation protocols for women undergoing assisted reproductive techniques; Summary of findings 2 Progestogen compared to placebo or no pretreatment for ovarian stimulation protocols for women undergoing assisted reproductive techniques; Summary of findings 3 Oestrogen compared to no pretreatment for ovarian stimulation protocols for women undergoing assisted reproductive techniques
1. Combined oral contraceptive pill versus no pretreatment
Eight studies compared COCP versus no pretreatment (Cédrin‐Durnerin 2007; Garcia‐Velasco 2011; Huirne 2006c; Huirne 2006a; Kim 2011; Kolibianakis 2006; Nyboe Andersen 2011; Rombauts 2006).
Primary outcomes
1.1. Live birth or ongoing pregnancy
See Figure 4 and Analysis 1.1.
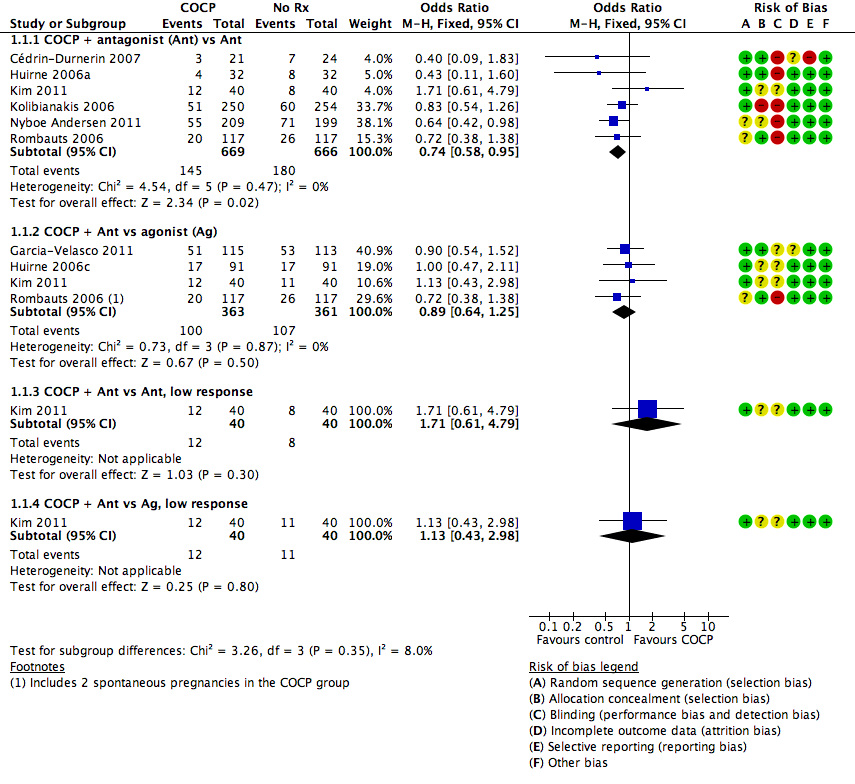
Forest plot of comparison: 1 Combined oral contraceptive pill (OCP) versus no pretreatment (Rx), outcome: 1.1 Live birth or ongoing pregnancy.
1.1.1. Combined oral contraceptive pill plus antagonist versus antagonist
There was a lower rate of live birth or ongoing pregnancy in women pretreated with COCP compared with no pretreatment (OR 0.74, 95% CI 0.58 to 0.95; 6 RCTs; 1335 women; I2 = 0%; moderate quality evidence). The evidence suggested that if the chance of a live birth or ongoing pregnancy following no pretreatment was assumed to be 27%, the chance following pretreatment with COCP would be between 18% and 26%.
1.1.2. Combined oral contraceptive pill plus antagonist versus agonist
There was no clear evidence of a difference between the two treatment groups in live birth or ongoing pregnancy rates (OR 0.89, 95% CI 0.64 to 1.25; 4 RCTs; 724 women; I2 = 0%; moderate quality evidence). The evidence suggested that if the chance of a live birth or ongoing pregnancy following no pretreatment was assumed to be 24%, the chance following pretreatment with COCP would be between 16% and 26%.
1.1.3. Combined oral contraceptive pill plus antagonist versus antagonist, low response
Among women with low response, there was insufficient evidence to determine whether there was a difference between the groups in live birth or ongoing pregnancy rates (OR 1.71, 95% CI 0.61 to 4.79; 1 RCT; 80 women).
1.1.4. Combined oral contraceptive pill plus antagonist versus agonist, low response
Among women with low response, there was insufficient evidence to determine whether there was a difference between the two treatment groups in live birth or ongoing pregnancy rates (OR 1.13, 95% CI 0.43 to 2.98; 1 RCT; 80 women).
1.2. Pregnancy loss
See Figure 5 and Analysis 1.2.
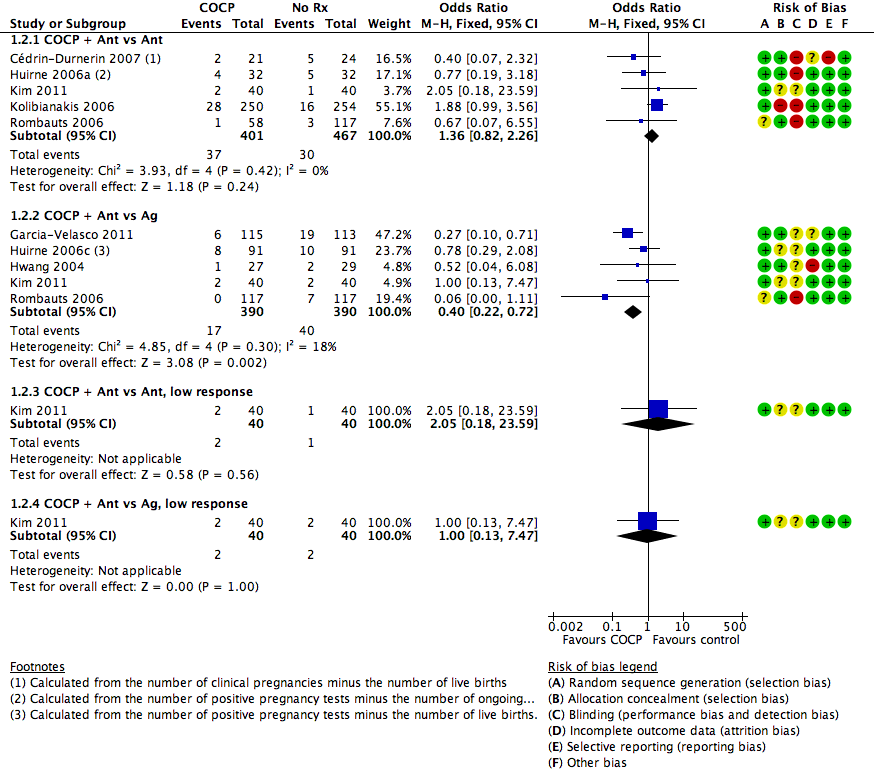
Forest plot of comparison: 1 Combined oral contraceptive pill (COCP) versus no pretreatment (Rx), outcome: 1.2 Pregnancy loss.
1.2.1. Combined oral contraceptive pill plus antagonist versus antagonist
There was no clear evidence of a difference between the groups in rates of pregnancy loss (OR 1.36, 95% CI 0.82 to 2.26; 5 RCTs; 868 women; I2 = 0%; moderate quality evidence). The evidence suggested that if the risk of a pregnancy loss following no pretreatment was assumed to be 6%, the risk following pretreatment with COCP would be between 5% and 13%.
1.2.2. Combined oral contraceptive pill plus antagonist versus agonist
There were fewer pregnancy losses recorded in women who had COCP pretreatment than in those who had no pretreatment (OR 0.40, 95% CI 0.22 to 0.72; 5 RCTs; 780 women; I2 = 18%; moderate quality evidence). The evidence suggested that if the risk of a pregnancy loss following no pretreatment was assumed to be 10%, the risk following pretreatment with COCP would be between 3% and 8%.
1.2.3. Combined oral contraceptive pill plus antagonist versus antagonist, low response
Among women with low response, there was insufficient evidence to determine whether there was a difference between the groups in rates of pregnancy loss (OR 2.05, 95% CI 0.18 to 23.59; 1 RCT; 80 women).
1.2.4. Combined oral contraceptive pill plus antagonist versus agonist, low response
Among women with low response, there was insufficient evidence to determine whether there was a difference between the groups in rates of pregnancy loss (OR 1.00, 95% CI 0.13 to 7.47; 1 RCT; 80 women).
Secondary outcomes
1.3. Clinical pregnancy rate
See Analysis 1.3.
1.3.1. Combined oral contraceptive pill plus antagonist versus antagonist
There was no clear evidence of a difference between the two treatment groups in clinical pregnancy rates (OR 0.85, 95% CI 0.63 to 1.15; 5 RCTs; 740 women; I2 = 76%). The presence of substantial heterogeneity was explored in sensitivity analysis and there was no change in the evidence using a random‐effects model (OR 0.86, 95% CI 0.39 to 1.91) or risk ratio (RR) (RR 0.90, 95% CI 0.73 to 1.11).
1.3.2. Combined oral contraceptive pill plus antagonist versus agonist
There was no clear evidence of a difference between the two treatment groups in clinical pregnancy rates (OR 0.84, 95% CI 0.59 to 1.20; 4 RCTs; 546 women; I2 = 0%).
1.3.3. Combined oral contraceptive pill plus antagonist versus antagonist, low response
Among women with low response, there was insufficient evidence to determine whether there was a difference between the groups in rates of clinical pregnancy (OR 1.85, 95% CI 0.69 to 4.97; 1 RCT; 80 women).
1.3.4. Combined oral contraceptive pill plus antagonist versus agonist, low response
Among women with low response, there was insufficient evidence to determine whether there was a difference between the groups in rates of clinical pregnancy (OR 1.12, 95% CI 0.44 to 2.83); 1 RCT; 80 women).
1.3.5. Combined oral contraceptive pill plus agonist versus agonist
Two studies reported this comparison, but neither reported data suitable for analysis. One (Biljan 1998b) reported per‐cycle data and found no evidence of a difference between the groups. A second study reported a pregnancy rate of 9% in the study group and 11% in the control group, but did not report the number of women per group (Raoofi 2008).
1.4. Multiple pregnancy rate
See Analysis 1.4.
1.4.1. Combined oral contraceptive pill plus antagonist versus antagonist
There was insufficient evidence to determine whether there was a difference between the groups in multiple pregnancy rates (OR 2.21, 95% CI 0.53 to 9.26; 2 RCTs; 125 women; I2 = 0%; low quality evidence). The evidence suggested that if the risk of multiple pregnancy following no pretreatment was assumed to be 5%, the risk following pretreatment with COCP would be between 3% and 31%.
1.4.2. Combined oral contraceptive pill plus antagonist versus agonist
There was insufficient evidence to determine whether there was a difference between the groups in multiple pregnancy rates (OR 1.36, 95% CI 0.85 to 2.19; 4 RCTs; 546 women; I2 = 0%; moderate quality evidence). The evidence suggested that if the risk of multiple pregnancy following no pretreatment was assumed to be 5%, the risk following pretreatment with COCP would be between 4% and 10%.
1.4.3. Combined oral contraceptive pill plus antagonist versus antagonist, low response
Among women with low response, there was insufficient evidence to determine whether there was a difference between the groups in multiple pregnancy rate (OR 2.11, 95% CI 0.36 to 12.24; 1 RCT; 80 women).
1.4.4. Combined oral contraceptive pill plus antagonist versus agonist, low response
Among women with low response, there was insufficient evidence to determine whether there was a difference between the groups in the multiple pregnancy rate (OR 1.37, 95% CI 0.29 to 6.56; 1 RCT; 80 women).
1.5. Ovarian hyperstimulation syndrome rate
See Analysis 1.5.
1.5.1. Combined oral contraceptive pill plus antagonist versus antagonist
There was insufficient evidence to determine whether there was a difference between the groups in OHSS rates (OR 0.98, 95% CI 0.28 to 3.40; 2 RCTs; 642 women; I2 = 0%, low quality evidence).
1.5.2. Combined oral contraceptive pill plus antagonist versus agonist
There was insufficient evidence to determine whether there was a difference between the groups in OHSS rates (OR 0.63, 95% CI 0.20 to 1.96; 2 RCTs; 290 women; I2 = 0%, low quality evidence).
1.6. Number of oocytes retrieved
See Analysis 1.6.
1.6.1. Combined oral contraceptive pill plus antagonist versus antagonist
There was no clear evidence of a difference between the groups in the mean number of oocytes retrieved (MD 0.44, 95% CI ‐0.11 to 0.99; 6 RCTs; 1077 women; I2 = 59%).
1.6.2. Combined oral contraceptive pill plus antagonist versus agonist
There was no clear evidence of a difference between the two treatment groups in the mean number of oocytes retrieved (MD 0.07, 95% CI ‐0.67 to 0.81; 4 RCTs; 552 women; I2 = 0%).
1.6.3. Combined oral contraceptive pill plus antagonist versus antagonist, low response
Among women with low response, there was no clear evidence of a difference between the groups in the mean number of oocytes retrieved (MD 0.70, 95% CI ‐0.11 to 1.51; 1 RCT; 80 women).
1.6.4. Combined oral contraceptive pill plus antagonist versus agonist, low response
Among women with low response, there was no evidence of a difference between the groups in the number of oocytes retrieved (MD 0.10, 95% CI ‐0.75 to 0.95; 1 RCT; 80 women).
1.6.5. Combined oral contraceptive pill plus agonist versus agonist
Two studies looked at the number of oocytes retrieved, but the data were unsuitable for analysis. The first study reported a median of 11 oocytes retrieved (range seven to 19) in the study group (51 cycles) and a median of 10 oocytes retrieved (range seven to 15) in the control group (51 cycles) (Biljan 1998a). The second study reported a mean number of oocytes retrieved of approximately 5 (± 3) in the study group and 5 (± 6) in the control group, but did not report the number of women or cycles in each treatment group (Raoofi 2008).
1.7. Days of gonadotrophin treatment
See Analysis 1.7.
1.7.1. Combined oral contraceptive pill plus antagonist versus antagonist
Six RCTs reported days of gonadotrophin treatment but data were unsuitable for pooling due to extreme statistical heterogeneity (I2 = 95%) with differing directions of effect.
1.7.2. Combined oral contraceptive pill plus antagonist versus agonist
Four RCTs reported days of gonadotrophin treatment but data were unsuitable for pooling due to extreme statistical heterogeneity (I2 = 95%) with differing directions of effect.
1.7.3. Combined oral contraceptive pill plus antagonist versus antagonist, low response
Among women with low response, there was no evidence of a difference between the groups in the mean days of gonadotrophin treatment (MD 0.10 days, 95% CI ‐0.47 to 0.67; 1 RCT; 80 women).
1.7.4. Combined oral contraceptive pill plus antagonist versus agonist, low response
Among women with low response, the mean number of days of gonadotrophin treatment was lower in women who had COCP treatment than in women who received no COCP pretreatment (MD ‐1.40 days, 95% CI ‐2.02 to ‐0.78; 1 RCT; n = 80).
1.7.5. Combined oral contraceptive pill plus agonist versus agonist
Only one study reported on the number of days of gonadotrophin treatment (Biljan 1998a). This study found a median of 10 days (range nine to 11) in the study group (51 cycles) and a median of 12 days (range 11 to 12) in the control group (51 cycles). The data were unsuitable for analysis.
1.8. Amount of gonadotrophins administered
See Analysis 1.8.
1.8.1. Combined oral contraceptive pill plus antagonist versus antagonist
More gonadotrophins were administered to the group who received pretreatment with a COCP than in the group who did not (MD 190.10 IU/L, 95% CI 134.91 to 245.28; 7 RCTs; 1275 women; I2 = 88%). Sensitivity analysis using a random‐effects model did not change the statistical significance of this finding (MD 306.84 IU/L, 95% CI 112.13 to 501.56).
1.8.2. Combined oral contraceptive pill plus antagonist versus agonist
Three RCTs reported the amount of gonadotrophins but data were unsuitable for pooling due to extreme statistical heterogeneity (I2 = 94%) with differing directions of effect.
1.8.3. Combined oral contraceptive pill plus antagonist versus antagonist, low response
Among women with low response, there was no clear evidence of a difference between the two treatment groups in the mean amount of gonadotrophin administered (MD 20.00 IU/L, 95% CI ‐165.39 to 205.39; 1 RCT; 80 women).
1.8.4. Combined oral contraceptive pill plus antagonist versus agonist, low response
Among women with low response, the mean amount of gonadotrophin administered in the COCP group was lower than in the group who were not pretreated (MD ‐349.00, 95% CI ‐537.92 to ‐160.08; 1 RCT; 80 women).
1.9. Ovarian cyst formation rate
1.9.1. Combined oral contraceptive pill plus antagonist versus antagonist
There was insufficient evidence to determine whether there was a difference between the groups in the number of women with ovarian cyst formation (OR 0.47, 95% CI 0.08 to 2.75; 1 RCT; 64 women).
1.9.2. Combined oral contraceptive pill plus agonist versus agonist
Two studies reported on cyst formation, but the data were unsuitable for analysis. The first study found that there was no cyst formation in the intervention group (51 cycles) and cysts in 27 women in the control group (51 cycles) (Biljan 1998a). This result was statistically significant according to the authors (OR 0.07, 95% CI 0.03 to 0.16; P < 0.0001). Raoofi 2008 reported no women with cyst formation in either group.
2. Progestogen versus placebo or no pretreatment
Four studies compared progestogen versus placebo or no treatment (Cédrin‐Durnerin 2007; Ditkoff 1996; Engmann 1999; Salat‐Baroux 1988).
Primary outcomes
2.1. Live birth or ongoing pregnancy
2.1.1. Progestogen plus agonist versus agonist
There was insufficient evidence to determine whether there was a difference between the groups in live birth or ongoing pregnancy rates (OR 1.35, 95% CI 0.69 to 2.65; 2 RCTs; 222 women; I2 = 24%; low quality evidence). The evidence suggested that if the chance of a live birth or ongoing pregnancy following placebo or no pretreatment was assumed to be 17%, the chance following pretreatment with progestogen would be between 12% and 35%.
2.1.2. Progestogen plus antagonist versus antagonist
There was insufficient evidence to determine whether there was a difference between the groups in live birth or ongoing pregnancy rates (OR 0.67, 95% CI 0.18 to 2.54; 1 RCT; 47 women; low quality evidence). The evidence suggested that if the chance of a live birth or ongoing pregnancy following placebo or no pretreatment was assumed to be 25%, the chance following pretreatment with progestogen would be between 3% and 76%.
2.1.3. Progestogen plus gonadotrophins versus gonadotrophins
There was insufficient evidence to determine whether there was a difference between the groups in live birth or ongoing pregnancy rates (OR 0.63, 95% CI 0.09 to 4.23; 1 RCT; 42 women).
2.2. Pregnancy loss
2.2.1. Progestogen plus agonist versus agonist
There was insufficient evidence to determine whether there was a difference between the groups in rates of pregnancy loss (OR 2.26, 95% CI 0.67 to 7.55; 2 RCTs; 222 women; I2 = 0%; low quality evidence). The evidence suggested that if the risk of a pregnancy loss following placebo or no pretreatment was assumed to be 4%, the risk following pretreatment with progestogen would be between 2% and 22%.
2.2.2. Progestogen plus antagonist versus antagonist
The only study in this subgroup did not report on the number of pregnancy losses (Cédrin‐Durnerin 2007), but we calculated this number by subtracting the number of live births from the number of clinical pregnancies. There was no evidence of a difference in rates of pregnancy losses between the two treatment groups (OR 0.36, 95% CI 0.06 to 2.09; 1 RCT; 47 women; low quality evidence). The evidence suggested that if the risk of a pregnancy loss following placebo or no pretreatment was assumed to be 25%, the risk following pretreatment with progestogen would be between 1% and 67%.
2.2.3. Progestogen plus gonadotrophins versus gonadotrophins
The only trial in this subgroup found one pregnancy loss in each treatment group. Thus, there was insufficient evidence to determine whether there was a difference between the groups in rates of pregnancy loss (OR 1.00, 95% CI 0.06 to 17.12; 1 RCT; 42 women).
Secondary outcomes
2.3. Clinical pregnancy rate
2.3.1. Progestogen plus agonist versus agonist
We pooled results of three studies. In one of these studies, we used the number of positive pregnancy tests, because there were no data on clinical pregnancy rate. There was evidence of a difference in clinical pregnancy rates between the two treatment groups, with more clinical pregnancies obtained in the group pretreated with a progestogen (OR 1.99, 95% CI 1.20 to 3.28; 3 RCTs; 374 women; I2 = 0%).
2.3.2. Progestogen plus antagonist versus antagonist
There was insufficient evidence to determine whether there was a difference between the groups in clinical pregnancy rates (OR 0.52, 95% CI 0.16 to 1.71; 1 RCT; 47 women).
2.3.3. Progestogen plus gonadotrophins versus gonadotrophins
There was insufficient evidence to determine whether there was a difference between the groups in clinical pregnancy rates (OR 0.71, 95% CI 0.14 to 3.64; 1 RCT; 42 women).
2.4. Multiple pregnancy
2.4.1. Progestogen plus antagonist versus antagonist
There was insufficient evidence to determine whether there was a difference between the groups in multiple pregnancy rates (OR 1.05, 95% CI 0.06 to 17.76; 1 RCT; 47 women; low quality evidence).
2.5. Ovarian hyperstimulation syndrome rate
None of the studies reported on the number of women with OHSS.
2.6. Number of oocytes retrieved
2.6.1. Progestogen plus agonist versus agonist
There was insufficient evidence to determine whether there was a difference between the groups in the mean number of oocytes retrieved (MD ‐0.52, 95% CI ‐2.07 to 1.02; 2 RCTs; 222 women; I2 = 15%). There was one other study that reported the mean number of oocytes retrieved, but because this was analyzed per cycle (instead of per woman randomized), we were unable to include the data (Shaker 1995).
2.6.2. Progestogen plus antagonist versus antagonist
There was insufficient evidence to determine whether there was a difference between the groups in the mean number of oocytes retrieved (MD 2.70, 95% CI ‐0.98 to 6.38; 1 RCT; 47 women).
2.6.3. Progestogen plus gonadotrophins versus gonadotrophins
There was insufficient evidence to determine whether there was a difference between the groups in the mean number of oocytes retrieved (MD 0.00, 95% CI ‐0.57 to 0.57; 1 RCT; 29 women).
2.7. Days of gonadotrophin treatment
2.7.1. Progestogen plus agonist versus agonist
There was insufficient evidence to determine whether there was a difference between the groups in the mean days of gonadotrophin treatment (MD 0.11 days, 95% CI ‐0.30 to 0.52; 2 RCTs; 222 women; I2 = 88%). The presence of substantial heterogeneity was explored in sensitivity analysis using a random‐effects model and there was no substantial change in the evidence (MD 0.10, 95% CI ‐1.07 to 1.28).
2.8. Amount of gonadotrophins administered
2.8.1. Progestogen plus antagonist versus antagonist
There was insufficient evidence to determine whether there was a difference between the groups in the amount of gonadotrophin administered (MD 276.00 IU/L, 95% CI ‐75.53 to 627.53; 1 RCT; 47 women).
2.9. Ovarian cyst formation rate
2.9.1. Progestogen plus agonist versus agonist
Fewer women had ovarian cyst formation in the group pretreated with a progestogen compared with those who had no progestogen pretreatment (OR 0.16, 95% CI 0.08 to 0.32; 3 RCTs; 374 women; I2 = 1%).
3. Oestrogen versus no pretreatment
Four studies compared oestrogen versus no pretreatment (Cédrin‐Durnerin 2007; Cédrin‐Durnerin 2012; Franco Jr 2003; Ye 2009).
Primary outcomes
3.1. Live birth or ongoing pregnancy
See Figure 6 and Analysis 3.1.
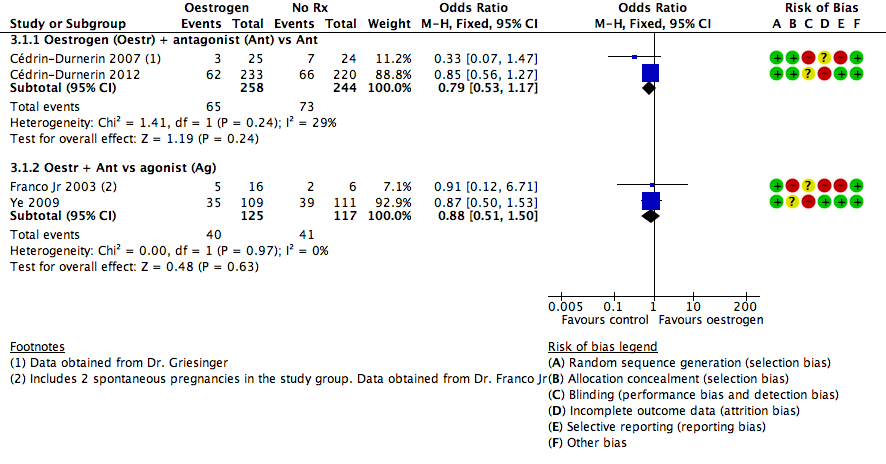
Forest plot of comparison: 3 Oestrogen versus no pretreatment (Rx), outcome: 3.1 Live birth or ongoing pregnancy.
3.1.1. Oestrogen plus antagonist versus antagonist
There was insufficient evidence to determine whether there was a difference between the groups in live birth or ongoing pregnancy rates (OR 0.79, 95% CI 0.53 to 1.17; 2 RCTs; 502 women; I2 = 29%; low quality evidence). The evidence suggested that if the chance of a live birth or ongoing pregnancy following no pretreatment was assumed to be 30%, the chance following pretreatment with oestrogen would be between 19% and 35%.
3.1.2. Oestrogen plus antagonist versus agonist
There was insufficient evidence to determine whether there was a difference between the groups in live birth or ongoing pregnancy rates (OR 0.88, 95% CI 0.51 to 1.50; 2 RCTs; 242 women; I2 = 0%; very low quality evidence). The evidence suggested that if the chance of a live birth or ongoing pregnancy following no pretreatment was assumed to be 35%, the chance following pretreatment with progestogen would be between 22% and 45%.
3.2. Pregnancy loss
See Figure 7 and Analysis 3.2.

Forest plot of comparison: 3 Oestrogen versus no pretreatment (Rx), outcome: 3.2 Pregnancy loss.
3.2.1. Oestrogen plus antagonist versus antagonist
There was insufficient evidence to determine whether there was a difference between the groups in rates of pregnancy loss (OR 0.16, 95% CI 0.02 to 1.47; 1 RCT; 49 women; very low quality evidence). The evidence suggested that if the risk of a pregnancy loss following no pretreatment was assumed to be 13%, the risk following pretreatment with oestrogen would be between 1% and 71%.
3.2.2. Oestrogen plus antagonist versus agonist
There was insufficient evidence to determine whether there was a difference between the groups in rates of pregnancy losses (OR 1.59, 95% CI 0.62 to 4.06; 1 RCT; 220 women; very low quality evidence). The evidence suggested that if the risk of a pregnancy loss following no pretreatment was assumed to be 7%, the risk following pretreatment with oestrogen would be between 5% and 24%.
Secondary outcomes
3.3. Clinical pregnancy rate
3.3.1. Oestrogen plus antagonist versus antagonist
There was insufficient evidence to determine whether there was a difference between the groups in clinical pregnancy rates (OR 0.91, 95% CI 0.66 to 1.24; 4 RCTs; 688 women; I2 = 50%).
3.3.2. Oestrogen plus antagonist versus agonist
There was insufficient evidence to determine whether there was a difference between the groups in clinical pregnancy rates (OR 0.76, 95% CI 0.45 to 1.27; 2 RCTs; 242 women; I2 = 0%).
3.4. Multiple pregnancy rate
3.4.1. Oestrogen plus antagonist versus agonist
There was insufficient evidence to determine whether there was a difference between the groups in multiple pregnancy rates (OR 2.24, 95% CI 0.09 to 53.59; 1 RCT; 22 women; very low quality evidence).
3.5. Ovarian hyperstimulation syndrome rate
3.5.1. Oestrogen plus antagonist versus agonist
There was insufficient evidence to determine whether there was a difference between the groups in OHSS rates (OR 1.54, 95% CI 0.25 to 9.42; 1 RCT; 220 women).
3.6. Number of oocytes retrieved
3.6.1. Oestrogen plus antagonist versus antagonist
More oocytes were retrieved in the group pretreated with oestrogen than in the no pretreatment group (MD 2.23, 95% CI 0.71 to 3.75; 2 RCTs; 139 women; I2 = 0%).
3.6.2. Oestrogen plus antagonist versus agonist
There was insufficient evidence to determine whether there was a difference between the groups in the number of oocytes retrieved (MD 0.40, 95% CI ‐4.47 to 5.27; 1 RCT; 22 women).
3.7. Days of gonadotrophin treatment
3.7.1. Oestrogen plus antagonist versus antagonist
Women who were pretreated with oestrogen had more days of gonadotrophin treatment compared to those who did not receive pretreatment (MD 0.83 days, 95% CI 0.58 to 1.08; 2 RCTs; 529 women; I2 = 0%).
3.7.2. Oestrogen plus antagonist versus agonist
Women pretreated with oestrogen had fewer days of gonadotrophin treatment than those who did not receive oestrogen pretreatment (MD ‐2.50 days, 95% CI ‐4.07 to ‐0.93; 1 RCT; 22 women).
3.8. Amount of gonadotrophins administered
3.8.1. Oestrogen plus antagonist versus antagonist
There was a higher total dose of gonadotrophin administered to women who were pretreated with oestrogen than to those who did not receive pretreatment (MD 168.38 IU/L, 95% CI ; 3 RCTs; 111.53 to 225.17, 668 women; I2 = 0%).
3.8.2. Oestrogen plus antagonist versus agonist
There was insufficient evidence to determine whether there was a difference between the groups in the amount of gonadotrophin administered (MD ‐16.00 IU/L, 95% CI ‐470.12 to 438.12; 1 RCT; 22 women).
3.9. Ovarian cyst formation rate
None of the studies reported ovarian cyst formation.
4. Combined oral contraceptive pill versus progestogen
One trial compared COCP versus progestogen (Cédrin‐Durnerin 2007). This trial used a GnRH antagonist in both treatment groups.
Primary outcomes
4.1. Live birth or ongoing pregnancy
4.1.1. Combined oral contraceptive pill plus antagonist versus progestogen plus antagonist
There was insufficient evidence to determine whether there was a difference between the groups in live birth or ongoing pregnancy rates (OR 0.60, 95% CI 0.12 to 2.89; 1 RCT; 44 women; very low quality evidence).
4.2. Pregnancy loss
4.2.1. Combined oral contraceptive pill plus antagonist versus progestogen plus antagonist
There was insufficient evidence to determine whether there was a difference between the groups in rates of pregnancy loss (OR 1.11, 95% CI 0.14 to 8.64; 1 RCT; 44 women)
Secondary outcomes
4.3. Clinical pregnancy rate
4.3.1. Combined oral contraceptive pill plus antagonist versus progestogen plus antagonist
There was insufficient evidence to determine whether there was a difference between the groups in clinical pregnancy rates (OR 0.71, 95% CI 0.19 to 2.73; 1 RCT; 44 women).
4.4. Multiple pregnancy rate
4.4.1. Combined oral contraceptive pill plus antagonist versus progestogen plus antagonist
There was insufficient evidence to determine whether there was a difference between the groups in multiple pregnancy rates (OR 2.32, 95% CI 0.19 to 27.59; 1 RCT; 44 women).
4.5. Ovarian hyperstimulation syndrome rate
None of the studies reported OHSS.
4.6. Number of oocytes retrieved
4.6.1. Combined oral contraceptive pill plus antagonist versus progestogen plus antagonist
There was insufficient evidence to determine whether there was a difference between the groups in the mean number of oocytes retrieved (MD 1.40, 95% CI ‐3.24 to 6.04; 1 RCT; 44 women).
4.7. Days of gonadotrophin treatment
None of the studies reported days of gonadotrophin treatment.
4.8. Amount of gonadotrophins administered
4.8.1. Combined oral contraceptive pill plus antagonist versus progestogen plus antagonist
There was insufficient evidence to determine whether there was a difference between the groups in the mean quantity of gonadotrophin administered (MD 164.00 IU/L, 95% CI ‐249.03 to 577.03; 1 RCT; 44 women).
4.9. Ovarian cyst formation rate
None of the studies reported ovarian cyst formation.
5. Combined oral contraceptive pill versus oestrogen
Three trials compared COCP versus oestrogen (Cédrin‐Durnerin 2007; Daly 2002; Hauzman 2013).
Primary outcomes
5.1. Live birth or ongoing pregnancy
5.1.1. Combined oral contraceptive pill plus antagonist versus oestrogen plus antagonist
There was insufficient evidence to determine whether there was a difference between the groups in live birth or ongoing pregnancy rates (OR 1.11, 95% CI 0.54 to 2.29; 2 RCTs; 146 women; I2 = 0%; very low quality evidence). This finding was sensitive to the choice of statistical model, and was no longer statistically significant when a sensitivity analysis was conducted to examine the effect of calculating the RR rather than OR (RR 0.15, 95% CI 0.02 to 1.08).
5.1.2. Combined oral contraceptive pill plus agonist versus oestrogen plus antagonist
There was a lower rate of live birth or ongoing pregnancy in women pretreated with COCP than in those who received oestrogen pretreatment (OR 0.08, 95% CI 0.01 to 0.79; 1 RCT; 25 women; very low quality evidence).
5.2. Pregnancy loss
5.2.1. Combined oral contraceptive pill plus agonist versus oestrogen plus antagonist
There was insufficient evidence to determine whether there was a difference between the groups in rates of pregnancy loss (OR 1.09, 95% CI 0.06 to 19.63; 1 RCT; 25 women; very low quality evidence).
Secondary outcomes
5.3. Clinical pregnancy rate
5.3.1. Combined oral contraceptive pill plus antagonist versus oestrogen plus antagonist
There was insufficient evidence to determine whether there was a difference between the groups in rates of clinical pregnancy (OR 1.19, 95% CI 0.60 to 2.37; 2 RCTs; 146 women; I2 = 0%).
5.3.2. Combined oral contraceptive pill plus agonist versus oestrogen plus antagonist
There was a higher rate of clinical pregnancy in women pretreated with oestrogen than in those who received COCP pretreatment (OR 0.13, 95% CI 0.02 to 0.82; 1 RCT; 25 women).
5.4. Multiple pregnancy rate
5.4.1. Combined oral contraceptive pill plus antagonist versus oestrogen plus antagonist
There were no data on multiple pregnancies.
5.5. Ovarian hyperstimulation syndrome rate
None of the studies reported OHSS.
5.6. Number of oocytes retrieved
5.6.1. Combined oral contraceptive pill plus antagonist versus oestrogen plus antagonist
There was insufficient evidence to determine whether there was a difference between the groups in the mean number of oocytes retrieved (MD 0.90, 95% CI ‐3.59 to 5.39; 1 RCT; 46 women).
5.7. Days of gonadotrophin treatment
5.7.1. Combined oral contraceptive pill plus antagonist versus oestrogen plus antagonist
There was no clear evidence of a difference in the number of days of gonadotrophin treatment between the two treatment groups (MD ‐0.60 days, 95% CI ‐1.23 to 0.03; 1 RCT; 100 women).
5.8. Amount of gonadotrophins administered
5.8.1. Combined oral contraceptive pill plus antagonist versus oestrogen plus antagonist
There was insufficient evidence to determine whether there was a difference between the groups in the amount of gonadotrophin administered (MD 181.56 IU/L, 95% CI ‐344.73 to 707.86; 2 RCTs; 146 women; I2 = 59%). There was no change in the evidence on sensitivity analysis using a random‐effects model (MD 113.73 IU/L, 95% CI ‐383.62 to 611.08).
5.9. Ovarian cyst formation rate
None of the studies reported ovarian cyst formation.
6. Progestogen versus oestrogen
One trial compared progestogen versus oestrogen (Cédrin‐Durnerin 2007). This trial used a GnRH antagonist in both treatment groups.
Primary outcomes
6.1. Live birth or ongoing pregnancy
6.1.1. Progestogen plus antagonist versus oestrogen plus antagonist
There was insufficient evidence to determine whether there was a difference between the groups in rates of live birth or ongoing pregnancy (OR 2.04, 95% CI 0.43 to 9.70; 1 RCT; 48 women).
6.2. Pregnancy loss
6.2.1. Progestogen plus antagonist versus oestrogen plus antagonist
There were no pregnancy losses (1 RCT; 48 women).
Secondary outcomes
6.3. Clinical pregnancy rate
6.3.1. Progestogen plus antagonist versus oestrogen plus antagonist
There was no evidence of a difference in clinical pregnancy rates between the two treatment groups (OR 2.30, 95% CI 0.57 to 9.22; 1 RCT; 48 women).
6.4. Multiple pregnancy rate
There were no multiple pregnancies (1 RCT; 48 women).
6.5. Ovarian hyperstimulation syndrome rate
The study did not report OHSS.
6.6. Number of oocytes retrieved
6.6.1. Progestogen plus antagonist versus oestrogen plus antagonist
There was insufficient evidence to determine whether there was a difference between the groups in the mean number of oocytes retrieved (MD ‐0.50, 95% CI ‐4.55 to 3.55; 1 RCT; 48 women).
6.7. Days of gonadotrophin treatment
The study did not report days of gonadotrophin treatment.
6.8. Amount of gonadotrophins administered
6.8.1. Progestogen plus antagonist versus oestrogen plus antagonist
There was insufficient evidence to determine whether there was a difference between the groups in the mean quantity of gonadotrophin administered (MD 310.00 IU/L, 95% CI ‐32.30 to 652.30; 1 RCT; 48 women).
6.9. Ovarian cyst formation rate
The study did not report ovarian cyst formation.
Discussion
Summary of main results
This is the second update of a Cochrane Review that aimed to determine whether pretreatment with a COCP, a progestogen or an oestrogen in ovarian stimulation protocols affects outcomes in subfertile couples undergoing any form of ART. The first update was conducted in 2009.
Combined oral contraceptive pill versus no pretreatment
When COCP was compared with no pretreatment in antagonist cycles, there was a lower rate of live births or ongoing pregnancies in the pretreatment group. However, there was no clear evidence of a difference between the two groups in the rates of pregnancy losses, ovarian cyst formation, multiple pregnancies and OHSS.
When COCP in antagonist cycles was compared with no pretreatment in agonist cycles, there was no evidence of a difference between the two groups in rates of live births or ongoing pregnancies. With respect to adverse effects, there was a lower rate of pregnancy loss in the pretreatment group while there was no clear evidence of a difference between the two groups in rates of ovarian cyst formation, multiple pregnancy or OHSS.
Progestogen versus no pretreatment
When progestogen was compared with no pretreatment, with the same type of cycle (antagonist, agonist or gonadotrophins) in both groups, there was no clear evidence of a difference between the groups in rates of live births or ongoing pregnancies, pregnancy losses or multiple pregnancies. However, there was a lower rate of ovarian cyst formation among the progestogen pretreatment group that used agonist cycles in both groups.
Oestrogen versus no pretreatment
When oestrogen in antagonist cycles was compared with no pretreatment in either antagonist or agonist cycles, there was no clear evidence of a difference between the groups in rates of live births or ongoing pregnancies, or in rates of pregnancy loss, multiple pregnancy or OHSS.
Head‐to‐head comparisons
We compared COCP with progestogen and oestrogen plus progestogen with oestrogen, in all cases with an antagonist cycle in both groups. We compared COCP in an agonist cycle with oestrogen in an antagonist cycle. The evidence was scant but there was no clear evidence of a difference between the groups in rates of live births or ongoing pregnancies or pregnancy losses or other adverse events except in the small study comparing COCP in an agonist cycle versus oestrogen in an antagonist cycle, which reported lower rates of live birth or ongoing pregnancy in women in the COCP group.
Overall, the evidence was insufficient to conclude whether or not pretreatment with COCPs, progestogens or oestrogens in ovarian stimulation resulted in better fertility outcomes. More studies are required for evidence‐based decision making regarding ART protocols. Besides this, there are a few other important aspects to consider when deciding if a pretreatment with a COCP, a progestogen or an oestrogen should be given. First, a pretreatment with one of these drugs may result in a longer duration and a higher amount of gonadotrophin treatment with considerable financial implications. Second, a pretreatment with one of these drugs means the need for a longer duration of the IVF/ICSI cycle and this might be a burden to the woman. In addition, if pretreatment with COCP, progestogen or oestrogen is given, this should be clearly explained to the woman, because the need for OCPs might be difficult to understand for some women trying to get pregnant.
Our finding that pretreatment with progestogen in agonist cycles has a positive effect on clinical pregnancy rates is surprising, since pretreatment with a COCP seems to yield lower clinical pregnancy rates. We also found that pretreatment with progestogen results in the formation of fewer ovarian cysts. This is important, since ovarian cysts have a negative effect on the pregnancy rate, because ART cycles have to be cancelled. However, only one study that used a COCP pretreatment reported on ovarian cyst formation and this study also found a substantial difference in favour of the COCP group. Unless more research is done on the underlying mechanism that could explain these effects, no implications for practice can be suggested.
If it is confirmed that pretreatment with progestogens results in a better IVF/ICSI outcome, this could be clinically and financially important. The administration of progestogen is easy, appears to be safe for the woman and it is less expensive than COCP pretreatment.
Overall completeness and applicability of evidence
Although we were able to include 29 studies across six comparisons, many did not report on the primary outcomes of live births or ongoing pregnancies and pregnancy loss. Using subgroups of different GnRH antagonist and agonist protocols also limited the ability to pool data. There were also limited data for many of the secondary outcomes and almost all the other adverse events.
This review included women with PCOS, but there was only one study of 56 randomized women that included a diagnosis of PCOS (Hwang 2004). Eleven other studies used PCOS or ovarian cysts as an exclusion criteria. These studies randomized 2012 women, so almost half of all the women in this review were not diagnosed with PCOS. Because of the small proportion of women with PCOS included in this review, results might be less applicable to this group of women.
With regard to poor responders, only one of the included studies used poor response to ovarian stimulation as an inclusion criterion in 120 women (Kim 2011). Therefore, the outcomes of this review might not be applicable to women with a history of poor response to controlled ovarian stimulation.
In this review, we included 29 studies with 4701 women. These studies were included in six main comparisons each comprising different subgroups. However, most of the subgroups were reported in single trials. Also, some of the review's outcome measures were not reported in some of the comparisons because of the few number of studies in each subgroup. Thus reaching a robust conclusion regarding the objective of this review was difficult.
Quality of the evidence
The overall quality of the evidence for the main outcomes ranged from very low to moderate. The main limitations of the evidence were risk of bias (associated with poor reporting of study methods) and imprecision. Most of the studies did not describe their methods in adequate detail and many were at high or unclear risk of attrition bias or selective reporting. In several cases, important clinical outcomes or usable data were not reported.
Potential biases in the review process
A strength of this review was the grouping of the studies into subgroups regarding the type of agent used for downregulation (GnRH agonist or antagonist). Nonetheless, there was still some substantial heterogeneity in a few of the statistically significant outcomes, such as the number of days of gonadotrophin administration, but this may be explained by differences in treatment protocols between studies. The combination of live birth and ongoing pregnancy as a single outcome might have given the impression of higher live birth rates than the actual results, as some ongoing pregnancies could have ended in late abortion or intrauterine foetal death. However, there was no presence of significant heterogeneity between studies involved in such combinations.
Furthermore, we were unable to construct a funnel plot, due to the small number of studies in each subgroup. Therefore, we could not examine if publication bias was present.
Agreements and disagreements with other studies or reviews
To our knowledge, there is one systematic review on COCP pretreatment available (Griesinger 2008). The review investigated the effect of COCP pretreatment in a GnRH antagonist cycle versus no pretreatment, and included four studies (Cédrin‐Durnerin 2007; Huirne 2006a; Kolibianakis 2006; Rombauts 2006). All of these studies are also included in our review, but we have included two more studies .Kim 2011; Obruca 2002). Due to a lack of data, despite contacting the author, or differences in treatment protocols, we were unable to pool their results. Because the systematic review of Dr Griesinger included the same studies and investigated almost the same outcomes, it is not surprising that we reach the same conclusions. In his review, Dr Griesinger found no significant effects on ongoing pregnancies. Also, he found a significant difference in favour of the control group with regard to the number of days and amount of gonadotrophin administration.
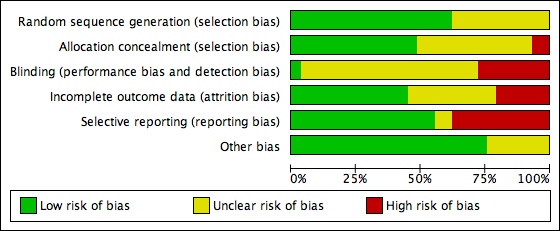
Methodological quality graph: review authors' judgements about each methodological quality item presented as percentages across all included studies.
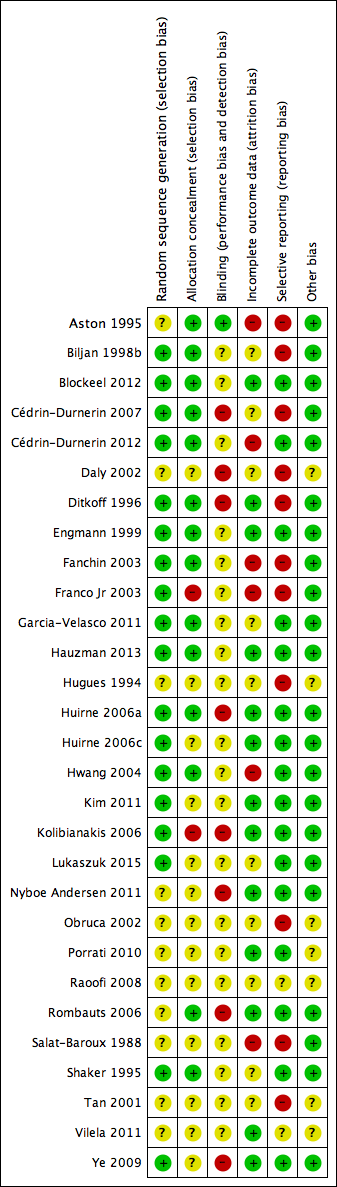
Methodological quality summary: review authors' judgements about each methodological quality item for each included study.

Study PRISMA flow chart

Forest plot of comparison: 1 Combined oral contraceptive pill (OCP) versus no pretreatment (Rx), outcome: 1.1 Live birth or ongoing pregnancy.

Forest plot of comparison: 1 Combined oral contraceptive pill (COCP) versus no pretreatment (Rx), outcome: 1.2 Pregnancy loss.

Forest plot of comparison: 3 Oestrogen versus no pretreatment (Rx), outcome: 3.1 Live birth or ongoing pregnancy.
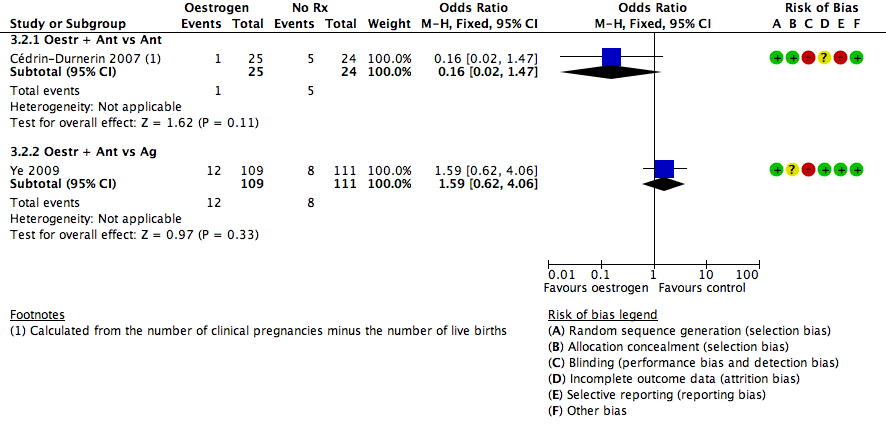
Forest plot of comparison: 3 Oestrogen versus no pretreatment (Rx), outcome: 3.2 Pregnancy loss.

Comparison 1 Combined oral contraceptive pill (COCP) versus no pretreatment (Rx), Outcome 1 Live birth or ongoing pregnancy.
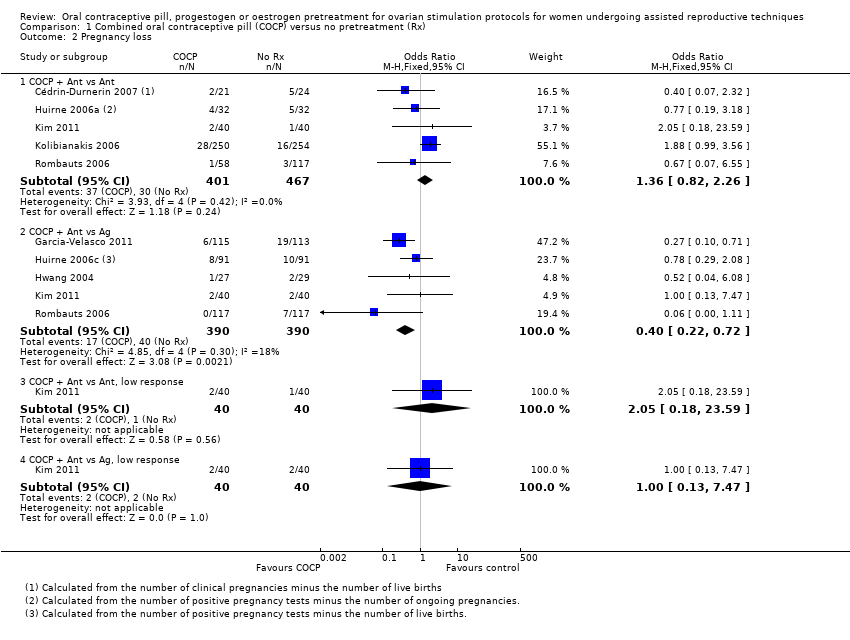
Comparison 1 Combined oral contraceptive pill (COCP) versus no pretreatment (Rx), Outcome 2 Pregnancy loss.

Comparison 1 Combined oral contraceptive pill (COCP) versus no pretreatment (Rx), Outcome 3 Clinical pregnancy rate.

Comparison 1 Combined oral contraceptive pill (COCP) versus no pretreatment (Rx), Outcome 4 Multiple pregnancy rate.
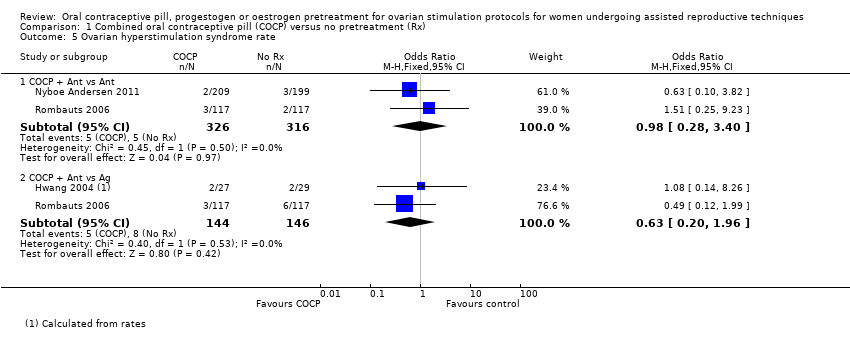
Comparison 1 Combined oral contraceptive pill (COCP) versus no pretreatment (Rx), Outcome 5 Ovarian hyperstimulation syndrome rate.

Comparison 1 Combined oral contraceptive pill (COCP) versus no pretreatment (Rx), Outcome 6 Number of oocytes retrieved.
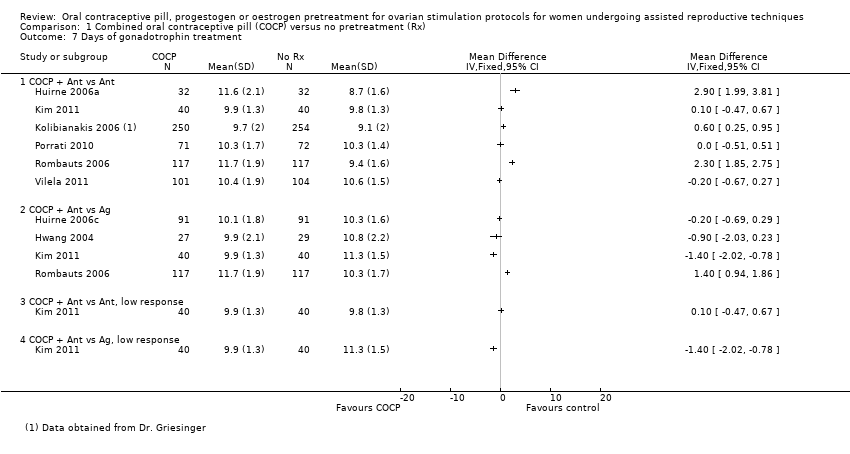
Comparison 1 Combined oral contraceptive pill (COCP) versus no pretreatment (Rx), Outcome 7 Days of gonadotrophin treatment.
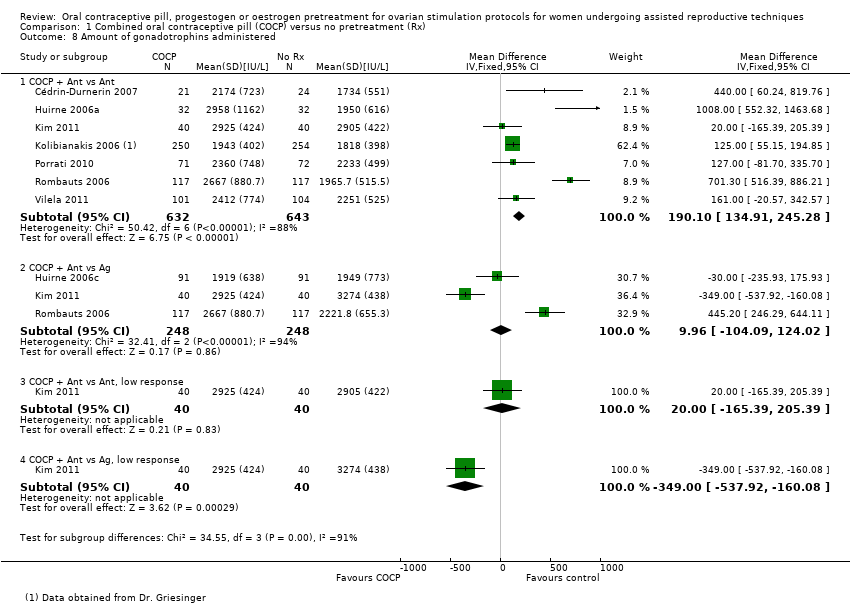
Comparison 1 Combined oral contraceptive pill (COCP) versus no pretreatment (Rx), Outcome 8 Amount of gonadotrophins administered.
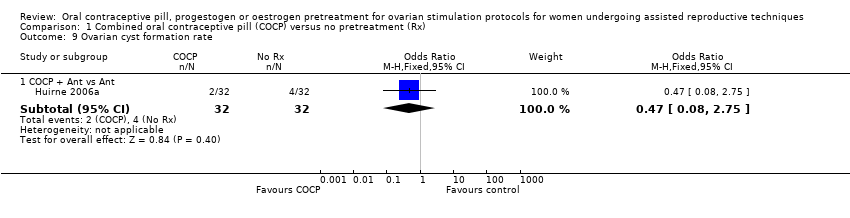
Comparison 1 Combined oral contraceptive pill (COCP) versus no pretreatment (Rx), Outcome 9 Ovarian cyst formation rate.
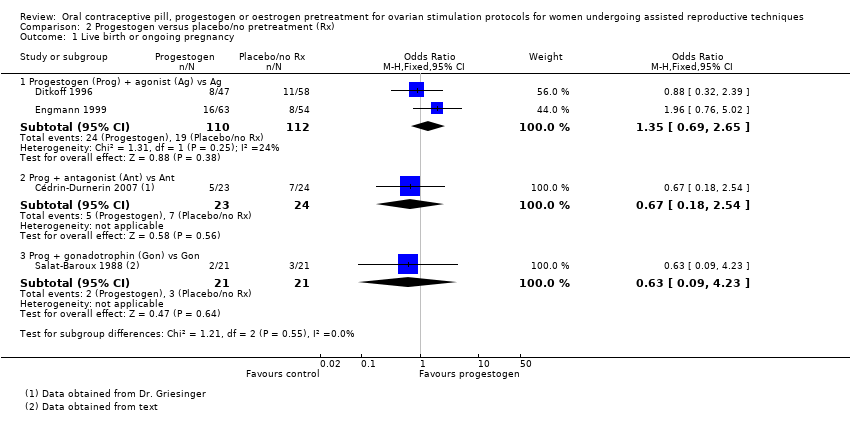
Comparison 2 Progestogen versus placebo/no pretreatment (Rx), Outcome 1 Live birth or ongoing pregnancy.

Comparison 2 Progestogen versus placebo/no pretreatment (Rx), Outcome 2 Pregnancy loss.

Comparison 2 Progestogen versus placebo/no pretreatment (Rx), Outcome 3 Clinical pregnancy rate.
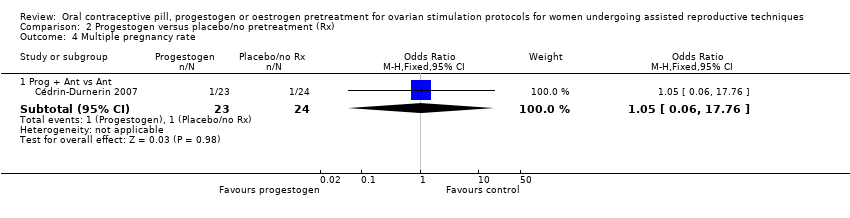
Comparison 2 Progestogen versus placebo/no pretreatment (Rx), Outcome 4 Multiple pregnancy rate.

Comparison 2 Progestogen versus placebo/no pretreatment (Rx), Outcome 5 Number of oocytes retrieved.

Comparison 2 Progestogen versus placebo/no pretreatment (Rx), Outcome 6 Days of gonadotrophin treatment.
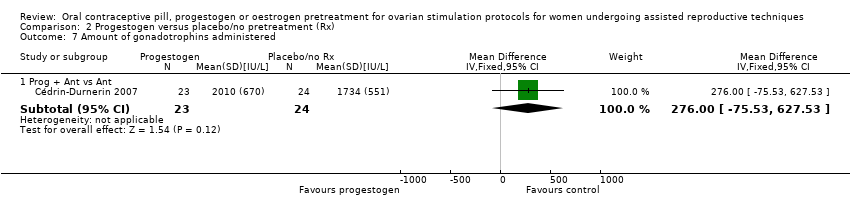
Comparison 2 Progestogen versus placebo/no pretreatment (Rx), Outcome 7 Amount of gonadotrophins administered.

Comparison 2 Progestogen versus placebo/no pretreatment (Rx), Outcome 8 Ovarian cyst formation rate.

Comparison 3 Oestrogen versus no pretreatment (Rx), Outcome 1 Live birth or ongoing pregnancy.
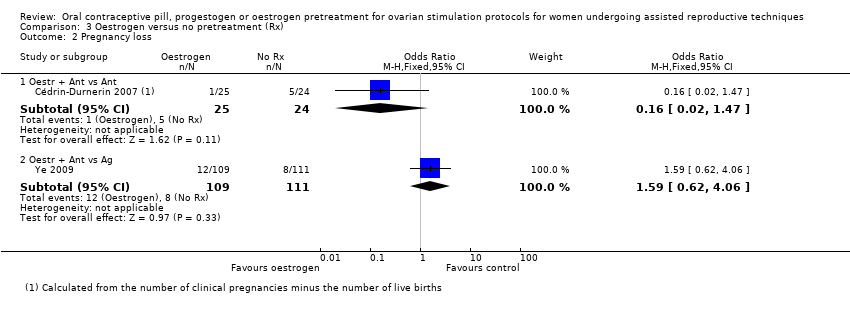
Comparison 3 Oestrogen versus no pretreatment (Rx), Outcome 2 Pregnancy loss.
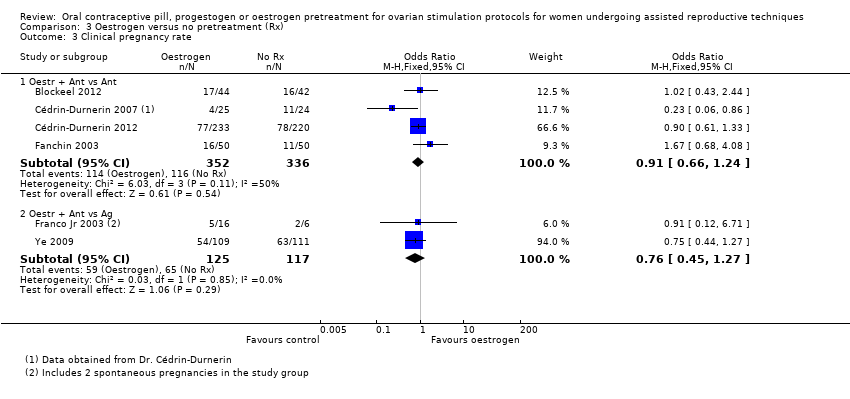
Comparison 3 Oestrogen versus no pretreatment (Rx), Outcome 3 Clinical pregnancy rate.
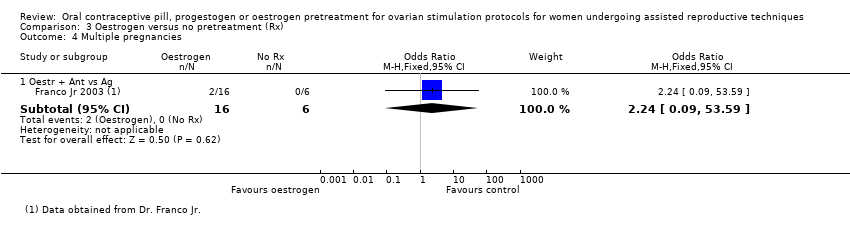
Comparison 3 Oestrogen versus no pretreatment (Rx), Outcome 4 Multiple pregnancies.

Comparison 3 Oestrogen versus no pretreatment (Rx), Outcome 5 Ovarian hyperstimulation syndrome rate.

Comparison 3 Oestrogen versus no pretreatment (Rx), Outcome 6 Number of oocytes retrieved.

Comparison 3 Oestrogen versus no pretreatment (Rx), Outcome 7 Days of gonadotrophin treatment.

Comparison 3 Oestrogen versus no pretreatment (Rx), Outcome 8 Amount of gonadotrophins administered.

Comparison 4 Combined oral contraceptive pill (COCP) versus progestogen, Outcome 1 Live birth or ongoing pregnancy.

Comparison 4 Combined oral contraceptive pill (COCP) versus progestogen, Outcome 2 Pregnancy loss.
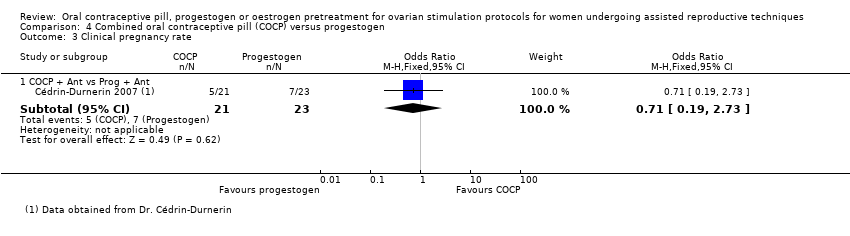
Comparison 4 Combined oral contraceptive pill (COCP) versus progestogen, Outcome 3 Clinical pregnancy rate.
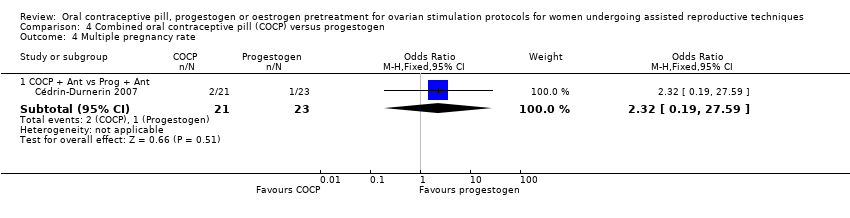
Comparison 4 Combined oral contraceptive pill (COCP) versus progestogen, Outcome 4 Multiple pregnancy rate.
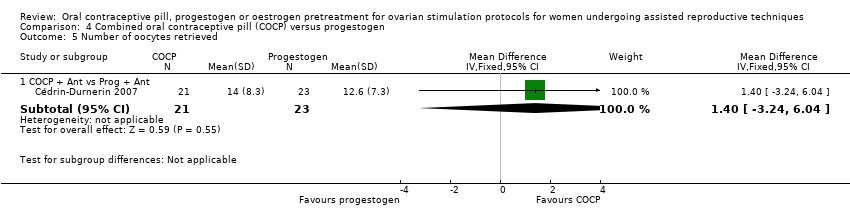
Comparison 4 Combined oral contraceptive pill (COCP) versus progestogen, Outcome 5 Number of oocytes retrieved.
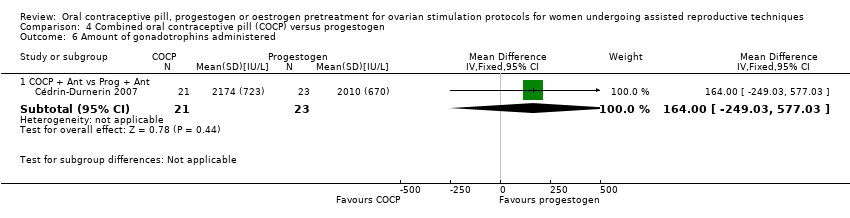
Comparison 4 Combined oral contraceptive pill (COCP) versus progestogen, Outcome 6 Amount of gonadotrophins administered.
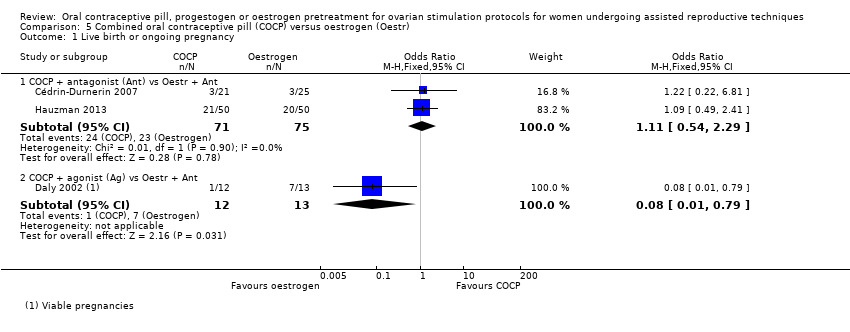
Comparison 5 Combined oral contraceptive pill (COCP) versus oestrogen (Oestr), Outcome 1 Live birth or ongoing pregnancy.
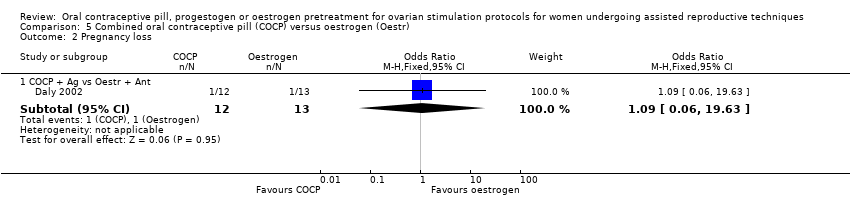
Comparison 5 Combined oral contraceptive pill (COCP) versus oestrogen (Oestr), Outcome 2 Pregnancy loss.
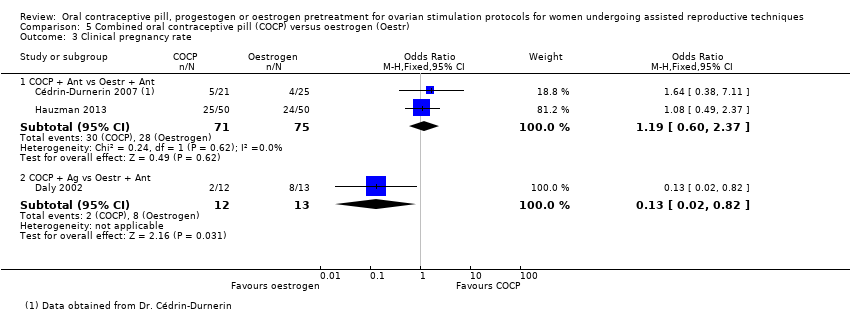
Comparison 5 Combined oral contraceptive pill (COCP) versus oestrogen (Oestr), Outcome 3 Clinical pregnancy rate.

Comparison 5 Combined oral contraceptive pill (COCP) versus oestrogen (Oestr), Outcome 4 Number of oocytes retrieved.

Comparison 5 Combined oral contraceptive pill (COCP) versus oestrogen (Oestr), Outcome 5 Days of gonadotropin treatment.
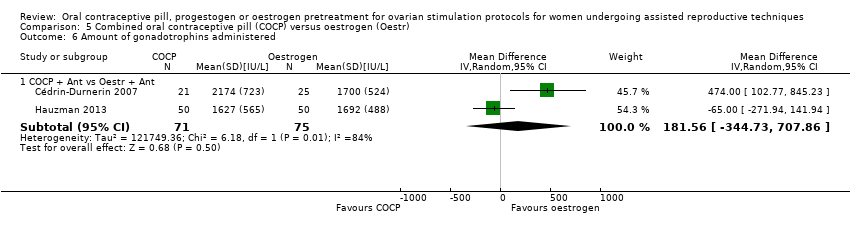
Comparison 5 Combined oral contraceptive pill (COCP) versus oestrogen (Oestr), Outcome 6 Amount of gonadotrophins administered.

Comparison 6 Progestogen (Prog) versus oestrogen (Oestr), Outcome 1 Live birth or ongoing pregnancy.

Comparison 6 Progestogen (Prog) versus oestrogen (Oestr), Outcome 2 Clinical pregnancy rate.

Comparison 6 Progestogen (Prog) versus oestrogen (Oestr), Outcome 3 Number of oocytes retrieved.
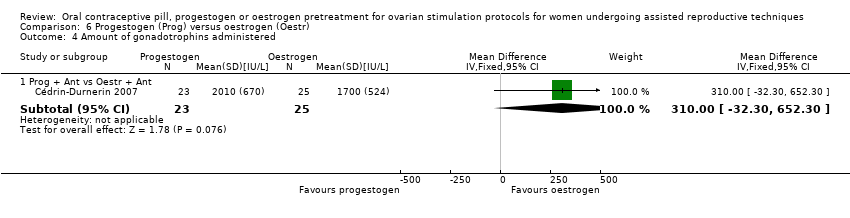
Comparison 6 Progestogen (Prog) versus oestrogen (Oestr), Outcome 4 Amount of gonadotrophins administered.
| Combined oral contraceptive pill compared to no pretreatment for ovarian stimulation protocols for women undergoing assisted reproductive techniques | ||||||
| Population: women undergoing ART Settings: ART clinic Intervention: COCP Comparison: no pretreatment | ||||||
| Outcomes | Illustrative comparative risks* (95% CI) | Relative effect | No of participants | Quality of the evidence | Comments | |
| Assumed risk1 | Corresponding risk | |||||
| No pretreatment | COCP | |||||
| Live birth or ongoing pregnancy (COCP + Ant vs Ant) | 270 per 1000 | 215 per 1000 | OR 0.74 | 1335 | ⊕⊕⊕⊝ | ‐ |
| Live birth or ongoing pregnancy (COCP + Ant vs Ag) | 296 per 1000 | 273 per 1000 | OR 0.89 | 724 | ⊕⊕⊕⊝ | ‐ |
| Pregnancy loss (COCP + Ant vs Ant) | 64 per 1000 | 85 per 1000 | OR 1.36 | 868 | ⊕⊕⊕⊝ | ‐ |
| Pregnancy loss (COCP + Ant vs Ag) | 103 per 1000 | 44 per 1000 | OR 0.40 | 780 | ⊕⊕⊕⊝ | ‐ |
| Multiple pregnancy rate (COCP + Ant vs Ant) | 47 per 1000 | 98 per 1000 | OR 2.21 | 125 | ⊕⊕⊝⊝ | ‐ |
| Multiple pregnancy rate (COCP + Ant vs Ag) | 147 per 1000 | 189 per 1000 | OR 1.36 | 546 | ⊕⊕⊕⊝ | ‐ |
| OHSS rate (COCP + Ant vs Ant) | 16 per 1000 | 16 per 1000 (4 to 52) | OR 0.98 (0.28 to 3.40) | 642 (2 studies) | ⊕⊕⊝⊝ | ‐ |
| OHSS rate (COCP + Ant vs Ag) | 55 per 1000 | 35 per 1000 (11 to 102) | OR 0.63 (0.20 to 1.96) | 290 (2 studies) | ⊕⊕⊝⊝ | ‐ |
| *The basis for the assumed risk (e.g. the median control group risk across studies) is provided in footnotes. The corresponding risk (and its 95% confidence interval) is based on the assumed risk in the comparison group and the relative effect of the intervention (and its 95% CI). | ||||||
| GRADE Working Group grades of evidence | ||||||
| 1 Mean baseline risk of control group. | ||||||
| Progestogen compared to placebo or no pretreatment for ovarian stimulation protocols for women undergoing assisted reproductive techniques | ||||||
| Patient or population: ovarian stimulation protocols for women undergoing ART Settings: Intervention: progestogen Comparison: placebo or no pretreatment | ||||||
| Outcomes | Illustrative comparative risks* (95% CI) | Relative effect | No of participants | Quality of the evidence | Comments | |
| Assumed risk1 | Corresponding risk | |||||
| Placebo or no pretreatment | Prog | |||||
| Live birth or ongoing pregnancy (Prog + Ag vs Ag) | 170 per 1000 | 217 per 1000 | OR 1.35 | 222 | ⊕⊕⊝⊝ | ‐ |
| Live birth or ongoing pregnancy (Prog + Ant vs Ant) | 292 per 1000 | 217 per 1000 | OR 0.67 | 47 | ⊕⊕⊝⊝ | ‐ |
| Pregnancy loss (Prog + Ag vs Ag) | 36 per 1000 | 78 per 1000 | OR 2.26 | 222 | ⊕⊕⊝⊝ | ‐ |
| Pregnancy loss (Prog + Ant vs Ant) | 208 per 1000 | 86 per 1000 | OR 0.36 | 47 | ⊕⊕⊝⊝ | ‐ |
| Multiple pregnancy rate (Prog + Ag vs Ag) | No data available | ‐ | ‐ | |||
| Multiple pregnancy rate (Prog + Ant vs Ant) | 42 per 1000 | 44 per 1000 | OR 1.05 | 47 | ⊕⊕⊝⊝ | ‐ |
| OHSS rate (Prog + Ag vs Ag) | No data available | ‐ | ‐ | |||
| OHSS rate (Prog + Ant vs Ant) | No data available | ‐ | ‐ | |||
| *The basis for the assumed risk (e.g. the median control group risk across studies) is provided in footnotes. The corresponding risk (and its 95% confidence interval) is based on the assumed risk in the comparison group and the relative effect of the intervention (and its 95% CI). | ||||||
| GRADE Working Group grades of evidence | ||||||
| 1 Mean baseline risk of control group. | ||||||
| Oestrogencompared to no pretreatment for ovarian stimulation protocols for women undergoing assisted reproductive techniques | ||||||
| Patient or population: ovarian stimulation protocols for women undergoing ART Settings: Intervention: oestrogen Comparison: no pretreatment | ||||||
| Outcomes | Illustrative comparative risks* (95% CI) | Relative effect | No of Participants | Quality of the evidence | Comments | |
| Assumed risk1 | Corresponding risk | |||||
| No pretreatment | Oestr | |||||
| Live birth or ongoing pregnancy (Oestr + Ant vs Ant) | 299 per 1000 | 252 per 1000 | OR 0.79 | 502 | ⊕⊕⊕⊝ | ‐ |
| Live birth or ongoing pregnancy (Oestr + Ant vs Ag) | 350 per 1000 | 322 per 1000 | OR 0.88 | 242 | ⊕⊝⊝⊝ | ‐ |
| Pregnancy loss (Oestr + Ant vs Ant) | 208 per 1000 | 40 per 1000 | OR 0.16 | 49 | ⊕⊝⊝⊝ | ‐ |
| Pregnancy loss (Oestr + Ant vs Ag) | 72 per 1000 | 110 per 1000 | OR 1.59 | 220 | ⊕⊝⊝⊝ | ‐ |
| Multiple pregnancy rate (Oestr + Ant vs Ant) | No data available | ‐ | ‐ | |||
| Multiple pregnancy rate (Oestr + Ant vs Ag) | Not calculable ‐ see comment | OR 2.24 | 22 | ⊕⊝⊝⊝ | Only 2 events (both in oestrogen group) | |
| OHSS rate (Oestr + Ant vs Ant) | No data available | ‐ | ‐ | |||
| OHSS rate (Oestr + Ant vs Ag) | 18 per 1000 | 27 per 1000 (5 to 147) | OR 1.54 (0.25 to 9.42) | 220 (1 study) | ⊕⊝⊝⊝ | ‐ |
| *The basis for the assumed risk (e.g. the median control group risk across studies) is provided in footnotes. The corresponding risk (and its 95% confidence interval) is based on the assumed risk in the comparison group and the relative effect of the intervention (and its 95% CI). | ||||||
| GRADE Working Group grades of evidence | ||||||
| 1 Mean baseline risk of control group. | ||||||
| Outcome or subgroup title | No. of studies | No. of participants | Statistical method | Effect size |
| 1 Live birth or ongoing pregnancy Show forest plot | 8 | Odds Ratio (M‐H, Fixed, 95% CI) | Subtotals only | |
| 1.1 COCP + antagonist (Ant) vs Ant | 6 | 1335 | Odds Ratio (M‐H, Fixed, 95% CI) | 0.74 [0.58, 0.95] |
| 1.2 COCP + Ant vs agonist (Ag) | 4 | 724 | Odds Ratio (M‐H, Fixed, 95% CI) | 0.89 [0.64, 1.25] |
| 1.3 COCP + Ant vs Ant, low response | 1 | 80 | Odds Ratio (M‐H, Fixed, 95% CI) | 1.71 [0.61, 4.79] |
| 1.4 COCP + Ant vs Ag, low response | 1 | 80 | Odds Ratio (M‐H, Fixed, 95% CI) | 1.13 [0.43, 2.98] |
| 2 Pregnancy loss Show forest plot | 8 | Odds Ratio (M‐H, Fixed, 95% CI) | Subtotals only | |
| 2.1 COCP + Ant vs Ant | 5 | 868 | Odds Ratio (M‐H, Fixed, 95% CI) | 1.36 [0.82, 2.26] |
| 2.2 COCP + Ant vs Ag | 5 | 780 | Odds Ratio (M‐H, Fixed, 95% CI) | 0.40 [0.22, 0.72] |
| 2.3 COCP + Ant vs Ant, low response | 1 | 80 | Odds Ratio (M‐H, Fixed, 95% CI) | 2.05 [0.18, 23.59] |
| 2.4 COCP + Ant vs Ag, low response | 1 | 80 | Odds Ratio (M‐H, Fixed, 95% CI) | 1.0 [0.13, 7.47] |
| 3 Clinical pregnancy rate Show forest plot | 8 | Odds Ratio (M‐H, Fixed, 95% CI) | Subtotals only | |
| 3.1 COCP + Ant vs Ant | 5 | 740 | Odds Ratio (M‐H, Fixed, 95% CI) | 0.85 [0.63, 1.15] |
| 3.2 COCP + Ant vs Ag | 4 | 546 | Odds Ratio (M‐H, Fixed, 95% CI) | 0.84 [0.59, 1.20] |
| 3.3 COCP + Ant vs Ant, low response | 1 | 80 | Odds Ratio (M‐H, Fixed, 95% CI) | 1.85 [0.69, 4.97] |
| 3.4 COCP + Ant vs Ag, low response | 1 | 80 | Odds Ratio (M‐H, Fixed, 95% CI) | 1.12 [0.44, 2.83] |
| 4 Multiple pregnancy rate Show forest plot | 5 | Odds Ratio (M‐H, Fixed, 95% CI) | Subtotals only | |
| 4.1 COCP + Ant vs Ant | 2 | 125 | Odds Ratio (M‐H, Fixed, 95% CI) | 2.21 [0.53, 9.26] |
| 4.2 COCP + Ant vs Ag | 4 | 546 | Odds Ratio (M‐H, Fixed, 95% CI) | 1.36 [0.85, 2.19] |
| 4.3 COCP + Ant vs Ant, low response | 1 | 80 | Odds Ratio (M‐H, Fixed, 95% CI) | 2.11 [0.36, 12.24] |
| 4.4 COCP + Ant vs Ag, low response | 1 | 80 | Odds Ratio (M‐H, Fixed, 95% CI) | 1.37 [0.29, 6.56] |
| 5 Ovarian hyperstimulation syndrome rate Show forest plot | 3 | Odds Ratio (M‐H, Fixed, 95% CI) | Subtotals only | |
| 5.1 COCP + Ant vs Ant | 2 | 642 | Odds Ratio (M‐H, Fixed, 95% CI) | 0.98 [0.28, 3.40] |
| 5.2 COCP + Ant vs Ag | 2 | 290 | Odds Ratio (M‐H, Fixed, 95% CI) | 0.63 [0.20, 1.96] |
| 6 Number of oocytes retrieved Show forest plot | 8 | Mean Difference (IV, Fixed, 95% CI) | Subtotals only | |
| 7 Days of gonadotrophin treatment Show forest plot | 8 | Mean Difference (IV, Fixed, 95% CI) | Totals not selected | |
| 7.1 COCP + Ant vs Ant | 6 | Mean Difference (IV, Fixed, 95% CI) | 0.0 [0.0, 0.0] | |
| 7.2 COCP + Ant vs Ag | 4 | Mean Difference (IV, Fixed, 95% CI) | 0.0 [0.0, 0.0] | |
| 7.3 COCP + Ant vs Ant, low response | 1 | Mean Difference (IV, Fixed, 95% CI) | 0.0 [0.0, 0.0] | |
| 7.4 COCP + Ant vs Ag, low response | 1 | Mean Difference (IV, Fixed, 95% CI) | 0.0 [0.0, 0.0] | |
| 8 Amount of gonadotrophins administered Show forest plot | 8 | Mean Difference (IV, Fixed, 95% CI) | Subtotals only | |
| 8.1 COCP + Ant vs Ant | 7 | 1275 | Mean Difference (IV, Fixed, 95% CI) | 190.10 [134.91, 245.28] |
| 8.2 COCP + Ant vs Ag | 3 | 496 | Mean Difference (IV, Fixed, 95% CI) | 9.96 [‐104.09, 124.02] |
| 8.3 COCP + Ant vs Ant, low response | 1 | 80 | Mean Difference (IV, Fixed, 95% CI) | 20.0 [‐165.39, 205.39] |
| 8.4 COCP + Ant vs Ag, low response | 1 | 80 | Mean Difference (IV, Fixed, 95% CI) | ‐349.0 [‐537.92, ‐160.08] |
| 9 Ovarian cyst formation rate Show forest plot | 1 | Odds Ratio (M‐H, Fixed, 95% CI) | Subtotals only | |
| 9.1 COCP + Ant vs Ant | 1 | 64 | Odds Ratio (M‐H, Fixed, 95% CI) | 0.47 [0.08, 2.75] |
| Outcome or subgroup title | No. of studies | No. of participants | Statistical method | Effect size |
| 1 Live birth or ongoing pregnancy Show forest plot | 4 | Odds Ratio (M‐H, Fixed, 95% CI) | Subtotals only | |
| 1.1 Progestogen (Prog) + agonist (Ag) vs Ag | 2 | 222 | Odds Ratio (M‐H, Fixed, 95% CI) | 1.35 [0.69, 2.65] |
| 1.2 Prog + antagonist (Ant) vs Ant | 1 | 47 | Odds Ratio (M‐H, Fixed, 95% CI) | 0.67 [0.18, 2.54] |
| 1.3 Prog + gonadotrophin (Gon) vs Gon | 1 | 42 | Odds Ratio (M‐H, Fixed, 95% CI) | 0.63 [0.09, 4.23] |
| 2 Pregnancy loss Show forest plot | 4 | Odds Ratio (M‐H, Fixed, 95% CI) | Subtotals only | |
| 2.1 Prog + Ag vs Ag | 2 | 222 | Odds Ratio (M‐H, Fixed, 95% CI) | 2.26 [0.67, 7.55] |
| 2.2 Prog + Ant vs Ant | 1 | 47 | Odds Ratio (M‐H, Fixed, 95% CI) | 0.36 [0.06, 2.09] |
| 2.3 Prog + Gon vs Gon | 1 | 42 | Odds Ratio (M‐H, Fixed, 95% CI) | 1.0 [0.06, 17.12] |
| 3 Clinical pregnancy rate Show forest plot | 5 | Odds Ratio (M‐H, Fixed, 95% CI) | Subtotals only | |
| 3.1 Prog + Ag vs Ag | 3 | 374 | Odds Ratio (M‐H, Fixed, 95% CI) | 1.99 [1.20, 3.28] |
| 3.2 Prog + Ant vs Ant | 1 | 47 | Odds Ratio (M‐H, Fixed, 95% CI) | 0.52 [0.16, 1.71] |
| 3.3 Prog + Gon vs Gon | 1 | 42 | Odds Ratio (M‐H, Fixed, 95% CI) | 0.71 [0.14, 3.64] |
| 4 Multiple pregnancy rate Show forest plot | 1 | Odds Ratio (M‐H, Fixed, 95% CI) | Subtotals only | |
| 4.1 Prog + Ant vs Ant | 1 | 47 | Odds Ratio (M‐H, Fixed, 95% CI) | 1.05 [0.06, 17.76] |
| 5 Number of oocytes retrieved Show forest plot | 4 | Mean Difference (IV, Fixed, 95% CI) | Subtotals only | |
| 5.1 Prog + Ag vs Ag | 2 | 222 | Mean Difference (IV, Fixed, 95% CI) | ‐0.52 [‐2.07, 1.02] |
| 5.2 Prog + Ant vs Ant | 1 | 47 | Mean Difference (IV, Fixed, 95% CI) | 2.70 [‐0.98, 6.38] |
| 5.3 Prog + Gon vs Gon | 1 | 29 | Mean Difference (IV, Fixed, 95% CI) | 0.0 [‐0.57, 0.57] |
| 6 Days of gonadotrophin treatment Show forest plot | 2 | Mean Difference (IV, Fixed, 95% CI) | Subtotals only | |
| 6.1 Prog + Ag vs Ag | 2 | 222 | Mean Difference (IV, Fixed, 95% CI) | 0.11 [‐0.30, 0.52] |
| 7 Amount of gonadotrophins administered Show forest plot | 1 | Mean Difference (IV, Fixed, 95% CI) | Subtotals only | |
| 7.1 Prog + Ant vs Ant | 1 | 47 | Mean Difference (IV, Fixed, 95% CI) | 276.0 [‐75.53, 627.53] |
| 8 Ovarian cyst formation rate Show forest plot | 3 | Odds Ratio (M‐H, Fixed, 95% CI) | Subtotals only | |
| 8.1 Prog + Ag vs Ag | 3 | 374 | Odds Ratio (M‐H, Fixed, 95% CI) | 0.16 [0.08, 0.32] |
| Outcome or subgroup title | No. of studies | No. of participants | Statistical method | Effect size |
| 1 Live birth or ongoing pregnancy Show forest plot | 4 | Odds Ratio (M‐H, Fixed, 95% CI) | Subtotals only | |
| 1.1 Oestrogen (Oestr) + antagonist (Ant) vs Ant | 2 | 502 | Odds Ratio (M‐H, Fixed, 95% CI) | 0.79 [0.53, 1.17] |
| 1.2 Oestr + Ant vs agonist (Ag) | 2 | 242 | Odds Ratio (M‐H, Fixed, 95% CI) | 0.88 [0.51, 1.50] |
| 2 Pregnancy loss Show forest plot | 2 | Odds Ratio (M‐H, Fixed, 95% CI) | Subtotals only | |
| 2.1 Oestr + Ant vs Ant | 1 | 49 | Odds Ratio (M‐H, Fixed, 95% CI) | 0.16 [0.02, 1.47] |
| 2.2 Oestr + Ant vs Ag | 1 | 220 | Odds Ratio (M‐H, Fixed, 95% CI) | 1.59 [0.62, 4.06] |
| 3 Clinical pregnancy rate Show forest plot | 6 | Odds Ratio (M‐H, Fixed, 95% CI) | Subtotals only | |
| 3.1 Oestr + Ant vs Ant | 4 | 688 | Odds Ratio (M‐H, Fixed, 95% CI) | 0.91 [0.66, 1.24] |
| 3.2 Oestr + Ant vs Ag | 2 | 242 | Odds Ratio (M‐H, Fixed, 95% CI) | 0.76 [0.45, 1.27] |
| 4 Multiple pregnancies Show forest plot | 1 | Odds Ratio (M‐H, Fixed, 95% CI) | Subtotals only | |
| 4.1 Oestr + Ant vs Ag | 1 | 22 | Odds Ratio (M‐H, Fixed, 95% CI) | 2.24 [0.09, 53.59] |
| 5 Ovarian hyperstimulation syndrome rate Show forest plot | 1 | Odds Ratio (M‐H, Fixed, 95% CI) | Subtotals only | |
| 5.1 Oestr + Ant vs Ag | 1 | 220 | Odds Ratio (M‐H, Fixed, 95% CI) | 1.54 [0.25, 9.42] |
| 6 Number of oocytes retrieved Show forest plot | 3 | Mean Difference (IV, Fixed, 95% CI) | Subtotals only | |
| 6.1 Oestr + Ant vs Ant | 2 | 139 | Mean Difference (IV, Fixed, 95% CI) | 2.23 [0.71, 3.75] |
| 6.2 Oestr + Ant vs Ag | 1 | 22 | Mean Difference (IV, Fixed, 95% CI) | 0.40 [‐4.47, 5.27] |
| 7 Days of gonadotrophin treatment Show forest plot | 3 | Mean Difference (IV, Fixed, 95% CI) | Subtotals only | |
| 7.1 Oestr + Ant vs Ant | 2 | 529 | Mean Difference (IV, Fixed, 95% CI) | 0.83 [0.58, 1.08] |
| 7.2 Oestr + Ant vs Ag | 1 | 22 | Mean Difference (IV, Fixed, 95% CI) | ‐2.5 [‐4.07, ‐0.93] |
| 8 Amount of gonadotrophins administered Show forest plot | 5 | Mean Difference (IV, Fixed, 95% CI) | Subtotals only | |
| 8.1 Oestr + Ant vs Ant | 4 | 668 | Mean Difference (IV, Fixed, 95% CI) | 168.35 [111.53, 225.17] |
| 8.2 Oestr + Ant vs Ag | 1 | 22 | Mean Difference (IV, Fixed, 95% CI) | ‐16.0 [‐470.12, 438.12] |
| Outcome or subgroup title | No. of studies | No. of participants | Statistical method | Effect size |
| 1 Live birth or ongoing pregnancy Show forest plot | 1 | Odds Ratio (M‐H, Fixed, 95% CI) | Subtotals only | |
| 1.1 COCP + antagonist (Ant) vs progestogen (Prog) + Ant | 1 | 44 | Odds Ratio (M‐H, Fixed, 95% CI) | 0.6 [0.12, 2.89] |
| 2 Pregnancy loss Show forest plot | 1 | Odds Ratio (M‐H, Fixed, 95% CI) | Subtotals only | |
| 2.1 COCP + Ant vs Prog + Ant | 1 | 44 | Odds Ratio (M‐H, Fixed, 95% CI) | 1.11 [0.14, 8.64] |
| 3 Clinical pregnancy rate Show forest plot | 1 | Odds Ratio (M‐H, Fixed, 95% CI) | Subtotals only | |
| 3.1 COCP + Ant vs Prog + Ant | 1 | 44 | Odds Ratio (M‐H, Fixed, 95% CI) | 0.71 [0.19, 2.73] |
| 4 Multiple pregnancy rate Show forest plot | 1 | Odds Ratio (M‐H, Fixed, 95% CI) | Subtotals only | |
| 4.1 COCP + Ant vs Prog + Ant | 1 | 44 | Odds Ratio (M‐H, Fixed, 95% CI) | 2.32 [0.19, 27.59] |
| 5 Number of oocytes retrieved Show forest plot | 1 | Mean Difference (IV, Fixed, 95% CI) | Subtotals only | |
| 5.1 COCP + Ant vs Prog + Ant | 1 | 44 | Mean Difference (IV, Fixed, 95% CI) | 1.40 [‐3.24, 6.04] |
| 6 Amount of gonadotrophins administered Show forest plot | 1 | Mean Difference (IV, Fixed, 95% CI) | Subtotals only | |
| 6.1 COCP + Ant vs Prog + Ant | 1 | 44 | Mean Difference (IV, Fixed, 95% CI) | 164.0 [‐249.03, 577.03] |
| Outcome or subgroup title | No. of studies | No. of participants | Statistical method | Effect size |
| 1 Live birth or ongoing pregnancy Show forest plot | 3 | Odds Ratio (M‐H, Fixed, 95% CI) | Subtotals only | |
| 1.1 COCP + antagonist (Ant) vs Oestr + Ant | 2 | 146 | Odds Ratio (M‐H, Fixed, 95% CI) | 1.11 [0.54, 2.29] |
| 1.2 COCP + agonist (Ag) vs Oestr + Ant | 1 | 25 | Odds Ratio (M‐H, Fixed, 95% CI) | 0.08 [0.01, 0.79] |
| 2 Pregnancy loss Show forest plot | 1 | Odds Ratio (M‐H, Fixed, 95% CI) | Subtotals only | |
| 2.1 COCP + Ag vs Oestr + Ant | 1 | 25 | Odds Ratio (M‐H, Fixed, 95% CI) | 1.09 [0.06, 19.63] |
| 3 Clinical pregnancy rate Show forest plot | 3 | Odds Ratio (M‐H, Fixed, 95% CI) | Subtotals only | |
| 3.1 COCP + Ant vs Oestr + Ant | 2 | 146 | Odds Ratio (M‐H, Fixed, 95% CI) | 1.19 [0.60, 2.37] |
| 3.2 COCP + Ag vs Oestr + Ant | 1 | 25 | Odds Ratio (M‐H, Fixed, 95% CI) | 0.13 [0.02, 0.82] |
| 4 Number of oocytes retrieved Show forest plot | 1 | Mean Difference (IV, Fixed, 95% CI) | Subtotals only | |
| 4.1 COCP + Ant vs Oestr + Ant | 1 | 46 | Mean Difference (IV, Fixed, 95% CI) | 0.90 [‐3.59, 5.39] |
| 5 Days of gonadotropin treatment Show forest plot | 1 | Mean Difference (IV, Fixed, 95% CI) | Subtotals only | |
| 5.1 COCP + Ant vs Oestr + Ant | 1 | 100 | Mean Difference (IV, Fixed, 95% CI) | ‐0.60 [‐1.23, 0.03] |
| 6 Amount of gonadotrophins administered Show forest plot | 2 | Mean Difference (IV, Random, 95% CI) | Subtotals only | |
| 6.1 COCP + Ant vs Oestr + Ant | 2 | 146 | Mean Difference (IV, Random, 95% CI) | 181.56 [‐344.73, 707.86] |
| Outcome or subgroup title | No. of studies | No. of participants | Statistical method | Effect size |
| 1 Live birth or ongoing pregnancy Show forest plot | 1 | Odds Ratio (M‐H, Fixed, 95% CI) | Subtotals only | |
| 1.1 Prog + antagonist (Ant) vs Oestr + Ant | 1 | 48 | Odds Ratio (M‐H, Fixed, 95% CI) | 2.04 [0.43, 9.70] |
| 2 Clinical pregnancy rate Show forest plot | 1 | Odds Ratio (M‐H, Fixed, 95% CI) | Subtotals only | |
| 2.1 Prog + Ant vs Oestr + Ant | 1 | 48 | Odds Ratio (M‐H, Fixed, 95% CI) | 2.30 [0.57, 9.22] |
| 3 Number of oocytes retrieved Show forest plot | 1 | Mean Difference (IV, Fixed, 95% CI) | Subtotals only | |
| 3.1 Prog + Ant vs Oestr + Ant | 1 | 48 | Mean Difference (IV, Fixed, 95% CI) | ‐0.5 [‐4.55, 3.55] |
| 4 Amount of gonadotrophins administered Show forest plot | 1 | Mean Difference (IV, Fixed, 95% CI) | Subtotals only | |
| 4.1 Prog + Ant vs Oestr + Ant | 1 | 48 | Mean Difference (IV, Fixed, 95% CI) | 310.0 [‐32.30, 652.30] |