Tratamiento con metformina antes y durante la FIV o la ICSI en pacientes con síndrome de ovario poliquístico
Información
- DOI:
- https://doi.org/10.1002/14651858.CD006105.pub3Copiar DOI

- Base de datos:
-
- Cochrane Database of Systematic Reviews
- Versión publicada:
-
- 18 noviembre 2014see what's new
- Tipo:
-
- Intervention
- Etapa:
-
- Review
- Grupo Editorial Cochrane:
-
Grupo Cochrane de Ginecología y fertilidad
- Copyright:
-
- Copyright © 2015 The Cochrane Collaboration. Published by John Wiley & Sons, Ltd.
Cifras del artículo
Altmetric:
Citado por:
Autores
Contributions of authors
For the present update of this review:
-
CRM: revised and updated the review.
-
LT: revised and updated the review.
-
MFC: revised and updated the review.
-
LA: revised and updated the review.
-
RA: revised and updated the review.
For the protocol and review.
-
LA: initiated and conceptualised the protocol and the initial version of the review.
-
RA: initiated and conceptualised the protocol and the initial version of the review.
-
MFC: contributed to the protocol and the initial version of the review.
-
VF: contributed to the protocol and the initial version of the review.
-
LT: contributed to the protocol and the initial version of the review.
Sources of support
Internal sources
-
Federal University of São Paulo (UNIFESP/EPM), Brazil.
External sources
-
Nuffield Department of Obstetrics and Gynecology, UK.
-
School of Women's and Children's Health, Division of Obstetrics and Gynecology, Royal Hospital for Women, Australia.
Declarations of interest
Review author Dr Michael Costello is a member of the pharmaceutical company Merck Sharp and Dohme (MSD) Australia Elonva Advisory Board Committee. He has received funding to attend ART Scientific Meetings including to present papers not on the review topic. These relationships are declared in the interests of transparency and do not constitute a conflict of interest in this review.
Acknowledgements
The review authors wish to express their gratitude to the Brazilian Cochrane Centre and the Menstrual Disorders and Subfertility Group, especially to Ms Helen Nagels and to Marian Showell, for their thoughtful comments and suggestions and for their continued support in developing and updating this systematic review.
Version history
| Published | Title | Stage | Authors | Version |
| 2020 Dec 21 | Metformin treatment before and during IVF or ICSI in women with polycystic ovary syndrome | Review | Leopoldo O Tso, Michael F Costello, Luiz Eduardo T Albuquerque, Regis B Andriolo, Cristiane R Macedo | |
| 2014 Nov 18 | Metformin treatment before and during IVF or ICSI in women with polycystic ovary syndrome | Review | Leopoldo O Tso, Michael F Costello, Luiz Eduardo T Albuquerque, Régis B Andriolo, Cristiane R Macedo | |
| 2009 Apr 15 | Metformin treatment before and during IVF or ICSI in women with polycystic ovary syndrome | Review | L O Tso, Michael F Costello, Régis B Andriolo, Vilmon Freitas | |
| 2006 Jul 19 | Metformin treatment before and during IVF/ICSI in women with polycystic ovarian syndrome | Protocol | Leopoldo de Oliveira Tso, Michael F Costello, Luiz Eduardo Albuquerque, Régis B Andriolo, Vilmon Freitas | |
Differences between protocol and review
The following outcomes were in the original protocol and have since been removed: clinical pregnancy rate (per transfer), pregnancy rate (per transfer and per woman), number of follicles and embryo quality (Methods; Types of outcome measures). Absolute risk was calculated for the primary outcomes.
After the publication of the protocol we decided to stratify the main analysis by type of stimulation protocol used (long GnRH‐agonist or short GnRH‐antagonist), in order to determine whether the type of stimulation used had an influence on the outcomes.
Keywords
MeSH
Medical Subject Headings (MeSH) Keywords
- Abortion, Spontaneous [epidemiology, prevention & control];
- Bias;
- Confidence Intervals;
- *Fertilization in Vitro;
- Hyperandrogenism [*drug therapy];
- Hyperinsulinism [*drug therapy];
- Hypoglycemic Agents [adverse effects, *therapeutic use];
- Live Birth [*epidemiology];
- Metformin [adverse effects, *therapeutic use];
- Ovarian Hyperstimulation Syndrome [epidemiology, prevention & control];
- Ovulation Induction [methods];
- Placebos [therapeutic use];
- Polycystic Ovary Syndrome [*complications];
- Pregnancy Rate;
- Randomized Controlled Trials as Topic;
- Sperm Injections, Intracytoplasmic;
Medical Subject Headings Check Words
Female; Humans; Pregnancy;
PICO
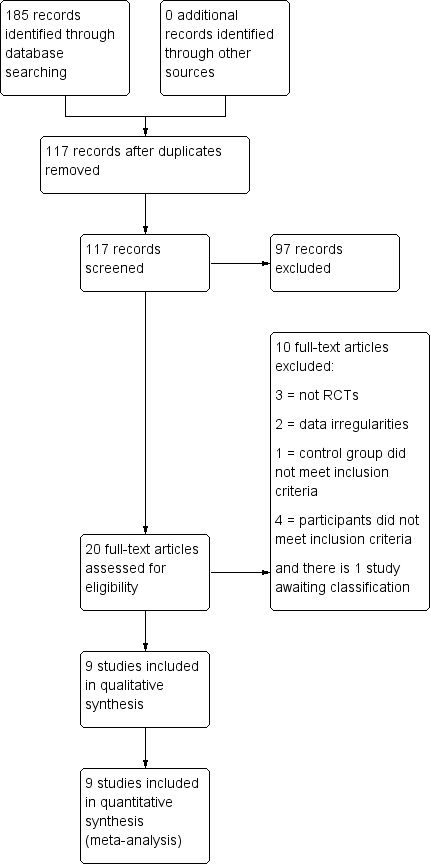
Study flow diagram.

'Risk of bias' graph: review authors' judgements about each methodological quality item presented as percentages across all included studies.

'Risk of bias' summary: review authors' judgements about each methodological quality item for each included study.

Forest plot of comparison: 1 Metformin versus placebo or no treatment, outcome: 1.1 Live birth rate per woman.

Forest plot of comparison: 1 Metformin versus placebo or no treatment, outcome: 1.2 Clinical pregnancy rate per woman.

Forest plot of comparison: 1 Metformin versus placebo or no treatment, outcome: 1.3 Incidence of OHSS per woman.

Comparison 1 Metformin versus placebo or no treatment, Outcome 1 Live birth rate per woman.
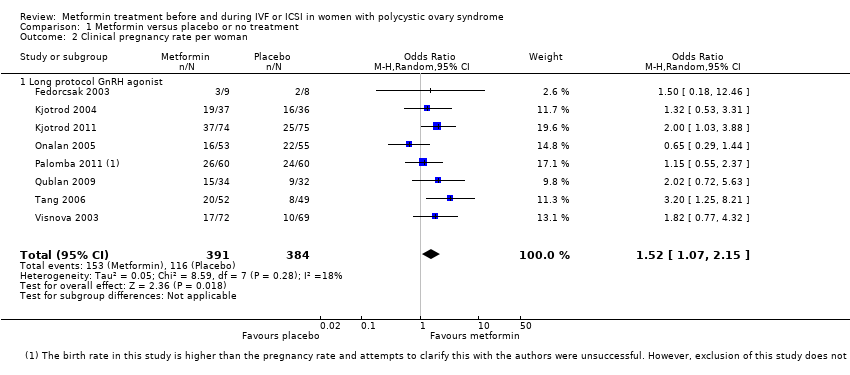
Comparison 1 Metformin versus placebo or no treatment, Outcome 2 Clinical pregnancy rate per woman.
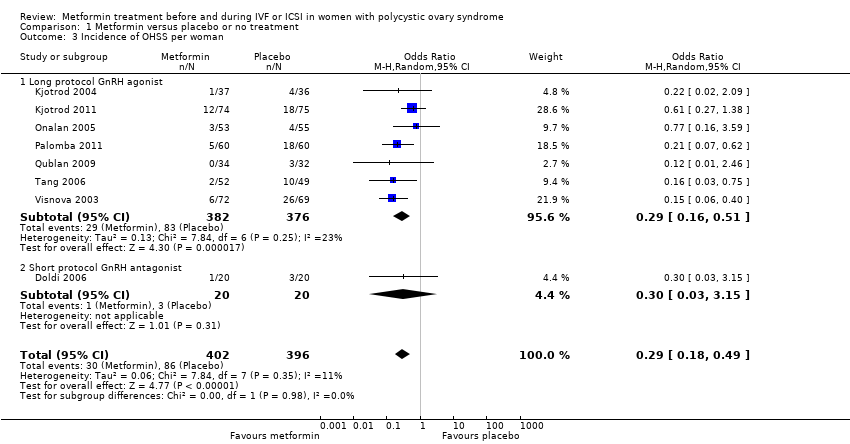
Comparison 1 Metformin versus placebo or no treatment, Outcome 3 Incidence of OHSS per woman.
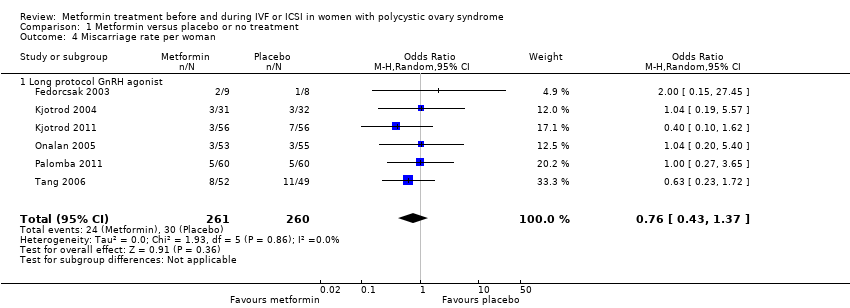
Comparison 1 Metformin versus placebo or no treatment, Outcome 4 Miscarriage rate per woman.
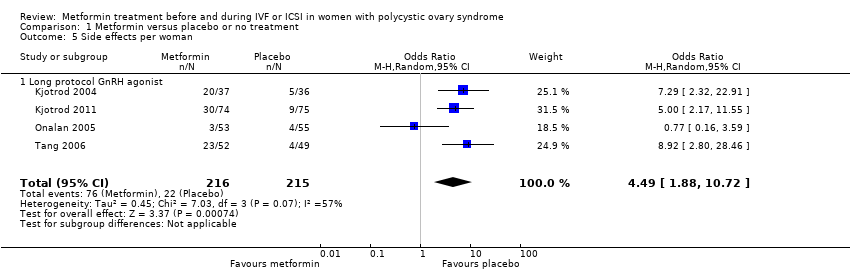
Comparison 1 Metformin versus placebo or no treatment, Outcome 5 Side effects per woman.
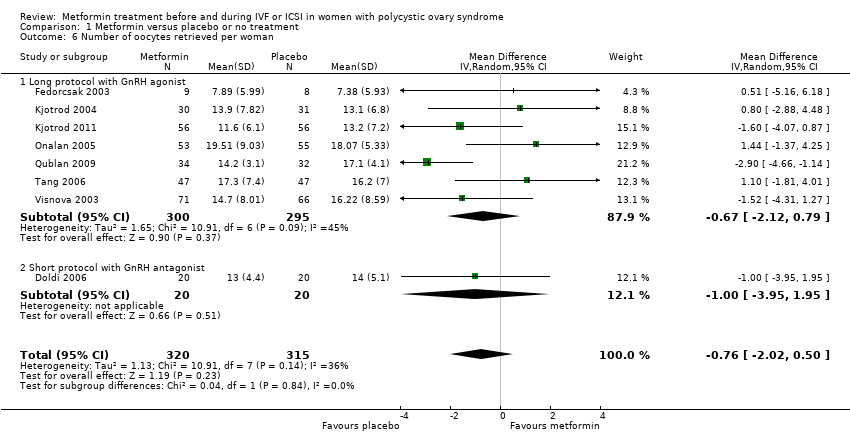
Comparison 1 Metformin versus placebo or no treatment, Outcome 6 Number of oocytes retrieved per woman.

Comparison 1 Metformin versus placebo or no treatment, Outcome 7 Mean total dose of FSH (IU) per woman.

Comparison 1 Metformin versus placebo or no treatment, Outcome 8 Mean days of gonadotrophin per woman.
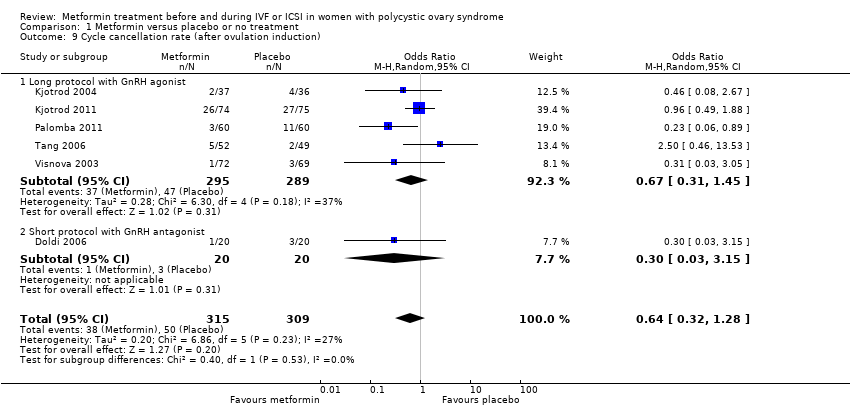
Comparison 1 Metformin versus placebo or no treatment, Outcome 9 Cycle cancellation rate (after ovulation induction).
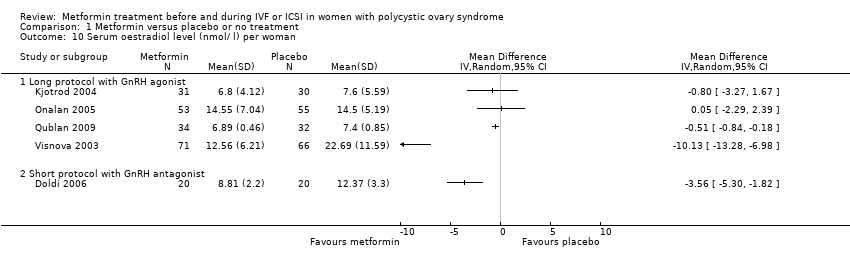
Comparison 1 Metformin versus placebo or no treatment, Outcome 10 Serum oestradiol level (nmol/ l) per woman.
| Study | Results | Metformin | Placebo |
| Onalan 2005 | No significant differences in total testosterone measures from women treated with placebo (P = 0.646) | Median 3.1; range 2.5 to 3.9 | Median 3.1; range 2.4 to 3 |
| Tang 2006 | Testosterone levels did not change significantly in the group taking metformin (P = 0.892); however, participants in the placebo group had a significant increase in testosterone levels (P = 0.040). In the metformin group, on the day of hCG administration, there was a significant decrease in testosterone concentration (P = 0.029) and in the free‐androgen index (P = 0.004) | Baseline geometric mean: 2.03 nmol/l, geometric mean on the day of hCG administration: 1.97 nmol/l. Testosterone concentration (geometric mean: 1.96 nmol/l). Free‐androgen index (geometric mean: 2.43) | Baseline geometric mean: 2.06 nmol/l, geometric mean on the day of hCG administration: 2.52 nmol/l. Testosterone concentration (geometric mean: 2.52 nmol/l). Free‐androgen index (geometric mean: 3.34) |
Comparison 1 Metformin versus placebo or no treatment, Outcome 11 Mean or median serum androgen levels per woman.
| Study | Results | Metformin | Placebo |
| Onalan 2005 | There were no significant changes in the glucose/insulin ratio between groups (P = 0.81) | Median 6; range 2.4 to 8.8 | Median 6; range 3 to 10 |
| Tang 2006 | There were no significant changes in the insulin sensitivity test (QUICKI) between baseline and the day of oocyte retrieval in the metformin group (P = 0.200) and the placebo group (P = 0.572). | Baseline: 0.377 At the day of oocyte retrieval: 0.417 | Baseline: 0.386 At the day of oocyte retrieval: 0.400 |
Comparison 1 Metformin versus placebo or no treatment, Outcome 12 Mean or median fasting insulin and glucose levels per woman.
| Metformin treatment before or during IVF or ICSI for women with polycystic ovary syndrome | ||||||
| Population: Women with polycystic ovary syndrome Control: Placebo or no treatment | ||||||
| Outcomes | Illustrative comparative risks* (95% CI) | Relative effect | No of Participants | Quality of the evidence | Comments | |
| Assumed risk | Corresponding risk | |||||
| Placebo or no treatment | Metformin treatment | |||||
| Live birth rate (per woman) ‐ ITT | 320 per 1000 | 395 per 1000 (276 to 530) | OR 1.39 | 551 | ⊕⊕⊝⊝ | |
| Clinical pregnancy rate (per woman) ‐ ITT | 307 per 1000 | 403 per 1000 | OR 1.52 | 775 | ⊕⊕⊕⊝ | |
| Incidence of OHSS | 270 per 1000 | 97 per 1000 | OR 0.29 | 798 | ⊕⊕⊕⊝ | |
| Miscarriage rate (per woman) | 139 per 1000 | 110 per 1000 | OR 0.76 | 521 | ⊕⊕⊕⊝ | |
| Side effects | 106 per 1000 | 347 per 1000 | OR 4.49 | 431 | ⊕⊕⊝⊝ | |
| *The basis for the assumed risk is the median control group risk across studies. The corresponding risk (and its 95% confidence interval) is based on the assumed risk in the comparison group and the relative effect of the intervention (and its 95% CI). | ||||||
| GRADE Working Group grades of evidence | ||||||
| 1 Inconsistency: unexplained heterogeneity (I2 = 52%) 2 Imprecision: total number of events is fewer than 300 3Inconsistency: unexplained heterogeneity (I2 = 57%) 4There was a data discrepancy in one of these studies (Palombo 2011). According to the study publication, in both the metformin group and the placebo group the clinical pregnancy rate was lower than the live birth rate. Sensitivity analyses excluding this study yielded an OR of 1.48 (95% CI 0.72 to 3.02) for live birth and 1.61 (95% CI 1.08 to 2.40) for pregnancy, which did not substantially change our findings. | ||||||
| Outcome or subgroup title | No. of studies | No. of participants | Statistical method | Effect size |
| 1 Live birth rate per woman Show forest plot | 5 | 551 | Odds Ratio (M‐H, Random, 95% CI) | 1.39 [0.81, 2.40] |
| 1.1 Long protocol GnRH agonist | 5 | 551 | Odds Ratio (M‐H, Random, 95% CI) | 1.39 [0.81, 2.40] |
| 2 Clinical pregnancy rate per woman Show forest plot | 8 | 775 | Odds Ratio (M‐H, Random, 95% CI) | 1.52 [1.07, 2.15] |
| 2.1 Long protocol GnRH agonist | 8 | 775 | Odds Ratio (M‐H, Random, 95% CI) | 1.52 [1.07, 2.15] |
| 3 Incidence of OHSS per woman Show forest plot | 8 | 798 | Odds Ratio (M‐H, Random, 95% CI) | 0.29 [0.18, 0.49] |
| 3.1 Long protocol GnRH agonist | 7 | 758 | Odds Ratio (M‐H, Random, 95% CI) | 0.29 [0.16, 0.51] |
| 3.2 Short protocol GnRH antagonist | 1 | 40 | Odds Ratio (M‐H, Random, 95% CI) | 0.30 [0.03, 3.15] |
| 4 Miscarriage rate per woman Show forest plot | 6 | 521 | Odds Ratio (M‐H, Random, 95% CI) | 0.76 [0.43, 1.37] |
| 4.1 Long protocol GnRH agonist | 6 | 521 | Odds Ratio (M‐H, Random, 95% CI) | 0.76 [0.43, 1.37] |
| 5 Side effects per woman Show forest plot | 4 | 431 | Odds Ratio (M‐H, Random, 95% CI) | 4.49 [1.88, 10.72] |
| 5.1 Long protocol GnRH agonist | 4 | 431 | Odds Ratio (M‐H, Random, 95% CI) | 4.49 [1.88, 10.72] |
| 6 Number of oocytes retrieved per woman Show forest plot | 8 | 635 | Mean Difference (IV, Random, 95% CI) | ‐0.76 [‐2.02, 0.50] |
| 6.1 Long protocol with GnRH agonist | 7 | 595 | Mean Difference (IV, Random, 95% CI) | ‐0.67 [‐2.12, 0.79] |
| 6.2 Short protocol with GnRH antagonist | 1 | 40 | Mean Difference (IV, Random, 95% CI) | ‐1.0 [‐3.95, 1.95] |
| 7 Mean total dose of FSH (IU) per woman Show forest plot | 8 | Mean Difference (IV, Random, 95% CI) | Totals not selected | |
| 7.1 Long protocol with GnRH agonist | 7 | Mean Difference (IV, Random, 95% CI) | 0.0 [0.0, 0.0] | |
| 7.2 Short protocol with GnRH antagonist | 1 | Mean Difference (IV, Random, 95% CI) | 0.0 [0.0, 0.0] | |
| 8 Mean days of gonadotrophin per woman Show forest plot | 8 | 643 | Mean Difference (IV, Random, 95% CI) | ‐0.19 [‐0.77, 0.40] |
| 8.1 Long protocol with GnRH agonist | 7 | 603 | Mean Difference (IV, Random, 95% CI) | ‐0.22 [‐0.89, 0.45] |
| 8.2 Short protocol with GnRH antagonist | 1 | 40 | Mean Difference (IV, Random, 95% CI) | 0.0 [‐1.30, 1.30] |
| 9 Cycle cancellation rate (after ovulation induction) Show forest plot | 6 | 624 | Odds Ratio (M‐H, Random, 95% CI) | 0.64 [0.32, 1.28] |
| 9.1 Long protocol with GnRH agonist | 5 | 584 | Odds Ratio (M‐H, Random, 95% CI) | 0.67 [0.31, 1.45] |
| 9.2 Short protocol with GnRH antagonist | 1 | 40 | Odds Ratio (M‐H, Random, 95% CI) | 0.30 [0.03, 3.15] |
| 10 Serum oestradiol level (nmol/ l) per woman Show forest plot | 5 | Mean Difference (IV, Random, 95% CI) | Totals not selected | |
| 10.1 Long protocol with GnRH agonist | 4 | Mean Difference (IV, Random, 95% CI) | 0.0 [0.0, 0.0] | |
| 10.2 Short protocol with GnRH antagonist | 1 | Mean Difference (IV, Random, 95% CI) | 0.0 [0.0, 0.0] | |
| 11 Mean or median serum androgen levels per woman Show forest plot | Other data | No numeric data | ||
| 12 Mean or median fasting insulin and glucose levels per woman Show forest plot | Other data | No numeric data | ||