Лечение метформином до и во время ЭКО или интра‐цитоплазматической инъекции сперматозоидов (ИКСИ ‐ICSI) у женщин с синдромом поликистозных яичников
Abstract
Background
The use of insulin‐sensitising agents, such as metformin, in women with polycystic ovary syndrome (PCOS) who are undergoing ovulation induction or in vitro fertilisation (IVF) cycles has been widely studied. Metformin reduces hyperinsulinaemia and suppresses the excessive ovarian production of androgens. As a consequence, it is suggested that metformin could improve assisted reproductive techniques (ART) outcomes, such as ovarian hyperstimulation syndrome (OHSS), pregnancy and live birth rates.
Objectives
To determine the effectiveness and safety of metformin as a co‐treatment during IVF or intracytoplasmic sperm injection (ICSI) in achieving pregnancy or live birth in women with PCOS.
Search methods
We searched the Cochrane Menstrual Disorders and Subfertility Group Trials Register, Cochrane Central Register of Controlled Trials (CENTRAL) (The Cochrane Library), MEDLINE, EMBASE, LILACS, the metaRegister of Controlled Trials and reference lists of articles (up to 15 October 2014).
Selection criteria
Types of studies: randomised controlled trials (RCTs) comparing metformin treatment with placebo or no treatment in women with PCOS who underwent IVF or ICSI treatment.
Types of participants: women of reproductive age with anovulation due to PCOS with or without co‐existing infertility factors.
Types of interventions: metformin administered before and during IVF or ICSI treatment.
Types of outcome measures: live birth rate, clinical pregnancy rate, miscarriage rate, incidence of ovarian hyperstimulation syndrome , incidence of participant‐reported side effects, serum oestradiol level on the day of trigger, serum androgen level, and fasting insulin and glucose levels.
Data collection and analysis
Two review authors independently selected the studies, extracted the data according to the protocol and assessed study quality. The overall quality of the evidence was assessed using GRADE methods.
Main results
We included nine randomised controlled trials involving a total of 816 women with PCOS. When metformin was compared with placebo there was no clear evidence of a difference between the groups in live birth rates (OR 1.39, 95% CI 0.81 to 2.40, five RCTs, 551 women, I2 = 52%, low‐quality evidence). Our findings suggest that for a woman with a 32 % chance of achieving a live birth using placebo, the corresponding chance using metformin treatment would be between 28% and 53%.
When metformin was compared with placebo or no treatment, clinical pregnancy rates were higher in the metformin group (OR 1.52; 95% CI 1.07 to 2.15; eight RCTs, 775 women, I2 = 18%, moderate‐quality evidence). This suggests that for a woman with a 31% chance of achieving a clinical pregnancy using placebo or no treatment, the corresponding chance using metformin treatment would be between 32% and 49%.
The risk of ovarian hyperstimulation syndrome was lower in the metformin group (OR 0.29; 95% CI 0.18 to 0.49, eight RCTs, 798 women, I2 = 11%, moderate‐quality evidence). This suggests that for a woman with a 27% risk of having OHSS without metformin the corresponding chance using metformin treatment would be between 6% and 15%.
Side effects (mostly gastrointestinal) were more common in the metformin group (OR 4.49, 95% CI 1.88 to 10.72, for RCTs, 431 women, I2=57%, low quality evidence)
The overall quality of the evidence was moderate for the outcomes of clinical pregnancy, OHSS and miscarriage, and low for other outcomes. The main limitations in the evidence were imprecision and inconsistency.
Authors' conclusions
This review found no conclusive evidence that metformin treatment before or during ART cycles improved live birth rates in women with PCOS. However, the use of this insulin‐sensitising agent increased clinical pregnancy rates and decreased the risk of OHSS.
PICO
Резюме на простом языке
Метформин у женщин с синдромом поликистозных яичников для повышения фертильности
Вопрос обзора: Целью этого Кокрейновского обзора было определить эффективность и безопасность метформина, инсулин‐сенситизирующего агента, для улучшения исходов вспомогательных репродуктивных технологий (ВРТ), особенно, живорождения и частоты клинической беременности у женщин с СПКЯ, проходящих терапию путем (или методом) искусственного оплодотворения (ЭКО).
Актуальность: Синдром поликистозных яичников (СПКЯ ) является состоянием, характеризующимся хронической недостаточностью или отсутствием овуляции (ановуляция) и избыточной продукцией мужских гормонов (гиперандрогения). Основными симптомами этого нарушения являются нерегулярные менструальные циклы, бесплодие, гирсутизм (избыточный рост волос) и угри (акне). Это состояние является наиболее распространенным эндокринным расстройством у женщин, затрагивающим примерно 5% ‐ 10% всех женщин репродуктивного возраста.
Характеристика исследований: В обзор были включены девять рандомизированных контролируемых испытаний с участием, в общей сложности, 816 женщин, которые были рандомизированы для получения метформина (411) против плацебо или отсутствия лечения (405). Испытания проводились в Чехии, Италии, Иордании, Норвегии, Турции и Великобритании. Доказательства актуальны на октябрь 2014 года.
Основные результаты: Когда метформин сравнивали с плацебо или отсутствием лечения, не было убедительных доказательств разницы между группами по числу живорожденных, но частота наступления беременности была выше в группе метформина, и риск синдрома гиперстимуляции яичников (СГЯ) был ниже. По нашим оценкам, у женщин с 32%‐ной вероятностью достижения живорождения при использовании плацебо или иного лечения, соответствующие шансы (вероятность) при использовании метформина были бы между 28% и 53%. Для женщины с 31%‐ной вероятностью достижения клинической беременности без метформина соответствующие шансы при использовании метформина были бы между 32% и 49%. У женщины с 27%‐ным риском синдрома гиперстимуляции яичников (СГЯ) без метформина, соответствующие шансы при использовании метформина были бы между 6% и 15%. Побочные эффекты (в основном со стороны желудочно‐кишечного тракта) были более распространены в группе метформина, хотя только четыре исследования сообщили об этом исходе.
Качество доказательств: В целом качество доказательств было умеренным в отношении исходов клинической беременности, СГЯ и выкидыша, и низким ‐ в отношении других исходов. Основными ограничениями в доказательствах были неточность и непоследовательность.
Вывод: Мы не обнаружили убедительных доказательств, что лечение метформином до или во время циклов ВРТ улучшало живорождаемость у женщин с синдромом поликистозных яичников (СПКЯ). Однако, использование этого инсулин‐сенситизирующего агента увеличивало частоту клинической беременности и снижало риск СГЯ.
Authors' conclusions
Summary of findings
| Metformin treatment before or during IVF or ICSI for women with polycystic ovary syndrome | ||||||
| Population: Women with polycystic ovary syndrome Control: Placebo or no treatment | ||||||
| Outcomes | Illustrative comparative risks* (95% CI) | Relative effect | No of Participants | Quality of the evidence | Comments | |
| Assumed risk | Corresponding risk | |||||
| Placebo or no treatment | Metformin treatment | |||||
| Live birth rate (per woman) ‐ ITT | 320 per 1000 | 395 per 1000 (276 to 530) | OR 1.39 | 551 | ⊕⊕⊝⊝ | |
| Clinical pregnancy rate (per woman) ‐ ITT | 307 per 1000 | 403 per 1000 | OR 1.52 | 775 | ⊕⊕⊕⊝ | |
| Incidence of OHSS | 270 per 1000 | 97 per 1000 | OR 0.29 | 798 | ⊕⊕⊕⊝ | |
| Miscarriage rate (per woman) | 139 per 1000 | 110 per 1000 | OR 0.76 | 521 | ⊕⊕⊕⊝ | |
| Side effects | 106 per 1000 | 347 per 1000 | OR 4.49 | 431 | ⊕⊕⊝⊝ | |
| *The basis for the assumed risk is the median control group risk across studies. The corresponding risk (and its 95% confidence interval) is based on the assumed risk in the comparison group and the relative effect of the intervention (and its 95% CI). | ||||||
| GRADE Working Group grades of evidence | ||||||
| 1 Inconsistency: unexplained heterogeneity (I2 = 52%) 2 Imprecision: total number of events is fewer than 300 3Inconsistency: unexplained heterogeneity (I2 = 57%) 4There was a data discrepancy in one of these studies (Palombo 2011). According to the study publication, in both the metformin group and the placebo group the clinical pregnancy rate was lower than the live birth rate. Sensitivity analyses excluding this study yielded an OR of 1.48 (95% CI 0.72 to 3.02) for live birth and 1.61 (95% CI 1.08 to 2.40) for pregnancy, which did not substantially change our findings. | ||||||
Background
Description of the condition
Polycystic ovary syndrome (PCOS) is a disorder characterised by chronic anovulation (failure or absence of ovulation) and hyperandrogenism (excessive production of male hormones in women) and is associated with irregular menstrual cycles, infertility, hirsutism and acne (Speroff 1995). This condition is the most common endocrine disorder in women, affecting approximately 5% to 10% of all women of reproductive age (Frank 1995; Knochenhauer 1998).
PCOS is a heterogenous condition, from a clinical as well as from a biochemical perspective. According to the recommendations proposed by an international consensus group (ESHRE/ASRM 2003), the diagnosis of PCOS is made when at least two of the following criteria are met:
-
oligo‐ or anovulation (infrequent or no ovulation);
-
clinical or biochemical signs of hyperandrogenism, or both;
-
polycystic ovaries on ultrasound.
Other causes of hyperandrogenism that mimic PCOS (such as congenital adrenal hyperplasia, Cushing's syndrome or androgen‐secreting tumours) should have been excluded.
Although the primary aetiology of PCOS is unknown (Balen 2004), insulin resistance with compensatory hyperinsulinaemia is a prominent feature of the syndrome and seems to play an important physiopathological role in hyperandrogenism, both in lean and obese women with PCOS (Dunaif 1989; Tsilchorozidou 2004). Hyperinsulinaemia increases ovarian androgen biosynthesis, both in vivo and in vitro (Adashi 1985; Barbieri 1986), and decreases the hepatic production of sex hormone‐binding globulin (SHBG) (Nestler 1991) thus leading to increased bioavailability of free androgens.
Description of the intervention
Several treatments have been used to induce ovulation and pregnancy in infertile anovulatory women with PCOS. The use of clomiphene citrate as first‐line treatment leads to modest pregnancy rates (Barbieri 2000; Kocak 2002; Thessaloniki ESHRE/ASRM‐Sponsored PCOS 2008). Based on the association between insulin resistance and anovulation in PCOS participants, insulin‐sensitising agents, such as metformin, have been recently added to the treatment protocols of these women (Costello 2007; Nestler 2002; Jungheim 2010).
How the intervention might work
Metformin is an orally active, water‐soluble biguanide used for the treatment type 2 diabetes mellitus. The drug has an antihyperglycaemic effect and does not cause hypoglycaemia. It enhances insulin sensitivity both in the liver, by inhibiting hepatic glucose production, and in peripheral tissues, such as muscle cells, by increasing glucose uptake and utilisation (Barbieri 1986; Dunn 1995; Nardo 2001). There is a good physiological rationale for believing that suppression of insulin levels, through the use of insulin‐sensitising agents such as metformin, may be useful in women with PCOS who are undergoing in vitro fertilisation (IVF) with or without intracytoplasmic sperm injection (ICSI). Suppression of insulin levels might ameliorate the adverse effects of ovarian stimulation and improve treatment outcomes such as ovulation and pregnancy rates (Dunaif 1989; Tang 2006). In addition, metformin may also act directly on ovarian thecal cells, decreasing androgen production (Attia 2001; Palomba 2010).
Why it is important to do this review
Women with PCOS who are undergoing ovarian stimulation with follicle‐stimulating hormone (FSH) are considered to be at increased risk for ovarian hyperstimulation syndrome (OHSS), one of the most important complications of assisted reproductive technology (ART). Higher total FSH doses lead to a larger number of follicles and oocytes, high serum oestradiol (E2) levels, increased risk of OHSS, elevated cancellation rates and lower conception rates (Aboulghar 2003; Yarali 2004). Therefore it is important to assess the effects of metformin on the clinical, biochemical and laboratory profiles of PCOS women undergoing ART cycles. Several adequately designed trials have addressed this question (Kjotrod 2004; Kjotrod 2011; Palomba 2011; Tang 2006).
Objectives
To determine the effectiveness and safety of metformin as a co‐treatment during IVF or intracytoplasmic sperm injection (ICSI) in achieving pregnancy or live birth in women with PCOS.
Methods
Criteria for considering studies for this review
Types of studies
The review included randomised controlled trials (RCTs) comparing metformin treatment with placebo or no treatment in women with PCOS undergoing IVF or ICSI treatment.
Quasi‐randomised trials were not included. Only the first part of cross‐over trials was considered in the meta‐analysis.
Types of participants
Women of reproductive age with anovulation attributed to PCOS, with or without another cause of couple infertility, who were treated with metformin before and during an IVF or ICSI cycle were eligible.
The aetiology of infertility leading to treatment by IVF or ICSI was defined by individual study authors. The diagnosis of PCOS was based on the ESHRE/ASRM criteria (ESHRE/ASRM 2003). Due to the wide variation of diagnostic criteria used for PCOS, studies that used different diagnostic criteria were included in the review if the broad definition included in the study matched the ESHRE/ASRM criteria. According to the recommendations proposed by that group, the diagnosis of PCOS is made when at least two of the following criteria are met:
-
oligo‐ or anovulation (infrequent or no ovulation);
-
clinical or biochemical (or both) signs of hyperandrogenism;
-
polycystic ovaries on ultrasound.
Other causes of hyperandrogenism that mimic PCOS (such as congenital adrenal hyperplasia, Cushing's syndrome or androgen‐secreting tumours) should have been excluded.
Types of interventions
Metformin versus no treatment or placebo before or during IVF or ICSI treatment.
Types of outcome measures
Primary outcomes
-
Live birth rate (per woman), defined as a baby born after 20 weeks of gestation.
-
Clinical pregnancy rate (per woman), defined as the identification of an intrauterine gestational sac on ultrasound scan.
-
Incidence of OHSS (per woman), defined according to the definition of reporting authors.
Secondary outcomes
4. Miscarriage rate (per woman), defined as the involuntary loss of a pregnancy before 20 weeks gestation.
5. Incidence of participant‐reported side effects.
6. Number of oocytes retrieved.
7. Total dose of FSH (in IU).
8. Number of days of gonadotrophin treatment.
9. Cycle cancellation rate (per woman).
10. Serum oestradiol level on the day of human chorionic gonadotrophin (hCG) trigger injection.
11. Serum androgen level (total testosterone, sex hormone‐binding globulin (SHBG) or free‐androgen index).
12. Fasting insulin and glucose levels.
13. Fertilisation rate, defined as normal fertilisation with two pronuclei‐stage embryos. The fertilisation rate was defined as the number of normally fertilised oocytes divided by the number of oocytes retrieved per cycle.
Search methods for identification of studies
We sought all relevant RCTs of metformin co‐treatment (prior to or during ovarian stimulation) in women with PCOS undergoing IVF or ICSI treatment, without language restriction. Searching was originally done in 2008. We carried out updated searches in November 2012, September 2013 and 15 October 2014. Our searches were performed in consultation with the Cochrane Menstrual Disorders and Subfertility Group Trials Search Co‐ordinator.
Electronic searches
For the identification of relevant studies, we developed detailed search strategies for each specific database. These were based on the search strategy developed for MEDLINE (OVID) and revised appropriately for each database. We searched the following databases: Cochrane Menstrual Disorders and Subfertility Group Trials Register (searched 15 October 2014), Cochrane Central Register of Controlled Trials (CENTRAL) (The Cochrane Library 2014, Issue 10), MEDLINE (1966 to October 2014), EMBASE (1980 to October 2014) and LILACS (1982 to October 2014). We also searched trial registers for ongoing and registered trials: http://www.controlled‐trials.com; http://clinicaltrials.gov/ct2/home; http://www.who.int/trialsearch/Default.aspx. Search details are available in Appendix 1 (October 2014).
Searching other resources
We checked the citation lists of relevant publications, review articles and included studies. We handsearched references of identified selected articles for additional relevant citations. We also contacted experts in the field for additional relevant citations.
Data collection and analysis
We analysed data using Review Manager 5.1 (RevMan 2011).
Selection of studies
For the 2014 update, two authors (LOT and LETA) independently selected the trials included in this review in accordance with the aforementioned criteria. Disagreements were settled by a third review author (CRM). Particular attention was paid to whether there were differences in the characteristics of the women in the comparison groups as to:
-
age;
-
body mass index (BMI);
-
duration and causes of infertility;
-
dose and duration of metformin co‐treatment;
-
androgen levels (total testosterone, SHBG, free‐androgen index);
-
fasting glucose and insulin levels;
-
number of embryos transferred;
-
previous ovarian surgery.
Data extraction and management
Two authors (LOT and LETA) extracted all data independently using forms designed according to Cochrane guidelines. We sought additional information from authors of trials that appeared to meet the eligibility criteria but had unclear methodological details. We also sought further trial data when the data in the reports were presented in a form that was unsuitable for meta‐analysis.
Differences of opinion were registered and resolved by consensus. The review authors planned to perform a series of analyses on the results. These analyses were not always possible due to an insufficient number of trials reporting on a particular outcome.
We extracted the following information from the studies included in the review and this is presented in the Characteristics of included studies table.
-
Trial characteristics
-
Randomisation
-
Allocation concealment
-
Trial design: multicentre or single centre, single phase or cross‐over design
-
Number of participants randomised, excluded and analysed
-
Duration, timing and location of the trial
-
Source of funding
-
-
Baseline characteristics of the studied groups
-
Definition of PCOS and duration of pre‐existing infertility
-
Age of the participants
-
Investigative work‐up
-
Other causes of infertility
-
Previously administered infertility treatment(s)
-
BMI
-
-
Interventions
-
Type of intervention and control
-
Dose regimen and duration
-
-
Outcomes
-
Outcomes reported
-
Definition of outcomes
-
Measurement of outcomes
-
Timing of outcome measurement
-
Assessment of risk of bias in included studies
Two review authors (LEO and CRM) independently assessed the risk of bias of the included studies using the tools described in Chapter 8 of the Cochrane Handbook for Systematic Reviews of Interventions version 5.1.0 (Higgins 2011). The domains investigated were: allocation (random sequence generation and allocation concealment); blinding of participants, personnel and outcome assessors; completeness of outcome data; selective reporting and other biases.
Measures of treatment effect
For dichotomous data, we expressed the results for each study as odds ratios (ORs) with 95% confidence intervals (CIs). For continuous data, we measured the mean post‐treatment intervention values and standard deviations for each group and calculated mean differences (MDs) with 95% CIs. If similar outcomes were reported using different scales, we calculated the standard mean differences (SMDs) with 95% CIs.
Unit of analysis issues
We analysed the primary outcomes and the miscarriage outcomes per woman randomised. Some of the included studies reported our primary outcomes using other units of analysis (e.g. per cycle, per embryo transfer). These data were not included in the review because they were not randomised comparisons but applied only to selected subsets of participants, such as those who underwent repeated cycles or those who underwent embryo transfer.
We reported and pooled the review outcomes number of gonadotrophin units used and number of days of gonadotrophin treatment, because all women underwent one treatment cycle. For studies that performed more than one cycle per woman, only the data from the first cycle were included in the meta‐analyses.
Dealing with missing data
As far as possible, we analysed data on an intention‐to‐treat (ITT) basis and made attempts to obtain missing data from the original trials. Where data were unavailable, we only analysed the available data.
Assessment of heterogeneity
We considered whether the clinical and methodological characteristics of the included studies were sufficiently similar for meta‐analysis to provide a clinically meaningful summary. We assessed statistical heterogeneity using the I2 statistic; I2 > 50% was interpreted as being indicative of substantial heterogeneity among studies.
Assessment of reporting biases
In view of the difficulty of detecting and correcting for publication bias and other reporting biases, we aimed to minimise their potential impact by undertaking a comprehensive search for eligible studies and by paying attention to data duplication. We planned to use a funnel plot to explore the possibility of publication bias, if enough studies (10 or more) were found for any of the primary analyses.
Data synthesis
We combined data for meta‐analysis with the RevMan software using a random‐effects model. For reporting purposes we translated primary outcomes to absolute risks.
Subgroup analysis and investigation of heterogeneity
We performed a stratified meta‐analysis according to the type of stimulation protocol (long GnRH‐agonist or short GnRH‐antagonist). This stratification was added in the 2014 update of the review, to examine any possible difference in effect related to type of stimulation.
If there was a clinically important difference in drug regimen (outside normal clinical practice) among studies, we planned to examine the possible effects by performing subgroup analyses.
Sensitivity analysis
We conducted sensitivity analyses for the primary outcomes to determine whether the conclusions were robust to arbitrary decisions made regarding the eligibility and analysis. These analyses included consideration of whether the review conclusions would have differed if:·
-
Eligibility were restricted to studies without high risk of bias·
-
A fixed effect model had been adopted·
-
The summary effect measure had been relative risk rather than odds ratio.
Overall quality of the body of evidence: 'Summary of findings' table
We generated a 'Summary of findings' table using GRADEpro 2011 software. This table evaluated the overall quality of the body of evidence for main review outcomes, using GRADE criteria (study limitations i.e. risk of bias, consistency of effect, imprecision, indirectness and publication bias). Judgements about evidence quality (high, moderate or low) were justified, documented and incorporated into the reporting of results for each outcome.
Results
Description of studies
Results of the search
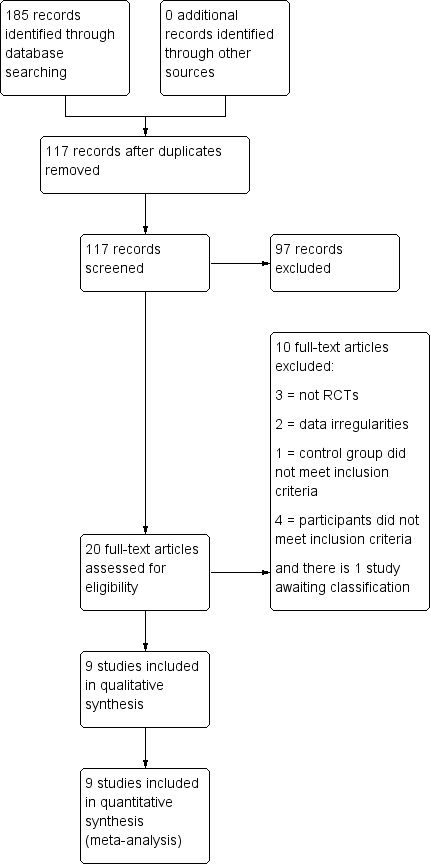
The 2014 search retrieved 185 citations. After screening the titles and abstracts of these citations, we selected 25 for full‐text reading, of which we excluded 15. One study (Tang 2010) is awaiting classification and nine matched the selection criteria and were included in the review (see Figure 1 for details of the study selection process). There were three duplicate publications: Stadtmauer 1999 and Stadtmauer 2000, the latter being a continuation of the former; Visnova 2002 and Visnova 2003, one in English and the other in Czech; Kjotrod 2003a, Kjotrod 2004 and Kjotrod 2008a, all generated from the same trial.

Study flow diagram.
Three new studies were included in this updated version of the 2009 systematic review (Kjotrod 2011; Palomba 2011; Qublan 2009). Therefore nine studies in total met the inclusion criteria and were included in the review (Doldi 2006; Fedorcsak 2003; Kjotrod 2004; Kjotrod 2011; Onalan 2005; Palomba 2011; Qublan 2009; Tang 2006; Visnova 2003). We sent emails to the authors of three studies to obtain more details on study characteristics and methodological quality that were unclear in the published article. Three author groups (Fedorcsak 2003; Onalan 2005; Tang 2006) answered our queries. See the tables Characteristics of included studies and Characteristics of excluded studies. All trials reported that only one cycle per participant was permitted, with the exception of Fedorcsak 2003 (a cross‐over trial).
Included studies
Study design and setting
Nine parallel‐design randomised controlled trials (RCTs) and one cross‐over trial were included in the review. A total of 816 participants were randomised.
-
Six were prospective, randomised, double‐blind, placebo‐controlled trials (metformin versus placebo): Kjotrod 2004; Onalan 2005; Tang 2006; Qublan 2009; Kjotrod 2011; Palomba 2011.
-
One was a prospective, open‐label, randomised, placebo‐controlled, cross‐over trial: Fedorcsak 2003. Only data from the pre‐cross‐over phase of this study were considered for meta‐analysis.
-
Two were prospective, randomised controlled trials (metformin versus no treatment): Visnova 2003; Doldi 2006.
Participants
All participants were women undergoing IVF or ICSI treatments. A total of 816 women were randomised: 405 to the placebo and 411 to the metformin groups, respectively.
Baseline characteristics of the studied groups
Eight studies met the Rotterdam criteria (ESHRE/ASRM 2003) for PCOS: Doldi 2006; Fedorcsak 2003; Kjotrod 2004; Kjotrod 2011; Onalan 2005; Palomba 2011; Qublan 2009; Tang 2006. One study (Visnova 2003) did not meet the Rotterdam criteria because other causes for hyperandrogenism that mimic PCOS (such as congenital adrenal hyperplasia, Cushing's syndrome or androgen‐secreting tumours) were not reported as excluded.
Five studies did not report the cause(s) of infertility (Doldi 2006; Fedorcsak 2003; Palomba 2011; Tang 2006; Visnova 2003).
Six studies (Kjotrod 2004; Kjotrod 2011; Onalan 2005; Palomba 2011; Qublan 2009; Tang 2006) provided full baseline characteristics of the participants in both groups (age, BMI, duration of infertility, previously used treatment). Two studies (Fedorcsak 2003; Visnova 2003) provided incomplete baseline characteristics of the study participants (only age and BMI). Doldi 2006 did not report any baseline characteristics of the participants. One study (Doldi 2006) did not report what the exclusion criteria were.
Interventions
A single study started metformin on the day of ovulation induction with FSH (Visnova 2003); the other eight studies used metformin before and during ovulation induction for IVF or ICSI treatment. Metformin commencement varied from 16 weeks before (earliest) to the first day (latest) of GnRH‐agonist administration in the studies reporting metformin use before FSH treatment and continued at least until the day of the hCG trigger.
Visnova 2003 used metformin 500 mg twice daily; Qublan 2009 and Tang 2006 used metformin 850 mg twice daily; Doldi 2006, Fedorcsak 2003 and Palomba 2011 used metformin 500 mg three times daily; Onalan 2005 used metformin 850 mg twice daily (BMI < 28 kg/m2) or three times daily (BMI >= 28 kg/m2); Kjotrod 2004 used metformin 1 g twice daily. Kjotrod 2011 gradually increased the dose of metformin from 500 gm to 2 g per day during the first week of treatment.
Eight of the nine studies used long‐protocol GnRH‐agonist with recombinant FSH (rec‐FSH); Doldi 2006 used the short protocol GnRH‐antagonist with rec‐FSH. Only Visnova 2003 used either rec‐FSH or highly purified FSH (hp‐FSH) and only Qublan 2009 used HMG (hp‐urinary gonadotrophin).
The method of oocyte fertilisation varied among the trials and included IVF alone (Doldi 2006), ICSI alone (Onalan 2005) or a combination of IVF and ICSI, depending on the cause of infertility (Fedorcsak 2003; Kjotrod 2004; Kjotrod 2011; Qublan 2009; Palomba 2011; Tang 2006). One trial (Visnova 2003) did not report whether IVF or ICSI was performed.
A maximum of two embryos were transferred on day two after oocyte retrieval by Tang 2006 and on day three by Fedorcsak 2003 and Kjotrod 2004. A maximum of three embryos were transferred on day two by Doldi 2006 and on day three by Onalan 2005. Kjotrod 2011 transferred up to two embryos on day two or three. Qublan 2009 transferred two to four embryos on day three. Palomba 2011 transferred a maximum of two embryos on day two, three or five (blastocyst stage). One study (Visnova 2003) did not report on the number of embryos transferred. Two authors (Doldi 2006; Tang 2006) reported performing embryo transfer under ultrasound guidance.
The type of luteal phase support also varied among the trials and included vaginal progesterone capsules (Progestan 200 mg three times daily) (Kjotrod 2004), vaginal progesterone gel (Crinone 90 mg (8%) daily) (Doldi 2006), vaginal progesterone pessaries (Cyclogest 400 mg daily) (Qublan 2009; Tang 2006) intramuscular progesterone (25 mg daily and 50 mg daily) (Fedorcsak 2003; Palomba 2011), and progesterone, yet the type and dose were selected by the physician (Kjotrod 2011 ). Two studies (Onalan 2005; Visnova 2003) did not report what type of medication was used for luteal phase support.
Onalan 2005 performed selective assisted hatching with laser when: the participant was over 35 years of age; the zona pellucida was considered thick; an abnormally shaped zona was present; or excessive embryo fragmentation or slowly developing embryos were noted. We considered this procedure to be substantially different from the other trials.
Outcomes
Primary outcomes
-
5/9 studies reported live birth rate (per woman) (Kjotrod 2004; Kjotrod 2011; Onalan 2005; Palomba 2011; Tang 2006).
-
8/9 studies reported clinical pregnancy rate (Fedorcsak 2003; Kjotrod 2004; Kjotrod 2011; Onalan 2005; Palomba 2011; Qublan 2009; Tang 2006; Visnova 2003).
-
8/9 studies reported OHSS (Doldi 2006; Kjotrod 2004; Kjotrod 2011; Onalan 2005; Palomba 2011; Qublan 2009; Tang 2006; Visnova 2003).
The publication by Onalan 2005 did not provide the live birth rate and we obtained this information after contacting the author by email.
Secondary outcomes
-
6/9 studies reported miscarriage rate (Fedorcsak 2003; Kjotrod 2004; Kjotrod 2011; Onalan 2005; Palomba 2011; Tang 2006). Miscarriage was defined as the involuntary loss of a pregnancy before 20 weeks gestation.
-
4/9 studies reported participant‐reported side effects (Kjotrod 2004; Kjotrod 2011; Onalan 2005; Tang 2006).
-
8/9 studies reported the number of oocytes retrieved, total dose of FSH and the number of days of gonadotrophin treatment per woman (Doldi 2006; Fedorcsak 2003; Kjotrod 2004; Kjotrod 2011; Onalan 2005; Qublan 2009; Tang 2006; Visnova 2003). Only Palomba 2011 did not report these outcomes and we were unsuccessful in contacting the author.
-
6/9 studies reported cancellation rates (Doldi 2006; Kjotrod 2004; Kjotrod 2011; Palomba 2011; Tang 2006; Visnova 2003).
-
5/9 trials reported serum oestradiol level on the day of hCG (Doldi 2006; Kjotrod 2004; Onalan 2005; Qublan 2009; Visnova 2003).
-
Only Tang 2006 reported fertilisation rate as the main outcome measure.
Excluded studies
We excluded 10 studies after full‐text reading. Reasons for exclusion are in parentheses:
-
Demirol 2006 (not a randomised controlled trial);
-
Egbase 2001 (data irregularities);
-
Geusa 2002 (data irregularities);
-
Kahraman 2001 (control group treated with oral contraceptives and not placebo or no treatment);
-
Palomba 2011b (participants were poor responders);
-
Schachter 2007 (women specifically undergoing ICSI were not randomised separately);
-
Stadtmauer 1999 (participants acted as their own control);
-
Stadtmauer 2001 (retrospective data analysis);
-
Stadtmauer 2002 (not a randomised controlled trial);
-
Tasdemir 2004 (participants undergoing ovulation induction cycles; not IVF or ICSI cycle
Risk of bias in included studies

'Risk of bias' graph: review authors' judgements about each methodological quality item presented as percentages across all included studies.
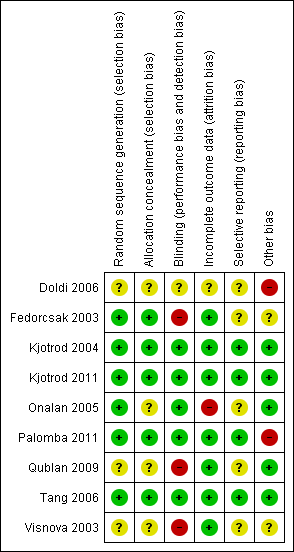
'Risk of bias' summary: review authors' judgements about each methodological quality item for each included study.
Allocation
Random sequence generation
Six trials reported acceptable methods of sequence generation and we classified them as being at low risk of bias for this domain (Fedorcsak 2003; Kjotrod 2004; Kjotrod 2011; Onalan 2005; Palomba 2011; Tang 2006). Four used computer randomisation (Kjotrod 2004; Kjotrod 2011; Onalan 2005; Palomba 2011) and two a random numbers table (Fedorcsak 2003; Tang 2006). The other three studies (Doldi 2006; Qublan 2009; Visnova 2003) did not report what methods were used for sequence generation and we classified them as having an unclear risk of bias for this domain.
Allocation concealment
Five studies were at low risk of bias for allocation concealment because they used either sequentially numbered sealed envelopes (Fedorcsak 2003) or codes kept by a third party such as the pharmacy department (Kjotrod 2004; Kjotrod 2011; Palomba 2011) or a trial office (Tang 2006). Four studies (Doldi 2006; Onalan 2005; Qublan 2009; Visnova 2003) did not report the allocation concealment method used and we classified them as having an unclear risk of bias.
Blinding
We did not consider that blinding was likely to influence findings for the primary review outcomes (live birth rate, clinical pregnancy rate and incidence of OHSS). However for side effects, blinding status could potentially affect findings. Five studies reported double‐blinding (Kjotrod 2004; Kjotrod 2011; Onalan 2005; Palomba 2011; Tang 2006) and we classified them as being at low risk of bias for this domain. Three studies were open‐label comparisons (Fedorcsak 2003; Visnova 2003; Doldi 2006) and one was single‐blind (Qublan 2009) and therefore we classified it as being at high risk of bias.
Incomplete outcome data
We judged seven studies (Fedorcsak 2003; Kjotrod 2004; Kjotrod 2011; Palomba 2011; Qublan 2009; Tang 2006; Visnova 2003) to be at low risk of bias because they analysed their data on an intention‐to‐treat basis (trial participants were analysed in the groups to which they were randomised; all participants were included as there were no withdrawals). One study (Doldi 2006) did not report the reasons for withdrawals and we judged it to be at unclear risk of bias for this domain. One study (Onalan 2005) conducted available case analyses (trial participants were analysed in the groups to which they were randomised and only participants who completed the trials were included) and we judged it to be at high risk of bias for this domain.
Selective reporting
Kjotrod 2004, Kjotrod 2011, Palomba 2011 and Tang 2006 reported live birth and clinical pregnancy rates and OHSS (the primary outcomes of this review); therefore we classified them as being at low risk of bias.
We judged five studies (Doldi 2006; Fedorcsak 2003; Onalan 2005; Qublan 2009; Visnova 2003) to be at unclear risk for selective reporting bias because they failed to report at least one of the following outcomes: live birth, clinical pregnancy or OHSS (the primary outcomes of this review).
Other potential sources of bias
Doldi 2006 did not report baseline characteristics of the participants nor the causes of infertility and we judged it to be at high risk of bias. We also rated Palomba 2011 as being at high risk of bias in this domain, due to a data discrepancy. We attempted without success to contact the authors to clarify this.
Fedorcsak 2003 and Visnova 2003 did not report the causes of infertility and we thus deemed them to be at unclear risk of bias.
The remaining six studies (Kjotrod 2004; Kjotrod 2011; Onalan 2005; Palomba 2011; Qublan 2009; Tang 2006) reported similar baseline characteristics for participants in both groups and we found no other potential sources of within‐study bias. Therefore, we classified these six studies as being at low risk of bias.
Effects of interventions
1. Comparison of metformin versus placebo or no treatment
Primary outcomes
1.1 Live birth rate (per woman)
This was reported by five studies (Kjotrod 2004; Kjotrod 2011; Onalan 2005; Palomba 2011; Tang 2006), all of which utilised long GnRH‐agonist stimulation protocol. There was no evidence of a difference in live birth rates between the metformin group and the placebo group (OR 1.39; 95% CI 0.81 to 2.40, five RCTs, 551 women, I2=52%, low quality evidence) (Analysis 1.1;Figure 4 ). This suggests that for a woman with a 32% chance of achieving a live birth using placebo, the corresponding chance using metformin would be between 28% and 53%.
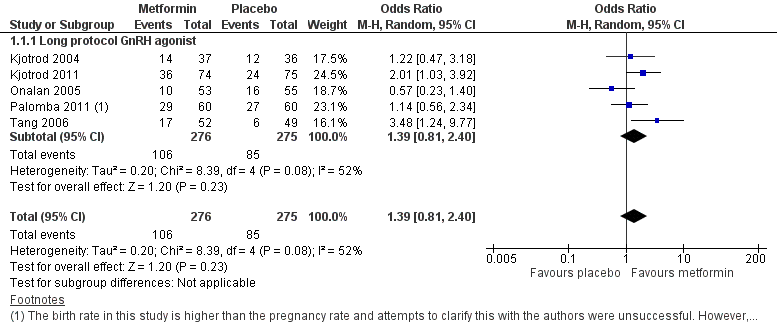
Forest plot of comparison: 1 Metformin versus placebo or no treatment, outcome: 1.1 Live birth rate per woman.
There was substantial statistical heterogeneity in this analysis (I2 = 52%, P = 0.08). Exclusion from analysis of one of the studies (Onalan 2005) reduced the I2 statistic to 20%. The only obvious difference between this study and the others was that Onalan 2005 used assisted hatching. As it does not appear biologically plausible that this would account for the difference, we were unable to account for the heterogeneity.
We conducted a post‐hoc sensitivity analysis due to a data discrepancy in one of the studies (Palomba 2011). According to the study publication, in both the metformin group and the placebo group the clinical pregnancy rate was lower than the live birth rate (pregnancy 26/60, 24/60; live birth 29/60, 27/60). Attempts to contact the first author have so far received no response. Sensitivity analysis excluding this study yielded an OR of 1.48 (95% CI 0.72 to 3.02) for live birth, which did not substantially change our findings.
1.2 Clinical pregnancy rate (per woman)
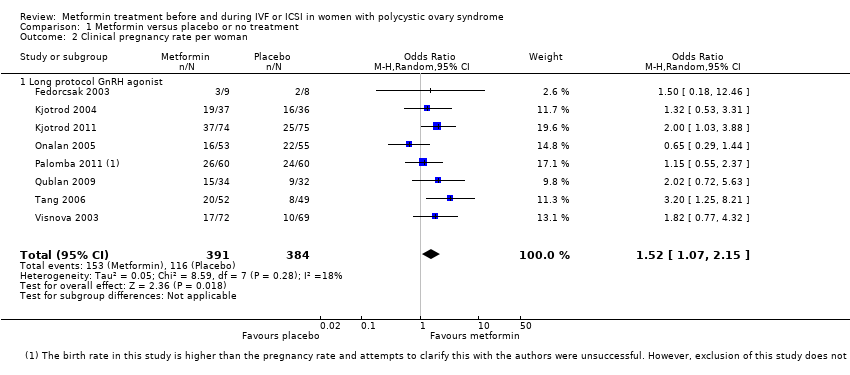
Eight studies reported this outcome (Fedorcsak 2003; Kjotrod 2004; Kjotrod 2011; Onalan 2005; Palomba 2011; Qublan 2009; Tang 2006; Visnova 2003), all of which utilised long GnRH‐agonist stimulation protocol. Clinical pregnancy rates were higher in the metformin group than in the placebo or no treatment group (OR 1.52; 95% CI 1.07 to 2.15, 8 studies, 775 women, I2 = 18%, moderate quality evidence) (Analysis 1.2; Figure 5). Heterogeneity was low in this analysis (I2 = 18%, P = 0.28). Our findings suggest that for a woman with a 30% chance of achieving a clinical pregnancy using placebo or no treatment, the corresponding chance using metformin would be between 32% and 48%.
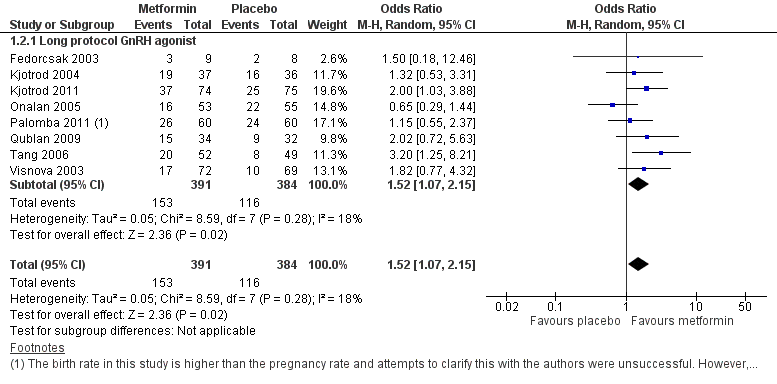
Forest plot of comparison: 1 Metformin versus placebo or no treatment, outcome: 1.2 Clinical pregnancy rate per woman.
As noted above, we conducted a post‐hoc sensitivity analysis due to a data discrepancy in one of the studies (Palomba 2011). Sensitivity analysis excluding this study yielded an OR of 1.61 (95% CI 1.08 to 2.40) for pregnancy, which did not substantially change our findings.
1.3 Incidence of OHSS
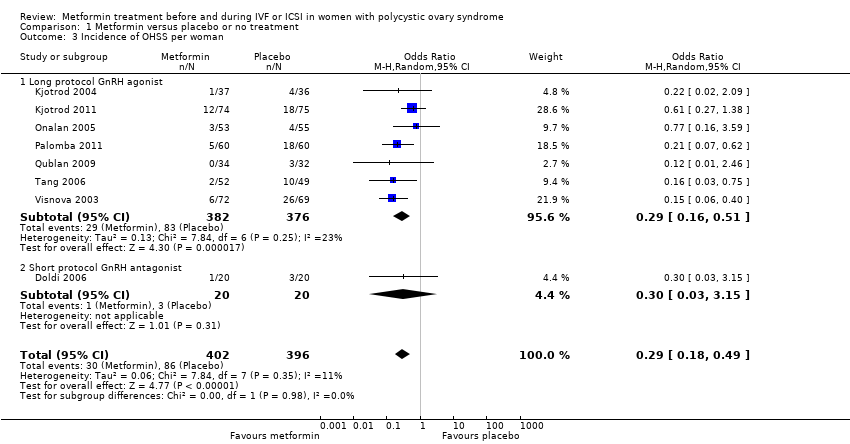
Eight studies reported this outcome (Doldi 2006; Kjotrod 2004; Kjotrod 2011; Onalan 2005; Palomba 2011; Qublan 2009; Tang 2006; Visnova 2003). The incidence of OHSS was lower in the metformin group than in the placebo or no treatment group (OR 0.29; 95% CI 0.18 to 0.49, eight RCTs, 798 women, I2=11%, moderate quality evidence) (Analysis 1.3; Figure 6). This suggests that for a woman with a 27% risk of OHSS without metformin, the corresponding risk using metformin would be between 6% and 15%.

Forest plot of comparison: 1 Metformin versus placebo or no treatment, outcome: 1.3 Incidence of OHSS per woman.
This outcome was also analysed according to two subcategories: studies which used a long protocol with a GnRH‐agonist and those using a short protocol with a GnRH‐antagonist. The pooled analysis of the seven studies (Kjotrod 2004; Kjotrod 2011; Onalan 2005; Palomba 2011; Qublan 2009; Tang 2006; Visnova 2003) which used the long protocol revealed a benefit from metformin, with lower incidence of OHSS (OR 0.29; 95% CI 0.16 to 0.51, 758 women, I2 = 23%). Doldi 2006 used a short‐protocol antagonist and found no difference between the two groups (OR 0.30; 95% CI 0.03 to 3.15, 40 women).
Secondary outcomes
1.4 Miscarriage rate (per woman)
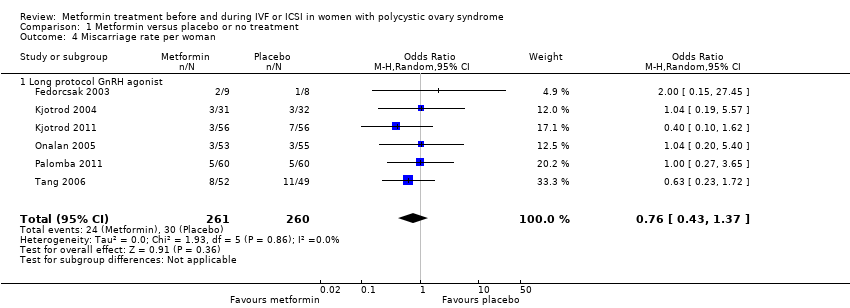
Six studies were included in this analysis (Fedorcsak 2003; Kjotrod 2004; Kjotrod 2011; Onalan 2005; Palomba 2011; Tang 2006), all of which utilised long GnRH‐agonist stimulation protocol. There was no evidence of a difference in miscarriage rates between the groups (OR 0.76; 95% CI 0.43 to 1.37, six RCTs, 521 women, I2=0%, moderate quality evidence) Analysis 1.4.
1.5 Incidence of participant‐reported side effects
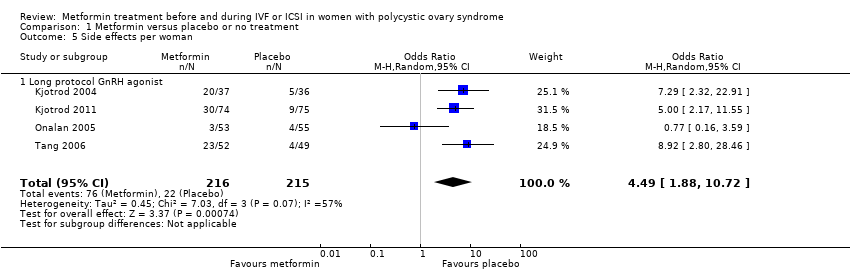
Four studies reported this outcome (Kjotrod 2004; Kjotrod 2011; Onalan 2005; Tang 2006), all of which utilised long GnRH‐agonist stimulation protocol. Metformin treatment was associated with more side effects (76/216, 35.1%) than placebo (OR 4.49; 95% CI 1.88 to 10.72, four RCTs, 431 women, I2 = 57%) (Analysis 1.5).
There was substantial heterogeneity for this analysis (I2=57%). In three of the four individual trials there were more side effects in the group taking metformin (Kjotrod 2004; Kjotrod 2011; Tang 2006), while the results of Onalan 2005 were considerably different. There were no apparent reasons for the observed heterogeneity among studies in terms of study methodology or clinical parameters (participants, exposure, outcomes). The doses and duration of metformin treatment used in the four trials were similar.
According to Kjotrod 2004 and Kjotrod 2011, the most frequent side effects associated with metformin were gastrointestinal and included nausea, vomiting, diarrhoea, abdominal discomfort or pain.
1.6 Number of oocytes retrieved per woman
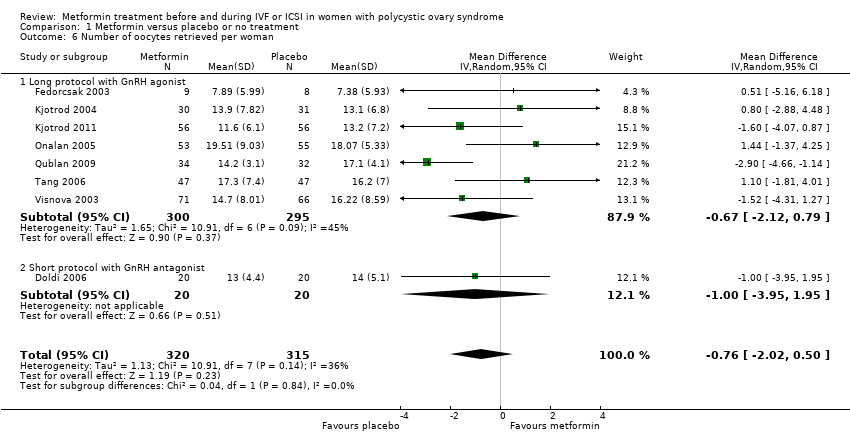
Eight studies were included in this analysis (Doldi 2006; Fedorcsak 2003; Kjotrod 2004; Kjotrod 2011; Onalan 2005; Qublan 2009; Tang 2006; Visnova 2003). The mean number of oocytes retrieved per woman did not differ between the two groups (MD ‐0.76; 95% CI ‐2.02 to 0.50, eight RCTs, 635 women, I2 = 36%) (Analysis 1.6).
These studies were subdivided into two subcategories: those using a long protocol with GnRH‐agonist and those using a short protocol with GnRH‐antagonist. Only Doldi 2006 used the short‐protocol GnRH‐antagonist. There was no difference between the results of the two subcategories, and only one individual trial (Qublan 2009) demonstrated a significant difference in the number of oocytes collected between the two treatment groups, with fewer oocytes collected in the metformin group.
1.7 Total dose of FSH (IU) per woman
Eight studies were included in this analysis (Doldi 2006; Fedorcsak 2003; Kjotrod 2004; Kjotrod 2011; Onalan 2005; Qublan 2009; Tang 2006; Visnova 2003). The data were not pooled due to extreme heterogeneity (I2 = 97%). Most of the heterogeneity seemed to be due to Qublan 2009, and exclusion of this study reduced heterogeneity to I2 = 54%. However we did not identify any clear difference between this study and the others. Six of the eight studies found no evidence of a difference between the two groups.
1.8 Mean number of days of gonadotrophin treatment
Eight studies reported this outcome (Doldi 2006; Fedorcsak 2003; Kjotrod 2004; Kjotrod 2011; Onalan 2005; Qublan 2009; Tang 2006; Visnova 2003). The mean number of days of gonadotrophin treatment did not differ significantly between the groups (MD ‐0.19 days, 95% CI ‐0.77 to 0.40, eight studies, 643 women, I2=56%) (Analysis 1.8). There was statistical heterogeneity in this comparison (I2=56%), which disappeared (I2=0%) when we excluded Qublan 2009, but we could not identify any clear difference between this study and the others.
This outcome was also analysed by subdividing studies into two subcategories: those using a long protocol with GnRH‐agonist and those using a short protocol with GnRH‐antagonist. Fedorcsak 2003, Kjotrod 2004, Kjotrod 2011, Onalan 2005, Qublan 2009, Tang 2006 and Visnova 2003 used the long protocol and there were no statistically significant differences between the groups (MD ‐0.22 days; 95% CI ‐0.89 to 0.45, seven RCTs, 603 women). Doldi 2006 used the short‐protocol GnRH‐antagonist and did not find any evidence of a difference between the groups (MD 0.00 days; 95% CI ‐1.30 to 1.30, 40 women).
1.9 Cycle cancellation rate
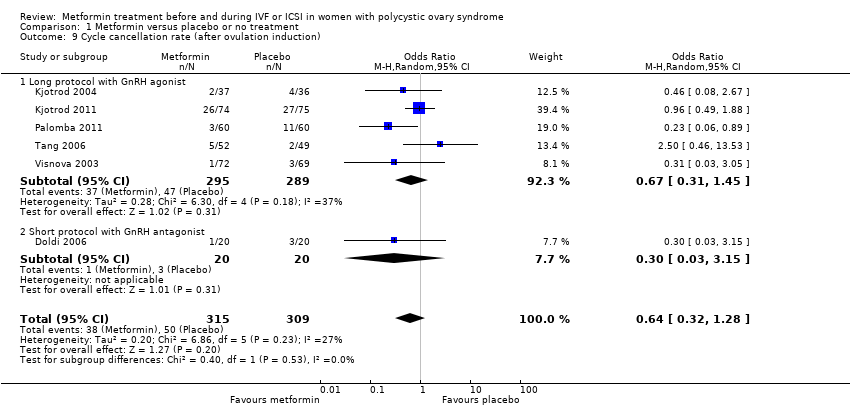
Six studies were included in this analysis (Doldi 2006; Kjotrod 2004; Kjotrod 2011; Palomba 2011; Tang 2006; Visnova 2003). There was no evidence of a difference between the groups in cancellation rates (OR 0.64; 95% CI 0.32 to 1.29, six RCTs, 624 women, I2 = 27%) (Analysis 1.9).
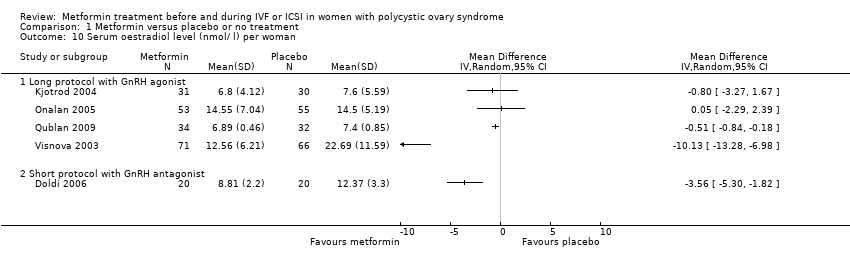
1.10 Serum oestradiol level (on the day of hCG): mean level per woman
Five studies reported this outcome (Doldi 2006; Kjotrod 2004; Onalan 2005; Qublan 2009; Visnova 2003). These studies were not pooled due to very high heterogeneity (I2=91%) which could not be explained. Three of the five studies reported lower serum oestradiol levels in the metformin group, while the other two studies found no evidence of a difference between the groups.
Tang 2006 reported serum oestradiol levels using multiple linear regression analysis. After adjustment for the total FSH dose and the number of follicles, metformin treatment reduced oestradiol concentration on the day of hCG administration (coefficient = ‐35.6, P = 0.048).
1.13 Serum androgen levels (testosterone, SHBG, free‐androgen index)
Onalan 2005 and Tang 2006 reported serum androgens levels on the day of hCG. It was not possible to pool these data because they were reported as median and range by Onalan 2005 and as geometric measures by Tang 2006.
Onalan 2005 found no difference in total testosterone between the metformin group (median 3.1, range 2.5 to 3.9) and the placebo group (median 3.1, range 2.4 to 3.9, p=0.646) and Tang 2006 reported that while testosterone levels did not change in the metformin group (baseline geometric mean: 2.03 nmol/l, geometric mean on the day of hCG administration: 1.97 nmol/l; P = 0.892), the placebo group had an increase in testosterone levels (baseline geometric mean: 2.06 nmol/l, geometric mean on the day of hCG administration: 2.52 nmol/l; P = 0.040). In the metformin group, on the day of hCG administration, there was a decrease in testosterone concentration (geometric mean: 1.96 versus 2.52 nmol/l; P = 0.029) and in the free‐androgen index (geometric mean: 2.43 versus 3.34; P = 0.004). See Analysis 1.11.
1.14 Fasting insulin and glucose levels
Onalan 2005 and Tang 2006 reported fasting insulin and glucose levels on the day of hCG. It was not possible to pool their data because they were reported as glucose/insulin ratio (median and range) by Onalan 2005 and as Quantitative Insulin Sensitivity Check Index (QUICKI) by Tang 2006.
Onalan 2005 found no difference in the glucose/insulin ratio between the metformin group (median 6; range 2.4‐8.8) and the placebo group (median 6; range 3‐10, p=0.81). Tang 2006 found no difference in the insulin sensitivity test results (QUICKI) between baseline and the day of oocyte retrieval in either group (metformin group ‐ baseline: 0.377 and 0.417 at the day of oocyte retrieval (P = 0.2) and placebo group ‐ baseline: 0.386 and 0.400 at the day of oocyte retrieval (P = 0.572)). See Analysis 1.12.
1.15 Fertilisation rate
Only Tang 2006 reported fertilisation rate per oocyte retrieved. Metformin did not improve the overall fertilisation rate (52.9% versus 54.9%, P = 0.641) (Data not shown) (Analysis 1.18).
Other analyses
Sensitivity analyses for the primary outcomes did not substantially influence any of our findings. There were too few studies to compile a funnel plot in order to assess publication bias.
We conducted a post‐hoc sensitivity analysis for our primary outcomes after noting a data discrepancy in one of the studies (Palomba 2011). However, exclusion of this study did not substantially change our findings.
Discussion
Summary of main results
We found no conclusive evidence that the co‐administration of metformin to women with polycystic ovary syndrome (PCOS) undergoing in vitro fertilisation (IVF) or intracytoplasmic sperm injection (ICSI) treatment increases the live birth rates. However there was evidence that metformin increases clinical pregnancy rates and reduces the rate of OHSS. No difference was found between the groups in miscarriage rates. Adverse events such as gastrointestinal problems were only reported by four studies, but were higher in the metformin group.
Metformin co‐treatment appeared to decrease serum oestradiol levels on the day of hCG, but there was no evidence that it had an effect on other ovarian stimulation parameters (total dose of gonadotrophin, number of days of gonadotrophin stimulation, number of oocytes collected and cycle cancellation rate) or embryological outcomes (fertilisation rate).
Metformin reduced the risk of ovarian hyperstimulation syndrome (OHSS) by approximately 63% but increased the risk of side effects three‐fold. Although the reason why metformin reduces the risk of OHSS is not clear, it has been hypothesised that since it decreases hyperinsulinaemia, it could also reduce the production of vascular endothelial growth factor (VEGF), one of the most important factors involved in the pathophysiology of the syndrome. In addition, metformin is associated with a statistically significant effect on oestradiol levels, an important risk factor for OHSS.
Overall completeness and applicability of evidence
The increased number of studies included in this updated version of the review has improved the statistical power of our meta‐analyses. Five of the nine trials performed a priori sample size calculations to assess their primary outcome measures. A total of 816 participants under 40 years of age were included. Eight of the nine included studies met the Rotterdam consensus criteria (ESHRE/ASRM 2003) for the diagnosis of PCOS and excluded other causes of hyperandrogenism. The only study that did not meet the Rotterdam consensus criteria may have included women with other causes for hyperandrogenism that mimic PCOS (such as congenital adrenal hyperplasia, Cushing's syndrome and androgen‐secreting tumours). None of the nine trials reported previous ovarian surgery in their baseline characteristics and three trials did not report the cause of infertility.
Eight of the nine trials included in this review provided data on clinical pregnancy. However, only four trials reported live birth and none reported the rate of healthy take‐home baby, which is considered the most important long‐term outcome of interest to consumers.The primary endpoints of the five trials were either not clearly reported or were related to ovarian response parameters.
Quality of the evidence
See Summary of findings table 1. The table was developed in GRADEpro 2011. The overall quality of the evidence was moderate for the outcomes of clinical pregnancy, OHSS and miscarriage, and low for other outcomes. The main limitations in the evidence were imprecision and inconsistency. We conducted a post‐hoc sensitivity analysis for our primary outcomes after noting a data discrepancy in one of the studies. However, exclusion of this study did not substantially change our findings
Four of the nine included studies were at low risk of bias in all domains. Limitation in the other studies included failure to report details of study methods and lack of blinding. See Figure 2 and Figure 3 for the 'Risk of bias' graph and summary. Heterogeneity was moderate or low for clinical outcomes. Data for two of the laboratory outcomes (FSH dose and serum oestradiol level) were not pooled due to very high levels of unexplained heterogeneity.
Potential biases in the review process
A limitation of this review is the lack of full data from some studies, despite our attempts to obtain missing information from study authors. Whenever possible, we performed analyses based on intention‐to‐treat, to minimise bias. Additionally, since the number of included studies was small, it was not possible to assess the risk of publication bias.
We conducted a through search and are confident that we have included in the review all existing randomised trials which have assessed the use of metformin in PCOS women undergoing ART cycles and which reported clinically relevant outcomes (live birth rate, clinical pregnancy rate and incidence of OHSS).
Agreements and disagreements with other studies or reviews
The results of this updated review are in agreement with other reviews (Costello 2006; Tang 2012).
Study flow diagram.

'Risk of bias' graph: review authors' judgements about each methodological quality item presented as percentages across all included studies.

'Risk of bias' summary: review authors' judgements about each methodological quality item for each included study.

Forest plot of comparison: 1 Metformin versus placebo or no treatment, outcome: 1.1 Live birth rate per woman.

Forest plot of comparison: 1 Metformin versus placebo or no treatment, outcome: 1.2 Clinical pregnancy rate per woman.

Forest plot of comparison: 1 Metformin versus placebo or no treatment, outcome: 1.3 Incidence of OHSS per woman.

Comparison 1 Metformin versus placebo or no treatment, Outcome 1 Live birth rate per woman.
Comparison 1 Metformin versus placebo or no treatment, Outcome 2 Clinical pregnancy rate per woman.
Comparison 1 Metformin versus placebo or no treatment, Outcome 3 Incidence of OHSS per woman.
Comparison 1 Metformin versus placebo or no treatment, Outcome 4 Miscarriage rate per woman.
Comparison 1 Metformin versus placebo or no treatment, Outcome 5 Side effects per woman.
Comparison 1 Metformin versus placebo or no treatment, Outcome 6 Number of oocytes retrieved per woman.

Comparison 1 Metformin versus placebo or no treatment, Outcome 7 Mean total dose of FSH (IU) per woman.

Comparison 1 Metformin versus placebo or no treatment, Outcome 8 Mean days of gonadotrophin per woman.
Comparison 1 Metformin versus placebo or no treatment, Outcome 9 Cycle cancellation rate (after ovulation induction).
Comparison 1 Metformin versus placebo or no treatment, Outcome 10 Serum oestradiol level (nmol/ l) per woman.
| Study | Results | Metformin | Placebo |
| Onalan 2005 | No significant differences in total testosterone measures from women treated with placebo (P = 0.646) | Median 3.1; range 2.5 to 3.9 | Median 3.1; range 2.4 to 3 |
| Tang 2006 | Testosterone levels did not change significantly in the group taking metformin (P = 0.892); however, participants in the placebo group had a significant increase in testosterone levels (P = 0.040). In the metformin group, on the day of hCG administration, there was a significant decrease in testosterone concentration (P = 0.029) and in the free‐androgen index (P = 0.004) | Baseline geometric mean: 2.03 nmol/l, geometric mean on the day of hCG administration: 1.97 nmol/l. Testosterone concentration (geometric mean: 1.96 nmol/l). Free‐androgen index (geometric mean: 2.43) | Baseline geometric mean: 2.06 nmol/l, geometric mean on the day of hCG administration: 2.52 nmol/l. Testosterone concentration (geometric mean: 2.52 nmol/l). Free‐androgen index (geometric mean: 3.34) |
Comparison 1 Metformin versus placebo or no treatment, Outcome 11 Mean or median serum androgen levels per woman.
| Study | Results | Metformin | Placebo |
| Onalan 2005 | There were no significant changes in the glucose/insulin ratio between groups (P = 0.81) | Median 6; range 2.4 to 8.8 | Median 6; range 3 to 10 |
| Tang 2006 | There were no significant changes in the insulin sensitivity test (QUICKI) between baseline and the day of oocyte retrieval in the metformin group (P = 0.200) and the placebo group (P = 0.572). | Baseline: 0.377 At the day of oocyte retrieval: 0.417 | Baseline: 0.386 At the day of oocyte retrieval: 0.400 |
Comparison 1 Metformin versus placebo or no treatment, Outcome 12 Mean or median fasting insulin and glucose levels per woman.
| Metformin treatment before or during IVF or ICSI for women with polycystic ovary syndrome | ||||||
| Population: Women with polycystic ovary syndrome Control: Placebo or no treatment | ||||||
| Outcomes | Illustrative comparative risks* (95% CI) | Relative effect | No of Participants | Quality of the evidence | Comments | |
| Assumed risk | Corresponding risk | |||||
| Placebo or no treatment | Metformin treatment | |||||
| Live birth rate (per woman) ‐ ITT | 320 per 1000 | 395 per 1000 (276 to 530) | OR 1.39 | 551 | ⊕⊕⊝⊝ | |
| Clinical pregnancy rate (per woman) ‐ ITT | 307 per 1000 | 403 per 1000 | OR 1.52 | 775 | ⊕⊕⊕⊝ | |
| Incidence of OHSS | 270 per 1000 | 97 per 1000 | OR 0.29 | 798 | ⊕⊕⊕⊝ | |
| Miscarriage rate (per woman) | 139 per 1000 | 110 per 1000 | OR 0.76 | 521 | ⊕⊕⊕⊝ | |
| Side effects | 106 per 1000 | 347 per 1000 | OR 4.49 | 431 | ⊕⊕⊝⊝ | |
| *The basis for the assumed risk is the median control group risk across studies. The corresponding risk (and its 95% confidence interval) is based on the assumed risk in the comparison group and the relative effect of the intervention (and its 95% CI). | ||||||
| GRADE Working Group grades of evidence | ||||||
| 1 Inconsistency: unexplained heterogeneity (I2 = 52%) 2 Imprecision: total number of events is fewer than 300 3Inconsistency: unexplained heterogeneity (I2 = 57%) 4There was a data discrepancy in one of these studies (Palombo 2011). According to the study publication, in both the metformin group and the placebo group the clinical pregnancy rate was lower than the live birth rate. Sensitivity analyses excluding this study yielded an OR of 1.48 (95% CI 0.72 to 3.02) for live birth and 1.61 (95% CI 1.08 to 2.40) for pregnancy, which did not substantially change our findings. | ||||||
| Outcome or subgroup title | No. of studies | No. of participants | Statistical method | Effect size |
| 1 Live birth rate per woman Show forest plot | 5 | 551 | Odds Ratio (M‐H, Random, 95% CI) | 1.39 [0.81, 2.40] |
| 1.1 Long protocol GnRH agonist | 5 | 551 | Odds Ratio (M‐H, Random, 95% CI) | 1.39 [0.81, 2.40] |
| 2 Clinical pregnancy rate per woman Show forest plot | 8 | 775 | Odds Ratio (M‐H, Random, 95% CI) | 1.52 [1.07, 2.15] |
| 2.1 Long protocol GnRH agonist | 8 | 775 | Odds Ratio (M‐H, Random, 95% CI) | 1.52 [1.07, 2.15] |
| 3 Incidence of OHSS per woman Show forest plot | 8 | 798 | Odds Ratio (M‐H, Random, 95% CI) | 0.29 [0.18, 0.49] |
| 3.1 Long protocol GnRH agonist | 7 | 758 | Odds Ratio (M‐H, Random, 95% CI) | 0.29 [0.16, 0.51] |
| 3.2 Short protocol GnRH antagonist | 1 | 40 | Odds Ratio (M‐H, Random, 95% CI) | 0.30 [0.03, 3.15] |
| 4 Miscarriage rate per woman Show forest plot | 6 | 521 | Odds Ratio (M‐H, Random, 95% CI) | 0.76 [0.43, 1.37] |
| 4.1 Long protocol GnRH agonist | 6 | 521 | Odds Ratio (M‐H, Random, 95% CI) | 0.76 [0.43, 1.37] |
| 5 Side effects per woman Show forest plot | 4 | 431 | Odds Ratio (M‐H, Random, 95% CI) | 4.49 [1.88, 10.72] |
| 5.1 Long protocol GnRH agonist | 4 | 431 | Odds Ratio (M‐H, Random, 95% CI) | 4.49 [1.88, 10.72] |
| 6 Number of oocytes retrieved per woman Show forest plot | 8 | 635 | Mean Difference (IV, Random, 95% CI) | ‐0.76 [‐2.02, 0.50] |
| 6.1 Long protocol with GnRH agonist | 7 | 595 | Mean Difference (IV, Random, 95% CI) | ‐0.67 [‐2.12, 0.79] |
| 6.2 Short protocol with GnRH antagonist | 1 | 40 | Mean Difference (IV, Random, 95% CI) | ‐1.0 [‐3.95, 1.95] |
| 7 Mean total dose of FSH (IU) per woman Show forest plot | 8 | Mean Difference (IV, Random, 95% CI) | Totals not selected | |
| 7.1 Long protocol with GnRH agonist | 7 | Mean Difference (IV, Random, 95% CI) | 0.0 [0.0, 0.0] | |
| 7.2 Short protocol with GnRH antagonist | 1 | Mean Difference (IV, Random, 95% CI) | 0.0 [0.0, 0.0] | |
| 8 Mean days of gonadotrophin per woman Show forest plot | 8 | 643 | Mean Difference (IV, Random, 95% CI) | ‐0.19 [‐0.77, 0.40] |
| 8.1 Long protocol with GnRH agonist | 7 | 603 | Mean Difference (IV, Random, 95% CI) | ‐0.22 [‐0.89, 0.45] |
| 8.2 Short protocol with GnRH antagonist | 1 | 40 | Mean Difference (IV, Random, 95% CI) | 0.0 [‐1.30, 1.30] |
| 9 Cycle cancellation rate (after ovulation induction) Show forest plot | 6 | 624 | Odds Ratio (M‐H, Random, 95% CI) | 0.64 [0.32, 1.28] |
| 9.1 Long protocol with GnRH agonist | 5 | 584 | Odds Ratio (M‐H, Random, 95% CI) | 0.67 [0.31, 1.45] |
| 9.2 Short protocol with GnRH antagonist | 1 | 40 | Odds Ratio (M‐H, Random, 95% CI) | 0.30 [0.03, 3.15] |
| 10 Serum oestradiol level (nmol/ l) per woman Show forest plot | 5 | Mean Difference (IV, Random, 95% CI) | Totals not selected | |
| 10.1 Long protocol with GnRH agonist | 4 | Mean Difference (IV, Random, 95% CI) | 0.0 [0.0, 0.0] | |
| 10.2 Short protocol with GnRH antagonist | 1 | Mean Difference (IV, Random, 95% CI) | 0.0 [0.0, 0.0] | |
| 11 Mean or median serum androgen levels per woman Show forest plot | Other data | No numeric data | ||
| 12 Mean or median fasting insulin and glucose levels per woman Show forest plot | Other data | No numeric data | ||