Intervenciones para el tratamiento de la colitis linfocítica
Información
- DOI:
- https://doi.org/10.1002/14651858.CD006096.pub4Copiar DOI

- Base de datos:
-
- Cochrane Database of Systematic Reviews
- Versión publicada:
-
- 13 julio 2017see what's new
- Tipo:
-
- Intervention
- Etapa:
-
- Review
- Grupo Editorial Cochrane:
-
Grupo Cochrane de Salud digestiva
- Copyright:
-
- Copyright © 2017 The Cochrane Collaboration. Published by John Wiley & Sons, Ltd.
Cifras del artículo
Altmetric:
Citado por:
Autores
Declarations of interest
Nilesh Chande: Dr Chande has received fees for consultancy from AbbVie, Janssen, Takeda, and Ferring, and fees for lectures from AbbVie, Actavis and Janssen. All of these financial activities are outside the submitted work.
Noor Al Yatama: None known
Tania Bhanji: None known
Tran M Nguyen: None known
John WD McDonald: None known
John K MacDonald: None known
Acknowledgements
Partial funding for the Cochrane IBD Group (April 1, 2016 ‐ March 31, 2018) has been provided by Crohn's and Colitis Canada (CCC).
Version history
| Published | Title | Stage | Authors | Version |
| 2017 Jul 13 | Interventions for treating lymphocytic colitis | Review | Nilesh Chande, Noor Al Yatama, Tania Bhanji, Tran M Nguyen, John WD McDonald, John K MacDonald | |
| 2008 Apr 23 | Interventions for treating lymphocytic colitis | Review | Nilesh Chande, John WD McDonald, John K MacDonald | |
| 2007 Jan 24 | Interventions for treating lymphocytic colitis | Review | Nilesh Chande, John WD McDonald, John K MacDonald | |
| 2006 Jul 19 | Interventions for treating lymphocytic colitis | Protocol | Nilesh Chande, John WD McDonald, John K MacDonald | |
Keywords
MeSH
Medical Subject Headings (MeSH) Keywords
- Anti‐Inflammatory Agents [therapeutic use];
- Antidiarrheals [*therapeutic use];
- Beclomethasone [therapeutic use];
- Bismuth [therapeutic use];
- Budesonide [therapeutic use];
- Cholestyramine Resin [therapeutic use];
- Colitis, Lymphocytic [*drug therapy];
- Mesalamine [therapeutic use];
- Organometallic Compounds [*therapeutic use];
- Randomized Controlled Trials as Topic;
- Salicylates [therapeutic use];
Medical Subject Headings Check Words
Humans;
PICO

Study flow diagram.

Risk of bias summary: review authors' judgements about each risk of bias item for each included study.
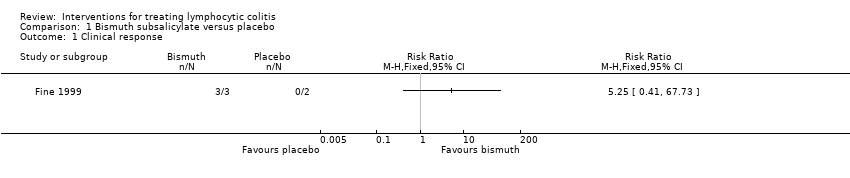
Comparison 1 Bismuth subsalicylate versus placebo, Outcome 1 Clinical response.

Comparison 1 Bismuth subsalicylate versus placebo, Outcome 2 Histological response.

Comparison 2 Budesonide versus placebo, Outcome 1 Clinical response.

Comparison 2 Budesonide versus placebo, Outcome 2 Histological response.
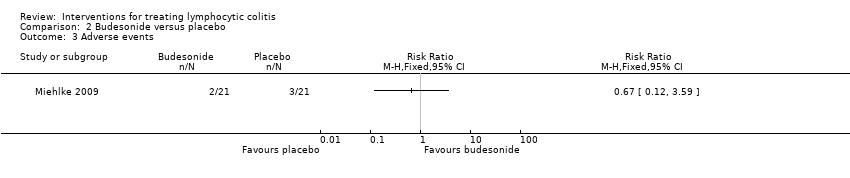
Comparison 2 Budesonide versus placebo, Outcome 3 Adverse events.

Comparison 3 Mesalazine versus mesalazine + cholestyramine, Outcome 1 Clinical response.
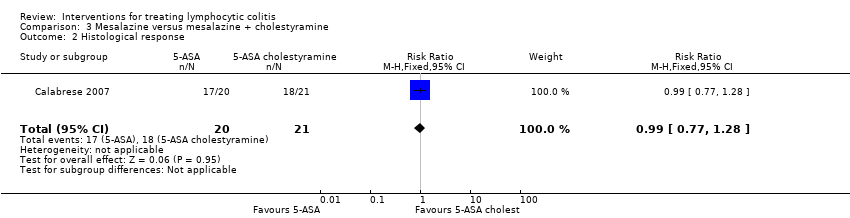
Comparison 3 Mesalazine versus mesalazine + cholestyramine, Outcome 2 Histological response.
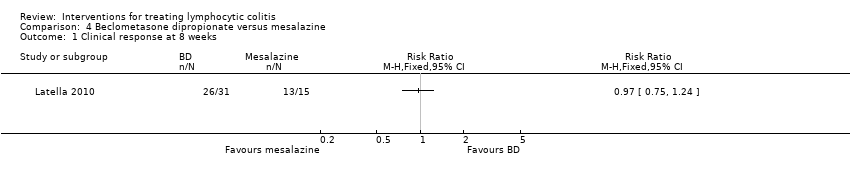
Comparison 4 Beclometasone dipropionate versus mesalazine, Outcome 1 Clinical response at 8 weeks.

Comparison 4 Beclometasone dipropionate versus mesalazine, Outcome 2 Maintenance of clinical response at 12 months.
| Bismuth subsalicylate versus placebo for treating lymphocytic colitis | ||||||
| Patient or population: patients with active lymphocytic colitis | ||||||
| Outcomes | Illustrative comparative risks* (95% CI) | Relative effect | No of Participants | Quality of the evidence | Comments | |
| Assumed risk | Corresponding risk | |||||
| control | bismuth vs placebo | |||||
| Clinical response | 0 per 10001 | 0 per 1000 | RR 5.25 | 5 | ⊕⊝⊝⊝ | |
| Histological response | 500 per 10001 | 665 per 1000 (135 to 3300) | RR 1.33 (0.27 to 6.6) | 5 (1 study) | ⊕⊝⊝⊝ | |
| *The basis for the assumed risk (e.g. the median control group risk across studies) is provided in footnotes. The corresponding risk (and its 95% confidence interval) is based on the assumed risk in the comparison group and the relative effect of the intervention (and its 95% CI). | ||||||
| GRADE Working Group grades of evidence | ||||||
| 1 Control group risk estimates come from control arm of meta‐analysis, based on included trials. | ||||||
| Budesonide versus mesalazine for treating lymphocytic colitis | ||||||
| Patient or population: patients with active lymphocytic colitis | ||||||
| Outcomes | Illustrative comparative risks* (95% CI) | Relative effect | No of Participants | Quality of the evidence | Comments | |
| Assumed risk | Corresponding risk | |||||
| control | budesonide versus placebo | |||||
| Clinical response | 440 per 10001 | 893 per 1000 | RR 2.03 | 57 | ⊕⊕⊝⊝ low2,3 | |
| Histological response | 313 per 10001 | 763 per 1000 | RR 2.44 (1.13 to 5.28) | 39 | ⊕⊕⊝⊝ low4 | |
| Adverse events | 143 per 10001 | 96 per 1000 (17 to 513) | RR 0.67 (0.12 to 3.59) | 42 | ⊕⊕⊝⊝ low5 | |
| *The basis for the assumed risk (e.g. the median control group risk across studies) is provided in footnotes. The corresponding risk (and its 95% confidence interval) is based on the assumed risk in the comparison group and the relative effect of the intervention (and its 95% CI). | ||||||
| GRADE Working Group grades of evidence | ||||||
| 1 Control group risk estimates come from control arm of meta‐analysis, based on included trials. | ||||||
| Mesalazine versus mesalazine + cholestyramine for treating lymphocytic colitis | ||||||
| Patient or population: patients with maintenance of remission in lymphocytic colitis | ||||||
| Outcomes | Illustrative comparative risks* (95% CI) | Relative effect | No of Participants | Quality of the evidence | Comments | |
| Assumed risk | Corresponding risk | |||||
| mesalazine | mesalazine plus cholestyramine | |||||
| Clinical response | 857 per 1000 | 849 per 1000 (660 to 1000) | RR 0.99 | 41 | ⊕⊕⊝⊝ | |
| Histological response | 857 per 1000 | 849 of 1000 (660 to 1000) | RR 0.99 | 41 | ⊕⊕⊝⊝ | |
| *The basis for the assumed risk (e.g. the median control group risk across studies) is provided in footnotes. The corresponding risk (and its 95% confidence interval) is based on the assumed risk in the comparison group and the relative effect of the intervention (and its 95% CI). | ||||||
| GRADE Working Group grades of evidence | ||||||
| 1 Control group risk estimates come from control arm of meta‐analysis, based on included trials. | ||||||
| Beclometasone dipropionate versus mesalazine for treating lymphocytic colitis | ||||||
| Patient or population: Patients with active or quiescent lymphocytic colitis | ||||||
| Outcomes | Illustrative comparative risks* (95% CI) | Relative effect | No of Participants | Quality of the evidence | Comments | |
| Assumed risk | Corresponding risk | |||||
| Mesalazine | beclometasone | |||||
| Clinical response at 8 weeks | 867 per 10001 | 841 per 1000 (650 to 1075) | RR 0.97 (0.75 to 1.24) | 46 | ⊕⊕⊝⊝ low2,3 | |
| Maintenance of clinical response at 12 weeks | 200 of 10001 | 258 per 1000 (80 to 836) | RR 1.29 (0.40 to 4.18) | 46 | ⊕⊝⊝⊝ very low2,4 | |
| *The basis for the assumed risk (e.g. the median control group risk across studies) is provided in footnotes. The corresponding risk (and its 95% confidence interval) is based on the assumed risk in the comparison group and the relative effect of the intervention (and its 95% CI). | ||||||
| GRADE Working Group grades of evidence | ||||||
| 1 Control group risk estimates come from control arm of meta‐analysis, based on included trials. | ||||||
| Outcome or subgroup title | No. of studies | No. of participants | Statistical method | Effect size |
| 1 Clinical response Show forest plot | 1 | Risk Ratio (M‐H, Fixed, 95% CI) | Totals not selected | |
| 2 Histological response Show forest plot | 1 | Risk Ratio (M‐H, Fixed, 95% CI) | Totals not selected | |
| Outcome or subgroup title | No. of studies | No. of participants | Statistical method | Effect size |
| 1 Clinical response Show forest plot | 2 | 57 | Risk Ratio (M‐H, Fixed, 95% CI) | 2.03 [1.25, 3.33] |
| 2 Histological response Show forest plot | 2 | 39 | Risk Ratio (M‐H, Fixed, 95% CI) | 2.44 [1.13, 5.28] |
| 3 Adverse events Show forest plot | 1 | Risk Ratio (M‐H, Fixed, 95% CI) | Totals not selected | |
| Outcome or subgroup title | No. of studies | No. of participants | Statistical method | Effect size |
| 1 Clinical response Show forest plot | 1 | Risk Ratio (M‐H, Fixed, 95% CI) | Totals not selected | |
| 2 Histological response Show forest plot | 1 | 41 | Risk Ratio (M‐H, Fixed, 95% CI) | 0.99 [0.77, 1.28] |
| Outcome or subgroup title | No. of studies | No. of participants | Statistical method | Effect size |
| 1 Clinical response at 8 weeks Show forest plot | 1 | Risk Ratio (M‐H, Fixed, 95% CI) | Totals not selected | |
| 2 Maintenance of clinical response at 12 months Show forest plot | 1 | Risk Ratio (M‐H, Fixed, 95% CI) | Totals not selected | |