فشار فوندال در مرحله دوم زایمان
چکیده
پیشینه
فشار فوندال (fundal pressure) در طول دومین مرحله از زایمان که با عنوان مانور کریستلر (kristeller manoeuvre) نیز شناخته میشود؛ عبارت است از استفاده از فشار دستی از بالاترین ناحیه رحم به سمت کانال زایمان با هدف کمک به زایمان واژینال خودبهخودی و پیشگیری از طولانیشدن دومین مرحله از زایمان یا نیاز به زایمان از طریق جراحی. فشار فوندال با استفاده از کمربند باد شونده (inflatable belt) نیز اعمال شده است. فشار فوندال بهطور گستردهای مورد استفاده قرار میگیرد، با این حال روشهای استفاده از آن بهطور گستردهای متنوع هستند. علیرغم وجود نظرات قاطعانه در تایید یا رد استفاده از فشار فوندال، شواهد موجود درباره مزایا و آسیبهای ناشی از این فشار به مادر باردار و نوزاد، محدود هستند. نیاز است تا اثربخشی و ایمنی فشار فوندال در مرحله دوم زایمان به صورت هدفمند ارزیابی شود.
اهداف
تعیین اثربخشی فشار فوندال در فراهم کردن زایمان واژینال خودبهخودی، و پیشگیری از طولانی شدن مرحله دوم زایمان یا نیاز به زایمان بر پایه جراحی، و بررسی عوارض جانبی فشار فوندال روی مادر باردار و نوزاد.
روشهای جستوجو
ما پایگاه ثبت کارآزماییهای گروه بارداری و زایمان در کاکرین و فهرست منابع مطالعات بازیابی شده را جستوجو کردیم (30 نوامبر 2016).
معیارهای انتخاب
کارآزماییهای تصادفیسازی و شبه‐تصادفیسازی و کنترل شده درباره فشار فوندال (به صورت دستی یا با استفاده از کمربند باد شونده) در برابر عدم استفاده از فشار فوندال، در زنان با وضعیت تکقلویی سفالیک (singleton cephalic presentation) در مرحله دوم زایمان.
گردآوری و تجزیهوتحلیل دادهها
دو یا چند نویسنده مرور بهطور مستقل از هم به ارزیابی مطالعات بالقوه برای ورود آنها به مرور و ارزیابی کیفیت آنها پرداختند. با استفاده از یک فرم از پیش تعیین شده، دادهها را استخراج کردیم. دادهها را در نرمافزار Review Manager 5 وارد کرده و دقت آنها را بررسی کردیم.
نتایج اصلی
نه کارآزمایی وارد این مرور بهروز شدند. پنج کارآزمایی (شامل 3057 زن) فشار فوندال دستی را در برابر عدم استفاده از فشار مقایسه کرده بودند. چهار کارآزمایی (شامل 891 زن) فشار فوندال با استفاده از یک کمربند باد شونده را در برابر عدم اعمال فشار مقایسه کرده بودند. کورسازی زنان و پرسنل نسبت به این مداخله امکانپذیر نبود. ما دو کارآزمایی را از نظر سوگیری ریزش نمونه (attrition bias) دارای خطر بالا و دیگری را از نظر سوگیری گزارشدهی دارای خطر بالا ارزیابی کردیم. خطر حوزههای سوگیری دیگر در سایر کارآزماییها، نامشخص یا پائین بود. اکثر کارآزماییها به لحاظ طرح مطالعه دارای محدودیت بودند. ناهمگونی در مورد اکثر پیامدها بالا بود.
فشار فوندال دستی در برابر عدم استفاده از فشار فوندال
میان فشار فوندال دستی با تغییر در این موارد هیچ رابطهای وجود نداشت: زایمان واژینال غیر‐ارادی درون یک محدوده زمانی مشخص (خطر نسبی (RR): 0.96؛ 95% فاصله اطمینان (CI): 0.71 تا 1.28؛ 120 زن؛ 1 کارآزمایی؛ شواهد با کیفیت بسیار پائین)، زایمان با ابزار کمکی (RR: 3.28؛ 95% CI؛ 0.14 تا 79.65؛ 197 زن؛ 1 کارآزمایی)، زایمان سزارین (RR: 10.1؛ 95% CI؛ 0.07 تا 17.27؛ 197 زن؛ 1 کارآزمایی)، زایمان از طریق جراحی (میانگین RR؛ 0.66؛ 95% CI؛ 0.12 تا 3.55؛ 317 زن؛ 2 مطالعه؛ I² = 43%؛ Tau² = 0.71؛ شواهد با کیفیت بسیار پائین)، طول مدت مرحله دوم زایمان (تفاوت میانگین (MD): 0.80‐ دقیقه؛ 95% CI؛ 3.66‐ تا 2.06 دقیقه؛ 194 زن؛ 1 مطالعه؛ شواهد با کیفیت بسیار پائین)، پائین بودن pH طناب شریانی در نوزادان تازه متولد شده (RR: 1.07؛ 95% CI؛ 0.72 تا 1.58؛ 297 زن؛ 2 کارآزمایی؛ شواهد با کیفیت بسیار پائین)، یا نمرات آپگار پنج دقیقهای کمتر از هفت (میانگین RR؛ 4.48؛ 95% CI؛ 0.28 تا 71.45؛ 2759 نوزاد؛ 4 کارآزمایی؛ I² = 89%؛ Tau² = 3.55؛ شواهد با کیفیت بسیار پائین). بیشتر زنانی که فشار فوندال دستی دریافت کرده بودند، نسبت به زنان گروه کنترل دچار پارگیهای دهانه رحم بودند (RR: 4.90؛ 95% CI؛ 1.09 تا 21.98؛ 295 زن؛ 1 کارآزمایی). هیچ موردی از مرگومیرهای نوزادی در هیچ یک از دو مطالعهای که این پیامد را گزارش داده بودند، اتفاق نیفتاد (شواهد با کیفیت بسیار پائین). هیچ کارآزمایی پیامد مرگومیر یا موربیدیتی شدید مادر را گزارش نکرده بود.
فشار فوندال با استفاده از کمربند باد شونده در برابر عدم استفاده از فشار فوندال
فشار فوندال با استفاده از کمربند باد شونده، تعداد زنانی را که زایمان با ابزار کمکی (میانگین RR؛ 0.73؛ 95% CI؛ 0.52 تا 1.02؛ 891 زن؛ 4 کارآزمایی؛ I² = 52%؛ Tau² = 0.05)، یا زایمان از طریق جراحی (میانگین RR؛ 0.62؛ 95% CI؛ 0.38 تا 1.01؛ 891 زن؛ 4 کارآزمایی؛ I² = 78%؛ Tau² = 0.14؛ شواهد با کیفیت بسیار پائین) داشتند، کاهش نداده بود. ناهمگونی برای هر دو پیامد بالا بود. طول مدت مرحله دوم زایمان در دو کارآزمایی گزارش شده بود، که حاکی از کاهش طول مدت زمان زایمان در زنانی بود که تا پیش از این فرزندی نداشتهاند (nulliparous women)؛ (میانگین MD؛ 50.80‐ دقیقه؛ 95% CI؛ 94.85‐ تا 6.74‐ دقیقه؛ 253 زن؛ 2 کارآزمایی؛ I² = 97%؛ Tau² = 975.94؛ شواهد با کیفیت بسیار پائین). هیچ دادهای درباره این پیامد برای زنانی که پیشتر چندین فرزند به دنیا آورده بودند (multiparous women)، در دسترس نبود. استفاده از کمربند باد شونده هیچ تفاوتی در نرخهای زایمان سزارین (میانگین RR؛ 0.56؛ 95% CI؛ 0.14 تا 2.26؛ 891 زن؛ 4 کارآزمایی؛ I² = 70%؛ Tau² = 0.98)، پائین بودن pH طناب شریانی در نوزادان تازه متولد شده (RR: 0.47؛ 95% CI؛ 0.09 تا 2.55؛ 461 نوزاد؛ 1 کارآزمایی؛ شواهد با کیفیت پائین)، یا نمرات آپگار پنج دقیقهای کمتر از هفت (RR: 4.62؛ 95% CI؛ 0.22 تا 95.68؛ 500 نوزاد؛ 1 کارآزمایی؛ شواهد با کیفیت بسیار پائین) به دست نداد. پارگی درجه سوم پرینه (third degree perineal tears) در گروه استفاده کننده از کمربند باد شونده افزایش یافته بود (RR: 15.69؛ 95% CI؛ 2.10 تا 117.02؛ 500 زن؛ 1 کارآزمایی). زایمان واژینال خودبهخودی درون یک محدوده زمانی مشخص،مرگومیر نوزاد وموربیدیتی شدید مادر یا مرگومیر در هیچ یک از کارآزماییها گزارش نشده بود.
نتیجهگیریهای نویسندگان
شواهد کافی برای نتیجهگیری درباره تاثیرات مفید و مضر فشار فوندال، به صورت دستی یا با استفاده از کمربند باد شونده، در دسترس نیست. فشار فوندال با استفاده از کمربند باد شونده در طول مرحله دوم زایمان ممکن است طول مدت زمان این مرحله از زایمان را برای زنانی که پیشتر فرزندی به دنیا نیاوردهاند، کوتاه کرده و نرخهای زایمان بر پایه جراحی را کمتر کند. با وجود این، مطالعات موجود محدود بوده و تعمیمپذیری آنها نامطمئن است. شواهد موجود درباره ایمنی این روش برای نوزاد کافی نیست. هیچ شواهدی درباره استفاده از فشار فوندال در وضعیتهای بالینی خاص از جمله ناتوانی مادر برای زور زدن به سمت پائین (bear down) در اثر خستگی (exhaustion) یا عدم هوشیاری (unconsciousness) وجود ندارد. در حال حاضر شواهد کافی برای استفاده روتین از فشار فوندال با بهرهگیری از روشهای مختلف روی زنان در مرحله دوم زایمان وجود ندارد. به دلیل استفاده فراگیر از این پروسیجر در حال حاضر و استفاده بالقوه آن در شرایطی که سایر روشهای کمکزایمانی در دسترس نیستند، به کارآزماییهای بیشتر با کیفیت خوب نیاز است. ارزیابیهای بیشتری در سایر گروههای زنان (از جمله زنانی که پیشتر چندین فرزند به دنیا آوردهاند) مورد نیاز خواهد بود. بهتر است پژوهشهای آتی چگونگی استفاده از فشار فوندال را با جزئیات توصیف کرده و ایمنی نوزاد متولد نشده، پیامدهای پرینه، پیامدهای طولانی‐مدت مربوط به مادر و نوزاد و رضایتمندی مادر را بررسی کنند.
PICO
خلاصه به زبان ساده
فشار فوندال در طول مرحله دوم زایمان برای بهبود پیامدهای مربوط به مادر و جنین
موضوع چیست؟
مرحله دوم زایمان، مرحله فشار (pushing stage) نامیده میشود، از زمانی که سرویکس (cervix) متسع شده (تا 10 سانتیمتر) تا زمانی که نوزاد به دنیا میآید. هر یک از عوامل دیسترس جنینی، عدم پیشرفت در فرآیند زایمان، خستگی مادر یا یک وضعیت پزشکی که در آن طولانی شدن فشار خطرناک تلقی میشود، میتوانند این مرحله را پیچیده کنند. استفاده از فشار فوندال (fundal pressure) به واسطه ایجاد فشار روی شکم مادر در راستای کانال زایمان اغلب برای کمک به زایمان واژینال خودبهخودی، کوتاه کردن طول مدت مرحله دوم زایمان و کاهش نیاز به زایمان با ابزار کمکی (فورسپس (forceps) یا زایمان به کمک وکیوم (vacuum‐assisted)) یا زایمان سزارین مورد استفاده قرار میگیرد. این مورد به ویژه در محیطهای مرتبط با سطح دسترسی پائین به منابع، جایی که گزینههای مربوط به زایمان بر پایه جراحی محدود بوده یا در دسترس نیستند، قابل توجه است. فشار دستی میتواند در زمانهایی که زن دچار انقباض (contraction) میشود، اعمال شود. به همین ترتیب، یک کمربند باد شونده (inflatable belt) میتواند پوشانده شود که برای ایجاد فشار در طول مدت انقباض متورم میشود.
این مرور با هدف پاسخ به این سوال به اجرا درآمد که فشار فوندال در طول مدت انقباضها در مرحله دوم زایمان به زنان در زایمان واژینال کمک میکند یا خیر، و اینکه این روش عواقب منفی برای زن یا نوزاد متولد نشده او به همراه دارد یا خیر.
چرا این موضوع مهم است؟
یک زایمان طولانی میتواند در برخی مواقع برای بعضی از زنان و نوزادان آنها خطرناک باشد. برخی مواقع نوزاد متولد نشده و زن میتوانند در طول فرآیند لیبر و زایمان دچار خستگی شوند. در بسیاری از کشورها، متخصصین آموزش دیدهای وجود دارد که میتوانند با استفاده از ونتوس (ventouse)، فورسپس (forceps) یا زایمان سزارین به آنها کمک کنند. با وجود این در سایر کشورها، این منابع اغلب وجود نداشته، و زایمانهای طولانی میتوانند زندگی مادر و نوزاد را تهدید کنند. فشار فوندال ممکن است به زن در زایمان نوزاد کمک کند. این روش همچنین ممکن است احتمال بروز عوارض جانبی را برای نوزاد و مادر افزایش دهد. دانش زیادی درباره این موضوع وجود ندارد، و کسب شناخت از چگونگی اثرگذاری این تکنیکها روی زنان و نوزادانشان مهم است.
ما چه شواهدی به دست آوردیم؟
این نسخه بهروز شده از مرور کاکرین، نه کارآزمایی تصادفیسازی و کنترل شده را شامل 3948 زن (تاریخ جستوجو: 30 نوامبر 2016) شناسایی کرد. پنج مطالعه (شامل 3057 زن) فشار فوندال را در برابر عدم اعمال فشار فوندال، و چهار مطالعه (شامل 891 زن) فشار فوندال با استفاده از یک کمربند باد شونده را مورد بررسی قرار دادند.
ما هیچ شواهدی مبنی بر اینکه فشار فوندال دستی منجر به ایجاد تفاوت در تعداد زنانی شده که به صورت واژینال درون محدوده زمانی مشخص (شواهد با کیفیت بسیار پائین)، یا با ابزار کمکی، زایمان سزارین یا به صورت واژینال (شواهد با کیفیت بسیار پائین) زایمان کردهاند، به دست نیاوردیم. مدت زمانی که زنان برای زایمان در مرحله فشار صرف کرده بودند، تحت تاثیر فشار فوندال دستی قرار نداشت (شواهد با کیفیت بسیار پائین). تعداد نوزادانی که به خوبی در برابر فرآیند زایمان تاب نیاورده و pH طناب شریانی ، یا نمرات آپگار آنها کاهش یافته بود نیز وضعیت مشابهی داشتند، چه اینکه مادر آنها از فشار فوندال استفاده کرده یا نکرده باشد (تماما شواهد با کیفیت بسیار پائین). هیچ کودکی در هیچ یک از گروهها فوت نکرده بود. مطالعات، مشکلات جدی احتمالی یا مرگومیر زنان را گزارش نکرده بود.
برای زنانی که برای اولین بار زایمان میکنند، فشار فوندال با استفاده از کمربند باد شونده میتواند احتمالا به این معنا باشد که تعداد زنان کمتری زایمان را با ابزار کمکی یا سزارین تجربه کردند (شواهد با کیفیت بسیار پائین)، اما شواهد بارز نبود. در این زنان، کمربند باد شونده به این معنا بود که آنها نسبت به زنانی که مرحله فشار را بدون کمک این کمربند سپری کرده بودند، برای مدت زمان کمتری به سمت پائین زور زده بودند (شواهد با کیفیت بسیار پائین). استفاده از کمربند باد شونده هیچ تفاوتی در تعداد زنانی که زایمان سزارین داشتند، نوزادانی که pH طناب شریانی آنها پائین بود (شواهد با کیفیت پائین)، یا نمرات آپگار پنج دقیقهای کمتر از هفت بعد از زایمان (شواهد با کیفیت بسیار پائین) ایجاد نکرده بود. هیچ مطالعهای زایمان درون یک محدوده زمانی مشخص، تعداد نوزادان مرده یا بروز مشکلات جدی احتمالی یا مرگومیر زنان را گزارش نکرده بود. هیچ مطالعهای از کمربندهای باد شونده در زنانی که پیشتر تجربه زایمان داشتند، استفاده نکرده بودند.
این یافتهها چه معنایی دارند؟
شواهد کافی از کارآزماییهای تصادفیسازی و کنترل شده وجود ندارد که نشان دهد فشار فوندال دستی، یا فشار فوندال اعمال شده با کمک کمربند باد شونده، روشهای اثربخشی برای کوتاه کردن مرحله فشار از فرآیند زایمان و پیشگیری از زایمانهای بر پایه جراحی بوده و اینکه این تکنیکها ایمن هستند یا خیر. بنابراین در حال حاضر شواهد کافی برای حمایت از استفاده از فشار فوندال به هر روشی در مرحله دوم از فرآیند زایمان وجود ندارد.
مطالعات آتی بهتر است از کیفیت بالایی برخوردار بوده و به طور واضح چگونگی کاربست فشار فوندال را توصیف کرده و روی ایمنی نوزاد متولد نشده، پیامدهای پرینه، پیامدهای طولانی‐مدت مادر و رضایتمندی مادر تمرکز کنند.
Authors' conclusions
Summary of findings
| Manual fundal pressure compared to no fundal pressure for the second stage of labour | ||||||
| Patient or population: women with singleton pregnancy in vertex position in second stage of labour | ||||||
| Outcomes | Anticipated absolute effects* (95% CI) | Relative effect | № of participants | Quality of the evidence | Comments | |
| Risk with no fundal pressure | Risk with manual fundal pressure | |||||
| No spontaneous vaginal birth within a specified time, as defined by the trial authors | Study population | RR 0.96 | 120 | ⊕⊝⊝⊝ | Reported as "Time from bearing down to birth of head =/>30 min or operative delivery". Data may contain instrumental births and should be interpreted with due caution | |
| 613 per 1000 | 588 per 1000 | |||||
| Operative birth ‐ Instrumental or caesarean birth | Study population | Average RR 0.66 (0.12 to 3.55) | 317 (2 RCTs) | ⊕⊝⊝⊝ | ||
| 61 per 1000 | 33 per 1000 (12 to 92) | |||||
| Low arterial cord pH | Study population | RR 1.07 | 297 | ⊕⊝⊝⊝ | ||
| 172 per 1000 | 184 per 1000 | |||||
| APGAR score less than 7 at 5 minutes | Study population | Average RR 4.48 | 2759 | ⊕⊝⊝⊝ | ||
| 5 per 1000 | 23 per 1000 | |||||
| Duration of active second stage | No absolute effects Mean duration of labour 16.6 minutes | No absolute effects Mean duration of labour 17.4 minutes | The mean duration of second stage was 0.8 minutes shorter in the fundal pressure group (3.66 minutes shorter to 2.06 minutes longer) | 194 | ⊕⊝⊝⊝ | |
| Severe maternal morbidity or death | Study population | ‐ | (0 study) | ‐ | No trial reported this outcome | |
| See comment | See comment | |||||
| Neonatal death | Study population | ‐ | 2445 | ⊕⊝⊝⊝ | Zero neonatal deaths reported in both trials | |
| See comment | See comment | |||||
| *The risk in the intervention group (and its 95% confidence interval) is based on the assumed risk in the comparison group and the relative effect of the intervention (and its 95% CI). | ||||||
| GRADE Working Group grades of evidence | ||||||
| 1 Wide confidence interval crossing the line of no effect, few events and small sample size (‐2). | ||||||
| Fundal pressure by inflatable belt compared to no fundal pressure for second stage of labour | ||||||
| Patient or population: women with singleton pregnancy in vertex position in second stage of labour | ||||||
| Outcomes | Anticipated absolute effects* (95% CI) | Relative effect | № of participants | Quality of the evidence | Comments | |
| Risk with no fundal pressure | Risk with fundal pressure by inflatable belt | |||||
| No spontaneous vaginal birth within a specified time | Study population | ‐ | (0 study) | ‐ | No trial reported this outcome | |
| See comment | See comment | |||||
| Operative birth ‐ instrumental or caesarean section | Study population | Average RR 0.62 | 891 | ⊕⊝⊝⊝ | ||
| 516 per 1000 | 320 per 1000 | |||||
| Low arterial cord pH | Study population | RR 0.47 | 461 | ⊕⊕⊝⊝ | ||
| 18 per 1000 | 8 per 1000 | |||||
| Apgar score less than 7 after 5 minutes | Study population | RR 4.62 | 500 | ⊕⊝⊝⊝ | ||
| 0 per 1000 | 0 per 1000 | |||||
| Duration of second stage (minutes) | No absolute effects | No absolute effects | The average mean duration of second stage was 50.8 minutes shorter in the inflatable belt group (94.85 minutes shorter to 6.74 minutes shorter) | 253 (2 RCTs) | ⊕⊝⊝⊝ | Acanfora 2013: mean duration of second stage was 73.47 minutes shorter for women in the inflatable belt group (86.40 minutes shorter to 60.54 minutes shorter) Kim 2013: mean duration of second stage was 28.51 minutes shorter for women in the inflatable belt group (38.50 minutes shorter to 18.52 minutes shorter) |
| Severe maternal morbidity and death | Study population | ‐ | (0 study) | ‐ | No trial reported these outcomes | |
| See comment | See comment | |||||
| Neonatal death | Study population | ‐ | (0 study) | ‐ | No trial reported this outcome | |
| See comment | See comment | |||||
| *The risk in the intervention group (and its 95% confidence interval) is based on the assumed risk in the comparison group and the relative effect of the intervention (and its 95% CI). | ||||||
| GRADE Working Group grades of evidence | ||||||
| 1 Most studies contributing data had design limitations (‐1). | ||||||
Background
Description of the condition
The second stage of labour is defined as the period of time from full dilation of the cervix until complete expulsion of the baby (NICE 2016). This includes the time when the mother bears down to give birth. The duration of second stage is generally longer in nulliparous women than multiparous women, however a prolonged second stage (whether due to maternal or fetal factors) can require urgent intervention to improve perinatal outcome.
The purpose of fundal pressure is to shorten the second stage of labour. The clinical indications for this manoeuvre can be fetal distress, failure to progress in the second stage of labour and/or maternal exhaustion or medical conditions whereby (prolonged) pushing is contraindicated, for example, maternal heart disease (Cosner 1996; Simpson 2001).
Description of the intervention
Fundal pressure during the second stage of labour is a controversial manoeuvre. The obstetric technique involves application of manual pressure to the uppermost part of the uterus directed towards the birth canal in an attempt to shorten the second stage (Kline‐Kaye 1990). In research settings, fundal pressure has also been applied using an inflatable belt.
The practice varies greatly between countries. Manual fundal pressure is frequently used in settings where other interventions, like instrumental deliveries, are not readily available, or cannot be performed because of professional staff shortage. While in many low‐ and middle‐income countries the manoeuvre appears to be routine practice during vaginal births (Goldman 2003; Miller 2003), in some, mainly English‐speaking, Western countries, it is seen as an obsolete procedure (Alran 2002; Buhimschi 2002). In the USA and the UK for example, this may be because of the intense medico‐legal climate in those countries, and the complications supposedly arising from the manoeuvre, as described below. These factors may also contribute to under‐reporting. A postpartum follow‐up survey in the USA in 2005 found that 17% of the respondents had experienced fundal pressure during the second stage of their birth (Declercq 2006). In 4% of all vaginal births between 1994 and 1995 in the Netherlands, fundal pressure was recorded (De Leeuw 2001). A study in Austria found the manoeuvre being practiced in up to 23% of vaginal births in the university hospital (Schulz‐Lobmeyr 1999). In a Swedish study, fundal pressure was used in 11% of vacuum‐assisted births (Ahlberg 2016). In a Japanese survey, all responding institutions reported using fundal pressure in accordance with the Japan Academy of Midwifery 2012 Evidence‐Based Guidelines for Midwifery Care (Baba 2016). A United Nations Population Fund study of childbirth practices and experiences in rural central Bangladesh found the use of fundal pressure and tight abdominal bands to be prevalent (Goodburn 1995). A Brazilian survey found that fundal pressure was used more frequently in labours attended by physicians than those attended by nurse‐midwives (Gama 2016).
How the intervention might work
There is little evidence to demonstrate that the use of fundal pressure is effective in shortening the second stage. A study in the US examining intrauterine pressure found that fundal pressure during the contraction increased the expulsive force on average by 28%. The authors go on to suggest that fundal pressure may reduce the risks associated with either a prolonged second stage or the resulting operative procedures (Buhimschi 2002). However, an observational study found the second stage to be longer in those cases where fundal pressure was used (Cosner 1996). This may reflect selection bias rather than failure of the procedure, as fundal pressure would tend to be used in the more difficult deliveries.
More relevant than the effect of fundal pressure on length of second stage is its effect on maternal and neonatal outcomes. Several reports suggest that fundal pressure is associated with maternal and neonatal complications, for example, uterine rupture (Pan 2002; Sturzenegger 2016; Vangeenderhuysen 2002), neonatal fractures and brain damage (Amiel‐Tyson 1988). An increased risk of anal sphincter damage has been reported (Cosner 1996; De Leeuw 2001; Zetterstrom 1999). Confounding factors, including birthweight, length of second stage, and malpresentation, which could have influenced the birth attendant's decision to perform fundal pressure, are not corrected for in these observational studies. On the other hand, if fundal pressure could prevent instrumental birth, the risk of a third‐degree tear as a result of the instrument used would also be decreased.
Another concern is that fundal pressure might increase feto‐maternal or maternal‐fetal transfusion. No evidence has been found of increased transfusion of blood from mother to baby during external cephalic version, which also involves manual pressure on the uterus (Holmes 2004). Fundal pressure at the time of caesarean section does not increase the amount of transplacental micro transfusion (Owens 2003). Although this is a reassuring finding, it is still unclear whether or not fundal pressure at vaginal birth increases the risk of rhesus isoimmunisation and of vertical transmission of viruses such as HIV and hepatitis B.
Discomfort or pain from excessive pressure on the mother's abdomen is also a matter for concern.
Why it is important to do this review
The effectiveness or otherwise of fundal pressure is particularly relevant in low‐resource settings where, in the presence of prolonged second stage of labour or fetal distress, the options of assisted vaginal birth or caesarean section are not available. If effective and safe, fundal pressure may be the only option, which may reduce perinatal mortality and morbidity. It is also important because the procedure is extensively used in both high‐ and low‐income countries.
There is a need for objective evaluation of the effectiveness and safety of fundal pressure in the second stage of labour.
Objectives
To determine if fundal pressure is effective in achieving spontaneous vaginal birth, and preventing prolonged second stage or the need for operative birth, and to explore maternal and neonatal adverse effects related to fundal pressure.
Methods
Criteria for considering studies for this review
Types of studies
Randomised controlled trials (RCTs). Due to the expected paucity of trials, we also considered quasi‐randomised controlled trials.
Trials using a crossover design are not eligible for inclusion in this review. Cluster‐RCTS would be eligible for inclusion in this review but none were identified. Where abstracts were identified, we contacted the trial authors for further information. However, abstracts alone were not routinely included due to insufficient information to assess bias.
Types of participants
Women in the second stage of labour with singleton cephalic presentation. Women of all gestational ages and parity are eligible for inclusion. We excluded women who received fundal pressure at caesarean section and after delivery of the fetal head, or for shoulder dystocia.
Types of interventions
Fundal pressure versus no fundal pressure, where fundal pressure is defined as manual pressure on the fundus of the uterus towards the birth canal in the second stage of labour, with the aim of expediting the birth of the baby. This fundal pressure is also known as the 'Kristeller manoeuvre'.
We assessed fundal pressure applied by means of an inflatable belt as a separate comparison.
Types of outcome measures
Primary outcomes
Maternal
Short‐term outcomes
-
No spontaneous vaginal birth within a specified time, as defined by the trial authors
-
Operative birth
-
Instrumental birth
-
Caesarean section
-
Neonatal
-
Low arterial cord pH, as defined by trial authors
-
Apgar score less than seven after five minutes
Secondary outcomes
Maternal
-
Duration of active second stage
-
Use of other interventions
-
Episiotomy
-
-
Soft tissue damage
-
Perineal/vaginal/anal sphincter
-
Uterine
-
-
Postpartum haemorrhage as defined by trial authors
-
Severe maternal morbidity or death
-
Pain, after enrolment, as defined by trial authors
-
Maternal satisfaction as defined by trial authors
Long‐term outcomes
-
Faecal incontinence
-
Urinary incontinence
-
Dyspareunia
Neonatal
-
Neonatal trauma
-
Fractures
-
Haematoma
-
-
Neonatal encephalopathy, as defined by trial authors
-
Admission to neonatal intensive care unit
-
HIV/hepatitis B or C infection (in populations with high prevalence)
-
Baby death
-
Stillbirth
-
Neonatal death
-
Search methods for identification of studies
The following methods section of this review is based on a standard template used by Cochrane Pregnancy and Childbirth.
Electronic searches
We searched Cochrane Pregnancy and Childbirth’s Trials Register by contacting their Information Specialist (30 November 2016).
The Register is a database containing over 22,000 reports of controlled trials in the field of pregnancy and childbirth. For full search methods used to populate Cochrane Pregnancy and Childbirth’s Trials Register, including the detailed search strategies for CENTRAL, MEDLINE, Embase and CINAHL; the list of handsearched journals and conference proceedings, and the list of journals reviewed via the current awareness service, please follow this link to the editorial information about the Cochrane Pregnancy and Childbirth in the Cochrane Library and select the ‘Specialized Register ’ section from the options on the left side of the screen.
Briefly, Cochrane Pregnancy and Childbirth’s Trials Register is maintained by their Information Specialist and contains trials identified from:
-
monthly searches of the Cochrane Central Register of Controlled Trials (CENTRAL);
-
weekly searches of MEDLINE (Ovid);
-
weekly searches of Embase (Ovid);
-
monthly searches of CINAHL (EBSCO);
-
handsearches of 30 journals and the proceedings of major conferences;
-
weekly current awareness alerts for a further 44 journals plus monthly BioMed Central email alerts.
Two people screen the search results and review the full text of all relevant trial reports identified through the searching activities described above. Based on the intervention described, each trial report is assigned a number that corresponds to a specific Pregnancy and Childbirth review topic (or topics), and is then added to the Register. The Information Specialist searches the Register for each review using this topic number rather than keywords. This results in a more specific search set which has been fully accounted for in the relevant review sections (Included studies; Excluded studies; Studies awaiting classification; Ongoing studies).
Searching other resources
We searched the reference lists of retrieved studies.
We did not apply any language or date restrictions.
Data collection and analysis
For methods used in the previous version of this review, see Verheijen 2009.
The following methods section of this review is based on a standard template used by Cochrane Pregnancy and Childbirth.
Selection of studies
Two review authors (Joshua Vogel (JV) and Anna Cuthbert (AC)) independently assessed the studies for inclusion in this update. Therese Dowswell (TD) (Cochrane Pregnancy and Childbirth) and AC assessed the two studies where JV was an investigator. Any disagreements were resolved through discussion.
Data extraction and management
We designed a form to extract data. For eligible studies, two review authors and one representative of Cochrane Pregnancy and Childbirth (JV, AC and TD), extracted the data using the agreed form. We resolved discrepancies through discussion. We entered data into Review Manager 5 (RevMan 5) software (RevMan 2014) and checked for accuracy. We contacted authors of studies as required. Peyman 2011 provided further information regarding the study. We were unable to contact Zhao 2015.
Assessment of risk of bias in included studies
Two authors independently assessed risk of bias for each study using the criteria outlined in the Cochrane Handbook for Systematic Reviews of Interventions (Higgins 2011a). We resolved any disagreement by discussion or by involving a third assessor (TD).
(1) Random sequence generation (checking for possible selection bias)
We described for each included study the method used to generate the allocation sequence in sufficient detail to allow an assessment of whether it should produce comparable groups.
We assessed the method as:
-
low risk of bias (any truly random process, e.g. random number table; computer random‐number generator);
-
high risk of bias (any non‐random process, e.g. odd or even date of birth; hospital or clinic record number);
-
unclear risk of bias.
(2) Allocation concealment (checking for possible selection bias)
We described for each included study the method used to conceal allocation to interventions prior to assignment and assessed whether intervention allocation could have been foreseen in advance of, or during recruitment, or changed after assignment.
We assessed the methods as:
-
low risk of bias (e.g. telephone or central randomisation; consecutively‐numbered sealed opaque envelopes);
-
high risk of bias (open random allocation; unsealed or non‐opaque envelopes, alternation; date of birth);
-
unclear risk of bias.
(3.1) Blinding of participants and personnel (checking for possible performance bias)
We described for each included study the methods used, if any, to blind study participants and personnel from knowledge of which intervention a participant received. We considered that studies were at low risk of bias if they were blinded, or if we judged that the lack of blinding was unlikely to affect results. We assessed blinding separately for different outcomes or classes of outcomes.
We assessed the methods as:
-
low, high or unclear risk of bias for participants;
-
low, high or unclear risk of bias for personnel.
(3.2) Blinding of outcome assessment (checking for possible detection bias)
We described for each included study the methods used, if any, to blind outcome assessors from knowledge of which intervention a participant received. We assessed blinding separately for different outcomes or classes of outcomes.
We assessed methods used to blind outcome assessment as:
-
low, high or unclear risk of bias.
(4) Incomplete outcome data (checking for possible attrition bias due to the amount, nature and handling of incomplete outcome data)
We described for each included study, and for each outcome or class of outcomes, the completeness of data including attrition and exclusions from the analysis. We stated whether attrition and exclusions were reported and the numbers included in the analysis at each stage (compared with the total randomised participants), reasons for attrition or exclusion where reported, and whether missing data were balanced across groups or were related to outcomes. Where sufficient information was reported, or could be supplied by the trial authors, we planned to re‐include missing data in the analyses which we undertook.
We assessed methods as:
-
low risk of bias (e.g. no missing outcome data; missing outcome data balanced across groups);
-
high risk of bias (e.g. numbers or reasons for missing data imbalanced across groups; ‘as treated’ analysis done with substantial departure of intervention received from that assigned at randomisation);
-
unclear risk of bias.
(5) Selective reporting (checking for reporting bias)
We described for each included study how we investigated the possibility of selective outcome reporting bias and what we found.
We assessed the methods as:
-
low risk of bias (where it was clear that all of the study’s pre‐specified outcomes and all expected outcomes of interest to the review were reported);
-
high risk of bias (where not all the study’s pre‐specified outcomes were reported; one or more reported primary outcomes were not pre‐specified; outcomes of interest were reported incompletely and so could not be used; study failed to include results of a key outcome that would have been expected to have been reported);
-
unclear risk of bias.
(6) Other bias (checking for bias due to problems not covered by (1) to (5) above)
We described for each included study any important concerns we had about other possible sources of bias.
(7) Overall risk of bias
We made explicit judgements about whether studies were at high risk of bias, according to the criteria given in the Cochrane Handbook of Systematic Reviews of Interventions (Higgins 2011a). With reference to (1) to (6) above, we planned to assess the likely magnitude and direction of the bias and whether we considered it was likely to impact on the findings. In future updates, we will explore the impact of the level of bias through undertaking sensitivity analyses ‐ see Sensitivity analysis.
Assessment of the quality of the evidence using the GRADE approach
For this update we assessed the quality of the evidence using the GRADE approach as outlined in the GRADE handbook in order to assess the quality of the body of evidence relating to the following outcomes for the main comparisons: manual fundal pressure versus no fundal pressure, and fundal pressure by inflatable belt versus no fundal pressure.
-
No spontaneous vaginal birth within a specified time, as defined by the trial authors
-
Operative birth ‐ instrumental and caesarean
-
Low arterial cord pH, as defined by trial authors
-
Apgar score less than seven after five minutes
-
Duration of active second stage
-
Severe maternal morbidity or death
-
Neonatal mortality (stillbirth or neonatal death)
GRADEpro Guideline Development Tool was used to import data from RevMan 5 (RevMan 2014) in order to create 'Summary of findings' tables. We produced a summary of the intervention effect and a measure of quality for each of the above outcomes using the GRADE approach. The GRADE approach uses five considerations (study limitations, consistency of effect, imprecision, indirectness and publication bias) to assess the quality of the body of evidence for each outcome. The evidence can be downgraded from 'high quality' by one level for serious (or by two levels for very serious) limitations, depending on assessments for risk of bias, indirectness of evidence, serious inconsistency, imprecision of effect estimates or potential publication bias.
Measures of treatment effect
Dichotomous data
For dichotomous data, we presented results as summary risk ratio (RR) with 95% confidence intervals (CI).
Continuous data
We used the mean difference (MD) if outcomes were measured in the same way between trials. In future updates, where appropriate, we will use the standardised mean difference to combine trials that measured the same outcome, but used different methods.
Unit of analysis issues
Cluster‐randomised trials
In future updates, we will include cluster‐randomised trials in the analyses along with individually randomised trials. We will adjust their sample sizes using the methods described in the Cochrane Handbook for Systematic Reviews of Interventions Section 16.3.4 or 16.3.6 (Higgins 2011b) using an estimate of the intracluster correlation co‐efficient (ICC) derived from the trial (if possible), from a similar trial or from a study of a similar population. If we use ICCs from other sources, we will report this and conduct sensitivity analyses to investigate the effect of variation in the ICC. If we identify both cluster‐randomised trials and individually‐randomised trials, we plan to synthesise the relevant information. We will consider it reasonable to combine the results from both if there is little heterogeneity between the study designs and the interaction between the effect of intervention and the choice of randomisation unit is considered to be unlikely.
We will also acknowledge heterogeneity in the randomisation unit and perform a sensitivity analysis to investigate the effects of the randomisation unit.
Cross‐over trials
Cross‐over trials are not appropriate for this review.
Other unit of analysis issues
Trials with more than two arms
If we had identified trials with more than two arms we would have pooled intervention group results if appropriate, or split the control group, using the methods set out in the Cochrane Handbook for Systematic Reviews of Interventions (Higgins 2011b) to avoid double‐counting.
Multiple pregnancies
Multiple pregnancies are not included in this review.
Dealing with missing data
For included studies, we noted levels of attrition. In future updates, if more eligible studies are included, we will explore the impact of including studies with high levels of missing data in the overall assessment of treatment effect by using sensitivity analysis.
For all outcomes, we carried out analyses, as far as possible, on an intention‐to‐treat basis, that is, we attempted to include all participants randomised to each group in the analyses. The denominator for each outcome in each trial was the number randomised minus any participants whose outcomes were known to be missing.
Assessment of heterogeneity
We assessed statistical heterogeneity in each meta‐analysis using the Tau², I² (Higgins 2003) and Chi² statistics (Deeks 2011). We regarded heterogeneity as moderate if I² was greater than 30% and either Tau² was greater than zero, or there was a low P value (less than 0.10) in the Chi² test for heterogeneity. If we identified substantial heterogeneity (above 30%), we planned to explore it by pre‐specified subgroup analysis. When trials were reporting inconsistent results, we did not perform meta‐analysis as we felt that combining the data was not meaningful.
Assessment of reporting biases
In future updates, if there are 10 or more studies in the meta‐analysis, we will investigate reporting biases (such as publication bias) using funnel plots (Sterne 2011). We will assess funnel plot asymmetry visually. If asymmetry is suggested by a visual assessment, we will perform exploratory analyses to investigate it.
Data synthesis
We carried out statistical analysis using the RevMan 5 software (RevMan 2014). We used fixed‐effect meta‐analysis for combining data where it was reasonable to assume that studies were estimating the same underlying treatment effect: that is, where trials were examining the same intervention, and we judged the trials’ populations and methods sufficiently similar.
Where we identified clinical heterogeneity sufficient to expect that the underlying treatment effects differed between trials, or if we detected substantial statistical heterogeneity (above 50%), we used random‐effects meta‐analysis to produce an overall summary, if we considered an average treatment effect across trials clinically meaningful. We treated the random‐effects summary as the average range of possible treatment effects and we discussed the clinical implications of treatment effects differing between trials. If the average treatment effect was not clinically meaningful, we did not combine trials. Where we used random‐effects analyses, we presented the results as the average treatment effect with 95% CIs, and the estimates of Tau² and I².
Subgroup analysis and investigation of heterogeneity
Where we identified substantial heterogeneity, we planned to investigate it using subgroup analyses and sensitivity analyses. We planned to consider whether an overall summary was meaningful, and if it was, we would have used random‐effects analysis to produce it.
We planned to carry out the following subgroup analyses.
-
Previous caesarean section, no previous caesarean section, caesarean section status mixed/not specified.
-
Countries with low perinatal mortality rates (less than 20 per 1000), countries with high perinatal mortality rates (at least 20 per 1000), country status mixed/not specified.
-
Primiparas, multiparas, or parity mixed/not specified.
-
Fundal pressure used routinely, used for (prevention of) prolonged second stage, used for fetal distress, or indication mixed/not specified.
There was high heterogeneity for the primary outcomes of Apgar scores less than seven at five minutes in the comparison manual fundal pressure versus no fundal pressure; and instrumental birth, caesarean section, operative birth and duration of second stage in the comparison fundal pressure by inflatable belt versus no belt. We did not carry out planned subgroup analysis to explore heterogeneity due to insufficient data to make such analysis meaningful. For these outcomes we have used random‐effects analysis. We presented the results as the average treatment effect with 95% CIs, and the estimates of Tau² and I². If there is sufficient data in future updates, we will carry out these subgroup analyses. In future updates, we will assess subgroup differences by interaction tests available within RevMan 5 (RevMan 2014) and report the results of subgroup analyses quoting the Chi² statistic and P value, and the interaction test I² value. We will restrict subgroup analysis to the review's primary outcomes.
Sensitivity analysis
We planned to carry out sensitivity analyses to explore the effect of trial quality assessed by concealment of allocation, high attrition rates, or both, with studies at high risk of bias being excluded from the analyses in order to assess whether this made any difference to the overall result. We used sensitivity analysis to explore the effect of high attrition rates in Api 2009 for the outcome 'Low arterial cord pH'. We also used sensitivity analysis to explore the effect of 27 out of 40 women from the 'no fundal pressure' group receiving manual fundal pressure in Acanfora 2013. Sensitivity analysis is restricted to the review's primary outcomes.
Results
Description of studies
See Characteristics of included studies.
Results of the search
In the last update of this review, we identified three trials that studied fundal pressure in second stage of labour using the search criteria. One trial was excluded from the analyses as allocation to intervention group was not based on randomisation (Schulz‐Lobmeyr 1999). Another (quasi‐randomised) trial was excluded for reasons of poor methodological quality and high risk of bias (Zhao 1991).
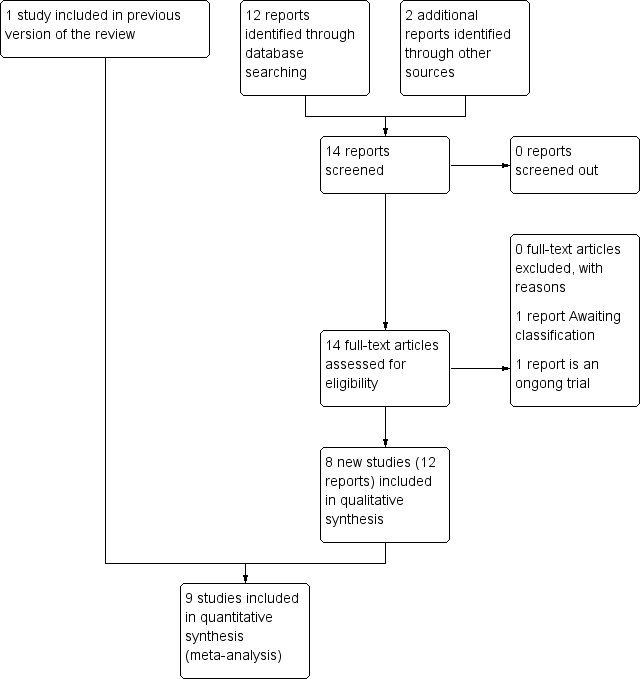
In this update, we assessed 14 reports of 10 trials from an updated search in November 2016. We have included eight new trials, one trial is ongoing (Hofmeyr 2015), and one is awaiting classification (Zhao 2015). Cox 1999 was already included in the previous version of this review (See: Figure 1).
Study flow diagram
Included studies
Study design
This updated review is now comprised of nine randomised controlled trials (RCTs) (Acanfora 2013; Acmaz 2015; Api 2009; Cox 1999; Kang 2009; Kim 2013; Mahendru 2010; Novikova 2009; Peyman 2011) involving 3948 women.
Most women were recruited during the first stage of labour. Acanfora 2013 and Novikova 2009 randomised women when they reached second stage of labour. Novikova 2009 was the only trial that randomised women when they had not delivered after 15 minutes of active pushing. It is not clear at what stage randomisation took place in Acmaz 2015.
Setting and sample size
The largest trial in this review (Peyman 2011), involved 2236 women and took place in hospitals related to the Azad University in Iran. All other trials were single‐centre RCTs with the exception of Novikova 2009 who recruited women over two hospital sites in South Africa. Remaining trials included in this review were conducted in Italy (Acanfora 2013), Republic of Korea (Kang 2009; Kim 2013) India (Mahendru 2010), Turkey (Acmaz 2015; Api 2009) and UK Cox 1999). The studies were from 1999 to 2013. The smallest trial was Acanfora 2013 with 80 women involved.
Participants
Most trials included women with a term (37 weeks' gestation and above), singleton pregnancy who were in the first stage of labour. Novikova 2009 was the only trial to include women at 35 weeks' gestation or above.
Acmaz 2015, Api 2009 and Peyman 2011 included multiparous and nulliparous women; all other trials only included nulliparous women. Most of the trials excluded women with uterine scar or previous uterine surgery except for Api 2009 where it was not clear whether or not these women were excluded.
Women in Cox 1999, Kang 2009, Kim 2013 and Peyman 2011 received oxytocin during labour, although it was not clear in Kim 2013 or Peyman 2011 when this was given. All the women in Cox 1999 received epidural analgesia, and 44 were given oxytocin during second stage. Kang 2009 included women who received oxytocin for both induction and augmentation. Acmaz 2015 excluded women with epidural or oxytocin augmentation. Mahendru 2010 only included women in spontaneous labour, though it was not clear if women who were augmented were eligible. The remaining studies did not mention whether women received oxytocin for induction or augmentation or neither (Acanfora 2013; Api 2009; Novikova 2009).
Interventions and comparisons
All of the trials involved fundal pressure, either manual or by inflatable belt, versus no fundal pressure for women in the second stage of labour.
Comparison 1: Manual fundal pressure versus no fundal pressure (five trials, 3057 women)
Five trials (Acmaz 2015; Api 2009; Mahendru 2010; Novikova 2009; Peyman 2011) assessed manual fundal pressure versus no fundal pressure. Women participating in Api 2009 and Peyman 2011 had fundal pressure applied by a care provider pressing on the uppermost part of the uterus at a 30° to 45° angle to the maternal spine in the direction of the pelvis (Kristeller manoeuvre). Pressure was applied each time the woman had a contraction throughout second stage. Mahendru 2010 used the same technique, except that the doctor only applied pressure three times during the second stage (the women in the control groups did not receive any fundal pressure). Acmaz 2015 did not specify how manual pressure was applied in their trial.
Novikova 2009 used the Gentle Assisted Pushing technique (GAP) which seeks to avoid "forceful or rapid pressure" on the woman's abdomen. If the woman was undelivered after 15 minutes of active pushing, "the attendant knelt at the bed head with the back of the woman’s head and back resting on her thighs. The attendant passed her arms under the woman’s arms and placed her palms on the woman’s fundus. During contractions firm and sustained fundal pressure was applied in the direction of the pelvis for the duration of the contraction." The same supportive position was used for the control group though no pressure was applied.
Comparison 2: Fundal pressure by means of an inflatable belt versus no fundal pressure (four trials, 891 women)
Four trials (Acanfora 2013; Cox 1999; Kang 2009; Kim 2013) compared fundal pressure by inflatable belt versus no fundal pressure.
All four trials used an inflatable belt that detected contractions and inflated during the contraction for 30 seconds. In all four trials, fetal heart rate was monitored continuously whilst the belts were applied, and the belt was disabled when birth seemed imminent. In all trials, except Cox 1999, women in the control group also wore the inflatable belt, but it was not activated or only inflated to minimal pressures. Cox 1999 only included nulliparous women with epidural analgesia and ruptured membranes, Kang 2009 and Kim 2013 included nulliparous women who had the choice of epidural anaesthesia, and Acanfora 2013 included nulliparous women. It is not clear if epidural anaesthesia was an option in this trial.
Acanfora 2013 also used the Kristeller manoeuvre on women in the control group (only). The indication for its use is not stated, although non‐reassuring fetal heart monitoring is mentioned as a possible reason. Twenty‐seven women out of 40 in the control group had fundal pressure applied during their second stage.
Excluded studies
Two studies (Schulz‐Lobmeyr 1999; Zhao 1991) were excluded in the last version of this review. Schulz‐Lobmeyr 1999 was judged to be at too high risk of confounding factors, as fundal pressure was performed by choice of the clinician, and not as a result of allocation. Zhao 1991 was at high risk of bias due to poor methodological quality.
Risk of bias in included studies
See Figure 2 and Figure 3 for summary of 'Risk of bias' assessment of included studies.

Risk of bias summary: review authors' judgements about each risk of bias item for each included study

Risk of bias graph: review authors' judgements about each risk of bias item presented as percentages across all included studies
Allocation
We observed adequate allocation concealment in Cox 1999 and Novikova 2009, where computer‐generated numbers were placed in consecutively‐numbered sealed opaque envelopes. In all other trials, allocation concealment was not reported (Acanfora 2013; Acmaz 2015; Api 2009; Kang 2009; Kim 2013; Mahendru 2010; Peyman 2011) or it was unclear what method was used (Acanfora 2013; Kang 2009; Kim 2013; Peyman 2011).
Blinding
All trials, except Cox 1999, either did not blind participants and outcome assessors or did not mention attempting to blind. We assumed that these trials did not blind participants or assessors (high risk of bias). Cox 1999 collected self‐reported outcomes via a research doctor after birth. We judged these self‐reported outcomes to be at high risk of bias because they could have been affected by a non‐blinded researcher collecting the data. However, neonatal outcomes were collected by a paediatrician at 24 hours postnatal who was blinded to the study allocation. Overall, we assessed Cox 1999 as being at an unclear risk of performance and detection bias for lack of blinding.
Incomplete outcome data
Most of the trials did not give enough information to adequately assess for incomplete outcome data and were poorly reported (Acanfora 2013; Acmaz 2015; Kang 2009; Mahendru 2010; Peyman 2011). Data appeared complete in Cox 1999, and Novikova 2009 where outcomes were analysed by intention to treat. Api 2009 reported missing data in both arms of cord blood analysis, which was unexplained and disproportionately worse in the fundal pressure group (high risk of bias). Acmaz 2015 was difficult to assess, as there was no clear information about when randomisation took place and a quarter of the sample recruited were lost before second stage. Women were also lost to follow‐up or excluded. Kim 2013 did not report data for a primary outcome, duration of second stage, for 15 women who had either a caesarean section or precipitous labour (high risk of bias). These women were already randomised (four women in the intervention group and 11 women in the control group).
Selective reporting
We did not see trial protocols for any of the included trials so we found it difficult to assess them for selection bias, and we assessed all except Peyman 2011 as at unclear risk. Peyman 2011 did not clearly pre‐specify outcomes in the methods text and due to errors in reporting certain outcomes, such as duration of second stage (high risk of bias), we were not able to use data from this trial in the review.
Other potential sources of bias
Five trials (Acanfora 2013; Kang 2009; Kim 2013; Mahendru 2010; Novikova 2009) showed no other risk of bias and baseline data were similar across the two groups (low risk of bias). Three other trials showed differences between baseline characteristics such as parity (Acmaz 2015; Api 2009), mean age of group (Acmaz 2015; Api 2009) and epidural duration (Cox 1999). Reporting in Peyman 2011 was poor, and it was too difficult to effectively assess other sources of bias. We judged Api 2009, Cox 1999 and Peyman 2011 as being at an unclear risk of other sources of bias. Acmaz 2015 was also poorly reported but due to the imbalances in baseline characteristics and the fact that the trial was only conducted in daylight hours, we judged this trial to be at high risk of other sources of bias.
Effects of interventions
See: Summary of findings for the main comparison Manual fundal pressure compared to no fundal pressure for the second stage of labour; Summary of findings 2 Fundal pressure by inflatable belt compared to no fundal pressure for second stage of labour
Comparison 1. Manual fundal pressure versus no fundal pressure
Primary outcomes
We identified five trials including 3057 women for this comparison (Acmaz 2015; Api 2009; Mahendru 2010; Novikova 2009; Peyman 2011).
Maternal outcomes
No spontaneous vaginal birth within a specified time, as defined by the trial authors
One trial (Novikova 2009) reported "time from bearing down to birth of head => 30 min or operative delivery". We saw no clear difference between the two groups (risk ratio (RR) 0.96, 95% confidence interval (CI) 0.71 to 1.28; 120 women; 1 trial; very low‐quality evidence; Analysis 1.1) with similar numbers of women giving birth spontaneously or instrumentally over 30 minutes from bearing down in both the fundal pressure group and no fundal pressure group.
Instrumental birth
In Api 2009, there were similar numbers of instrumental births in the fundal pressure and no fundal pressure groups (RR 3.28, 95% CI 0.14 to 79.65; 197 women; 1 trial; Analysis 1.2).
Caesarean section
In Api 2009, there was no difference found in caesarean births between fundal pressure and no fundal pressure groups (RR 1.10, 95% CI 0.07 to 17.27; 197 women; 1 trial; Analysis 1.3).
Operative birth ‐ instrumental or caesarean
Overall, the results were inconsistent for this outcome. Manual pressure could reduce the number of operative births and therefore increase spontaneous vaginal births but confidence intervals crossed the line of no effect (average RR 0.66, 95% CI 0.12 to 3.55; 317 women; 2 trials; I² = 43%; Tau² = 0.71 Analysis 1.4). We graded this evidence as very low quality.
Neonatal outcomes
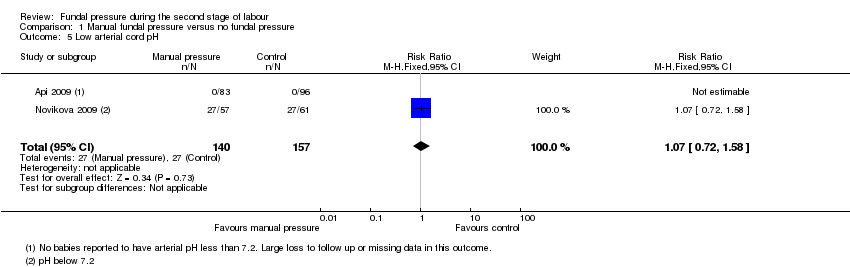
Low arterial cord pH, as defined by trial authors
There were similar numbers of babies born with low arterial cord blood pH in fundal pressure and no fundal pressure groups (RR 1.07, 95% CI 0.72 to 1.58; 297 women; 2 trials; I² = 0%; very low‐quality evidence; Analysis 1.5). Api 2009 had some missing data for this outcome which was unexplained and unequal between the two groups. We conducted a sensitivity analysis by excluding Api 2009 and this yielded a similar result (RR 1.07, 95% CI 0.72 to 1.58; 118 women; 1 trial).
Apgar score less than seven after five minutes
It appeared that fewer babies born to women who did not have fundal pressure had Apgar scores of less then 7 at five minutes however the wide confidence intervals crossed the line of no effect (average RR 4.48, 95% CI 0.28 to 71.45; 2759 women; 4 trials; I² = 89%; Tau² = 3.55 very low‐quality evidence; Analysis 1.6). We noted that there was substantial heterogeneity for this outcome. Two trials (Api 2009; Mahendru 2010) reported Apgar scores of less than seven at five minutes, but no cases occurred in either arm. The two other trials with outcome data compared fundal pressure (Peyman 2011) or Gentle Assisted Pushing (GAP) (Novikova 2009) versus no fundal pressure. Peyman 2011 reported a particularly high rate of the outcome in the intervention arm (73/1171 vs 4/1061). A possible reason for the high heterogeneity is that Peyman 2011 used fundal pressure from full dilatation whereas Novikova 2009 only used GAP after 15 minutes of the woman bearing down. Therefore, it is likely that women in Peyman 2011, would have received fundal pressure for a longer duration than the women in Novikova 2009. These two trials were also conducted in different settings, where prevalence of low Apgar scores are likely to differ. The high risk of performance, detection and reporting bias in Peyman 2011 may also be a factor.
Acmaz 2015 reported this outcome as a median and interquartile range. We did not use this data, which reported exactly the same scores in both groups.
Secondary outcomes
Maternal secondary outcomes
Duration of active second stage
In Api 2009, there was no difference in the length of second stage between the two groups (mean difference (MD) 0.80 minutes shorter, 95% CI ‐3.66 minutes shorter to 2.06 minutes longer; 194 women; 1 trial; very low‐quality evidence; Analysis 1.7).
Use of other interventions ‐ episiotomy
There were similar numbers of episiotomies in fundal pressure and no fundal pressure groups (RR 1.18, 95% CI 0.92 to 1.50; 317 women; 2 trials; I² = 0%; Analysis 1.8). Acmaz 2015 also reported this outcome, however the trial took place in a setting where episiotomies are performed more routinely and we considered it inappropriate to include these data with those from settings where episiotomies were avoided in most women (107/149 women in the intervention group and 75/146 in the control group received episiotomy).
Soft tissue damage ‐ perineal/vaginal/anal sphincter/uterine
Perineal damage was reported in one trial (Mahendru 2010), and occurred more in women who received manual fundal pressure, however wide confidence intervals crossed the line of no effect (RR 6.42, 95% CI 0.79 to 52.37; 209 women; 1 trial; Analysis 1.9).
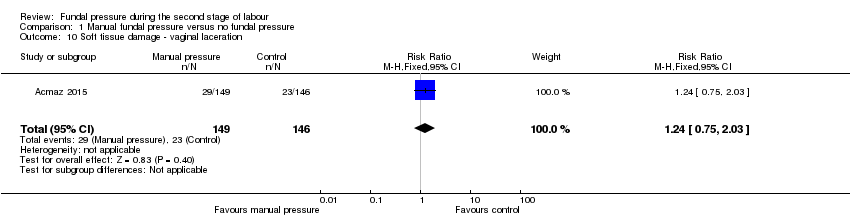
Vaginal laceration was reported in one trial (Acmaz 2015). There was no clear difference in the two groups (RR 1.24, 95% CI 0.75 to 2.03; 295 women; 1 trial; Analysis 1.10).
Acmaz 2015 also reported that more women who received manual fundal pressure had cervical tears than in the control group (RR 4.90, 95% CI 1.09 to 21.98; 295 women; 1 trial; Analysis 1.11).
Other types of soft tissue damage (anal, uterine) were not reported by any trial under this comparison.
Postpartum haemorrhage as defined by trial authors
One trial (Novikova 2009) reported blood loss of over 300 ml and found no meaningful difference between the two groups (RR 1.87, 95% CI 0.58 to 6.06; 120 women; 1 trial; Analysis 1.12).
Pain, after enrolment, as defined by trial authors
One trial reported women requesting one, two or three doses of injectable diclofenac following birth. Thirty‐four women requested analgesia (i.e. one, two or three doses) in the manual fundal pressure group and eight requested analgesia in the control group (RR 4.54, 95% CI 2.21 to 9.34; 209 women; 1 trial; Analysis 1.13).
Neonatal secondary outcomes
Neonatal trauma ‐ fractures
One trial (Mahendru 2010) reported no fractures in either group (Analysis 1.14).
Neonatal trauma ‐ haematoma
One trial (Mahendru 2010) reported no haematomas in either group (Analysis 1.15).
Admission to neonatal intensive care unit
Similar numbers of babies were admitted to intensive care baby unit in both groups in one trial that reported this outcome (RR 1.63, 95% CI 0.40 to 6.71; 295 women; 1 trial; Analysis 1.16).
Baby death ‐ neonatal death
Only two trials (Mahendru 2010; Peyman 2011) reported this outcome: there were no neonatal deaths in either group (2 trials, 2445 women, 0 deaths in either arm; very low‐quality evidence; Analysis 1.17).
Other secondary outcomes
The following secondary outcomes were not reported for this comparison:
-
Severe maternal morbidity or death
-
Maternal satisfaction as defined by trial authors
-
Long‐term outcomes: faecal incontinence/urinary incontinence, dyspareunia
-
Neonatal encephalopathy, as defined by trial authors
-
Admission to neonatal intensive care unit
-
HIV/hepatitis B or C infection (in populations with high prevalence)
-
Baby death ‐ stillbirth
Comparison 2. Fundal pressure by means of an inflatable belt versus no fundal pressure
Primary outcomes
We included four trials including 891 women for this comparison (Acanfora 2013; Cox 1999; Kang 2009; Kim 2013).
Maternal outcomes
No spontaneous vaginal birth within a specified time, as defined by the trial authors
This outcome was not reported in the trials under this comparison.
Instrumental birth
Fewer women in the group using the inflatable belt for fundal pressure received instrumental deliveries than those in the control group with no belt (average RR 0.73, 95% CI 0.52 to 1.02; 891 women; 4 trials; I² = 52%; Tau² = 0.05 Analysis 2.1) however, due to wide confidence intervals which just crossed the line of no effect, we could not be certain that this result was not due to chance. However, in Acanfora 2013 27 out of 40 women in the control group also received manual fundal pressure. Therefore, we performed a sensitivity analysis excluding Acanfora 2013 which showed no difference between the two groups (average RR 0.81, 95% CI 0.63 to 1.04; 811 women; 3 trials; I² = 34%; Tau² = 0.02 Analysis 2.15).
Caesarean section
There was no clear difference in use of caesarean section in women treated with the inflatable belt and those in control groups (average RR 0.56, 95% CI 0.14 to 2.26; 891 women; 4 trials; I² = 70%; Tau² = 0.98; Analysis 2.2). There were insufficient data to perform planned subgroup analysis for this outcome. A sensitivity analysis excluding Acanfora 2013 showed no difference between the groups and higher heterogeneity (average RR 0.80, 95% CI 0.20 to 3.19; 811 women; 3 trials; I² = 75%; Tau² = 0.75; Analysis 2.16).
Operative birth ‐ instrumental or caesarean
More women in the control groups had operative birth, however, wide CIs just crossed the line of no effect (average RR 0.62, 95% CI 0.38 to 1.01; 891 women; 4 trials; I² = 78%; Tau² = 0.14; very low‐quality evidence; Analysis 2.3). Due to high heterogeneity, we conducted a sensitivity analysis by excluding Acanfora 2013. This indicated that risk of operative birth was no different between the two groups (RR 0.77, 95% CI 0.52 to 1.13; 811 women; 3 trials; I² = 71%; Tau² = 0.07; Analysis 2.17). Heterogeneity remained substantial.
Neonatal outcomes
Low arterial cord pH, as defined by trial authors
Only one trial reported this outcome (Cox 1999). The risk of babies experiencing low arterial cord pH were similar in both groups (RR 0.47, 95% CI 0.09 to 2.55; 461 infants; 1 trial;low‐quality evidence;Analysis 2.4).
Apgar score less than seven after five minutes
Only one trial reported this outcome (Cox 1999). The risk of babies experiencing Apgars of less than seven at five minutes was similar in both groups (RR 4.62, 95% CI 0.22 to 95.68; 500 infants; 1 trial; very low‐quality evidence; Analysis 2.5).
Secondary outcomes
Maternal outcomes
Duration of second stage (minutes)
Duration of second stage of labour was observed to be much shorter in the inflatable belt group compared to the control group in the two trials which reported this outcome (Acanfora 2013; Kim 2013). Fundal pressure by inflatable belt appeared to have a positive effect by reducing the duration of second stage, however until there are further trials examining this outcome, it is not possible to tell how large this effect is, and whether it is also seen in other sub‐populations (such as multiparous women) given the inconsistency between the trials (average MD 50.80 minutes shorter, 95% CI 94.85 minutes to 6.74 minutes shorter; 253 women; 2 trials; I² = 97%; Tau² = 975.94; very low‐quality evidence; Analysis 2.6).
Episiotomy
Similar numbers of women received episiotomy in both groups (average RR 0.98, 95% CI 0.86 to 1.12; 811 women; 3 trials; I² = 86%; Tau² = 0.01; Analysis 2.7). There was high heterogeneity in the outcome data. It appears that women in Kang 2009 received routine episiotomy, and the data from the other two trials (Cox 1999; Kim 2013) in the meta‐analysis were inconsistent.
Soft tissue damage ‐ perineal/vaginal/anal sphincter/uterine
The risk of perineal damage in the two groups was not clearly different (average RR 0.53, 95% CI 0.20 to 1.38; 897 women; 4 trials; I² = 87%; Tau² = 0.66; Analysis 2.8). Acanfora 2013 and Kang 2009 both contributed significantly to the high heterogeneity in the meta‐analysis; Acanfora 2013 reported that the belt reduced the number of women with perineal damage, however the majority of women in the control group in this trial also had the Kristeller manoeuvre applied, which could have affected this result. In Kang 2009, a high proportion of women underwent episiotomies and thus very few perineal tears were reported.
Only Kang 2009 reported vaginal tears‐ similar numbers of women in each group experienced this outcome (RR 0.74, 95% CI 0.27 to 2.00; 123 women; 1 trial; Analysis 2.9).
Cox 1999 (the only trial reporting anal sphincter damage) reported 17 third degree tears in the inflatable belt group compared with just one in the control group (RR 15.69, 95% CI 2.10 to 117.02; 500 women; 1 trial; Analysis 2.10).
Acanfora 2013 and Kang 2009 reported cervical tears; there was no difference between the two groups (RR 0.42, 95% CI 0.06 to 2.82; 203 women; 2 trials; I² = 0%; Analysis 2.11).
No trial reported uterine rupture.
Postpartum haemorrhage as defined by trial authors
One trial (Cox 1999) reported "need for blood transfusion" and found no meaningful difference between the two groups (RR 0.35, 95% CI 0.09 to 1.29; 500 women; 1 trial; Analysis 1.12).
Maternal satisfaction
We did not meta‐analyse the data due to different methods and questions used to rate maternal satisfaction. However, 39/40 women who wore the inflatable belt perceived it as useful in Acanfora 2013. Kang 2009 reported that "Based on a postpartum questionnaire, more women reported positively about the device in the active group in terms of confidence, comfort, and satisfaction". Cox 1999 and Kim 2013 reported visual analogue scores of outcomes related to maternal satisfaction but did not clearly explain the scoring system, so we have not reported these results in the review.
Neonatal outcomes
Neonatal trauma ‐ haematoma
One cephalhaematoma was reported in the control group of Kang 2009 (RR 0.33, 95% CI 0.01 to 7.90; 123 infants; 1 trial; Analysis 2.13).
Admission to neonatal intensive care unit
The results for this outcome were inconsistent across the trials (Acanfora 2013; Cox 1999; Kang 2009; Kim 2013) and wide CIs crossed the line of no effect (average RR 0.64, 95% CI 0.19 to 2.14; 891 infants; 4 trials; I² = 59%; Tau² = 0.82; Analysis 2.14). The heterogeneity could be partly explained by some of the women in the control group in Acanfora 2013 receiving the Kristeller manoeuvre, as seven babies from this group were admitted to intensive care compared with no babies requiring admission in the inflatable belt group.
Other secondary outcomes
The following secondary outcomes were not reported for this comparison:
-
Severe maternal morbidity or death
-
Pain, after enrolment, as defined by trial authors
-
Long‐term outcomes: faecal incontinence/urinary incontinence/dyspareunia
-
Neonatal trauma ‐ fractures
-
Neonatal encephalopathy, as defined by trial authors
-
HIV/hepatitis B or C infection (in populations with high prevalence)
-
Baby death ‐ stillbirth and neonatal death
Discussion
This updated review now comprises nine randomised controlled trials involving 3653 women. There are five trials of manual fundal pressure and four trials of use of inflatable belts. We found limited evidence, which does not currently support the routine use of fundal pressure in clinical settings, either manually or by inflatable belt. There is still uncertainty around the majority of outcomes due to substantial heterogeneity, inconsistent findings and insufficient data.
Summary of main results
Manual fundal pressure versus no fundal pressure
(See summary of findings Table for the main comparison)
Neither mode of birth (vaginal, instrumental or caesarean birth) or time to birth was affected by applying manual fundal pressure to women in second stage of labour. Perineal damage may be more likely for women receiving fundal pressure but this result may be due to chance; other types of soft tissue damage were not reported in included trials. In the single trial that reported pain felt by the women, postnatal pain was increased in the fundal pressure group. Maternal satisfaction was not reported in included trials.
Apgar scores were higher in the babies born to women who did not receive fundal pressure ‐ this may indicate that manual fundal pressure results in poorer outcomes for babies, but this finding is not conclusive, with wide confidence intervals that cross the line of no effect. There were no fractures, haematomas or deaths reported in this comparison. Of note, the Gentle Assisted Pushing method of applying fundal pressure was not associated with a difference in neonatal outcomes between the two groups. Further research could establish whether this technique is more effective and safer than other forms of fundal pressure.
Fundal pressure by inflatable belt versus no fundal pressure
(See summary of findings Table 2)
Rates of instrumental birth and operative deliveries overall were lower in the inflatable belt group, although we cannot be certain that this result is not due to chance due to wide confidence intervals. Results were also inconsistent for caesarean section, possibly due to differences in study design. Duration of second stage labour was substantially shorter for the women when the inflatable belt was used. Perineal, vaginal and cervical tears were not clearly different between the two groups, however one study found an increase in third degree tears in the inflatable belt group. Generally, women reported that they were satisfied with the belt.
The possible increase in intact perineum, as well as in anal sphincter tears in women wearing the belt, is somewhat contradictory. While in the belt group, 16 of 17 cases of sphincter tears were associated with an instrumental birth, in the control group an instrumental birth was only associated with one third‐degree tear. The belt was switched off prior to instrumentation in the trial that collected these data. It seems therefore unlikely that there is a causative relation between the intervention and the tears. The trial authors reported their suspicion that the outcome assessors were more diligent in identifying and reporting perineal trauma in the experimental group. The lack of blinding seem to have introduced bias for assessment of this outcome. However, the possibility of a causal link should not be discounted.
Numbers of babies with low arterial cord pH, low Apgar scores, and admissions to neonatal intensive care, were similar across the groups. One baby had a cephalhaematoma in the control group. Fractures and neonatal deaths were not reported.
Overall completeness and applicability of evidence
In this update, we were able to include two separate comparisons; manual fundal pressure versus no fundal pressure; and fundal pressure by an inflatable belt versus no fundal pressure, with five trials in the first comparison and four trials in the second comparison.
Only small sample sizes were available for primary outcomes in both comparisons, and no data were available for many secondary outcomes (for example, no data on maternal morbidity, mortality and stillbirth were reported). Longer‐term maternal outcomes were also not reported. Only five trials reported any type of soft tissue damage including vaginal and perineal tears of any degree of severity. Neonatal outcomes were even less well reported in the inflatable belt comparison. Only one trial reported Apgar score and low arterial cord pH. It is therefore difficult to draw conclusions on the benefits and harms on the use of fundal pressure, and whether the findings are generalisable to other settings or groups of women.
The trials took place in a range of countries, however, the majority of trials were poorly conducted or poorly reported. Heterogeneity was high in most meta‐analyses ‐ the results should be viewed with caution.
There is currently insufficient evidence available to indicate whether fundal pressure is beneficial or safe, or both, particularly in resource‐limited settings where operative birth is not possible.
Quality of the evidence
The overall quality of the evidence was low to moderate. None of the included studies used blinding. While blinding of participants and personnel may not have been possible, outcome assessors could have been blinded (but generally were not). Reporting of the included trials was generally quite poor, thus assessments for random sequence generation and allocation concealment were often unclear. We assessed Api 2009 and Kim 2013 as being at high risk of attrition bias. Peyman 2011 was the largest trial with 2236 women participating, however the reporting was very poor, and we generally assessed it as being at high or unclear risk of bias. Please see 'Risk of bias' summary figures for a summary of these assessments: Figure 2 and Figure 3.
For the comparison of manual fundal pressure to no fundal pressure (summary of findings Table for the main comparison), we rated evidence for no spontaneous vaginal birth within a specified time as low quality, and operative birth ‐ instrumental or caesarean birth, low arterial cord pH, Apgar score less than 7 at five minutes and duration of active second stage were all rated as very low‐quality evidence.
For the comparison of fundal pressure by inflatable belt to no fundal pressure (summary of findings Table 2), we rated evidence for operative birth ‐ instrumental or caesarean birth and duration of second stage as very low quality, and low arterial cord pH and Apgar score less than seven at five minutes were rated as low‐quality evidence.
We based decisions for downgrading on risk of bias, indirectness due to differences in study design, or imprecision of effect estimates.
Potential biases in the review process
We are aware that it is possible to introduce bias at every stage in the review process so we have taken steps to minimise bias. Two review authors (JV and AC) independently assessed eligibility for each trial, conducted data extraction and assessed the quality of each trial. Any disagreements were resolved by discussion, but it is possible that another review team may have made different judgements.
Three review authors (GJH, JV and MS) are authors of two trials that we assessed for inclusion, one of which is ongoing (Hofmeyr 2015, GJH, JV and MS) and the other that was included (Novikova 2009, GJH and MS). They were not involved in assessing eligibility, conducting data extraction or assessing risk of bias for the respective trials. Therese Dowswell, from Cochrane Pregnancy and Chidbirth, and AC assessed these trials.
Agreements and disagreements with other studies or reviews
We did not identify any non‐Cochrane reviews of fundal pressure. A Cochrane Review looking at positions in the second stage of labour for women without epidurals (Gupta 2012) found that upright positions resulted in fewer instrumental births and episiotomies, though increased numbers of women had second degree tears. While a woman's position at the time of application of fundal pressure was not always well described, it is possible that fundal pressure by inflatable belt and gentle assisted pushing (Novikova 2009) favour more upright positions, which could impact on outcomes (such as the possible increase in unassisted vaginal births observed in the inflatable belt group). This increase was not seen in the manual fundal pressure group which often required the women to give birth in a supine position.
Recent retrospective observational studies on use of fundal pressure largely align with the findings of the review:
Satore 2012 found that women who received manual fundal pressure were more likely to have an episiotomy and suffer with postpartum perineal pain, whilst the women in the control group were more likely to have an intact perineum or first degree perineal lacerations.
Moiety 2014 agreed that duration of second stage of labour was shorter for women with manual fundal pressure and that severe perineal trauma was increased in this group.
Furrer 2015 also found that fundal pressure increased anal sphincter tears, fetal acidosis and babies born with low Apgar scores.
Obsevational studies are subject to confounding as the reason for use of fundal pressure may be the cause of poor outcomes.

Study flow diagram

Risk of bias summary: review authors' judgements about each risk of bias item for each included study

Risk of bias graph: review authors' judgements about each risk of bias item presented as percentages across all included studies

Comparison 1 Manual fundal pressure versus no fundal pressure, Outcome 1 No spontaneous vaginal birth within a specified time, as defined by the trial authors.

Comparison 1 Manual fundal pressure versus no fundal pressure, Outcome 2 Instrumental birth.

Comparison 1 Manual fundal pressure versus no fundal pressure, Outcome 3 Caesarean section.

Comparison 1 Manual fundal pressure versus no fundal pressure, Outcome 4 Operative birth ‐ instrumental or caesarean.
Comparison 1 Manual fundal pressure versus no fundal pressure, Outcome 5 Low arterial cord pH.

Comparison 1 Manual fundal pressure versus no fundal pressure, Outcome 6 Apgar score less than 7 at 5 minutes.

Comparison 1 Manual fundal pressure versus no fundal pressure, Outcome 7 Duration of active second stage.

Comparison 1 Manual fundal pressure versus no fundal pressure, Outcome 8 Episiotomy.

Comparison 1 Manual fundal pressure versus no fundal pressure, Outcome 9 Soft tissue damage ‐ perineal.
Comparison 1 Manual fundal pressure versus no fundal pressure, Outcome 10 Soft tissue damage ‐ vaginal laceration.

Comparison 1 Manual fundal pressure versus no fundal pressure, Outcome 11 Soft tissue damage ‐ cervical.

Comparison 1 Manual fundal pressure versus no fundal pressure, Outcome 12 Postpartum haemorrhage.

Comparison 1 Manual fundal pressure versus no fundal pressure, Outcome 13 Pain after enrolment as defined by trial authors.

Comparison 1 Manual fundal pressure versus no fundal pressure, Outcome 14 Neonatal trauma ‐ fractures.

Comparison 1 Manual fundal pressure versus no fundal pressure, Outcome 15 Neonatal trauma ‐ haematoma.
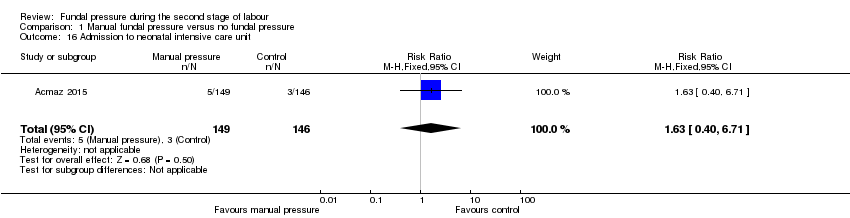
Comparison 1 Manual fundal pressure versus no fundal pressure, Outcome 16 Admission to neonatal intensive care unit.

Comparison 1 Manual fundal pressure versus no fundal pressure, Outcome 17 Neonatal death.

Comparison 1 Manual fundal pressure versus no fundal pressure, Outcome 18 Sensitivity analysis: low arterial cord pH.

Comparison 2 Fundal pressure by inflatable belt versus no fundal pressure, Outcome 1 Instrumental birth.

Comparison 2 Fundal pressure by inflatable belt versus no fundal pressure, Outcome 2 Caesarean section.

Comparison 2 Fundal pressure by inflatable belt versus no fundal pressure, Outcome 3 Operative birth ‐ instrumental or caesarean section.
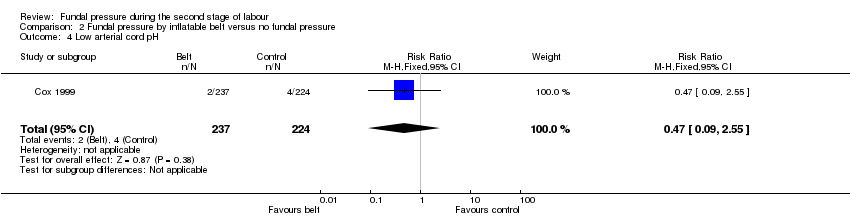
Comparison 2 Fundal pressure by inflatable belt versus no fundal pressure, Outcome 4 Low arterial cord pH.

Comparison 2 Fundal pressure by inflatable belt versus no fundal pressure, Outcome 5 Apgar score less than 7 after 5 minutes.

Comparison 2 Fundal pressure by inflatable belt versus no fundal pressure, Outcome 6 Duration of second stage.

Comparison 2 Fundal pressure by inflatable belt versus no fundal pressure, Outcome 7 Episiotomy.

Comparison 2 Fundal pressure by inflatable belt versus no fundal pressure, Outcome 8 Soft tissue damage ‐ perineal.

Comparison 2 Fundal pressure by inflatable belt versus no fundal pressure, Outcome 9 Soft tissue damage ‐ vaginal.

Comparison 2 Fundal pressure by inflatable belt versus no fundal pressure, Outcome 10 Soft tissue damage ‐ anal sphincter.
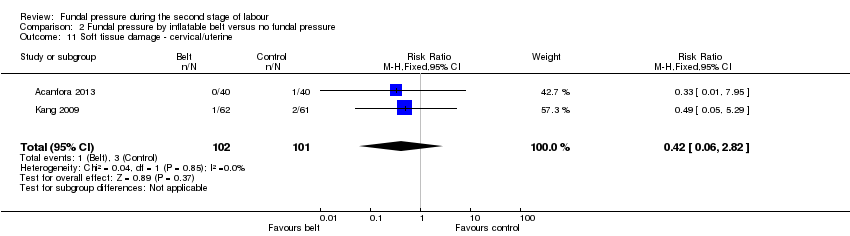
Comparison 2 Fundal pressure by inflatable belt versus no fundal pressure, Outcome 11 Soft tissue damage ‐ cervical/uterine.
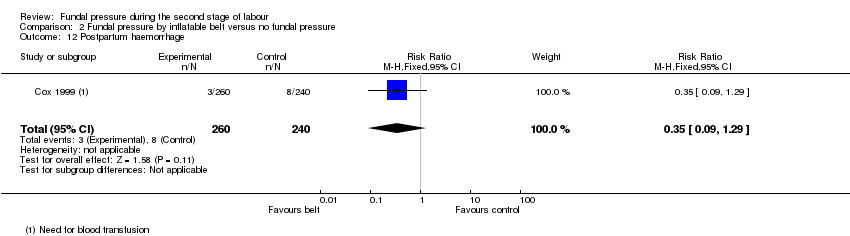
Comparison 2 Fundal pressure by inflatable belt versus no fundal pressure, Outcome 12 Postpartum haemorrhage.
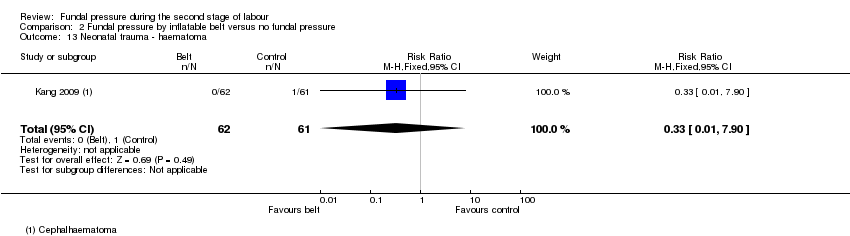
Comparison 2 Fundal pressure by inflatable belt versus no fundal pressure, Outcome 13 Neonatal trauma ‐ haematoma.
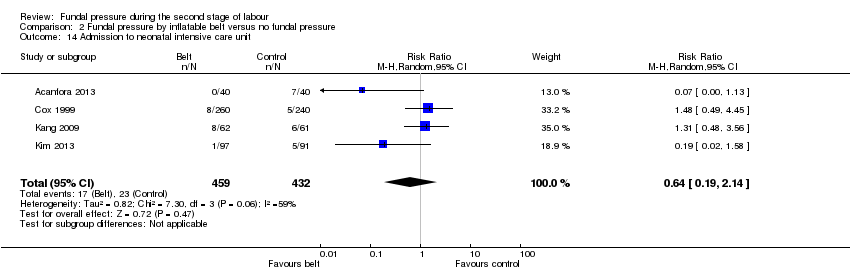
Comparison 2 Fundal pressure by inflatable belt versus no fundal pressure, Outcome 14 Admission to neonatal intensive care unit.

Comparison 2 Fundal pressure by inflatable belt versus no fundal pressure, Outcome 15 Sensitivity analysis: instrumental birth.

Comparison 2 Fundal pressure by inflatable belt versus no fundal pressure, Outcome 16 Sensitivity analysis: caesarean section.
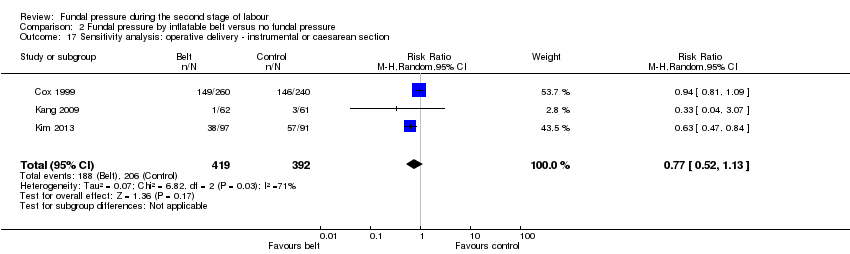
Comparison 2 Fundal pressure by inflatable belt versus no fundal pressure, Outcome 17 Sensitivity analysis: operative delivery ‐ instrumental or caesarean section.
| Manual fundal pressure compared to no fundal pressure for the second stage of labour | ||||||
| Patient or population: women with singleton pregnancy in vertex position in second stage of labour | ||||||
| Outcomes | Anticipated absolute effects* (95% CI) | Relative effect | № of participants | Quality of the evidence | Comments | |
| Risk with no fundal pressure | Risk with manual fundal pressure | |||||
| No spontaneous vaginal birth within a specified time, as defined by the trial authors | Study population | RR 0.96 | 120 | ⊕⊝⊝⊝ | Reported as "Time from bearing down to birth of head =/>30 min or operative delivery". Data may contain instrumental births and should be interpreted with due caution | |
| 613 per 1000 | 588 per 1000 | |||||
| Operative birth ‐ Instrumental or caesarean birth | Study population | Average RR 0.66 (0.12 to 3.55) | 317 (2 RCTs) | ⊕⊝⊝⊝ | ||
| 61 per 1000 | 33 per 1000 (12 to 92) | |||||
| Low arterial cord pH | Study population | RR 1.07 | 297 | ⊕⊝⊝⊝ | ||
| 172 per 1000 | 184 per 1000 | |||||
| APGAR score less than 7 at 5 minutes | Study population | Average RR 4.48 | 2759 | ⊕⊝⊝⊝ | ||
| 5 per 1000 | 23 per 1000 | |||||
| Duration of active second stage | No absolute effects Mean duration of labour 16.6 minutes | No absolute effects Mean duration of labour 17.4 minutes | The mean duration of second stage was 0.8 minutes shorter in the fundal pressure group (3.66 minutes shorter to 2.06 minutes longer) | 194 | ⊕⊝⊝⊝ | |
| Severe maternal morbidity or death | Study population | ‐ | (0 study) | ‐ | No trial reported this outcome | |
| See comment | See comment | |||||
| Neonatal death | Study population | ‐ | 2445 | ⊕⊝⊝⊝ | Zero neonatal deaths reported in both trials | |
| See comment | See comment | |||||
| *The risk in the intervention group (and its 95% confidence interval) is based on the assumed risk in the comparison group and the relative effect of the intervention (and its 95% CI). | ||||||
| GRADE Working Group grades of evidence | ||||||
| 1 Wide confidence interval crossing the line of no effect, few events and small sample size (‐2). | ||||||
| Fundal pressure by inflatable belt compared to no fundal pressure for second stage of labour | ||||||
| Patient or population: women with singleton pregnancy in vertex position in second stage of labour | ||||||
| Outcomes | Anticipated absolute effects* (95% CI) | Relative effect | № of participants | Quality of the evidence | Comments | |
| Risk with no fundal pressure | Risk with fundal pressure by inflatable belt | |||||
| No spontaneous vaginal birth within a specified time | Study population | ‐ | (0 study) | ‐ | No trial reported this outcome | |
| See comment | See comment | |||||
| Operative birth ‐ instrumental or caesarean section | Study population | Average RR 0.62 | 891 | ⊕⊝⊝⊝ | ||
| 516 per 1000 | 320 per 1000 | |||||
| Low arterial cord pH | Study population | RR 0.47 | 461 | ⊕⊕⊝⊝ | ||
| 18 per 1000 | 8 per 1000 | |||||
| Apgar score less than 7 after 5 minutes | Study population | RR 4.62 | 500 | ⊕⊝⊝⊝ | ||
| 0 per 1000 | 0 per 1000 | |||||
| Duration of second stage (minutes) | No absolute effects | No absolute effects | The average mean duration of second stage was 50.8 minutes shorter in the inflatable belt group (94.85 minutes shorter to 6.74 minutes shorter) | 253 (2 RCTs) | ⊕⊝⊝⊝ | Acanfora 2013: mean duration of second stage was 73.47 minutes shorter for women in the inflatable belt group (86.40 minutes shorter to 60.54 minutes shorter) Kim 2013: mean duration of second stage was 28.51 minutes shorter for women in the inflatable belt group (38.50 minutes shorter to 18.52 minutes shorter) |
| Severe maternal morbidity and death | Study population | ‐ | (0 study) | ‐ | No trial reported these outcomes | |
| See comment | See comment | |||||
| Neonatal death | Study population | ‐ | (0 study) | ‐ | No trial reported this outcome | |
| See comment | See comment | |||||
| *The risk in the intervention group (and its 95% confidence interval) is based on the assumed risk in the comparison group and the relative effect of the intervention (and its 95% CI). | ||||||
| GRADE Working Group grades of evidence | ||||||
| 1 Most studies contributing data had design limitations (‐1). | ||||||
| Outcome or subgroup title | No. of studies | No. of participants | Statistical method | Effect size |
| 1 No spontaneous vaginal birth within a specified time, as defined by the trial authors Show forest plot | 1 | 120 | Risk Ratio (M‐H, Fixed, 95% CI) | 0.96 [0.71, 1.28] |
| 2 Instrumental birth Show forest plot | 1 | 197 | Risk Ratio (M‐H, Fixed, 95% CI) | 3.28 [0.14, 79.65] |
| 3 Caesarean section Show forest plot | 1 | 197 | Risk Ratio (M‐H, Fixed, 95% CI) | 1.10 [0.07, 17.27] |
| 4 Operative birth ‐ instrumental or caesarean Show forest plot | 2 | 317 | Risk Ratio (M‐H, Random, 95% CI) | 0.66 [0.12, 3.55] |
| 5 Low arterial cord pH Show forest plot | 2 | 297 | Risk Ratio (M‐H, Fixed, 95% CI) | 1.07 [0.72, 1.58] |
| 6 Apgar score less than 7 at 5 minutes Show forest plot | 4 | 2759 | Risk Ratio (M‐H, Random, 95% CI) | 4.48 [0.28, 71.45] |
| 7 Duration of active second stage Show forest plot | 1 | 194 | Mean Difference (IV, Fixed, 95% CI) | ‐0.80 [‐3.66, 2.06] |
| 8 Episiotomy Show forest plot | 2 | 317 | Risk Ratio (M‐H, Fixed, 95% CI) | 1.18 [0.92, 1.50] |
| 9 Soft tissue damage ‐ perineal Show forest plot | 1 | 209 | Risk Ratio (M‐H, Fixed, 95% CI) | 6.42 [0.79, 52.37] |
| 10 Soft tissue damage ‐ vaginal laceration Show forest plot | 1 | 295 | Risk Ratio (M‐H, Fixed, 95% CI) | 1.24 [0.75, 2.03] |
| 11 Soft tissue damage ‐ cervical Show forest plot | 1 | 295 | Risk Ratio (M‐H, Fixed, 95% CI) | 4.90 [1.09, 21.98] |
| 12 Postpartum haemorrhage Show forest plot | 1 | 120 | Risk Ratio (M‐H, Fixed, 95% CI) | 1.87 [0.58, 6.06] |
| 13 Pain after enrolment as defined by trial authors Show forest plot | 1 | 209 | Risk Ratio (M‐H, Fixed, 95% CI) | 4.54 [2.21, 9.34] |
| 14 Neonatal trauma ‐ fractures Show forest plot | 1 | 209 | Risk Ratio (M‐H, Fixed, 95% CI) | 0.0 [0.0, 0.0] |
| 15 Neonatal trauma ‐ haematoma Show forest plot | 1 | 209 | Risk Ratio (M‐H, Fixed, 95% CI) | 0.0 [0.0, 0.0] |
| 16 Admission to neonatal intensive care unit Show forest plot | 1 | 295 | Risk Ratio (M‐H, Fixed, 95% CI) | 1.63 [0.40, 6.71] |
| 17 Neonatal death Show forest plot | 2 | 2445 | Risk Ratio (M‐H, Fixed, 95% CI) | 0.0 [0.0, 0.0] |
| 18 Sensitivity analysis: low arterial cord pH Show forest plot | 1 | 118 | Risk Ratio (M‐H, Fixed, 95% CI) | 1.07 [0.72, 1.58] |
| Outcome or subgroup title | No. of studies | No. of participants | Statistical method | Effect size |
| 1 Instrumental birth Show forest plot | 4 | 891 | Risk Ratio (M‐H, Random, 95% CI) | 0.73 [0.52, 1.02] |
| 2 Caesarean section Show forest plot | 4 | 891 | Risk Ratio (M‐H, Random, 95% CI) | 0.56 [0.14, 2.26] |
| 3 Operative birth ‐ instrumental or caesarean section Show forest plot | 4 | 891 | Risk Ratio (M‐H, Random, 95% CI) | 0.62 [0.38, 1.01] |
| 4 Low arterial cord pH Show forest plot | 1 | 461 | Risk Ratio (M‐H, Fixed, 95% CI) | 0.47 [0.09, 2.55] |
| 5 Apgar score less than 7 after 5 minutes Show forest plot | 1 | 500 | Risk Ratio (M‐H, Fixed, 95% CI) | 4.62 [0.22, 95.68] |
| 6 Duration of second stage Show forest plot | 2 | 253 | Mean Difference (IV, Random, 95% CI) | ‐50.80 [‐94.85, ‐6.74] |
| 7 Episiotomy Show forest plot | 3 | 811 | Risk Ratio (M‐H, Random, 95% CI) | 0.98 [0.86, 1.12] |
| 8 Soft tissue damage ‐ perineal Show forest plot | 4 | 897 | Risk Ratio (M‐H, Random, 95% CI) | 0.53 [0.20, 1.38] |
| 9 Soft tissue damage ‐ vaginal Show forest plot | 1 | 123 | Risk Ratio (M‐H, Fixed, 95% CI) | 0.74 [0.27, 2.00] |
| 10 Soft tissue damage ‐ anal sphincter Show forest plot | 1 | 500 | Risk Ratio (M‐H, Fixed, 95% CI) | 15.69 [2.10, 117.02] |
| 11 Soft tissue damage ‐ cervical/uterine Show forest plot | 2 | 203 | Risk Ratio (M‐H, Fixed, 95% CI) | 0.42 [0.06, 2.82] |
| 12 Postpartum haemorrhage Show forest plot | 1 | 500 | Risk Ratio (M‐H, Fixed, 95% CI) | 0.35 [0.09, 1.29] |
| 13 Neonatal trauma ‐ haematoma Show forest plot | 1 | 123 | Risk Ratio (M‐H, Fixed, 95% CI) | 0.33 [0.01, 7.90] |
| 14 Admission to neonatal intensive care unit Show forest plot | 4 | 891 | Risk Ratio (M‐H, Random, 95% CI) | 0.64 [0.19, 2.14] |
| 15 Sensitivity analysis: instrumental birth Show forest plot | 3 | 811 | Risk Ratio (M‐H, Random, 95% CI) | 0.81 [0.63, 1.04] |
| 16 Sensitivity analysis: caesarean section Show forest plot | 3 | 811 | Risk Ratio (M‐H, Random, 95% CI) | 0.80 [0.20, 3.19] |
| 17 Sensitivity analysis: operative delivery ‐ instrumental or caesarean section Show forest plot | 3 | 811 | Risk Ratio (M‐H, Random, 95% CI) | 0.77 [0.52, 1.13] |