Cardiotocografía continua (CTG) como forma de monitorización fetal electrónica para la evaluación fetal durante el trabajo de parto
Resumen
Antecedentes
La cardiotocografía (TG) registra los cambios en la frecuencia cardíaca fetal y su relación temporal con las contracciones uterinas. El objetivo es identificar a los fetos que pueden presentar una insuficiencia de oxígeno (hipoxia) para guiar evaluaciones adicionales del bienestar fetal o determinar si el feto debe ser extraído mediante cesárea o parto vaginal instrumentado. Ésta es una actualización de una revisión publicada previamente en 2013, 2006 y 2001.
Objetivos
Evaluar la efectividad y la seguridad de la cardiotocografía continua utilizada como un método de monitorización del bienestar fetal durante el trabajo de parto.
Métodos de búsqueda
Se realizaron búsquedas en el Registro de ensayos del Grupo Cochrane de Embarazo y Parto (Cochrane Pregnancy and Chilbirth Group) (30 de noviembre de 2016) y en las listas de referencias de los estudios recuperados.
Criterios de selección
Ensayos controlados aleatorios y cuasialeatorios que incluyan una comparación de la cardiotocografía continua (con y sin toma de muestra de sangre fetal) con ninguna monitorización fetal, auscultación intermitente o cardiotocografía intermitente.
Obtención y análisis de los datos
Dos revisores de forma independiente evaluaron la elegibilidad y la calidad de los estudios y extrajeron los datos de los estudios incluidos. Se verificó la exactitud de los datos.
Resultados principales
Esta revisión incluyó 13 ensayos que incluyeron a más de 37 000 mujeres. No se incluyeron nuevos estudios en esta actualización.
Un ensayo (4044 mujeres) comparó la CTG continua con la CTG intermitente, todos los demás ensayos compararon la CTG continua con la auscultación intermitente. No se encontraron datos que compararan ninguna monitorización fetal con la CTG continua. En general, la calidad metodológica fue mixta. Todos los estudios incluidos tuvieron un riesgo alto de sesgo de realización, un riesgo alto o incierto de sesgo de detección y un riesgo incierto de sesgo de informe. Tan solo dos ensayos fueron considerados con calidad metodológica alta.
Comparada con la auscultación intermitente, la cardiotocografía continua no mostró mejorías significativas en la tasa de mortalidad perinatal general (cociente de riesgos [CR] 0,86; intervalo de confianza [IC] del 95%: 0,59 a 1,23; n = 33 513; 11 ensayos, evidencia de calidad baja), pero se asoció con una reducción a la mitad de las tasas de crisis convulsivas neonatales (CR 0,50; IC del 95%: 0,31 a 0,80; n = 32 386; nueve ensayos, evidencia de calidad moderada). No hubo diferencias en las tasas de parálisis cerebral (CR 1,75; IC del 95%: 0,84 a 3,63; n = 13 252; dos ensayos, evidencia de calidad baja). Hubo un aumento de las cesáreas asociado con la CTG continua (CR 1,63; IC del 95%: 1,29 a 2,07; n = 18 861; 11 ensayos, evidencia de calidad baja). Además, fue más probable que las pacientes tuvieran un parto vaginal instrumentado (CR 1,15; IC del 95%: 1,01 a 1,33; n = 18 615; diez ensayos, evidencia de calidad baja). No hubo diferencias entre los grupos en la incidencia de acidosis de la sangre del cordón umbilical (CR 0,92, IC del 95%: 0,27 a 3,11, N = 2494, dos ensayos,evidencia de muy baja calidad) ni en las mujeres que utilizaron cualquier fármaco analgésico (CR 0,98, IC del 95%: 0,88 a 1,09, N = 1677, tres ensayos, evidencia de baja calidad).
En comparación con la CTG intermitente, la CTG continua no supuso ninguna diferencia en las tasas de cesárea (CR 1,29; IC del 95%: 0,84 a1,97, N = 4044, un ensayo) ni de partos instrumentados (CR 1,16; IC del 95%:0,92 a 1,46, N = 4044, un ensayo). Se observó menos acidosis de la sangre del cordón umbilical en mujeres con CTG intermitente, pero este resultado pudo haberse debido al azar (CR 1,43; IC del 95%:0,95 a 2,14, N = 4044, un ensayo).
Los datos de los subgrupos de embarazos prematuros de bajo riesgo, alto riesgo y ensayos de calidad alta fueron compatibles con los resultados generales. El acceso a la toma de muestra de sangre fetal no pareció influir en las diferencias en cuanto a las crisis convulsivas neonatales, ni en otros resultados.
La evidencia se evaluó mediante GRADE. La mayoría de los resultados se calificaron como evidencia de baja calidad (tasas de muerte perinatal, parálisis cerebral, cesárea, partos vaginales instrumentales y cualquier analgesia farmacológica) y se redujeron por las limitaciones en el diseño, la inconsistencia y la imprecisión de los resultados. Los resultados restantes se redujeron a calidad moderada (convulsiones neonatales) y muy baja calidad (acidosis de la sangre del cordón umbilical) debido a preocupaciones similares sobre las limitaciones en el diseño, la inconsistencia y la imprecisión.
Conclusiones de los autores
La CTG durante el trabajo de parto se asocia con una reducción de las tasas de crisis convulsivas neonatales, pero no hubo diferencias claras en la parálisis cerebral, la mortalidad infantil ni otras medidas estándar de bienestar neonatal. Sin embargo, la CTG continua se asoció con un aumento de las cesáreas y los partos vaginales instrumentados. El desafío es cómo expresar estos resultados a las pacientes para permitirles tomar una decisión informada, sin comprometer la normalidad del trabajo de parto.
La cuestión sigue siendo si los ensayos aleatorios futuros deben medir la eficacia (el valor intrínseco de la CTG continua para intentar prevenir los resultados neonatales adversos en condiciones clínicas óptimas) o la efectividad (el efecto de esta técnica en la práctica clínica habitual).
Junto con la necesidad de realizar estudios adicionales sobre los efectos a largo plazo de los partos quirúrgicos en mujeres y recién nacidos, queda mucho por aprender acerca de la causalidad y los posibles vínculos entre los eventos prenatales o intraparto, las convulsiones neonatales y los resultados del desarrollo neurológico a largo plazo, al tiempo que se consideran los cambios en la práctica clínica a lo largo de los años intermedios (apoyo individualizado durante el trabajo de parto, tasas de cesárea). El gran número de recién nacidos asignados al azar a los ensayos en esta revisión han alcanzado la edad adulta y podrían proporcionar una oportunidad única para aclarar si una reducción de las convulsiones neonatales es algo intrascendente que no debería influir en gran medida en las elecciones de las mujeres y los médicos, o si la reducción de las convulsiones conduce a beneficios a largo plazo para los recién nacidos. Definir resultados neurológicos y conductuales significativos que puedan medirse en grandes cohortes de adultos jóvenes plantea enormes desafíos. Sin embargo, es importante recopilar datos de estas mujeres y estos recién nacidos mientras aún existan historiales médicos, cuando sea posible, describir la movilidad y las posiciones de las mujeres durante el trabajo de parto y el parto, y aclarar si esto podría tener un impacto en los resultados. La investigación también debe abordar la posible contribución de la posición en decúbito a los resultados adversos para los recién nacidos y evaluar si el uso de la movilidad y las posiciones puede reducir aún más la baja incidencia de convulsiones neonatales y mejorar los resultados psicológicos para las mujeres.
PICO
Resumen en términos sencillos
Cardiotocografía continua (CTG) como forma de monitorización fetal electrónica para la evaluación fetal durante el trabajo de parto
¿Cuál es el problema?
¿La cardiotocografía (CTG) continua para monitorizar electrónicamente los latidos cardíacos y el bienestar de los recién nacidos durante el parto es mejor que la escucha intermitente para identificar los problemas?
¿Por qué es esto importante?
La monitorización de la frecuencia cardíaca fetal es una manera de comprobar el bienestar durante parto. La escucha y los registros de las pulsaciones del feto tienen el objetivo de identificar a los bebés con insuficiencia de oxígeno y que podrían beneficiarse de un parto temprano con cesárea o parto vaginal instrumentado.
La frecuencia cardíaca fetal se puede monitorizar de forma intermitente mediante un dispositivo especial con forma de trompeta o un dispositivo Doppler manual. También es posible verificar de forma continua la frecuencia cardíaca mediante una máquina de CTG. La CTG continua produce una cinta de papel con el registro de la frecuencia cardíaca del feto y las contracciones de parto de la madre. Aunque la CTG continua proporciona un registro escrito, las madres no pueden moverse libremente durante el parto, cambiar de posición fácilmente ni utilizar una piscina de parto para ayudar con la comodidad y el control durante el parto. También significa que algunos recursos tienden a centrarse en la necesidad de interpretar constantemente la CTG y no en las necesidades de la paciente de parto.
¿Qué pruebas se encontraron?
Se realizaron búsquedas de pruebas hasta el 30 de noviembre de 2016, pero no se encontraron estudios nuevos para esta actualización. Esta revisión incluye 12 ensayos que compararon la monitorización con CTG continua con la escucha intermitente, y un ensayo comparó la CTG continua con CTG intermitente. Los ensayos incluyeron a 37 000 mujeres en total. Ningún ensayo comparó la CTG continua con ninguna monitorización. La mayoría de los estudios se realizaron antes de 1994 y, aparte de dos, no fueron de alta calidad. La revisión se basó en un ensayo grande bien realizado de 1985 con casi 13 000 mujeres que recibieron atención directa durante todo el trabajo de parto. Las membranas maternas se rompieron artificialmente lo antes posible y en cerca de una cuarta parte de las pacientes se utilizó oxitocina para la estimular las contracciones.
En general, no hubo diferencias en el número de neonatos que murieron durante o poco después del parto (cerca de uno cada 300) (evidencia de calidad baja). Las convulsiones en los recién nacidos fueron muy poco frecuentes (cerca de una cada 500 nacimientos) (evidencia de calidad moderada) pero ocurrieron con menor frecuencia cuando se utilizó la CTG continua para monitorizar la frecuencia cardíaca fetal. No hubo diferencias en la tasa de parálisis cerebral (evidencia de calidad baja); sin embargo, no se han evaluado completamente otros posibles efectos a largo plazo y es necesario realizar estudios adicionales. La monitorización continua se asoció con un aumento significativo de partos por cesárea (evidencia de calidad baja) y partos vaginales instrumentados (evidencia de calidad baja). Aunque ambos procedimientos conllevan riesgos para las madres, no se evaluaron en los estudios incluidos.
No hubo diferencias entre los grupos en el número de acidosis de la sangre del cordón umbilical (evidencia de muy baja calidad), ni en las mujeres que utilizaron cualquier fármaco para el alivio del dolor (evidencia de baja calidad).
En comparación con la CTG intermitente, la CTG continua no supuso ninguna diferencia en cuántas mujeres recibieron cesáreas o partos instrumentales. Hubo menos acidosis de la sangre del cordón umbilical en mujeres con CTG intermitente, pero este resultado pudo haberse debido al azar.
¿Qué significa esto?
La mayoría de los estudios se realizaron hace muchos años y mostraron beneficios y problemas con ambos métodos de monitorización del bienestar del recién nacido durante el parto. La CTG continua se asoció con menos ataques para los recién nacidos, aunque no hubo diferencias en la parálisis cerebral; ambos fueron eventos poco frecuentes. Sin embargo, la CTG continua se asoció con un aumento de las cesáreas y los partos vaginales instrumentados, los cuales comportan riesgos para la madre. La CTG continua también dificulta el movimiento y el cambio de posición durante el parto y las mujeres no pueden utilizar una piscina de parto. Esto puede tener un impacto en las estrategias de afrontamiento de las mujeres. Las mujeres y sus médicos deben comentar las necesidades y deseos individuales de la mujer sobre el seguimiento del bienestar del bebé durante el trabajo de parto.
Las investigaciones futuras deben centrarse en los eventos que ocurren durante el embarazo y el trabajo de parto y que podrían ser la causa de problemas a largo plazo para el recién nacido.
Authors' conclusions
Summary of findings
| Continuous CTG versus intermittent auscultation for fetal assessment during labour | ||||||
| Patient or population: Pregnant women undergoing fetal assessment during labour | ||||||
| Outcomes | Illustrative comparative risks* (95% CI) | Relative effect | No of participants | Quality of the evidence | Comments | |
| Assumed risk | Corresponding risk | |||||
| Control | Continuous CTG versus intermittent auscultation | |||||
| Perinatal mortality | Study population | RR 0.86 | 33,513 | ⊕⊕⊝⊝ | ||
| 3 per 1000 | 3 per 1000 | |||||
| Moderate | ||||||
| 4 per 1000 | 3 per 1000 | |||||
| Neonatal seizures | Study population | RR 0.5 | 32,386 | ⊕⊕⊕⊝ | ||
| 3 per 1000 | 1 per 1000 | |||||
| Moderate | ||||||
| 4 per 1000 | 2 per 1000 | |||||
| Cerebral palsy | Study population | RR 1.75 | 13,252 | ⊕⊕⊝⊝ | ||
| 3 per 1000 | 4 per 1000 | |||||
| Moderate | ||||||
| 39 per 1000 | 68 per 1000 | |||||
| Caesarean section | Study population | RR 1.63 | 18,861 | ⊕⊕⊝⊝ | ||
| 36 per 1000 | 59 per 1000 | |||||
| Moderate | ||||||
| 66 per 1000 | 108 per 1000 | |||||
| Instrumental vaginal birth | Study population | RR 1.15 | 18,615 | ⊕⊕⊝⊝ | ||
| 102 per 1000 | 118 per 1000 | |||||
| Moderate | ||||||
| 222 per 1000 | 255 per 1000 | |||||
| Cord blood acidosis | Study population | RR 0.92 | 2494 | ⊕⊝⊝⊝ | ||
| 24 per 1000 | 22 per 1000 | |||||
| Moderate | ||||||
| 24 per 1000 | 22 per 1000 | |||||
| Any pharmacological analgesia | Study population | RR 0.98 | 1677 | ⊕⊕⊝⊝ | ||
| 754 per 1000 | 739 per 1000 | |||||
| Moderate | ||||||
| 805 per 1000 | 789 per 1000 | |||||
| *The basis for the assumed risk (e.g. the median control group risk across studies) is provided in footnotes. The corresponding risk (and its 95% confidence interval) is based on the assumed risk in the comparison group and the relative effect of the intervention (and its 95% CI). | ||||||
| GRADE Working Group grades of evidence | ||||||
| 1 Limitations in design: Most studies contributing data had design limitations (< 40% weight). | ||||||
Background
The baby's heart beat was first thought to be heard in utero in the middle of the seventeenth or eighteenth century (Grant 1989a; Gibb 1992), but it was not until the early nineteenth century that de Kergeradee suggested that listening to the baby's heartbeat might be clinically useful (Grant 1989a). De Kergeradee proposed that listening to the baby's heartbeat could be used to diagnose fetal life and multiple pregnancies, and wondered if it would be possible to assess fetal compromise from variations in the fetal heart rate (FHR). Since then, various methods of listening to the fetal heart have been developed and introduced into maternity care (Table 1), each with the aim of improving outcomes for babies and reducing the heartache for mothers and families when a baby dies or sustains long‐term disability. Today, monitoring the fetal heart during labour, by one method or another, appears to have become a routine part of care during labour, although access to such care varies across the world.
| Method | Description |
| Fetal stethoscope (Pinard) ‐ for intermittent monitoring (IA) | This is a trumpet‐shaped device, which is placed on the mother's abdomen and the caregiver listens for the heart beat at the other end. This is a simple instrument of relatively low cost |
| Hand‐held Doppler ultrasound monitor ‐ for intermittent monitoring (IA) | The device is placed on the mother's abdomen with gel smeared on the underside of the ultrasound transducer. This allows the ultrasound beam to travel from the fetal heart to the transducer without interruption |
| External cardiotocography ‐ for continuous or intermittent monitoring | The fetal heart rate and the activity of the uterine muscle are detected by two transducers placed on the mother's abdomen (one above the fetal heart and the other at the fundus). Doppler ultrasound provides the information which is recorded on a paper strip known as a cardiotocograph (CTG). |
| Internal cardiotocography ‐ for continuous monitoring | An electrode is placed directly on the baby's presenting part to detect the fetal ECG signal. Again the signals are recorded on a paper strip (CTG). This method can only be used if membranes (fore‐waters) have ruptured either spontaneously or artificially |
ECG: electrocardiogram
IA: intermittent auscultation
Description of the condition
The incidence of neonatal morbidity and mortality varies around the world, although direct comparisons may be difficult because of varying definitions and classifications. Nevertheless, large differences are reported between high‐income countries with average neonatal mortality rates (NMR) of four per 1000 live births) and low‐ or middle‐income countries with average NMRs of 33 per 1000 births) (Lawn 2005). Although most perinatal morbidity and mortality may not be prevented by improved fetal monitoring in labour (Nelson 1996), failure in identifying abnormal FHR patterns and lack of appropriate actions are considered to be significant contributing factors (MCHRC 1997; MCHRC 1998; MCHRC 1999).
Description of the intervention
The baby's heart rate can be monitored either intermittently (at regular intervals during labour) or continuously (recording the baby's heart rate throughout labour, stopping only briefly, such as for visits to the toilet) as follows.
Fetal stethoscope (Pinard) and hand‐held Doppler
Intermittent monitoring can be undertaken either by listening to the baby's heart rate using a fetal stethoscope (Pinard), or with a hand‐held Doppler ultrasound device, and by palpating the mother's uterine contractions by hand. This is known as intermittent auscultation.
Cardiotocograph (CTG)
The baby's heart rate and the mother's uterine contractions can be recorded electronically on a paper trace known as a cardiotocograph. This is done using a Doppler ultrasound transducer to monitor the baby's heart rate and a pressure transducer to monitor uterine contractions, both of which are linked to a recording device. This is known as external cardiotocography (external CTG) and is usually undertaken continuously in labour, although it is sometimes used intermittently (intermittent CTG). In most units, external CTG requires the mother to wear a belt across her abdomen during monitoring, which restricts her mobility. An alternative means of monitoring the baby's heart rate with the CTG machine is to attach an electrode directly to the baby's presenting part, usually the head. This form of continuous monitoring is known as internal CTG and requires a ruptured amniotic sac (either spontaneously or artificially) and a scalp electrode (clip) attached to the baby's head. This also restricts the woman's mobility.
The term electronic fetal monitoring (EFM) is sometimes used synonymously with CTG monitoring, but is considered to be a less precise term because CTG monitoring also includes monitoring the mother's contractions, and other forms of fetal monitoring might also be classed as 'electronic', such as fetal electrocardiograph or fetal pulse oximetry.
Intermittent auscultation was the predominant method of monitoring during labour until CTGs became widely used in the latter part of the twentieth century (Enkin 2000). Although there is a lack of empirical evidence on the optimal frequency of intermittent auscultation, there is a consensus in clinical guidelines that the fetal heart should be auscultated at least every 15 minutes in the first stage of labour and at least every five minutes in the second stage of labour (ACOG 2009; Liston 2007; NICE 2014; RANZCOG 2014) with each auscultation lasting at least 60 seconds (Liston 2007; NICE 2014). It appears that these auscultation protocols were developed initially in the context of clinical trials and were based on common sense rather than research evidence. Compliance with these guidelines, whilst maintaining contemporaneous records, poses a significant challenge for caregivers during labour who usually have multiple tasks to fulfil simultaneously.
Information and interpretation
Both intermittent auscultation and CTG provide information on the baseline heart rate (usually between 110 and 160 beats per minute in the term fetus), accelerations (transient increases in the FHR) and decelerations (transient decreases in the FHR). Some aspects of labour cause natural alterations in FHR patterns. For example, the baby's sleep FHR pattern differs from the waking FHR pattern. External stimuli, such as uterine contractions and the mother moving, can cause FHR changes, as can administration of opiates to the mother. Some of these changes are subtle and can only be detected by continuous CTG, such as baseline variability and temporal shape of decelerations. Consideration is needed about whether such information improves detection and outcomes for babies who are truly compromised and if there are technology‐related disadvantages for those who are not compromised.
Sensitivity and specificity
While specific abnormalities of the FHR pattern on CTG are proposed as being associated with an increased risk of cerebral palsy (Nelson 1996), CTG specificity to predict cerebral palsy is low, with a reported false positive rate as high as 99.8%, even in the presence of multiple late decelerations or decreased variability (Nelson 1996).
FHR pattern recognition, including the relationship between uterine contractions and FHR decelerations, are fundamental to the use of continuous CTG monitoring. Algorithms have been developed to assess and record what is normal, what requires more careful attention, and what is considered abnormal requiring immediate delivery of the baby (NICE 2014). However, CTG traces are often interpreted differently by different caregivers (inter‐observer variation) and even by the same caregiver interpreting the same record at different times (intra‐observer variation) (Devane 2005). Such variation in interpretation of CTG tracings may result in inappropriate interventions, or false reassurance and lack of appropriate intervention. Although we were unable to find studies that sought to investigate inter‐ and intra‐observer variation in intermittent auscultation, it would seem reasonable to suggest that intermittent auscultation is not immune to similar problems caused by inter‐ and intra‐observer variation. However, given that the FHR parameter of interest in intermittent auscultation is the baseline FHR, it is likely that inter‐ and intra‐observer variation is less in intermittent auscultation than that found in CTG interpretation where other aspects of FHR patterns including variability and assessment and deceleration classification require interpretation.
Additional tests
Fetal blood sampling is a procedure where a small amount of blood is taken from the baby, usually from the scalp. Performing fetal blood sampling and measuring the parameters of acid‐base balance (pH, base excess/deficit, etc) seeks to identify those babies who are truly compromised and need to be born immediately. It is important to establish the value of this test as an adjunct to CTG. This question was addressed in a subgroup analysis in this review.
Other methods have been considered as additional tests, but there is little evidence to support their use, for example, vibroacoustic stimulation (East 2013). Several other methods of fetal monitoring have been proposed, either as an adjunct or an alternative to CTG, such as pulse oximetry (Carbonne 1997; East 2007), near‐infrared spectroscopy (Mozurkewich 2000), fetal ECG (Neilson 2015), ST segment analysis of the fetal ECG (Luttkus 2004). and fetal stimulation tests (Skupski 2002).
Possible advantages of CTG
-
More measurable parameters related to FHR patterns.
-
The CTG trace gives a continuous recording of the FHR and uterine activity. This is a physical record, which can be examined at any time in labour, or subsequently, if required. The examples where physical records may be useful include clinical audits, counselling parents if there has been as adverse outcome, and medico‐legal situations.
Possible disadvantages of CTG
-
The complexity of FHR patterns makes standardisation difficult.
-
CTG prevents mobility and restricts the use of massage, different positions, or immersion in water used to improve comfort, control and coping strategies during labour.
-
Shifting staff focus and resources away from the mother may encourage a belief that all perinatal mortality and neurological injury can be prevented.
Specific situations that may influence the effectiveness or otherwise of CTG
-
Continuous CTG is generally recommended for women who are regarded as being at increased risk of perinatal morbidity and mortality (Liston 2007; NICE 2014; RANZCOG 2014). This review addressed the issue of differential effects of CTG in terms of risk status.
-
Induction of labour is primarily performed where it is anticipated that outcomes for mothers and infants would be improved were labour induced. Given that induction of labour includes iatrogenic stimulation of uterine activity, which puts the baby at greater risk, we determined to perform a subgroup analysis by induction of labour (NICE 2008).
-
Preterm birth is associated with an increased risk of mortality and neurological morbidity, and these babies might benefit from being monitored more intensively. Further, there is debate about what is normal for the different parameters of the CTG for preterm infants at varying gestational ages. Therefore, we performed a preterm subgroup analysis.
-
Twin pregnancies carry a higher perinatal mortality rate than singleton pregnancies (NICE 2011), thus we conducted a subgroup analysis by twin pregnancy.
Women's and professional views
Some studies looking at women's preferences found that the support that women received from staff and labour companions was more important to them than the type of monitoring used (Garcia 1985; Killien 1989). A more recent study of women's views of routine continuous CTG in labour in the UK identified a lack of discussion about the need for and appropriateness of CTG. In addition, women felt that CTG limited their mobility and led to an acceptance of the machine's place as the focus of attention for the woman and her partner (Munro 2004).
In a synthesis of 11 studies on professionals’ views of FHR monitoring during labour, Smith 2012 identified that despite an absence of evidence, maternity care professionals perceived the CTG as offering 'proof' of the compromised baby and that this minimises their exposure to criticism and potential litigation. Nevertheless, professionals also recognised that the CTG offered a false sense of security.
How the intervention might work
Although monitoring FHR changes during labour, it is hoped to identify those babies who may be compromised, or potentially compromised, by a shortage of oxygen (fetal hypoxia). If the shortage of oxygen is both prolonged and severe, babies are at risk of being born with a disability (physical, mental or both), or death during labour or shortly thereafter. When alterations in the FHR during labour suggest that the baby is hypoxic, or at risk of hypoxia, additional methods of assessment of fetal wellbeing (e.g. fetal blood sampling) may be used. Sometimes FHR alterations trigger delivery by caesarean section or use of instruments, such as forceps or vacuum extractor, even without recourse to additional diagnostic tests.
Why it is important to do this review
Concerns have been raised about the efficacy and safety of routine use of continuous CTG in labour (Thacker 1995). The apparent contradiction between the widespread use of continuous CTG with claims of its effectiveness in lowering early neonatal mortality and morbidity (Chen 2011) and recommendations to limit its routine use on all women (NICE 2014), indicates that a regular reassessment of this practice is warranted.
Several Cochrane reviews have addressed other methods for assessing the condition of the fetus during labour including fetal electrocardiogram/ECG (Neilson 2015); fetal pulse oximetry (East 2007); near‐infrared spectroscopy (Mozurkewich 2000) and vibroacoustic stimulation (East 2013). Also, the comparison of cardiotocography versus intermittent auscultation of fetal heart as an admission test on arrival to labour ward is assessed elsewhere (Devane 2017).
Objectives
To evaluate the effectiveness and safety of continuous cardiotocography (CTG) when used as a method to monitor fetal wellbeing during labour.
Methods
Criteria for considering studies for this review
Types of studies
All randomised trials and quasi‐randomised studies comparing continuous CTG during labour, with and without fetal blood sampling, with no fetal monitoring, intermittent auscultation of the fetal heart rate with a Pinard stethoscope or hand‐held Doppler ultrasound device, or intermittent CTG. Sensitivity analysis was undertaken for studies graded as low risk of bias based on sequence generation and allocation concealment.
Types of participants
Pregnant women in labour and their babies.
Types of interventions
The main intervention of interest was continuous CTG during labour.
For the purpose of this review, the intervention was defined as an attempt to produce a continuous and simultaneous hard‐copy recording of the fetal heart rate and uterine contractions in real time throughout the woman's labour. As a guide, continuous CTG should be discontinued only for short periods (for example, during visits to the toilet) and the CTG should be used for clinical decision making during labour.
Control groups of interest included: no fetal monitoring, intermittent auscultation of the fetal heart rate with a Pinard stethoscope or hand‐held Doppler ultrasound device, or intermittent CTG.
Types of outcome measures
Main outcomes
-
Perinatal mortality;
-
seizures in the neonatal period, either apparent clinically or detected by electro‐encephalographic recordings;
-
cerebral palsy;
-
caesarean section;
-
instrumental vaginal birth;
-
cord blood acidosis (low pH/low base excess as defined by trialists; where reports included a range of pH values we used cord pH < 7.10 as a cut off for acidosis); and
-
use of all forms of pharmacological analgesia during labour and birth (including epidural but excluding anaesthesia for caesarean section).
Other important outcomes
-
Hypoxic ischaemic encephalopathy (as defined by trialists);
-
neurodevelopmental disability assessed at 12 months of age or more. Neurodevelopmental disability, defined as any one or combination of the following: non‐ambulant cerebral palsy, developmental delay, auditory and visual impairment. Development should have been assessed by means of a previously validated tool, such as Bayley Scales of Infant Development (Psychomotor Developmental Index and Mental Developmental Index (Bayley 1993);
-
Apgar less than seven at five minutes;
-
Apgar less than four at five minutes;
-
admission to neonatal special care and/or intensive care unit;
-
fetal blood sampling;
-
damage/infection to baby's head from scalp electrode or fetal blood sampling;
-
caesarean section for abnormal fetal heart rate pattern and fetal acidosis or both;
-
instrumental vaginal birth for abnormal fetal heart rate pattern and fetal acidosis or both;
-
spontaneous vaginal birth not achieved;
-
epidural analgesia;
-
use of non pharmacological methods of coping with labour, e.g. transcutaneous electrical nerve stimulation, hydrotherapy;
-
amniotomy (artificial rupture of membranes);
-
oxytocin during labour;
-
perineal trauma requiring repair (including episiotomy);
-
inability to adopt preferred position during labour;
-
dissatisfaction with labour and perceived loss of control during labour or both;
-
postpartum depression;
-
exclusively breastfeeding at discharge from hospital; and
-
length of stay in neonatal special care and intensive care unit or both.
Search methods for identification of studies
The following section of this review was based on a standard template used by Cochrane Pregnancy and Childbirth.
Electronic searches
We searched Cochrane Pregnancy and Childbirth’s Trials Register by contacting their Information Specialist (30 November 2016).
The Register is a database containing over 22,000 reports of controlled trials in the field of pregnancy and childbirth. For full search methods used to populate Pregnancy and Childbirth’s Trials Register including the detailed search strategies for CENTRAL, MEDLINE, Embase and CINAHL; the list of handsearched journals and conference proceedings, and the list of journals reviewed via the current awareness service, please follow this link to the editorial information about the Cochrane Pregnancy and Childbirth in the Cochrane Library and select the ‘Specialized Register ’ section from the options on the left side of the screen.
Briefly, Cochrane Pregnancy and Childbirth’s Trials Register is maintained by their Information Specialist and contains trials identified from:
-
monthly searches of the Cochrane Central Register of Controlled Trials (CENTRAL);
-
weekly searches of MEDLINE (Ovid);
-
weekly searches of Embase (Ovid);
-
monthly searches of CINAHL (EBSCO);
-
handsearches of 30 journals and the proceedings of major conferences;
-
weekly current awareness alerts for a further 44 journals plus monthly BioMed Central email alerts.
Search results are screened by two people and the full text of all relevant trial reports identified through the searching activities described above is reviewed. Based on the intervention described, each trial report is assigned a number that corresponds to a specific Pregnancy and Childbirth review topic (or topics), and is then added to the Register. The Information Specialist searches the Register for each review using this topic number rather than keywords. This results in a more specific search set which has been fully accounted for in the relevant review sections (Included studies; Excluded studies; Studies awaiting classification).
[We carried out additional author searching in the Alfirevic 2006 version of this review. We subsequently chose not to repeat these additional searches because they yielded no additional studies.]
Searching other resources
We searched the reference lists of retrieved studies. We did not apply any language or date restrictions.
Data collection and analysis
For methods used in the previous version of this review, see Alfirevic 2013.
For this update, there were no reports identified as a result of the updated search. In future updates, the following methods will be used for assessing the reports that are identified as a result of the updated search.
The following methods section of this review is based on a standard template used by Cochrane Pregnancy and Childbirth.
Selection of studies
Two review authors independently assessed for inclusion all the potential studies identified as a result of the search strategy. We resolved any disagreement through discussion or, if required, we consulted a third review author.
Data extraction and management
We designed a form to extract data. For eligible studies, two review authors extracted the data using the agreed form. We resolved discrepancies through discussion or, if required, we consulted the third review author. Data were entered into Review Manager software (RevMan 2014) and checked for accuracy.
When information regarding any of the above was unclear, we planned to contact authors of the original reports to provide further details.
Assessment of risk of bias in included studies
Two review authors independently assessed risk of bias for each study using the criteria outlined in the Cochrane Handbook for Systematic Reviews of Interventions (Higgins 2011). Any disagreement was resolved by discussion or by involving a third review author.
(1) Random sequence generation (checking for possible selection bias)
We described the method used to generate the allocation sequence in sufficient detail to allow an assessment of whether it should produce comparable groups for each included study.
We assessed the method as:
-
low risk of bias (any truly random process, e.g. random number table; computer random number generator);
-
high risk of bias (any non‐random process, e.g. odd or even date of birth; hospital or clinic record number);
-
unclear risk of bias.
(2) Allocation concealment (checking for possible selection bias)
We described the method used to conceal allocation to interventions prior to assignment and assessed whether intervention allocation could have been foreseen in advance of, or during recruitment, or changed after assignment for each included study
We assessed the methods as:
-
low risk of bias (e.g. telephone or central randomisation; consecutively numbered sealed opaque envelopes);
-
high risk of bias (open random allocation; unsealed or non‐opaque envelopes, alternation; date of birth);
-
unclear risk of bias.
(3.1) Blinding of participants and personnel (checking for possible performance bias)
We described the methods used, if any, to blind study participants and personnel from knowledge of which intervention a participant received for each included study. We considered that studies were at low risk of bias if they were blinded, or if we judged that the lack of blinding unlikely to affect results. We assessed blinding separately for different outcomes or classes of outcomes.
We assessed the methods as:
-
low, high or unclear risk of bias for participants;
-
low, high or unclear risk of bias for personnel.
(3.2) Blinding of outcome assessment (checking for possible detection bias)
We described for each included study the methods used, if any, to blind outcome assessors from knowledge of which intervention a participant received. We assessed blinding separately for different outcomes or classes of outcomes.
We assessed methods used to blind outcome assessment as:
-
low, high or unclear risk of bias.
(4) Incomplete outcome data (checking for possible attrition bias due to the amount, nature and handling of incomplete outcome data)
For each included study, and for each outcome or class of outcomes, we described the completeness of data including attrition and exclusions from the analysis. We stated whether attrition and exclusions were reported and the numbers included in the analysis at each stage (compared with the total randomised participants), reasons for attrition or exclusion where reported, and whether missing data were balanced across groups or related to outcomes. Where sufficient information was reported, or could be supplied by the trial authors, we planned to re‐include missing data in the analyses.
We assessed methods as:
-
low risk of bias (e.g. no missing outcome data; missing outcome data balanced across groups);
-
high risk of bias (e.g. numbers or reasons for missing data imbalanced across groups; ‘as treated’ analysis done with substantial departure of intervention received from that assigned at randomisation);
-
unclear risk of bias.
(5) Selective reporting (checking for reporting bias)
We described how we investigated the possibility of selective outcome reporting bias and what we found for each included study.
We assessed the methods as:
-
low risk of bias (where it is clear that all of the study’s pre‐specified outcomes and all expected outcomes of interest to the review have been reported);
-
high risk of bias (where not all the study’s pre‐specified outcomes have been reported; one or more reported primary outcomes were not pre‐specified; outcomes of interest are reported incompletely and so cannot be used; study fails to include results of a key outcome that would have been expected to have been reported);
-
unclear risk of bias.
(6) Other bias (checking for bias due to problems not covered by points (1) to (5))
We described any important concerns we had about other possible sources of bias for each included study.
(7) Overall risk of bias
We made explicit judgements about whether studies were at high risk of bias, according to the criteria in the Handbook (Higgins 2011). With reference to points (1) to (6), we planned to assess the likely magnitude and direction of the bias and if we considered it was likely to impact on findings. In future updates, we will explore the impact of the level of bias through undertaking sensitivity analyses (see Sensitivity analysis).
Assessment of the quality of the evidence using the GRADE approach
For this update, the quality of the evidence was assessed using the GRADE approach as outlined in the GRADE handbook to assess the quality of the body of evidence relating to the following main outcomes for the main comparison (Continuous CTG versus intermittent auscultation for fetal assessment during labour).
-
Perinatal mortality;
-
seizures in the neonatal period, either apparent clinically or detected by electro‐encephalographic recordings;
-
cerebral palsy;
-
caesarean section;
-
instrumental vaginal birth;
-
cord blood acidosis (low pH/low base excess as defined by trialists; where report included a range of pH values we have used cord pH < 7.10 as a cut off for acidosis); and
-
use of all forms of pharmacological analgesia during labour and birth (including epidural but excluding anaesthesia for caesarean section).
GRADEpro Guideline Development Tool was used to import data from Review Manager 5.3 (RevMan 2014) to create a 'Summary of findings’ table. A summary of the intervention effect and a measure of quality for each of the outcomes was produced using the GRADE approach. The GRADE approach uses five considerations (study limitations, consistency of effect, imprecision, indirectness and publication bias) to assess the quality of the body of evidence for each outcome. The evidence can be downgraded from high quality by one level for serious (or by two levels for very serious) limitations, depending on assessments for risk of bias, indirectness of evidence, serious inconsistency, imprecision of effect estimates or potential publication bias.
Measures of treatment effect
Dichotomous data
For dichotomous data, we presented results as summary risk ratio with 95% confidence intervals.
Continuous data
We used the mean difference if outcomes were measured in the same way between trials. We used the standardised mean difference to combine trials that measured the same outcome, but used different methods.
Unit of analysis issues
Cluster‐randomised trials
No cluster‐randomised trials were identified for inclusion in this review. In future updates, we will include cluster‐randomised trials in the analyses along with individually randomised trials. We will adjust their sample sizes using the methods described in the Handbook (Section 16.3.4) using an estimate of the intracluster correlation co‐efficient (ICC) derived from the trial (if possible), from a similar trial or from a study of a similar population. If we use ICCs from other sources, we will report this and conduct sensitivity analyses to investigate the effect of variation in the ICC. If we identify both cluster‐randomised trials and individually‐randomised trials, we plan to synthesise the relevant information. We will consider it reasonable to combine the results from both if there is little heterogeneity between the study designs and the interaction between the effect of intervention and the choice of randomisation unit is considered to be unlikely.
We will also acknowledge heterogeneity in the randomisation unit and perform a sensitivity analysis to investigate the effects of the randomisation unit.
Cross‐over trials
Cross‐over trials are not a suitable trial design for this type of intervention.
Other unit of analysis issues
Multiple pregnancies
Outcomes for babies from the same pregnancy (twins or higher multiples) are not independent. For some outcomes (e.g. preterm birth) outcomes for babies from the same pregnancy are likely to be the same, or very highly correlated. For other outcomes there would be a lower correlation (e.g. fetal death or infant anomaly). We were unable to include any separate data for multiple pregnancies in the analysis, so did not make any adjustments. In future updates, to take account of the non‐independence of outcomes for babies from multiple pregnancies, we will treat each multiple pregnancy as a cluster and analyse data using methods described for cluster‐randomised trials. We will seek ICCs for outcomes for twins and higher multiples from trials (if available) from similar trials or from observational studies. Where published ICCs are not available, we will consult with experts in the field to estimate ICCs, and conduct sensitivity analysis using a range of ICC values.
Trials with more than two arms
We included one trial (Denver 1979) which had three treatment arms. For analysis of the main comparison and subgroups, we pooled results of the treatment arms (continuous CTG with fetal blood sampling (FBS), and continuous CTG without FBS) using the methods set out in the Handbook (Higgins 2011) to avoid double‐counting. In the subgroup analysis 6 (access to fetal blood sampling (FBS) during labour versus no access to FBS during labour), we reported the two trial arms separately and divided the control group in the analysis using the methods set out in the Handbook (Higgins 2011) to avoid double‐counting.
Dealing with missing data
Levels of attrition were noted for included studies. In future updates, if more eligible studies are included, the impact of including studies with high levels of missing data on the overall assessment of treatment effect will be explored in sensitivity analyses.
For all outcomes, analyses were carried out, as far as possible, on an intention‐to‐treat basis. That is, we attempted to include all participants randomised to each group in the analyses. The denominator for each outcome in each trial was the number of participants randomised minus any participants whose outcomes were known to be missing.
Assessment of heterogeneity
We assessed statistical heterogeneity in meta‐analyses using the Tau², I² and Chi² statistics. We regarded heterogeneity as substantial if I² was greater than 30% and either Tau² was greater than zero, or there was a low P value (< 0.10) in the Chi² test for heterogeneity. If we identified substantial heterogeneity (> 30%), we planned to explore it by pre‐specified subgroup analysis.
Assessment of reporting biases
Where there were 10 or more studies in the meta‐analysis we investigated reporting biases (such as publication bias) using funnel plots. We assessed funnel plot asymmetry visually. If asymmetry was suggested by a visual assessment, we performed exploratory analyses to investigate.
Data synthesis
We carried out statistical analysis using Review Manager software (RevMan 2014). We used fixed‐effect meta‐analysis for combining data where it was reasonable to assume that studies were estimating the same underlying treatment effect: that is, where trials were examining the same intervention, and the trials’ populations and methods were judged to be sufficiently similar.
If there was clinical heterogeneity sufficient to expect that the underlying treatment effects differed among trials, or if substantial statistical heterogeneity was detected, we used random‐effects meta‐analysis to produce an overall summary if an average treatment effect across trials was considered clinically meaningful. The random‐effects summary was to be treated as the average range of possible treatment effects and we planned to discuss the clinical implications of treatment effects differing among trials. If the average treatment effect was not clinically meaningful, we did not combine trials. If we used random‐effects analyses, the results were presented as the average treatment effect with 95% confidence intervals, and the estimates of Tau² and I².
Subgroup analysis and investigation of heterogeneity
If we identified substantial heterogeneity, it was investigated using subgroup and sensitivity analyses. We considered whether an overall summary was meaningful, and if it was, we used random‐effects analysis to produce the effect.
We carried out the following subgroup analyses:
-
high risk for perinatal mortality and morbidity (as defined by trialists) versus low risk (absence of identifiable risk factors associated with increased in perinatal mortality and morbidity as defined by trialists);
-
spontaneous onset of labour versus induction of labour;
-
preterm (less than 37 + 0 weeks) versus term (> 37 + 0 weeks);
-
singleton pregnancy versus twin pregnancy;
-
access to fetal blood sampling (FBS) during labour versus no access to FBS during labour;
-
primiparous versus multiparous.
Subgroup analysis was restricted to the review's main outcomes.
We assessed subgroup differences by interaction tests available within RevMan (RevMan 2014). We reported the results of subgroup analyses quoting the Chi² statistic and P value, and the interaction test I² value.
Sensitivity analysis
We carried out sensitivity analyses to explore the effect of trial quality assessed by concealment of allocation, high attrition rates, or both, with poor quality studies being excluded from the analyses to assess if this made any difference to the overall result. We also explored the effect of high and unclear quality studies on the analysis by performing interaction tests. This is documented in Comparison 8 in Effects of interventions.
Results
Description of studies
Results of the search
Our search strategy identified 383 citations corresponding to 17 studies for potential inclusion. Of those, 13 studies that involved a total of 37,715 women were included (Athens 1993; Copenhagen 1985; Dallas 1986; Denver 1976; Denver 1979; Dublin 1985; Lund 1994; Melbourne 1976; Melbourne 1981; New Delhi 2006; Pakistan 1989; Seattle 1987; Sheffield 1978) and four were excluded (Harare 1994; Ioannina 2001; Manchester 1982; North America 2000). In the 2016 update, Greece 2012 was also excluded. The updated search in November 2016 did not retrieve any further reports.
Included studies
Of the 13 included studies, two were quasi‐RCTs (Copenhagen 1985; Dallas 1986), two used block randomisation (Dublin 1985; Lund 1994), and six used individual randomisation (Athens 1993; Denver 1976; Denver 1979; Melbourne 1976; Melbourne 1981; Pakistan 1989). Three studies (New Delhi 2006; Seattle 1987; Sheffield 1978) did not provide details of randomisation processes.
Of the 13 included studies, 12 (N = 33,681 women) compared continuous CTG with intermittent auscultation (Athens 1993; Copenhagen 1985; Dallas 1986; Denver 1976; Denver 1979; Dublin 1985; Melbourne 1976; Melbourne 1981; New Delhi 2006; Pakistan 1989; Seattle 1987; Sheffield 1978). Five studies compared continuous CTG plus fetal blood sampling versus intermittent auscultation (Copenhagen 1985; Dublin 1985; Melbourne 1976; Pakistan 1989; Seattle 1987) and six compared continuous CTG without fetal blood sampling versus intermittent auscultation (Athens 1993; Dallas 1986; Denver 1976; Melbourne 1981; New Delhi 2006; Sheffield 1978). One study had three groups comparing continuous CTG with and without fetal blood sampling versus intermittent auscultation (Denver 1979). One study compared continuous CTG with fetal blood sampling versus intermittent CTG with fetal blood sampling (Lund 1994).
Participants were assessed as being at low risk of complications in four studies (Dallas 1986; Lund 1994; Melbourne 1981; Sheffield 1978) and outcome data for women at low risk were available for one outcome, neonatal seizures, from another study (Dublin 1985). Participants were assessed as being at high risk of complications in six studies (Denver 1976; Denver 1979; Melbourne 1976; New Delhi 2006; Pakistan 1989; Seattle 1987) including one study that specifically included women in preterm labour (28 to 32 weeks) and assessed outcomes for babies below 1750 g birthweight (Seattle 1987). The data for neonatal seizures in women at high risk of complications were available from one study (Dublin 1985). Participants were assessed as mixed risk (mixture of women at high risk and low risk of complications) in three studies (Athens 1993; Copenhagen 1985; Dublin 1985).
Five studies had overall caesarean section rates below 10% (Athens 1993; Copenhagen 1985; Dublin 1985; Melbourne 1981; Sheffield 1978). The highest overall caesarean section rates were reported in Pakistan 1989 (23.5%) and New Delhi 2006 (28%).
Table 2 shows additional descriptive information for all included studies.
| Study | 1 carer to 1 woman | Induction | ARM | Oxytocin | Mobility | Birth positions | Women's views | Social context | Experience of staff |
| Yes | Induction ‐ 11% overall | No information | Augmentation ‐ 46% overall | No mobility ‐ all women with IV line inserted | Semi‐Fowler or lateral | No information | No information | IA standard practice, EFM intensive training provided | |
| No information | No information | No information | No information | EFM only applied when women no longer wished to walk around | No information | No information | No information | No information | |
| 2 women: 1 nurse | Excluded women whose labours were induced | No information | Excluded women | No information | No information | No information | No information | No information | |
| IA: yes CTG: no information | Included women whose labours were induced | No information | Included women given oxytocin for augmentation | No information | No information | No information | No information | No information | |
| Yes | No specific information | No information | 29% of women given oxytocin for augmentation | No information | No information | No information | No information | No information | |
| Yes | Included women whose labours were induced | ARM within an hour of admission to check liquor | 23% of women given oxytocin for augmentation | IA, probably more mobile | No information | Women's views sought and published separately | No information | No information | |
| No information | Included women whose labours were induced | No information | 48% of women were given ocytocin for induction or acceleration | Women in CTG group offered telemetry if wished mobility | No information | No information | No information | No information | |
| No information | Induction ‐ 42% overall | No information | 63% of women given oxytocin in labour | No information | No information | No information | No information | Exp staff. | |
| No information | No information | ARM when in established labour or for obstetric reasons | No information | No information | No information | No information | No information | No information | |
| No information | No information | No information | No information | No information | No information | No information | No information | No information | |
| No information | No information | No information | No information | No information | No information | No information | No information | No information | |
| Yes | No information | ARM at 7 cm unless clinically indicated prior to 7 cm | Included women given oxytocin | No information | No information | Women's views sought and published separately. | No information | No information | |
| No information | Included women whose labours were induced | Augmentation with ARM alone or in combination with oxytocin if progress fell below nomogram | Oxytocin was administered to all women as indicated | No information | No information | No information | No information | No information |
ARM: artificial rupture of membranes
CTG: cardiotocography
EFM: electronic fetal monitoring
IA: intermittent auscultation
IV: intravenous
Excluded studies
We excluded five studies (Characteristics of excluded studies). Of these, three studies (Greece 2012; Harare 1994; North America 2000) were excluded because the interventions compared did not meet our inclusion criteria; one study was non‐randomised (Ioannina 2001); and one study did not report any data for the control group (Manchester 1982).
Risk of bias in included studies
See Figure 1 for a summary of risk of bias assessments.

Methodological quality summary: review authors' judgements about each methodological quality item for each included study
Allocation
Allocation concealment was assessed as low risk of bias in three trials (Dublin 1985; Lund 1994; Melbourne 1976); unclear in six trials (Copenhagen 1985; Denver 1976; Denver 1979; New Delhi 2006; Seattle 1987; Sheffield 1978); and high risk in four trials (Athens 1993; Dallas 1986; Melbourne 1981; Pakistan 1989).
Blinding
Blinding of participants and personnel was assessed as high risk of bias in all 13 studies. Blinding of outcome assessment was assessed as unclear in all but one study where it was assessed as high risk of bias (Athens 1993).
Incomplete outcome data
Attrition bias was graded as low risk in eight trials (Athens 1993; Copenhagen 1985; Denver 1976; Denver 1979; Dublin 1985; Lund 1994; New Delhi 2006; Pakistan 1989); unclear in three trials (Dallas 1986; Melbourne 1976; ; Sheffield 1978); and high risk in two trials (Melbourne 1981; Seattle 1987).
Selective reporting
This was assessed as 'unclear risk of bias' in all 13 studies as we did not have access to any of the trial protocols.
Other potential sources of bias
All 13 studies were considered at low risk for other potential sources of bias.
Effects of interventions
Continuous cardiotocography (CTG) versus intermittent auscultation (IA) (Comparisons 1 to 8)
A total of 13 randomised trials were included in this comparison with over 33,000 women participating (Athens 1993; Copenhagen 1985; Dallas 1986; Denver 1976; Denver 1979; Dublin 1985; Melbourne 1976; Melbourne 1981; New Delhi 2006; Pakistan 1989; Seattle 1987; Sheffield 1978). Denver 1979 was a three‐arm trial comparing continuous CTG alone, versus continuous CTG plus fetal bood sampling (FBS) versus intermittent auscultation.
Main outcomes
For the infant
There was no significant difference in perinatal mortality between the groups. Risk ratio (RR) was 0.86 with, 95% confidence intervals (CIs) ranging from 0.59 to 1.24, N = 33,513, 11 trials, (Analysis 1.1). The funnel plot analysis indicated no missing studies (Figure 2). The quality of the evidence for this outcome was assessed as moderate (summary of findings Table for the main comparison).

Funnel plot of comparison: 1 Continuous CTG versus intermittent auscultation, outcome: 1.1 Perinatal mortality (main outcome)
The use of continuous CTG monitoring in labour halved the risk of neonatal seizures (RR 0.50, 95% CI 0.31 to 0.80, N = 32,386, 9 trials, Analysis 1.2). The funnel plot indicated no missing studies (Figure 3) and the quality of the evidence was assessed as moderate (summary of findings Table for the main comparison). This reduction was consistent across the trials and subgroups, although the incidence of neonatal seizures varied considerably among trials. In the two largest trials of 14,618 women (Dallas 1986) and 12,964 women (Dublin 1985), the incidence of neonatal seizures in the intermittent auscultation groups was 0.04% and 0.4% respectively (Analysis 1.2). In the two high‐quality trials reporting data for this outcome (Dublin 1985; Melbourne 1976), the risk of neonatal seizures was RR 0.40, 95% CI 0.21 to 0.77 (Analysis 8.2).

Funnel plot of comparison: 1 Continuous CTG versus intermittent auscultation, outcome: 1.2 Neonatal seizures (main outcome)
There was no difference in the incidence of cerebral palsy (average RR 1.75, 95% CI 0.84 to 3.63, N = 13,252, 2 trials, random‐effects, Analysis 1.3). The quality of the evidence was assessed as moderate (summary of findings Table for the main comparison). The data on cerebral palsy are heavily influenced by one small trial (Seattle 1987) that randomised only very preterm babies (less than 32 weeks) and assessed outcomes for 173 babies of birthweight less than 1750 g with a cerebral palsy rate of 19.5% in the CTG group compared with 7.7% in the controls (RR 2.54, 95% CI 1.10 to 5.86). The other trial in this comparison (Dublin 1985) showed no significant difference in the incidence of cerebral palsy (RR 1.20, 95% CI 0.52 to 2.79, N = 13,079) with a cerebral palsy rate of 0.18% in the continuous CTG group and 0.15% in the intermittently monitored group.
There was no difference in the incidence of cord blood acidosis between the groups (Analysis 1.6). The quality of the evidence was assessed as very low, mainly due to very significant heterogeneity and design limitations in many of the included studies (summary of findings Table for the main comparison).
For the mother
There was a significant increase in the caesarean section rate in the CTG group (average RR 1.63, 95% CI 1.29 to 2.07, 18,861, 11 trials, Analysis 1.4). However, the quality of this evidence was assessed as low, mainly due to very significant heterogeneity and study design limitations (summary of findings Table for the main comparison). Risk difference in the caesarean section rate was 5% (95% CI 2% to 8%), with two‐thirds of data coming from Dublin 1985, where the overall caesarean section rate was 2.3%. In addition, the funnel plot indicated the possibility of missing studies (Figure 4).

Funnel plot of comparison: 1 Continuous CTG versus intermittent auscultation, outcome: 1.4 Caesarean section (main outcome)
Although numbers needed to treat to benefit or harm (NNTB/NNTH) analyses remain controversial in the context of meta‐analysis and should be interpreted with caution, we calculated that there would be one additional caesarean section for every 44 women monitored continuously (95% CI 26 to 96). This calculation was based on the pooled caesarean section rate of 3.6% (337/9313) in the intermittent auscultation group from this meta‐analysis. However, in most settings caesarean section rates are likely to be much higher. Assuming a caesarean section rate with intermittent auscultation of around 15%, there would be an additional caesarean section for every 11 women monitored (95% CI 7 to 23).
Continuous CTG was also associated with an increase in instrumental vaginal birth (Analysis 1.5). The funnel plot indicated that some studies might be missing (Figure 5). The quality of this evidence was assessed as low, mainly due to very significant heterogeneity and study design limitations (summary of findings Table for the main comparison). There was no difference identified in the use of any pharmacological analgesia (Analysis 1.7), with the quality of the evidence assessed as low (summary of findings Table for the main comparison).

Funnel plot of comparison: 1 Continuous CTG versus intermittent auscultation, outcome: 1.5 Instrumental vaginal birth (main outcome)
Other important outcomes
For the infant
There was no evidence of any other benefit or harm for babies in terms of hypoxic Ischaemic encephalopathy (Analysis 1.8), Apgar scores (Analysis 1.10), or admission to neonatal intensive care unit (Analysis 1.12).
For the mother
Women in the continuous CTG group were more likely to have a caesarean section for abnormal fetal heart rate, acidosis or both (Analysis 1.15) and less likely to have a spontaneous vaginal birth (Analysis 1.17). There was no difference in the use of epidural analgesia (Analysis 1.18). The use of fetal blood sampling was reported in two trials (Copenhagen 1985; Dublin 1985) with significantly more sampling tests performed in the continuous CTG group (Analysis 1.13). There were no reported data suitable for analysis for the use of non‐pharmacological methods for coping with labour, amniotomy, perineal trauma, inability to adopt preferred position in labour, dissatisfaction in labour and postpartum depression.
Overall findings
Notwithstanding the caution regarding NNTB/NNTH calculations, when the risk of neonatal seizures is around 3 per 1000, 667 women would have to be continuously monitored during labour to prevent one such seizure (95% CI 484 to 1667). There is an opposite effect on caesarean section. Assuming a 3.6% caesarean section rate with intermittent auscultation, there would be 15 more caesarean sections in this cohort associated with preventing one neonatal seizure. However, if caesarean section with intermittent auscultation is higher (15%), 61 extra caesarean sections would be associated with preventing one neonatal seizure.
Continuous CTG versus intermittent auscultation (Subgroup: pregnancy risk status ‐ high/low/unclear or both ‐ Comparison 2)
Of the 12 studies that compared continuous CTG with intermittent auscultation, six included women at increased risk of complications (Denver 1976; Denver 1979; Melbourne 1976; New Delhi 2006; Pakistan 1989; Seattle 1987), three included women at low risk of complications (Dallas 1986; Melbourne 1981; Sheffield 1978) and three studies included both groups of women or did not specify (Athens 1993; Copenhagen 1985; Dublin 1985). There was a significant difference in the impact of CTG monitoring on caesarean section rate depending on the risk status of women (P = 0.004; I² = 81.6%), although heterogeneity can be attributed to the group with combined risk rather than to the subgroups where the risk was clearly defined. There were no other statistically significant differences between the subgroups for any other main outcomes.
Subgroups analysis by onset of labour (spontaneous/induced/unclear or both ‐ Comparison 3)
None of the included trials provided separate data for spontaneous and induced labours. Hence, there is no information to determine if there might be a difference in the impact of CTG for women in spontaneous labour compared with those with induction of labour.
Subgroup analysis by gestational age (preterm/term/unclear or both ‐ Comparison 4)
Of the 12 studies that compared continuous CTG with intermittent auscultation, one included only preterm labours (Seattle 1987). Three studies included only term labours (Copenhagen 1985; Melbourne 1981; Sheffield 1978) and eight studies included both or did not specify (Athens 1993; Dallas 1986; Denver 1979; Denver 1979; Dublin 1985; Melbourne 1976; New Delhi 2006; Pakistan 1989). We found no evidence of a difference between subgroups.
Subgroup analysis by number of babies being monitored (singleton/twin pregnancy/unclear or both ‐ Comparison 5)
Eight studies included only singleton pregnancies (Athens 1993; Dallas 1986; Denver 1976; Melbourne 1981; New Delhi 2006; Pakistan 1989; Seattle 1987; Sheffield 1978) and four included both singleton and twin pregnancies or did not specify (Copenhagen 1985; Denver 1979; Dublin 1985; Melbourne 1976). There was a significant subgroup effect for the rate of neonatal acidosis (P = 0.04; I² = 77%) with more acidosis in CTG monitored singletons and less in CTG monitored twins. There was also a subgroup difference in the use of pharmacological analgesia (P = 0.02; I² = 83%), but the data were only available for singletons and mixed group with no data for twins only. There were no subgroup differences for the other main outcomes.
Subgroup analysis by access to fetal blood sampling during labour (Comparison 6)
Six studies offered fetal blood sampling alongside the CTG (Copenhagen 1985; Dublin 1985; Melbourne 1976; Melbourne 1981; Pakistan 1989; Seattle 1987), five studies did not use fetal blood sampling (Athens 1993; Dallas 1986; Denver 1976; New Delhi 2006; Sheffield 1978) and one study randomised to three groups, CTG with fetal blood sampling, CTG alone and intermittent auscultation (Denver 1979).
There was a significant subgroup effect on instrumental vaginal birth with apparently more instrumental deliveries (P = 0.04; I² = 77%), but less neonatal acidosis (P = 0.04; I² = 76.5%) in the fetal blood sampling subgroup. However, there were no subgroup differences for the other main outcomes.
Subgroups by parity (primiparous/multiparous women/unclear or both ‐ Comparison 7)
None of the studies included only primiparous women, one study included only multiparous women (New Delhi 2006) and 11 studies included both primiparous and multiparous women (Athens 1993; Copenhagen 1985; Dallas 1986; Denver 1976; Denver 1979; Dublin 1985; Melbourne 1976; Melbourne 1981; Pakistan 1989; Seattle 1987; Sheffield 1978). As only one of these studies reported results based on the parity of the women involved, it was not possible to perform a meaningful subgroup analysis.
Continuous CTG versus intermittent auscultation (sensitivity analysis: high/low/unclear quality of studies ‐ Comparison 8)
Of the 12 studies that compared continuous CTG with intermittent auscultation, two were considered to be of high methodological quality (Dublin 1985; Melbourne 1976), four studies where considered to be low methodological quality (Athens 1993; Dallas 1986; Melbourne 1981; Pakistan 1989) and methodological quality was unclear for six studies (Copenhagen 1985; Denver 1976; Denver 1979; New Delhi 2006; Seattle 1987; Sheffield 1978).
Removing the low quality trials made very little difference to the analysis for perinatal mortality (Analysis 8.1), neonatal seizures (Analysis 8.2), caesarean section (Analysis 8.4), and instrumental vaginal birth (Analysis 8.5). There were no low quality trials contributing to the cerebral palsy (Analysis 8.3) or any pharmacological analgesia (Analysis 8.7) analyses. Only two studies, one high quality (Dublin 1985) and one low quality (Athens 1993), contributed to the analysis for cord blood acidosis (Analysis 8.6). Removing data from Athens 1993 caused the direction of effect to change in favour of continuous CTG; however, the confidence interval still crossed the line of no effect.
We also investigated the differences between high risk, low risk, and unclear risk trials by interaction tests. It appeared that in a high‐quality trial, there was less cord blood acidosis compared with low‐quality trials (P = 0.04; I² = 76.5%). There was significant subgroup heterogeneity for instrumental vaginal birth (P = 0.007; I² = 79.9%), but no clear difference between high‐ and low‐risk subgroups.
Continuous CTG versus intermittent CTG (Comparison 9)
Lund 1994 involved 4044 high‐risk pregnant women and found no clear differences between groups for eight of the outcomes specified in this review: caesarean section (Analysis 9.1) instrumental vaginal birth (Analysis 9.2); cord blood acidosis (Analysis 9.3); Apgar score less than seven at five minutes (Analysis 9.4); neonatal ICU admissions (Analysis 9.5); caesarean section for abnormal fetal heat rate pattern and/or fetal acidosis (Analysis 9.6); spontaneous vaginal birth (Analysis 9.7); or epidural anaesthesia (Analysis 9.8).
Discussion
Summary of main results
The main reason for the introduction of continuous intrapartum cardiotocography (CTG) monitoring in clinical practice was a belief that it would reduce rare but devastating outcomes ‐ perinatal death and neonatal hypoxic brain injury ‐ in otherwise healthy babies. However, we found no clear difference in perinatal deaths between pregnancies monitored during labour with continuous CTG compared to those monitored using intermittent auscultation. The overall quality of evidence that underpins this conclusion has been judged as moderate (summary of findings Table for the main comparison). It does, however, seem unrealistic to expect that any randomised study of intrapartum interventions in modern maternity care will result in an improvement in perinatal deaths that reaches the conventional level of statistical significance (superiority). For a trial to test a realistic hypothesis that continuous CTG can prevent one death in one thousand births (0.1%), more than 50,000 women would have to be randomised. Therefore, it is more logical to concentrate on short‐ and long‐term childhood morbidity. Unfortunately, very few clinically‐relevant neonatal outcomes have been reported consistently in all trials.
For decades, low Apgar scores have been used as a surrogate measure for birth asphyxia and subsequent adverse neurodevelopmental outcomes. Recent evidence has confirmed a strong association between low Apgar score (at five minutes after birth) and cerebral palsy in both low and normal birthweight infants (Lie 2010). We found no evidence that use of continuous intrapartum CTG monitoring has an impact on Apgar score. However, there were very few babies with clinically significant low Apgar scores in studies that assessed this outcome. Therefore, potentially important differences between the groups cannot be ruled out.
Hypoxic ischaemic encephalopathy, a more robust measure of hypoxic brain injury, was reported in only one study (Athens 1993). In the absence of any meaningful long‐term follow‐up data, the impact of continuous CTG monitoring on a neonate can only be evaluated based on data from two clinically important outcomes, that is, neonatal seizures and cerebral palsy.
For both neonatal seizures and cerebral palsy, most data were provided by Dublin 1985. At first glance, the data appear contradictory. There was a significant reduction in neonatal seizures in the continuous CTG group, but no impact on cerebral palsy. If anything, the rates of cerebral palsy appear to be higher in the continuous CTG group, although the pooled result did not reach statistical significance. This apparent increase in cerebral palsy in children monitored by CTG comes from Seattle 1987. However, the results from this study, the only study of CTG monitoring during preterm labour, are not significant using 99% confidence intervals. In addition, this study excluded infants with birthweights of more than 1750 g (34% of randomised cohort), which may be a source of bias. Given that all other outcomes in this trial, including caesarean section rates, neonatal seizures and deaths were almost identical, this may have been a chance finding and should be interpreted with caution.
It is now generally accepted that cerebral palsy is more often caused by antepartum, rather than intrapartum, events (Palmer 1995). Therefore, it may be unrealistic to expect that intrapartum interventions will have the capacity to achieve a significant reduction in cerebral palsy. There are, clearly, some cases of cerebral palsy that are a direct consequence of intrapartum hypoxic injury. These cases are very rare, and systematic reviews of randomised trials are unlikely to have sufficient power to test intrapartum CTG as a method to reduce cerebral palsy caused by acute and avoidable intrapartum events.
The reduction in seizures associated with continuous CTG monitoring is important, but must be interpreted cautiously in the absence of good quality long‐term follow‐up data. It has been suggested that seizures may be a "sentinel event" of a peripartum adversity that does not necessarily always manifest itself as hypoxic encephalopathy (Dennis 1978; Derham 1985, Keegan 1985; Lien 1995; Spellacy 1985). When asphyxia, infection, brain malformations and metabolic causes are excluded, some neonatal seizures are associated with cerebral infarction or neonatal stroke (Estan 1997; Lien 1995). Although the underlying causes are not well understood, neonatal seizures may have long‐term consequences other than cerebral palsy. One longitudinal study found that some babies who had neonatal seizures were classified as normal at five years and had normal overall intelligence in adolescence as assessed by IQ tests, but had some abnormal results on detailed neuropsychological testing (Temple 1995). Clearly, there is a need for comprehensive long‐term follow‐up of the randomised cohorts that is not limited to extreme adverse outcomes such as cerebral palsy, but also includes more subtle neuropsychological assessment.
The results of this review demonstrate that continuous CTG monitoring leads to an increase in caesarean sections. Such an effect of continuous CTG is clinically plausible because CTG monitoring leads to more interventions (e.g. fetal blood sampling, amniotomy) and more diagnoses of presumed fetal compromise for which emergency caesarean section is seen as the only safe management option. However, the overall quality of evidence for this outcome was judged as low (summary of findings Table for the main comparison). Therefore, the observed increase must be interpreted cautiously.
It is noteworthy that size and direction of the effect on caesarean section was consistent for prespecified subgroups, including high‐quality trials and trials where clinicians had access to intrapartum fetal blood sampling. Subgroup interaction test was only significant (I² = 81.6%) for studies in low‐risk, high‐risk and mixed risk status, but heterogeneity came from a mixed group. The impact of CTG monitoring on caesarean section in low‐risk and high‐risk populations appears to be virtually identical, which is contrary to recommendations from many professional bodies providing guidance on intrapartum fetal monitoring.
There was some evidence that labour was more painful in the continuous CTG group, but the statistically significant increase in the need for any analgesia included general anaesthesia. Therefore, it is likely that this difference was caused by an increase in the number of caesarean sections, rather than necessarily more painful labour. Women report more pain when lying on their backs during labour. At the times when the studies in this review were undertaken (between 1976 and 1994), women in the intermittent auscultation group may well also have been on their backs and not using mobility and positions to help them with their labours. There were no data from the trials included in the review to enable analysis of this potential confounder.
We prespecified several subgroups that could have been expected to influence the direction and size of the differences compared with results when all trials were considered together. We were conscious that any differences among subgroups and overall results would have to be interpreted with extreme caution (Rothwell 2005). With this proviso, we found no subgroup differences of clinical importance, but the number of trials and women in subgroups was relatively small.
Overall completeness and applicability of evidence
Clearly, the lack of long‐term follow‐up data and inadequate reporting of the data according to the clinically important subgroups is regrettable and limits the applicability of the evidence.
There are also two other issues that should be considered in the applicability of the evidence reviewed here:
-
Methods of intermittent ascultation differed among included trials regarding frequency, duration and timing in relation to contractions; some recorded fetal heartbeat during and after contractions, others immediately following contractions, and others were not specific (Table 3). The trials also differed in additional assessments of fetal wellbeing. For example, in Dublin 1985, which is a large contributor of meta‐analysis weight across most review outcomes, all women had an artifical rupture of membranes performed within an hour of admission. In addition to routine artifical rupture of membranes, in Dublin 1985 fetal blood sampling was performed for all women who had not delivered within eight hours (1.2% of women in the CTG group and 2.1% of women in the intermittent auscultation group). Such practices may be less generalisable to current approaches to care of women during labour.
-
With the exception of New Delhi 2006, all included studies were conducted in the 1970s, 1980s, and early 1990s. Since then, there have been substantial developments in equipment used to perform cardiotocography and a strong emphasis on education for all those involved in CTG interpretation (which in some jurisdictions is mandatory), and continuous review and refinement of interpretation criteria. Nevertheless, most technological developments in intrapartum assessment of fetal wellbeing, including for example, ST waveform analysis (Neilson 2015), expert systems (Lutomski 2015) and computerised analysis have not shown substantive clinical benefits. In addition, there was insufficient evidence available to demonstrate a substantial benefit for applied artificial intelligence, such as expert systems, in improving interpretation of fetal heart rate tracings (Lutomski 2015). This might suggest that the data related to the impact of CTG monitoring is still relevant to current practice.
| Study | Intermittent auscultation details | Additional details | |||||||
| Method | Frequency | Before / during / following contraction; | ARM | Oxytocin | FBS | Admission CTG | Risk level | 1 carer to 1 woman | |
| Sonicaid | First stage: At least every 15 minutes Second stage: Every 5 minutes | During and following. Duration: For 1 min including at least 30 seconds after the contraction | No information | Augmentation ‐ 46% overall | No | No information | High and low risk | Yes | |
| No information | First stage: At least 15 s twice an hour up to 5 cm. Above 5 cm every 15 minutes Second stage: After every contraction | Following. Duration: 30 seconds | No information | No information | No information | No information | High and low risk | No information | |
| Hand‐held device | First stage: Every 30 minutes Second stage: No information | No information | No information | Excluded women given oxytocin for augmentation | No information | No information | Low and high risk | 2 women: 1 nurse | |
| No information | First stage: Every 15 minutes Second stage: every 5 minutes | Following. Duration: 30 seconds | No information | Included women given oxytocin for augmentation | No information | No information | High risk | IA: yes CTG: no information | |
| No information | First stage: Every 15 minutes Second stage: every 5 minutes | Following. Duration: 30 seconds | No information | 29% of women given oxytocin for augmentation | No | No information | High risk | Yes | |
| Pinard unless difficult then used Doppler ultrasound | First stage: Every 15 minutes Second stage: Every interval between contractions | Following. Duration: 1 minute | ARM within an hour of admission to check liquor | 23% of women given oxytocin for augmentation | When labour > 8 hours. CTG: 77/6474 (1.2%) IA: 139/6486 (2.1%) | No information | No information | Yes | |
| Continuous monitoring if oxytocin or epidural used. Back to IA if stable. If FHR changes appeared, or if there were other complications,continuous monitoring was instituted | First stage: 15 to 30 minutes Second stage: Continuous CTG | No information | No information | 48% of women were given ocytocin for induction or acceleration | No information | No information | Low‐moderate risk | No information | |
| No information | First stage: Intermittent Second stage: No information | None | No information | 63% of women given oxytocin in labour | No | No information | High risk women only | No information | |
| No information | First stage: Intermittent Second stage: No information | None | ARM when in established labour or for obstetric reasons | No information | No | No information | Low risk | No information | |
| Pinard | First stage: Every 15 minutes Second stage: No information | No information | No information | No information | No as a matter of policy | No information | All had meconium during labour | No information | |
| No information | First stage: Every 15 minutes Second stage: Every 5 minutes | Following. Duration: 1 minute | No information | No information | No information ‐ appears not, as any unreassuring | No information | All post‐caesarean women | No information | |
| No information | First stage: Every 15 minutes Second stage: Every 5 minutes | No information | ARM at 7 cm unless clinically indicated prior to 7 cm | Included women given oxytocin | No | No information | Low birthweight fetus 26 to 32 weeks gestation | Yes | |
| Pinard (if any difficulty a Sonicaid was used intermittently) | First stage: Every 15 minutes or more if indicated Second stage: No information | During or immediately following contraction. Duration: 1 minute | Augmentationwith ARM alone or in combination with oxytocin if progress fell below nomogram | Oxytocin was administered to all women as indicated | No information | No information | Low risk women only | No information | |
ARM: artificial rupture of membranes
CTG: cardiotocography
EFM: electronic fetal monitoring
FBS: fetal blood sampling
FHR: fetal heart rate
IA: intermittent auscultation
Quality of the evidence
The methodological quality of the included studies was mixed. All included studies were assessed at high risk of performance bias, all were unclear or high risk of detection bias, and all were unclear risk of reporting bias. Figure 1 depicts a summary of risk of bias assessment for the included studies.
We used GRADEpro software to assess evidence quality for selected GRADE outcomes; for neonatal seizures the evidence was rated moderate, evidence for cord blood acidosis was rated very low, and the remaining GRADE outcomes (perinatal mortality, cerebral palsy, caesarean section, instrumental vaginal birth and any pharmacological analgesia) were all assessed as low quality. Evidence was downgraded for risk of bias, imprecision of effect estimates and high heterogeneity between studies. These ratings are summarised in summary of findings Table for the main comparison.
Potential biases in the review process
Our selection of outcomes in general and main outcomes in particular might have been influenced by our knowledge of the published literature and the first Cochrane review on this topic (Thacker 2001).
Agreements and disagreements with other studies or reviews
Some large cohort studies suggest much more profound benefit on neonatal morbidity and mortality (Chen 2011). Some observational data also suggest benefit from fetal blood sampling during labour in cases of suboptimal CTG (Stein 2006). We found no evidence that the increase in caesarean section rate was greater if fetal blood sampling was unavailable; nor did access to fetal blood sampling influence the difference in neonatal seizures or any other prespecified outcome.

Methodological quality summary: review authors' judgements about each methodological quality item for each included study

Funnel plot of comparison: 1 Continuous CTG versus intermittent auscultation, outcome: 1.1 Perinatal mortality (main outcome)

Funnel plot of comparison: 1 Continuous CTG versus intermittent auscultation, outcome: 1.2 Neonatal seizures (main outcome)

Funnel plot of comparison: 1 Continuous CTG versus intermittent auscultation, outcome: 1.4 Caesarean section (main outcome)

Funnel plot of comparison: 1 Continuous CTG versus intermittent auscultation, outcome: 1.5 Instrumental vaginal birth (main outcome)

Comparison 1 Continuous CTG versus intermittent auscultation, Outcome 1 Perinatal mortality (main outcome).

Comparison 1 Continuous CTG versus intermittent auscultation, Outcome 2 Neonatal seizures (main outcome).

Comparison 1 Continuous CTG versus intermittent auscultation, Outcome 3 Cerebral palsy (main outcome).

Comparison 1 Continuous CTG versus intermittent auscultation, Outcome 4 Caesarean section (main outcome).

Comparison 1 Continuous CTG versus intermittent auscultation, Outcome 5 Instrumental vaginal birth (main outcome).

Comparison 1 Continuous CTG versus intermittent auscultation, Outcome 6 Cord blood acidosis (main outcome).

Comparison 1 Continuous CTG versus intermittent auscultation, Outcome 7 Any pharmacological analgesia (main outcome).

Comparison 1 Continuous CTG versus intermittent auscultation, Outcome 8 Hypoxic ischaemic encephalopathy.
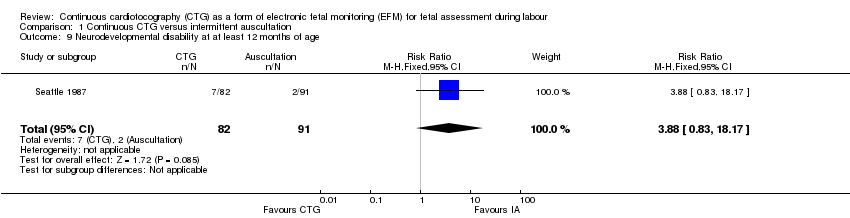
Comparison 1 Continuous CTG versus intermittent auscultation, Outcome 9 Neurodevelopmental disability at at least 12 months of age.

Comparison 1 Continuous CTG versus intermittent auscultation, Outcome 10 Apgar score < 7 at 5 minutes.

Comparison 1 Continuous CTG versus intermittent auscultation, Outcome 11 Apgar score < 4 at 5 minutes.

Comparison 1 Continuous CTG versus intermittent auscultation, Outcome 12 Neonatal ICU admissions.

Comparison 1 Continuous CTG versus intermittent auscultation, Outcome 13 Fetal blood sampling.

Comparison 1 Continuous CTG versus intermittent auscultation, Outcome 14 Damage/infection from scalp electrode or scalp sampling.

Comparison 1 Continuous CTG versus intermittent auscultation, Outcome 15 Caesarean section for abnormal FHR pattern and/or acidosis.

Comparison 1 Continuous CTG versus intermittent auscultation, Outcome 16 Instrumental vaginal birth for abnormal CTG or fetal acidosis.

Comparison 1 Continuous CTG versus intermittent auscultation, Outcome 17 Spontaneous vaginal birth.

Comparison 1 Continuous CTG versus intermittent auscultation, Outcome 18 Epidural analgesia.

Comparison 1 Continuous CTG versus intermittent auscultation, Outcome 19 Oxytocin during 1st and/or 2nd stage of labour.

Comparison 1 Continuous CTG versus intermittent auscultation, Outcome 20 Length of stay on NICU.

Comparison 2 Continuous CTG versus IA (pregnancy risk status ‐ high/low), Outcome 1 Perinatal mortality.

Comparison 2 Continuous CTG versus IA (pregnancy risk status ‐ high/low), Outcome 2 Neonatal seizures.

Comparison 2 Continuous CTG versus IA (pregnancy risk status ‐ high/low), Outcome 3 Cerebral palsy.

Comparison 2 Continuous CTG versus IA (pregnancy risk status ‐ high/low), Outcome 4 Caesarean section.

Comparison 2 Continuous CTG versus IA (pregnancy risk status ‐ high/low), Outcome 5 Instrumental vaginal birth.

Comparison 2 Continuous CTG versus IA (pregnancy risk status ‐ high/low), Outcome 6 Cord blood acidosis.

Comparison 2 Continuous CTG versus IA (pregnancy risk status ‐ high/low), Outcome 7 Any pharmacological analgesia.

Comparison 3 Continuous CTG versus IA (onset of labour ‐ spontaneous/induced), Outcome 1 Perinatal mortality.

Comparison 3 Continuous CTG versus IA (onset of labour ‐ spontaneous/induced), Outcome 2 Neonatal seizures.

Comparison 3 Continuous CTG versus IA (onset of labour ‐ spontaneous/induced), Outcome 3 Cerebral palsy.

Comparison 3 Continuous CTG versus IA (onset of labour ‐ spontaneous/induced), Outcome 4 Caesarean section.

Comparison 3 Continuous CTG versus IA (onset of labour ‐ spontaneous/induced), Outcome 5 Instrumental vaginal birth.

Comparison 3 Continuous CTG versus IA (onset of labour ‐ spontaneous/induced), Outcome 6 Cord blood acidosis.

Comparison 3 Continuous CTG versus IA (onset of labour ‐ spontaneous/induced), Outcome 7 Any pharmacological analgesia.

Comparison 4 Continuous CTG versus IA (preterm/term labour), Outcome 1 Perinatal mortality.

Comparison 4 Continuous CTG versus IA (preterm/term labour), Outcome 2 Neonatal seizures.

Comparison 4 Continuous CTG versus IA (preterm/term labour), Outcome 3 Cerebral palsy.

Comparison 4 Continuous CTG versus IA (preterm/term labour), Outcome 4 Caesarean section.

Comparison 4 Continuous CTG versus IA (preterm/term labour), Outcome 5 Instrumental vaginal birth.

Comparison 4 Continuous CTG versus IA (preterm/term labour), Outcome 6 Cord blood acidosis.

Comparison 4 Continuous CTG versus IA (preterm/term labour), Outcome 7 Any pharmacological analgesia.

Comparison 5 Continuous CTG versus IA (singleton/twin pregnancy), Outcome 1 Perinatal mortality.

Comparison 5 Continuous CTG versus IA (singleton/twin pregnancy), Outcome 2 Neonatal seizures.

Comparison 5 Continuous CTG versus IA (singleton/twin pregnancy), Outcome 3 Cerebral palsy.

Comparison 5 Continuous CTG versus IA (singleton/twin pregnancy), Outcome 4 Caesarean section.

Comparison 5 Continuous CTG versus IA (singleton/twin pregnancy), Outcome 5 Instrumental vaginal birth.

Comparison 5 Continuous CTG versus IA (singleton/twin pregnancy), Outcome 6 Cord blood acidosis.

Comparison 5 Continuous CTG versus IA (singleton/twin pregnancy), Outcome 7 Any pharmacological analgesia.

Comparison 6 Continuous CTG versus IA (access to FBS during labour ‐ yes/no), Outcome 1 Perinatal mortality.

Comparison 6 Continuous CTG versus IA (access to FBS during labour ‐ yes/no), Outcome 2 Neonatal seizures.

Comparison 6 Continuous CTG versus IA (access to FBS during labour ‐ yes/no), Outcome 3 Cerebral palsy.

Comparison 6 Continuous CTG versus IA (access to FBS during labour ‐ yes/no), Outcome 4 Caesarean section.

Comparison 6 Continuous CTG versus IA (access to FBS during labour ‐ yes/no), Outcome 5 Instrumental vaginal birth.

Comparison 6 Continuous CTG versus IA (access to FBS during labour ‐ yes/no), Outcome 6 Cord blood acidosis.

Comparison 6 Continuous CTG versus IA (access to FBS during labour ‐ yes/no), Outcome 7 Any pharmacological analgesia.

Comparison 7 Continuous CTG versus IA (primiparous/multiparous women), Outcome 1 Perinatal mortality.

Comparison 7 Continuous CTG versus IA (primiparous/multiparous women), Outcome 2 Neonatal seizures.

Comparison 7 Continuous CTG versus IA (primiparous/multiparous women), Outcome 3 Cerebral palsy.

Comparison 7 Continuous CTG versus IA (primiparous/multiparous women), Outcome 4 Caesarean section.

Comparison 7 Continuous CTG versus IA (primiparous/multiparous women), Outcome 5 Instrumental vaginal birth.

Comparison 7 Continuous CTG versus IA (primiparous/multiparous women), Outcome 6 Cord blood acidosis.

Comparison 7 Continuous CTG versus IA (primiparous/multiparous women), Outcome 7 Any pharmacological analgesia.

Comparison 8 Continuous CTG versus IA (sensitivity analysis: high and low quality studies), Outcome 1 Perinatal mortality.

Comparison 8 Continuous CTG versus IA (sensitivity analysis: high and low quality studies), Outcome 2 Neonatal seizures.

Comparison 8 Continuous CTG versus IA (sensitivity analysis: high and low quality studies), Outcome 3 Cerebral palsy.

Comparison 8 Continuous CTG versus IA (sensitivity analysis: high and low quality studies), Outcome 4 Caesarean section.

Comparison 8 Continuous CTG versus IA (sensitivity analysis: high and low quality studies), Outcome 5 Instrumental vaginal birth.

Comparison 8 Continuous CTG versus IA (sensitivity analysis: high and low quality studies), Outcome 6 Cord blood acidosis.

Comparison 8 Continuous CTG versus IA (sensitivity analysis: high and low quality studies), Outcome 7 Any pharmacological analgesia.

Comparison 9 Continuous CTG versus intermittent CTG, Outcome 1 Caesarean section (main outcome).

Comparison 9 Continuous CTG versus intermittent CTG, Outcome 2 Instrumental vaginal birth (main outcome).

Comparison 9 Continuous CTG versus intermittent CTG, Outcome 3 Cord blood acidosis (main outcome).

Comparison 9 Continuous CTG versus intermittent CTG, Outcome 4 Apgar score < 7 at 5 minutes.

Comparison 9 Continuous CTG versus intermittent CTG, Outcome 5 Neonatal ICU admissions.

Comparison 9 Continuous CTG versus intermittent CTG, Outcome 6 Caesarean section for abnormal FHR pattern and/or acidosis.

Comparison 9 Continuous CTG versus intermittent CTG, Outcome 7 Spontaneous vaginal birth.

Comparison 9 Continuous CTG versus intermittent CTG, Outcome 8 Epidural analgesia.
| Continuous CTG versus intermittent auscultation for fetal assessment during labour | ||||||
| Patient or population: Pregnant women undergoing fetal assessment during labour | ||||||
| Outcomes | Illustrative comparative risks* (95% CI) | Relative effect | No of participants | Quality of the evidence | Comments | |
| Assumed risk | Corresponding risk | |||||
| Control | Continuous CTG versus intermittent auscultation | |||||
| Perinatal mortality | Study population | RR 0.86 | 33,513 | ⊕⊕⊝⊝ | ||
| 3 per 1000 | 3 per 1000 | |||||
| Moderate | ||||||
| 4 per 1000 | 3 per 1000 | |||||
| Neonatal seizures | Study population | RR 0.5 | 32,386 | ⊕⊕⊕⊝ | ||
| 3 per 1000 | 1 per 1000 | |||||
| Moderate | ||||||
| 4 per 1000 | 2 per 1000 | |||||
| Cerebral palsy | Study population | RR 1.75 | 13,252 | ⊕⊕⊝⊝ | ||
| 3 per 1000 | 4 per 1000 | |||||
| Moderate | ||||||
| 39 per 1000 | 68 per 1000 | |||||
| Caesarean section | Study population | RR 1.63 | 18,861 | ⊕⊕⊝⊝ | ||
| 36 per 1000 | 59 per 1000 | |||||
| Moderate | ||||||
| 66 per 1000 | 108 per 1000 | |||||
| Instrumental vaginal birth | Study population | RR 1.15 | 18,615 | ⊕⊕⊝⊝ | ||
| 102 per 1000 | 118 per 1000 | |||||
| Moderate | ||||||
| 222 per 1000 | 255 per 1000 | |||||
| Cord blood acidosis | Study population | RR 0.92 | 2494 | ⊕⊝⊝⊝ | ||
| 24 per 1000 | 22 per 1000 | |||||
| Moderate | ||||||
| 24 per 1000 | 22 per 1000 | |||||
| Any pharmacological analgesia | Study population | RR 0.98 | 1677 | ⊕⊕⊝⊝ | ||
| 754 per 1000 | 739 per 1000 | |||||
| Moderate | ||||||
| 805 per 1000 | 789 per 1000 | |||||
| *The basis for the assumed risk (e.g. the median control group risk across studies) is provided in footnotes. The corresponding risk (and its 95% confidence interval) is based on the assumed risk in the comparison group and the relative effect of the intervention (and its 95% CI). | ||||||
| GRADE Working Group grades of evidence | ||||||
| 1 Limitations in design: Most studies contributing data had design limitations (< 40% weight). | ||||||
| Method | Description |
| Fetal stethoscope (Pinard) ‐ for intermittent monitoring (IA) | This is a trumpet‐shaped device, which is placed on the mother's abdomen and the caregiver listens for the heart beat at the other end. This is a simple instrument of relatively low cost |
| Hand‐held Doppler ultrasound monitor ‐ for intermittent monitoring (IA) | The device is placed on the mother's abdomen with gel smeared on the underside of the ultrasound transducer. This allows the ultrasound beam to travel from the fetal heart to the transducer without interruption |
| External cardiotocography ‐ for continuous or intermittent monitoring | The fetal heart rate and the activity of the uterine muscle are detected by two transducers placed on the mother's abdomen (one above the fetal heart and the other at the fundus). Doppler ultrasound provides the information which is recorded on a paper strip known as a cardiotocograph (CTG). |
| Internal cardiotocography ‐ for continuous monitoring | An electrode is placed directly on the baby's presenting part to detect the fetal ECG signal. Again the signals are recorded on a paper strip (CTG). This method can only be used if membranes (fore‐waters) have ruptured either spontaneously or artificially |
| ECG: electrocardiogram | |
| Study | 1 carer to 1 woman | Induction | ARM | Oxytocin | Mobility | Birth positions | Women's views | Social context | Experience of staff |
| Yes | Induction ‐ 11% overall | No information | Augmentation ‐ 46% overall | No mobility ‐ all women with IV line inserted | Semi‐Fowler or lateral | No information | No information | IA standard practice, EFM intensive training provided | |
| No information | No information | No information | No information | EFM only applied when women no longer wished to walk around | No information | No information | No information | No information | |
| 2 women: 1 nurse | Excluded women whose labours were induced | No information | Excluded women | No information | No information | No information | No information | No information | |
| IA: yes CTG: no information | Included women whose labours were induced | No information | Included women given oxytocin for augmentation | No information | No information | No information | No information | No information | |
| Yes | No specific information | No information | 29% of women given oxytocin for augmentation | No information | No information | No information | No information | No information | |
| Yes | Included women whose labours were induced | ARM within an hour of admission to check liquor | 23% of women given oxytocin for augmentation | IA, probably more mobile | No information | Women's views sought and published separately | No information | No information | |
| No information | Included women whose labours were induced | No information | 48% of women were given ocytocin for induction or acceleration | Women in CTG group offered telemetry if wished mobility | No information | No information | No information | No information | |
| No information | Induction ‐ 42% overall | No information | 63% of women given oxytocin in labour | No information | No information | No information | No information | Exp staff. | |
| No information | No information | ARM when in established labour or for obstetric reasons | No information | No information | No information | No information | No information | No information | |
| No information | No information | No information | No information | No information | No information | No information | No information | No information | |
| No information | No information | No information | No information | No information | No information | No information | No information | No information | |
| Yes | No information | ARM at 7 cm unless clinically indicated prior to 7 cm | Included women given oxytocin | No information | No information | Women's views sought and published separately. | No information | No information | |
| No information | Included women whose labours were induced | Augmentation with ARM alone or in combination with oxytocin if progress fell below nomogram | Oxytocin was administered to all women as indicated | No information | No information | No information | No information | No information | |
| ARM: artificial rupture of membranes | |||||||||
| Study | Intermittent auscultation details | Additional details | |||||||
| Method | Frequency | Before / during / following contraction; | ARM | Oxytocin | FBS | Admission CTG | Risk level | 1 carer to 1 woman | |
| Sonicaid | First stage: At least every 15 minutes Second stage: Every 5 minutes | During and following. Duration: For 1 min including at least 30 seconds after the contraction | No information | Augmentation ‐ 46% overall | No | No information | High and low risk | Yes | |
| No information | First stage: At least 15 s twice an hour up to 5 cm. Above 5 cm every 15 minutes Second stage: After every contraction | Following. Duration: 30 seconds | No information | No information | No information | No information | High and low risk | No information | |
| Hand‐held device | First stage: Every 30 minutes Second stage: No information | No information | No information | Excluded women given oxytocin for augmentation | No information | No information | Low and high risk | 2 women: 1 nurse | |
| No information | First stage: Every 15 minutes Second stage: every 5 minutes | Following. Duration: 30 seconds | No information | Included women given oxytocin for augmentation | No information | No information | High risk | IA: yes CTG: no information | |
| No information | First stage: Every 15 minutes Second stage: every 5 minutes | Following. Duration: 30 seconds | No information | 29% of women given oxytocin for augmentation | No | No information | High risk | Yes | |
| Pinard unless difficult then used Doppler ultrasound | First stage: Every 15 minutes Second stage: Every interval between contractions | Following. Duration: 1 minute | ARM within an hour of admission to check liquor | 23% of women given oxytocin for augmentation | When labour > 8 hours. CTG: 77/6474 (1.2%) IA: 139/6486 (2.1%) | No information | No information | Yes | |
| Continuous monitoring if oxytocin or epidural used. Back to IA if stable. If FHR changes appeared, or if there were other complications,continuous monitoring was instituted | First stage: 15 to 30 minutes Second stage: Continuous CTG | No information | No information | 48% of women were given ocytocin for induction or acceleration | No information | No information | Low‐moderate risk | No information | |
| No information | First stage: Intermittent Second stage: No information | None | No information | 63% of women given oxytocin in labour | No | No information | High risk women only | No information | |
| No information | First stage: Intermittent Second stage: No information | None | ARM when in established labour or for obstetric reasons | No information | No | No information | Low risk | No information | |
| Pinard | First stage: Every 15 minutes Second stage: No information | No information | No information | No information | No as a matter of policy | No information | All had meconium during labour | No information | |
| No information | First stage: Every 15 minutes Second stage: Every 5 minutes | Following. Duration: 1 minute | No information | No information | No information ‐ appears not, as any unreassuring | No information | All post‐caesarean women | No information | |
| No information | First stage: Every 15 minutes Second stage: Every 5 minutes | No information | ARM at 7 cm unless clinically indicated prior to 7 cm | Included women given oxytocin | No | No information | Low birthweight fetus 26 to 32 weeks gestation | Yes | |
| Pinard (if any difficulty a Sonicaid was used intermittently) | First stage: Every 15 minutes or more if indicated Second stage: No information | During or immediately following contraction. Duration: 1 minute | Augmentationwith ARM alone or in combination with oxytocin if progress fell below nomogram | Oxytocin was administered to all women as indicated | No information | No information | Low risk women only | No information | |
| ARM: artificial rupture of membranes | |||||||||
| Outcome or subgroup title | No. of studies | No. of participants | Statistical method | Effect size |
| 1 Perinatal mortality (main outcome) Show forest plot | 11 | 33513 | Risk Ratio (M‐H, Fixed, 95% CI) | 0.86 [0.59, 1.24] |
| 2 Neonatal seizures (main outcome) Show forest plot | 9 | 32386 | Risk Ratio (M‐H, Fixed, 95% CI) | 0.50 [0.31, 0.80] |
| 3 Cerebral palsy (main outcome) Show forest plot | 2 | 13252 | Risk Ratio (M‐H, Random, 95% CI) | 1.75 [0.84, 3.63] |
| 4 Caesarean section (main outcome) Show forest plot | 11 | 18861 | Risk Ratio (M‐H, Random, 95% CI) | 1.63 [1.29, 2.07] |
| 5 Instrumental vaginal birth (main outcome) Show forest plot | 10 | 18615 | Risk Ratio (M‐H, Random, 95% CI) | 1.15 [1.01, 1.33] |
| 6 Cord blood acidosis (main outcome) Show forest plot | 2 | 2494 | Risk Ratio (M‐H, Random, 95% CI) | 0.92 [0.27, 3.11] |
| 7 Any pharmacological analgesia (main outcome) Show forest plot | 3 | 1677 | Risk Ratio (M‐H, Random, 95% CI) | 0.98 [0.88, 1.09] |
| 8 Hypoxic ischaemic encephalopathy Show forest plot | 1 | 1428 | Risk Ratio (M‐H, Fixed, 95% CI) | 0.46 [0.04, 5.03] |
| 9 Neurodevelopmental disability at at least 12 months of age Show forest plot | 1 | 173 | Risk Ratio (M‐H, Fixed, 95% CI) | 3.88 [0.83, 18.17] |
| 10 Apgar score < 7 at 5 minutes Show forest plot | 6 | 4137 | Risk Ratio (M‐H, Fixed, 95% CI) | 0.95 [0.71, 1.27] |
| 11 Apgar score < 4 at 5 minutes Show forest plot | 3 | 1919 | Risk Ratio (M‐H, Fixed, 95% CI) | 1.80 [0.71, 4.59] |
| 12 Neonatal ICU admissions Show forest plot | 10 | 33167 | Risk Ratio (M‐H, Random, 95% CI) | 1.01 [0.86, 1.18] |
| 13 Fetal blood sampling Show forest plot | 2 | 13929 | Risk Ratio (M‐H, Fixed, 95% CI) | 1.24 [1.05, 1.47] |
| 14 Damage/infection from scalp electrode or scalp sampling Show forest plot | 1 | 200 | Risk Ratio (M‐H, Fixed, 95% CI) | 3.0 [0.12, 72.77] |
| 15 Caesarean section for abnormal FHR pattern and/or acidosis Show forest plot | 11 | 33379 | Risk Ratio (M‐H, Fixed, 95% CI) | 2.38 [1.89, 3.01] |
| 16 Instrumental vaginal birth for abnormal CTG or fetal acidosis Show forest plot | 1 | 12964 | Risk Ratio (M‐H, Fixed, 95% CI) | 2.54 [1.95, 3.31] |
| 17 Spontaneous vaginal birth Show forest plot | 11 | 18861 | Risk Ratio (M‐H, Random, 95% CI) | 0.91 [0.86, 0.96] |
| 18 Epidural analgesia Show forest plot | 8 | 17630 | Risk Ratio (M‐H, Fixed, 95% CI) | 1.00 [0.90, 1.12] |
| 19 Oxytocin during 1st and/or 2nd stage of labour Show forest plot | 5 | 3683 | Risk Ratio (M‐H, Random, 95% CI) | 1.08 [0.86, 1.37] |
| 20 Length of stay on NICU Show forest plot | 1 | 206 | Mean Difference (IV, Fixed, 95% CI) | 0.20 [‐1.17, 1.57] |
| Outcome or subgroup title | No. of studies | No. of participants | Statistical method | Effect size |
| 1 Perinatal mortality Show forest plot | 11 | 33513 | Risk Ratio (M‐H, Fixed, 95% CI) | 0.86 [0.59, 1.24] |
| 1.1 High risk | 5 | 1974 | Risk Ratio (M‐H, Fixed, 95% CI) | 1.04 [0.62, 1.74] |
| 1.2 Low risk | 3 | 16049 | Risk Ratio (M‐H, Fixed, 95% CI) | 0.87 [0.29, 2.58] |
| 1.3 Risk status ‐ mixed or not specified | 3 | 15490 | Risk Ratio (M‐H, Fixed, 95% CI) | 0.68 [0.38, 1.24] |
| 2 Neonatal seizures Show forest plot | 9 | 32386 | Risk Ratio (M‐H, Fixed, 95% CI) | 0.50 [0.31, 0.80] |
| 2.1 High risk | 5 | 4805 | Risk Ratio (M‐H, Fixed, 95% CI) | 0.67 [0.36, 1.24] |
| 2.2 Low risk | 3 | 25175 | Risk Ratio (M‐H, Fixed, 95% CI) | 0.36 [0.16, 0.79] |
| 2.3 Risk status ‐ mixed or not specified | 2 | 2406 | Risk Ratio (M‐H, Fixed, 95% CI) | 0.18 [0.01, 3.80] |
| 3 Cerebral palsy Show forest plot | 2 | 13252 | Risk Ratio (M‐H, Fixed, 95% CI) | 1.74 [0.97, 3.11] |
| 3.1 High risk | 1 | 173 | Risk Ratio (M‐H, Fixed, 95% CI) | 2.54 [1.10, 5.86] |
| 3.2 Low risk | 0 | 0 | Risk Ratio (M‐H, Fixed, 95% CI) | 0.0 [0.0, 0.0] |
| 3.3 Risk status ‐ mixed or not specified | 1 | 13079 | Risk Ratio (M‐H, Fixed, 95% CI) | 1.20 [0.52, 2.79] |
| 4 Caesarean section Show forest plot | 11 | 18861 | Risk Ratio (M‐H, Random, 95% CI) | 1.63 [1.29, 2.07] |
| 4.1 High risk | 6 | 2069 | Risk Ratio (M‐H, Random, 95% CI) | 1.91 [1.39, 2.61] |
| 4.2 Low risk | 2 | 1431 | Risk Ratio (M‐H, Random, 95% CI) | 2.06 [1.24, 3.45] |
| 4.3 Risk status ‐ mixed or not specified | 3 | 15361 | Risk Ratio (M‐H, Random, 95% CI) | 1.14 [0.95, 1.36] |
| 5 Instrumental vaginal birth Show forest plot | 10 | 18615 | Risk Ratio (M‐H, Random, 95% CI) | 1.15 [1.01, 1.33] |
| 5.1 High risk | 5 | 1823 | Risk Ratio (M‐H, Random, 95% CI) | 1.02 [0.82, 1.27] |
| 5.2 Low risk | 2 | 1431 | Risk Ratio (M‐H, Random, 95% CI) | 1.09 [0.77, 1.54] |
| 5.3 Risk status ‐ mixed or not specified | 3 | 15361 | Risk Ratio (M‐H, Random, 95% CI) | 1.33 [1.20, 1.49] |
| 6 Cord blood acidosis Show forest plot | 2 | 2494 | Risk Ratio (M‐H, Fixed, 95% CI) | 1.16 [0.72, 1.89] |
| 6.1 High risk | 0 | 0 | Risk Ratio (M‐H, Fixed, 95% CI) | 0.0 [0.0, 0.0] |
| 6.2 Low risk | 0 | 0 | Risk Ratio (M‐H, Fixed, 95% CI) | 0.0 [0.0, 0.0] |
| 6.3 Risk status ‐ mixed or not specified | 2 | 2494 | Risk Ratio (M‐H, Fixed, 95% CI) | 1.16 [0.72, 1.89] |
| 7 Any pharmacological analgesia Show forest plot | 3 | 1677 | Risk Ratio (M‐H, Fixed, 95% CI) | 0.99 [0.93, 1.04] |
| 7.1 High risk | 2 | 1173 | Risk Ratio (M‐H, Fixed, 95% CI) | 1.01 [0.96, 1.06] |
| 7.2 Low risk | 1 | 504 | Risk Ratio (M‐H, Fixed, 95% CI) | 0.92 [0.79, 1.07] |
| 7.3 Risk status ‐ mixed or not specified | 0 | 0 | Risk Ratio (M‐H, Fixed, 95% CI) | 0.0 [0.0, 0.0] |
| Outcome or subgroup title | No. of studies | No. of participants | Statistical method | Effect size |
| 1 Perinatal mortality Show forest plot | 11 | 33513 | Risk Ratio (M‐H, Fixed, 95% CI) | 0.86 [0.59, 1.24] |
| 1.1 Spontaneous labour | 0 | 0 | Risk Ratio (M‐H, Fixed, 95% CI) | 0.0 [0.0, 0.0] |
| 1.2 Induction of labour | 0 | 0 | Risk Ratio (M‐H, Fixed, 95% CI) | 0.0 [0.0, 0.0] |
| 1.3 Onset of labour ‐ not specified | 11 | 33513 | Risk Ratio (M‐H, Fixed, 95% CI) | 0.86 [0.59, 1.24] |
| 2 Neonatal seizures Show forest plot | 9 | 32386 | Risk Ratio (M‐H, Fixed, 95% CI) | 0.50 [0.31, 0.80] |
| 2.1 Spontaneous labour | 0 | 0 | Risk Ratio (M‐H, Fixed, 95% CI) | 0.0 [0.0, 0.0] |
| 2.2 Induction of labour | 0 | 0 | Risk Ratio (M‐H, Fixed, 95% CI) | 0.0 [0.0, 0.0] |
| 2.3 Onset of labour ‐ not specified | 9 | 32386 | Risk Ratio (M‐H, Fixed, 95% CI) | 0.50 [0.31, 0.80] |
| 3 Cerebral palsy Show forest plot | 2 | 13252 | Risk Ratio (M‐H, Fixed, 95% CI) | 1.74 [0.97, 3.11] |
| 3.1 Spontaneous labour | 0 | 0 | Risk Ratio (M‐H, Fixed, 95% CI) | 0.0 [0.0, 0.0] |
| 3.2 Induction of labour | 0 | 0 | Risk Ratio (M‐H, Fixed, 95% CI) | 0.0 [0.0, 0.0] |
| 3.3 Onset of labour ‐ not specified | 2 | 13252 | Risk Ratio (M‐H, Fixed, 95% CI) | 1.74 [0.97, 3.11] |
| 4 Caesarean section Show forest plot | 11 | 18861 | Risk Ratio (M‐H, Fixed, 95% CI) | 1.43 [1.25, 1.64] |
| 4.1 Spontaneous labour | 0 | 0 | Risk Ratio (M‐H, Fixed, 95% CI) | 0.0 [0.0, 0.0] |
| 4.2 Induction of labour | 0 | 0 | Risk Ratio (M‐H, Fixed, 95% CI) | 0.0 [0.0, 0.0] |
| 4.3 Onset of labour ‐ not specified | 11 | 18861 | Risk Ratio (M‐H, Fixed, 95% CI) | 1.43 [1.25, 1.64] |
| 5 Instrumental vaginal birth Show forest plot | 10 | 18615 | Risk Ratio (M‐H, Fixed, 95% CI) | 1.21 [1.12, 1.31] |
| 5.1 Spontaneous labour | 0 | 0 | Risk Ratio (M‐H, Fixed, 95% CI) | 0.0 [0.0, 0.0] |
| 5.2 Induction of labour | 0 | 0 | Risk Ratio (M‐H, Fixed, 95% CI) | 0.0 [0.0, 0.0] |
| 5.3 Onset of labour ‐ not specified | 10 | 18615 | Risk Ratio (M‐H, Fixed, 95% CI) | 1.21 [1.12, 1.31] |
| 6 Cord blood acidosis Show forest plot | 2 | 2494 | Risk Ratio (M‐H, Fixed, 95% CI) | 1.16 [0.72, 1.89] |
| 6.1 Spontaneous labour | 0 | 0 | Risk Ratio (M‐H, Fixed, 95% CI) | 0.0 [0.0, 0.0] |
| 6.2 Induction of labour | 0 | 0 | Risk Ratio (M‐H, Fixed, 95% CI) | 0.0 [0.0, 0.0] |
| 6.3 Onset of labour ‐ not specified | 2 | 2494 | Risk Ratio (M‐H, Fixed, 95% CI) | 1.16 [0.72, 1.89] |
| 7 Any pharmacological analgesia Show forest plot | 3 | 1677 | Risk Ratio (M‐H, Fixed, 95% CI) | 0.99 [0.93, 1.04] |
| 7.1 Spontaneous labour | 0 | 0 | Risk Ratio (M‐H, Fixed, 95% CI) | 0.0 [0.0, 0.0] |
| 7.2 Induction of labour | 0 | 0 | Risk Ratio (M‐H, Fixed, 95% CI) | 0.0 [0.0, 0.0] |
| 7.3 Onset of labour ‐ not specified | 3 | 1677 | Risk Ratio (M‐H, Fixed, 95% CI) | 0.99 [0.93, 1.04] |
| Outcome or subgroup title | No. of studies | No. of participants | Statistical method | Effect size |
| 1 Perinatal mortality Show forest plot | 11 | 33513 | Risk Ratio (M‐H, Fixed, 95% CI) | 0.86 [0.59, 1.24] |
| 1.1 Preterm labour | 1 | 246 | Risk Ratio (M‐H, Fixed, 95% CI) | 0.96 [0.52, 1.77] |
| 1.2 Term labour | 3 | 2409 | Risk Ratio (M‐H, Fixed, 95% CI) | 0.82 [0.22, 3.03] |
| 1.3 Both or gestation not specified | 7 | 30858 | Risk Ratio (M‐H, Fixed, 95% CI) | 0.81 [0.50, 1.32] |
| 2 Neonatal seizures Show forest plot | 9 | 32386 | Risk Ratio (M‐H, Fixed, 95% CI) | 0.50 [0.31, 0.80] |
| 2.1 Preterm labour | 1 | 246 | Risk Ratio (M‐H, Fixed, 95% CI) | 1.02 [0.37, 2.81] |
| 2.2 Term labour | 2 | 1482 | Risk Ratio (M‐H, Fixed, 95% CI) | 0.33 [0.01, 8.08] |
| 2.3 Both or gestation not specified | 6 | 30658 | Risk Ratio (M‐H, Fixed, 95% CI) | 0.42 [0.24, 0.72] |
| 3 Cerebral palsy Show forest plot | 2 | 13252 | Risk Ratio (M‐H, Fixed, 95% CI) | 1.74 [0.97, 3.11] |
| 3.1 Preterm labour | 1 | 173 | Risk Ratio (M‐H, Fixed, 95% CI) | 2.54 [1.10, 5.86] |
| 3.2 Term labour | 0 | 0 | Risk Ratio (M‐H, Fixed, 95% CI) | 0.0 [0.0, 0.0] |
| 3.3 Both or gestation not specified | 1 | 13079 | Risk Ratio (M‐H, Fixed, 95% CI) | 1.20 [0.52, 2.79] |
| 4 Caesarean section Show forest plot | 11 | 18861 | Risk Ratio (M‐H, Fixed, 95% CI) | 1.43 [1.25, 1.64] |
| 4.1 Preterm labour | 1 | 246 | Risk Ratio (M‐H, Fixed, 95% CI) | 1.02 [0.57, 1.82] |
| 4.2 Term labour | 3 | 2400 | Risk Ratio (M‐H, Fixed, 95% CI) | 1.84 [1.25, 2.69] |
| 4.3 Both or gestation not specified | 7 | 16215 | Risk Ratio (M‐H, Fixed, 95% CI) | 1.41 [1.21, 1.63] |
| 5 Instrumental vaginal birth Show forest plot | 10 | 18615 | Risk Ratio (M‐H, Fixed, 95% CI) | 1.21 [1.12, 1.31] |
| 5.1 Preterm labour | 0 | 0 | Risk Ratio (M‐H, Fixed, 95% CI) | 0.0 [0.0, 0.0] |
| 5.2 Term labour | 3 | 2400 | Risk Ratio (M‐H, Fixed, 95% CI) | 1.18 [1.01, 1.37] |
| 5.3 Both or gestation not specified | 7 | 16215 | Risk Ratio (M‐H, Fixed, 95% CI) | 1.22 [1.11, 1.34] |
| 6 Cord blood acidosis Show forest plot | 2 | 2494 | Risk Ratio (M‐H, Fixed, 95% CI) | 1.16 [0.72, 1.89] |
| 6.1 Preterm labour | 0 | 0 | Risk Ratio (M‐H, Fixed, 95% CI) | 0.0 [0.0, 0.0] |
| 6.2 Term labour | 0 | 0 | Risk Ratio (M‐H, Fixed, 95% CI) | 0.0 [0.0, 0.0] |
| 6.3 Both or gestation not specified | 2 | 2494 | Risk Ratio (M‐H, Fixed, 95% CI) | 1.16 [0.72, 1.89] |
| 7 Any pharmacological analgesia Show forest plot | 3 | 1677 | Risk Ratio (M‐H, Fixed, 95% CI) | 0.99 [0.93, 1.04] |
| 7.1 Preterm labour | 0 | 0 | Risk Ratio (M‐H, Fixed, 95% CI) | 0.0 [0.0, 0.0] |
| 7.2 Term labour | 1 | 504 | Risk Ratio (M‐H, Fixed, 95% CI) | 0.92 [0.79, 1.07] |
| 7.3 Both or gestation not specified | 2 | 1173 | Risk Ratio (M‐H, Fixed, 95% CI) | 1.01 [0.96, 1.06] |
| Outcome or subgroup title | No. of studies | No. of participants | Statistical method | Effect size |
| 1 Perinatal mortality Show forest plot | 11 | 33513 | Risk Ratio (M‐H, Fixed, 95% CI) | 0.86 [0.59, 1.24] |
| 1.1 Singleton | 7 | 18406 | Risk Ratio (M‐H, Fixed, 95% CI) | 0.77 [0.49, 1.21] |
| 1.2 Twins | 0 | 0 | Risk Ratio (M‐H, Fixed, 95% CI) | 0.0 [0.0, 0.0] |
| 1.3 Both or singleton/twins not specified | 4 | 15107 | Risk Ratio (M‐H, Fixed, 95% CI) | 1.04 [0.55, 1.97] |
| 2 Neonatal seizures Show forest plot | 9 | 32386 | Risk Ratio (M‐H, Fixed, 95% CI) | 0.50 [0.31, 0.80] |
| 2.1 Singleton | 5 | 17279 | Risk Ratio (M‐H, Fixed, 95% CI) | 0.69 [0.32, 1.46] |
| 2.2 Twins | 0 | 0 | Risk Ratio (M‐H, Fixed, 95% CI) | 0.0 [0.0, 0.0] |
| 2.3 Both or singleton/twins not specified | 4 | 15107 | Risk Ratio (M‐H, Fixed, 95% CI) | 0.41 [0.22, 0.76] |
| 3 Cerebral palsy Show forest plot | 2 | 13252 | Risk Ratio (M‐H, Fixed, 95% CI) | 1.74 [0.97, 3.11] |
| 3.1 Singleton | 1 | 173 | Risk Ratio (M‐H, Fixed, 95% CI) | 2.54 [1.10, 5.86] |
| 3.2 Twins | 0 | 0 | Risk Ratio (M‐H, Fixed, 95% CI) | 0.0 [0.0, 0.0] |
| 3.3 Both or singleton/twins not specified | 1 | 13079 | Risk Ratio (M‐H, Fixed, 95% CI) | 1.20 [0.52, 2.79] |
| 4 Caesarean section Show forest plot | 11 | 18861 | Risk Ratio (M‐H, Fixed, 95% CI) | 1.43 [1.25, 1.64] |
| 4.1 Singleton | 7 | 3888 | Risk Ratio (M‐H, Fixed, 95% CI) | 1.58 [1.30, 1.93] |
| 4.2 Twins | 0 | 0 | Risk Ratio (M‐H, Fixed, 95% CI) | 0.0 [0.0, 0.0] |
| 4.3 Both or singleton/twins not specified | 4 | 14973 | Risk Ratio (M‐H, Fixed, 95% CI) | 1.33 [1.11, 1.59] |
| 5 Instrumental vaginal birth Show forest plot | 10 | 18615 | Risk Ratio (M‐H, Fixed, 95% CI) | 1.21 [1.12, 1.31] |
| 5.1 Singleton | 6 | 3642 | Risk Ratio (M‐H, Fixed, 95% CI) | 1.13 [1.00, 1.28] |
| 5.2 Twins | 0 | 0 | Risk Ratio (M‐H, Fixed, 95% CI) | 0.0 [0.0, 0.0] |
| 5.3 Both or singleton/twins not specified | 4 | 14973 | Risk Ratio (M‐H, Fixed, 95% CI) | 1.25 [1.13, 1.38] |
| 6 Cord blood acidosis Show forest plot | 2 | 2494 | Risk Ratio (M‐H, Fixed, 95% CI) | 1.16 [0.72, 1.89] |
| 6.1 Singleton | 1 | 1419 | Risk Ratio (M‐H, Fixed, 95% CI) | 1.58 [0.89, 2.81] |
| 6.2 Twins | 0 | 0 | Risk Ratio (M‐H, Fixed, 95% CI) | 0.0 [0.0, 0.0] |
| 6.3 Both or singleton/twins not specified | 1 | 1075 | Risk Ratio (M‐H, Fixed, 95% CI) | 0.45 [0.16, 1.29] |
| 7 Any pharmacological analgesia Show forest plot | 3 | 1677 | Risk Ratio (M‐H, Fixed, 95% CI) | 0.99 [0.93, 1.04] |
| 7.1 Singleton | 2 | 987 | Risk Ratio (M‐H, Fixed, 95% CI) | 0.93 [0.86, 1.01] |
| 7.2 Twins | 0 | 0 | Risk Ratio (M‐H, Fixed, 95% CI) | 0.0 [0.0, 0.0] |
| 7.3 Both or singleton/twins not specified | 1 | 690 | Risk Ratio (M‐H, Fixed, 95% CI) | 1.06 [1.00, 1.12] |
| Outcome or subgroup title | No. of studies | No. of participants | Statistical method | Effect size |
| 1 Perinatal mortality Show forest plot | 11 | 33513 | Risk Ratio (M‐H, Fixed, 95% CI) | 0.85 [0.59, 1.23] |
| 1.1 Continuous CTG plus FBS | 7 | 16131 | Risk Ratio (M‐H, Fixed, 95% CI) | 0.97 [0.64, 1.47] |
| 1.2 Continuous CTG alone ‐ no FBS | 5 | 17382 | Risk Ratio (M‐H, Fixed, 95% CI) | 0.57 [0.26, 1.24] |
| 2 Neonatal seizures Show forest plot | 9 | 32386 | Risk Ratio (M‐H, Fixed, 95% CI) | 0.50 [0.31, 0.80] |
| 2.1 Continuous CTG plus FBS | 5 | 15004 | Risk Ratio (M‐H, Fixed, 95% CI) | 0.49 [0.29, 0.84] |
| 2.2 Continuous CTG alone ‐ no FBS | 5 | 17382 | Risk Ratio (M‐H, Fixed, 95% CI) | 0.51 [0.18, 1.44] |
| 3 Cerebral palsy Show forest plot | 2 | 13252 | Risk Ratio (M‐H, Fixed, 95% CI) | 1.74 [0.97, 3.11] |
| 3.1 Continuous CTG plus FBS | 2 | 13252 | Risk Ratio (M‐H, Fixed, 95% CI) | 1.74 [0.97, 3.11] |
| 3.2 Continuous CTG alone ‐ no FBS | 0 | 0 | Risk Ratio (M‐H, Fixed, 95% CI) | 0.0 [0.0, 0.0] |
| 4 Caesarean section Show forest plot | 11 | 18861 | Risk Ratio (M‐H, Fixed, 95% CI) | 1.43 [1.25, 1.64] |
| 4.1 Continuous CTG plus FBS | 7 | 16001 | Risk Ratio (M‐H, Fixed, 95% CI) | 1.34 [1.14, 1.58] |
| 4.2 Continuous CTG alone ‐ no FBS | 5 | 2860 | Risk Ratio (M‐H, Fixed, 95% CI) | 1.63 [1.30, 2.06] |
| 5 Instrumental vaginal birth Show forest plot | 10 | 18615 | Risk Ratio (M‐H, Fixed, 95% CI) | 1.21 [1.12, 1.31] |
| 5.1 Continuous CTG plus FBS | 6 | 15755 | Risk Ratio (M‐H, Fixed, 95% CI) | 1.27 [1.16, 1.39] |
| 5.2 Continuous CTG alone ‐ no FBS | 5 | 2860 | Risk Ratio (M‐H, Fixed, 95% CI) | 1.05 [0.90, 1.22] |
| 6 Cord blood acidosis Show forest plot | 2 | 2494 | Risk Ratio (M‐H, Fixed, 95% CI) | 1.16 [0.72, 1.89] |
| 6.1 Continuous CTG plus FBS | 1 | 1075 | Risk Ratio (M‐H, Fixed, 95% CI) | 0.45 [0.16, 1.29] |
| 6.2 Continuous CTG alone ‐ no FBS | 1 | 1419 | Risk Ratio (M‐H, Fixed, 95% CI) | 1.58 [0.89, 2.81] |
| 7 Any pharmacological analgesia Show forest plot | 3 | 1677 | Risk Ratio (M‐H, Fixed, 95% CI) | 0.99 [0.93, 1.04] |
| 7.1 Continuous CTG plus FBS | 2 | 849 | Risk Ratio (M‐H, Fixed, 95% CI) | 0.98 [0.90, 1.07] |
| 7.2 Continuous CTG alone ‐ no FBS | 2 | 828 | Risk Ratio (M‐H, Fixed, 95% CI) | 0.99 [0.92, 1.05] |
| Outcome or subgroup title | No. of studies | No. of participants | Statistical method | Effect size |
| 1 Perinatal mortality Show forest plot | 11 | 33513 | Risk Ratio (M‐H, Fixed, 95% CI) | 0.86 [0.59, 1.24] |
| 1.1 Primaparous women | 0 | 0 | Risk Ratio (M‐H, Fixed, 95% CI) | 0.0 [0.0, 0.0] |
| 1.2 Multiparous women | 0 | 0 | Risk Ratio (M‐H, Fixed, 95% CI) | 0.0 [0.0, 0.0] |
| 1.3 Both or parity not specified | 11 | 33513 | Risk Ratio (M‐H, Fixed, 95% CI) | 0.86 [0.59, 1.24] |
| 2 Neonatal seizures Show forest plot | 9 | 32386 | Risk Ratio (M‐H, Fixed, 95% CI) | 0.50 [0.31, 0.80] |
| 2.1 Primaparous women | 0 | 0 | Risk Ratio (M‐H, Fixed, 95% CI) | 0.0 [0.0, 0.0] |
| 2.2 Multiparous women | 0 | 0 | Risk Ratio (M‐H, Fixed, 95% CI) | 0.0 [0.0, 0.0] |
| 2.3 Both or parity not specified | 9 | 32386 | Risk Ratio (M‐H, Fixed, 95% CI) | 0.50 [0.31, 0.80] |
| 3 Cerebral palsy Show forest plot | 2 | 13252 | Risk Ratio (M‐H, Fixed, 95% CI) | 1.74 [0.97, 3.11] |
| 3.1 Primaparous women | 0 | 0 | Risk Ratio (M‐H, Fixed, 95% CI) | 0.0 [0.0, 0.0] |
| 3.2 Multiparous women | 0 | 0 | Risk Ratio (M‐H, Fixed, 95% CI) | 0.0 [0.0, 0.0] |
| 3.3 Both or parity not specified | 2 | 13252 | Risk Ratio (M‐H, Fixed, 95% CI) | 1.74 [0.97, 3.11] |
| 4 Caesarean section Show forest plot | 11 | 18961 | Risk Ratio (M‐H, Fixed, 95% CI) | 1.44 [1.26, 1.64] |
| 4.1 Primaparous women | 0 | 0 | Risk Ratio (M‐H, Fixed, 95% CI) | 0.0 [0.0, 0.0] |
| 4.2 Multiparous women | 1 | 100 | Risk Ratio (M‐H, Fixed, 95% CI) | 1.55 [0.81, 2.96] |
| 4.3 Both or parity not specified | 11 | 18861 | Risk Ratio (M‐H, Fixed, 95% CI) | 1.43 [1.25, 1.64] |
| 5 Instrumental vaginal birth Show forest plot | 10 | 18715 | Risk Ratio (M‐H, Fixed, 95% CI) | 1.21 [1.12, 1.30] |
| 5.1 Primaparous women | 0 | 0 | Risk Ratio (M‐H, Fixed, 95% CI) | 0.0 [0.0, 0.0] |
| 5.2 Multiparous women | 1 | 100 | Risk Ratio (M‐H, Fixed, 95% CI) | 0.33 [0.04, 3.10] |
| 5.3 Both or parity not specified | 10 | 18615 | Risk Ratio (M‐H, Fixed, 95% CI) | 1.21 [1.12, 1.31] |
| 6 Cord blood acidosis Show forest plot | 2 | 2494 | Risk Ratio (M‐H, Fixed, 95% CI) | 1.16 [0.72, 1.89] |
| 6.1 Primaparous women | 0 | 0 | Risk Ratio (M‐H, Fixed, 95% CI) | 0.0 [0.0, 0.0] |
| 6.2 Multiparous women | 0 | 0 | Risk Ratio (M‐H, Fixed, 95% CI) | 0.0 [0.0, 0.0] |
| 6.3 Both or parity not specified | 2 | 2494 | Risk Ratio (M‐H, Fixed, 95% CI) | 1.16 [0.72, 1.89] |
| 7 Any pharmacological analgesia Show forest plot | 3 | 1677 | Risk Ratio (M‐H, Fixed, 95% CI) | 0.99 [0.93, 1.04] |
| 7.1 Primaparous women | 0 | 0 | Risk Ratio (M‐H, Fixed, 95% CI) | 0.0 [0.0, 0.0] |
| 7.2 Multiparous women | 0 | 0 | Risk Ratio (M‐H, Fixed, 95% CI) | 0.0 [0.0, 0.0] |
| 7.3 Both or parity not specified | 3 | 1677 | Risk Ratio (M‐H, Fixed, 95% CI) | 0.99 [0.93, 1.04] |
| Outcome or subgroup title | No. of studies | No. of participants | Statistical method | Effect size |
| 1 Perinatal mortality Show forest plot | 11 | 33513 | Risk Ratio (M‐H, Fixed, 95% CI) | 0.86 [0.59, 1.24] |
| 1.1 High‐quality trials | 2 | 13434 | Risk Ratio (M‐H, Fixed, 95% CI) | 1.00 [0.49, 2.05] |
| 1.2 Low‐quality trials | 4 | 17173 | Risk Ratio (M‐H, Fixed, 95% CI) | 0.58 [0.28, 1.18] |
| 1.3 Quality of trials unclear | 5 | 2906 | Risk Ratio (M‐H, Fixed, 95% CI) | 1.00 [0.58, 1.71] |
| 2 Neonatal seizures Show forest plot | 9 | 32386 | Risk Ratio (M‐H, Fixed, 95% CI) | 0.50 [0.31, 0.80] |
| 2.1 High‐quality trials | 2 | 13434 | Risk Ratio (M‐H, Fixed, 95% CI) | 0.40 [0.21, 0.77] |
| 2.2 Low‐quality trials | 2 | 16046 | Risk Ratio (M‐H, Fixed, 95% CI) | 0.26 [0.04, 1.60] |
| 2.3 Quality of trials unclear | 5 | 2906 | Risk Ratio (M‐H, Fixed, 95% CI) | 0.83 [0.38, 1.81] |
| 3 Cerebral palsy Show forest plot | 2 | 13252 | Risk Ratio (M‐H, Fixed, 95% CI) | 1.74 [0.97, 3.11] |
| 3.1 High‐quality trials | 1 | 13079 | Risk Ratio (M‐H, Fixed, 95% CI) | 1.20 [0.52, 2.79] |
| 3.2 Low‐quality trials | 0 | 0 | Risk Ratio (M‐H, Fixed, 95% CI) | 0.0 [0.0, 0.0] |
| 3.3 Quality of trials unclear | 1 | 173 | Risk Ratio (M‐H, Fixed, 95% CI) | 2.54 [1.10, 5.86] |
| 4 Caesarean section Show forest plot | 11 | 18861 | Risk Ratio (M‐H, Random, 95% CI) | 1.63 [1.29, 2.07] |
| 4.1 High‐quality trials | 2 | 13314 | Risk Ratio (M‐H, Random, 95% CI) | 1.27 [0.88, 1.83] |
| 4.2 Low‐quality trials | 3 | 2555 | Risk Ratio (M‐H, Random, 95% CI) | 1.77 [0.92, 3.41] |
| 4.3 Quality of trials unclear | 6 | 2992 | Risk Ratio (M‐H, Random, 95% CI) | 1.81 [1.34, 2.44] |
| 5 Instrumental vaginal birth Show forest plot | 10 | 18615 | Risk Ratio (M‐H, Fixed, 95% CI) | 1.21 [1.12, 1.31] |
| 5.1 High‐quality trials | 2 | 13314 | Risk Ratio (M‐H, Fixed, 95% CI) | 1.26 [1.13, 1.42] |
| 5.2 Low‐quality trials | 3 | 2555 | Risk Ratio (M‐H, Fixed, 95% CI) | 1.39 [1.17, 1.64] |
| 5.3 Quality of trials unclear | 5 | 2746 | Risk Ratio (M‐H, Fixed, 95% CI) | 1.00 [0.87, 1.16] |
| 6 Cord blood acidosis Show forest plot | 2 | 2494 | Risk Ratio (M‐H, Fixed, 95% CI) | 1.16 [0.72, 1.89] |
| 6.1 High‐quality trials | 1 | 1075 | Risk Ratio (M‐H, Fixed, 95% CI) | 0.45 [0.16, 1.29] |
| 6.2 Low‐quality trials | 1 | 1419 | Risk Ratio (M‐H, Fixed, 95% CI) | 1.58 [0.89, 2.81] |
| 6.3 Quality of trials unclear | 0 | 0 | Risk Ratio (M‐H, Fixed, 95% CI) | 0.0 [0.0, 0.0] |
| 7 Any pharmacological analgesia Show forest plot | 3 | 1677 | Risk Ratio (M‐H, Fixed, 95% CI) | 0.99 [0.93, 1.04] |
| 7.1 High‐quality trials | 0 | 0 | Risk Ratio (M‐H, Fixed, 95% CI) | 0.0 [0.0, 0.0] |
| 7.2 Low‐quality trials | 0 | 0 | Risk Ratio (M‐H, Fixed, 95% CI) | 0.0 [0.0, 0.0] |
| 7.3 Quality of trials unclear | 3 | 1677 | Risk Ratio (M‐H, Fixed, 95% CI) | 0.99 [0.93, 1.04] |
| Outcome or subgroup title | No. of studies | No. of participants | Statistical method | Effect size |
| 1 Caesarean section (main outcome) Show forest plot | 1 | 4044 | Risk Ratio (M‐H, Fixed, 95% CI) | 1.29 [0.84, 1.97] |
| 2 Instrumental vaginal birth (main outcome) Show forest plot | 1 | 4044 | Risk Ratio (M‐H, Fixed, 95% CI) | 1.16 [0.92, 1.46] |
| 3 Cord blood acidosis (main outcome) Show forest plot | 1 | 4044 | Risk Ratio (M‐H, Fixed, 95% CI) | 1.43 [0.95, 2.14] |
| 4 Apgar score < 7 at 5 minutes Show forest plot | 1 | 4044 | Risk Ratio (M‐H, Fixed, 95% CI) | 2.65 [0.70, 9.97] |
| 5 Neonatal ICU admissions Show forest plot | 1 | 4044 | Risk Ratio (M‐H, Fixed, 95% CI) | 1.34 [0.91, 1.98] |
| 6 Caesarean section for abnormal FHR pattern and/or acidosis Show forest plot | 1 | 4044 | Risk Ratio (M‐H, Fixed, 95% CI) | 1.19 [0.66, 2.15] |
| 7 Spontaneous vaginal birth Show forest plot | 1 | 4044 | Risk Ratio (M‐H, Fixed, 95% CI) | 0.98 [0.96, 1.00] |
| 8 Epidural analgesia Show forest plot | 1 | 4044 | Risk Ratio (M‐H, Fixed, 95% CI) | 1.06 [0.92, 1.21] |