Scolaris Content Display Scolaris Content Display

Study flow diagram.
Figuras y tablas -
Figure 1

Study flow diagram.

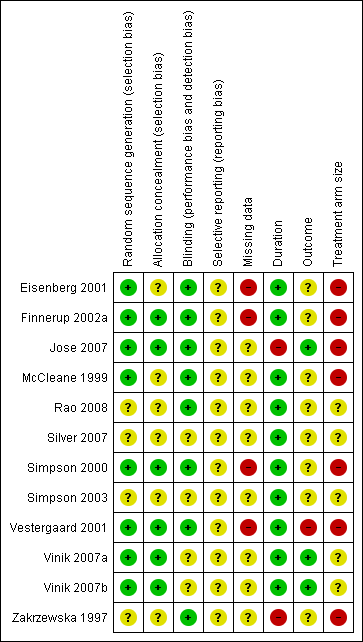
Risk of bias summary: review authors' judgements about each risk of bias item for each included study.
Figuras y tablas -
Figure 2

Risk of bias summary: review authors' judgements about each risk of bias item for each included study.

Forest plot of comparison: 1 Painful diabetic neuropathy, outcome: 1.1 50% pain relief.
Figuras y tablas -
Figure 3

Forest plot of comparison: 1 Painful diabetic neuropathy, outcome: 1.1 50% pain relief.

Forest plot of comparison: 2 All conditions: lamotrigine versus placebo, outcome: 2.2 Rash.
Figuras y tablas -
Figure 4

Forest plot of comparison: 2 All conditions: lamotrigine versus placebo, outcome: 2.2 Rash.

Comparison 1 Painful diabetic neuropathy: lamotrigine versus placebo, Outcome 1 50% pain relief.
Figuras y tablas -
Analysis 1.1

Comparison 1 Painful diabetic neuropathy: lamotrigine versus placebo, Outcome 1 50% pain relief.

Comparison 2 All conditions: lamotrigine versus placebo, Outcome 1 At least one adverse event.
Figuras y tablas -
Analysis 2.1

Comparison 2 All conditions: lamotrigine versus placebo, Outcome 1 At least one adverse event.

Comparison 2 All conditions: lamotrigine versus placebo, Outcome 2 Rash.
Figuras y tablas -
Analysis 2.2

Comparison 2 All conditions: lamotrigine versus placebo, Outcome 2 Rash.

Summary of findings for the main comparison. Lamotrigine 200 to 400 mg versus placebo for neuropathic pain

Lamotrigine compared with placebo for painful diabetic neuropathy

Patient or population: neuropathic pain (three studies in painful diabetic neuropathy)

Settings: Community

Intervention: oral lamotrigine 200 to 400 mg daily

Comparison: placebo

Outcomes

Probable outcome with

Risk ratio

NNTor NNH

(95% CI)

No of studies, attacks, events

Quality of the evidence
(GRADE)

Comments

comparator

intervention

At least 50% of maximum pain relief

240 in 1000

260 in 1000

RR 1.1 (0.82 to 1.4)

NNT not calculated

3 studies, 773 participants, 195 events

High

Unlikely that further research would reveal significant benefit, especially as potential high positive bias exists in the calculations we have because of LOCF imputation or completer analyses

Participants with at least 1 adverse event (all conditions)

622 in 1000

717 in 1000

RR 1.1 (1.01 to 1.2)

NNH 10 (6.5 to 27)

7 studies, 1121 participants, 768 events

High

Large numbers of events

Participants with a serious adverse event (all conditions)

No data

Very low

No data

Participants with rash (all conditions)

56 in 1000

95 in 1000

RR 1.4 (1.01 to 2.0)

NNH 27 (16 to 89)

12 studies, 1715 participants, 138 events

Moderate

Modest number of events

Deaths (all conditions)

No data

Very low

No data

GRADE Working Group grades of evidence
High quality: Further research is very unlikely to change our confidence in the estimate of effect.
Moderate quality: Further research is likely to have an important impact on our confidence in the estimate of effect and may change the estimate.
Low quality: Further research is very likely to have an important impact on our confidence in the estimate of effect and is likely to change the estimate.
Very low quality: We are very uncertain about the estimate.

LOCF: last observation carried forward; NNT: number needed to treat for an additional beneficial outcome: NNH: number needed to treat for an additional harmful outcome; RR: risk ratio

Figuras y tablas -
Summary of findings for the main comparison. Lamotrigine 200 to 400 mg versus placebo for neuropathic pain
Comparison 1. Painful diabetic neuropathy: lamotrigine versus placebo

Outcome or subgroup title

No. of studies

No. of participants

Statistical method

Effect size

1 50% pain relief Show forest plot

3

773

Risk Ratio (M‐H, Fixed, 95% CI)

1.08 [0.82, 1.42]

Figuras y tablas -
Comparison 1. Painful diabetic neuropathy: lamotrigine versus placebo
Comparison 2. All conditions: lamotrigine versus placebo

Outcome or subgroup title

No. of studies

No. of participants

Statistical method

Effect size

1 At least one adverse event Show forest plot

7

1121

Risk Ratio (M‐H, Fixed, 95% CI)

1.11 [1.01, 1.22]

2 Rash Show forest plot

12

1715

Risk Ratio (M‐H, Fixed, 95% CI)

1.43 [1.01, 2.03]

Figuras y tablas -
Comparison 2. All conditions: lamotrigine versus placebo