| 1 Mortality ‐ low versus high dose studies Show forest plot | 11 | | Risk Ratio (M‐H, Random, 95% CI) | Subtotals only |
|
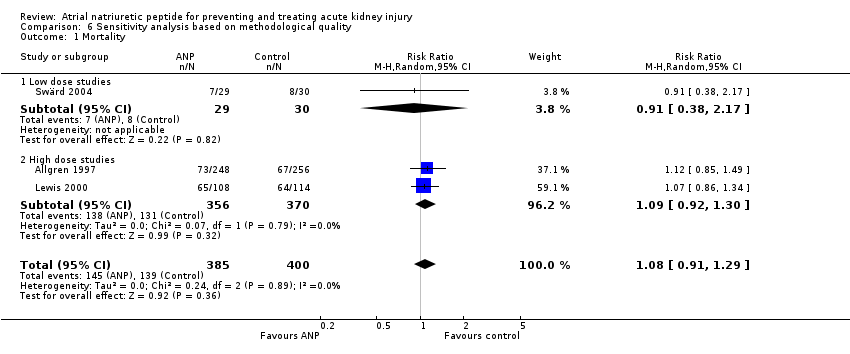
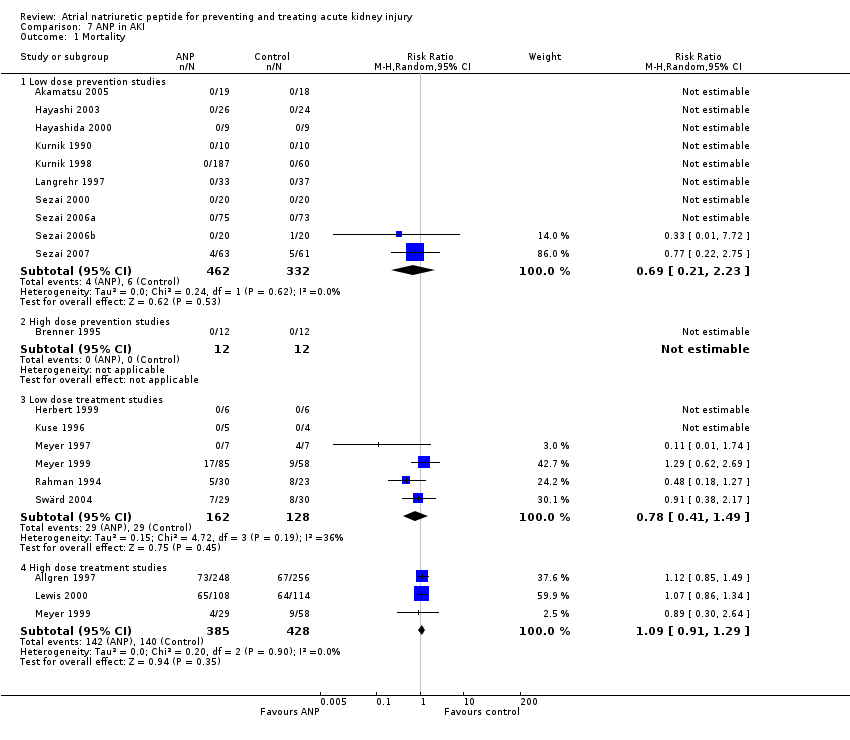
| 1.1 Low dose studies | 10 | 794 | Risk Ratio (M‐H, Random, 95% CI) | 0.69 [0.21, 2.23] |
| 1.2 High dose studies | 1 | 24 | Risk Ratio (M‐H, Random, 95% CI) | 0.0 [0.0, 0.0] |
| 2 Mortality ‐ active versus placebo/no treatment control group Show forest plot | 11 | | Risk Ratio (M‐H, Random, 95% CI) | Subtotals only |
|
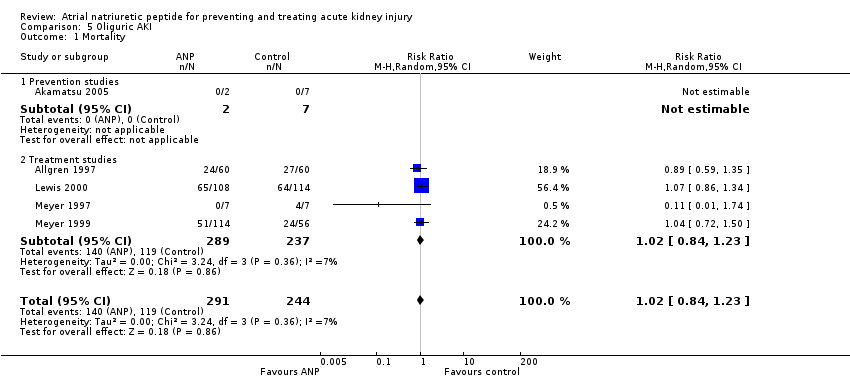
| 2.1 Active control group | 2 | 57 | Risk Ratio (M‐H, Random, 95% CI) | 0.0 [0.0, 0.0] |
| 2.2 Placebo/no treatment control group | 9 | 761 | Risk Ratio (M‐H, Random, 95% CI) | 0.69 [0.21, 2.23] |
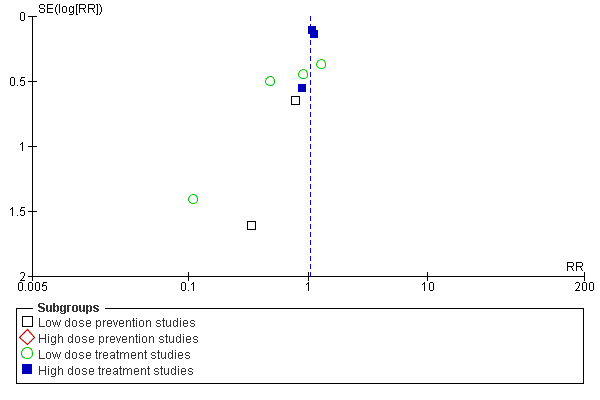
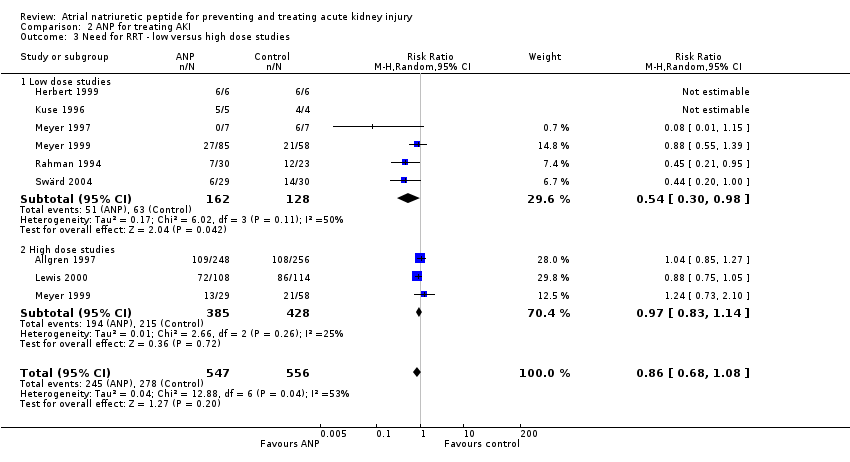
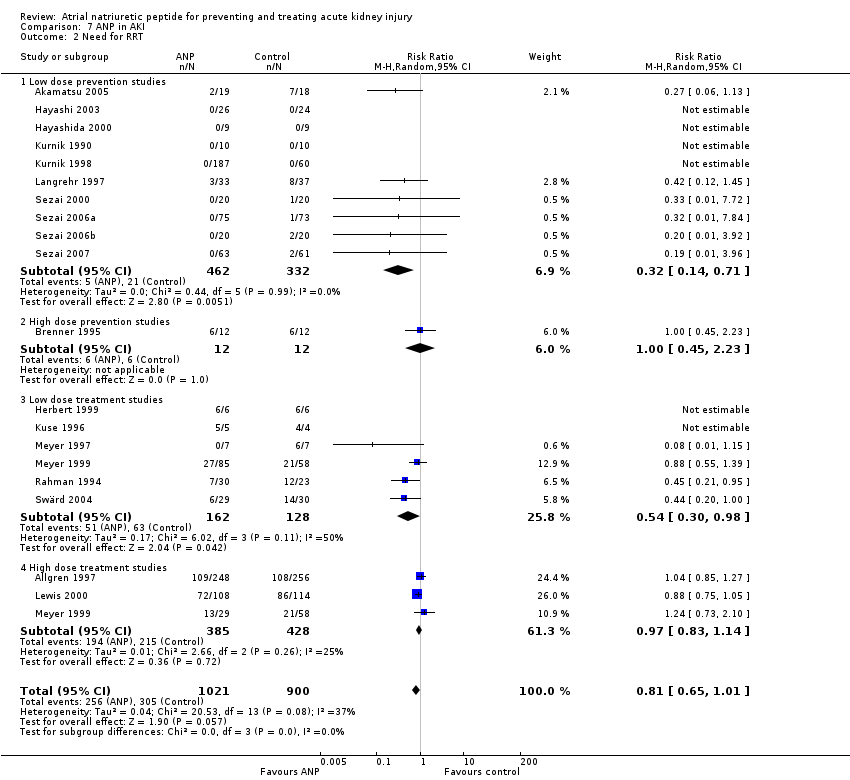
| 3 Need for RRT ‐ low versus high dose studies Show forest plot | 11 | 818 | Risk Ratio (M‐H, Random, 95% CI) | 0.56 [0.32, 0.99] |
|
| 3.1 Low dose studies | 10 | 794 | Risk Ratio (M‐H, Random, 95% CI) | 0.32 [0.14, 0.71] |
| 3.2 High dose studies | 1 | 24 | Risk Ratio (M‐H, Random, 95% CI) | 1.0 [0.45, 2.23] |
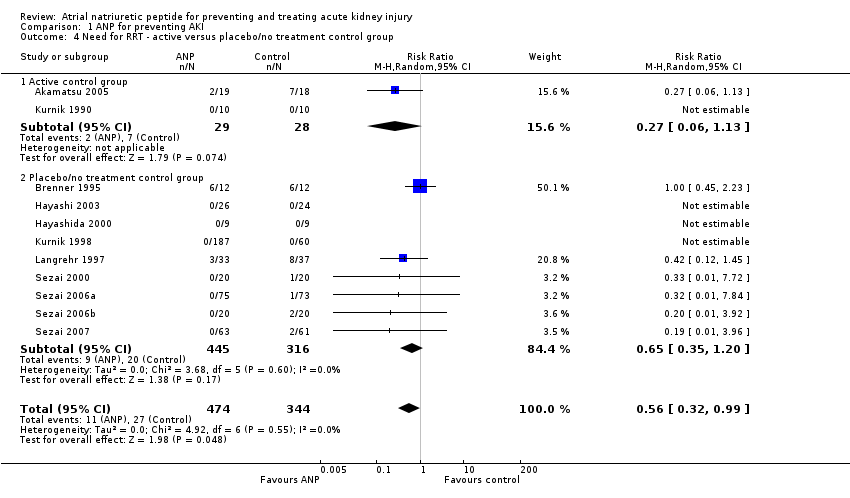
| 4 Need for RRT ‐ active versus placebo/no treatment control group Show forest plot | 11 | 818 | Risk Ratio (M‐H, Random, 95% CI) | 0.56 [0.32, 0.99] |
|
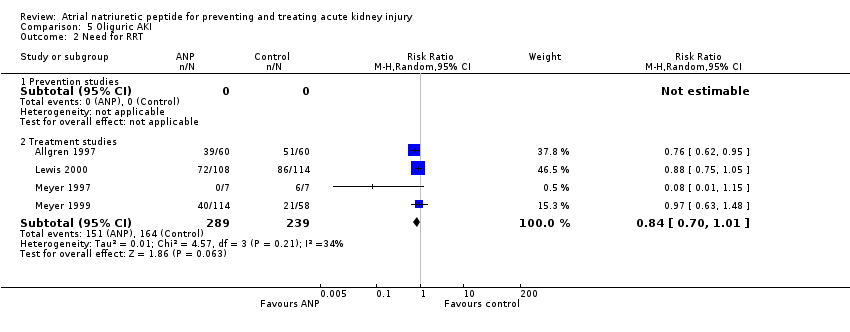
| 4.1 Active control group | 2 | 57 | Risk Ratio (M‐H, Random, 95% CI) | 0.27 [0.06, 1.13] |
| 4.2 Placebo/no treatment control group | 9 | 761 | Risk Ratio (M‐H, Random, 95% CI) | 0.65 [0.35, 1.20] |
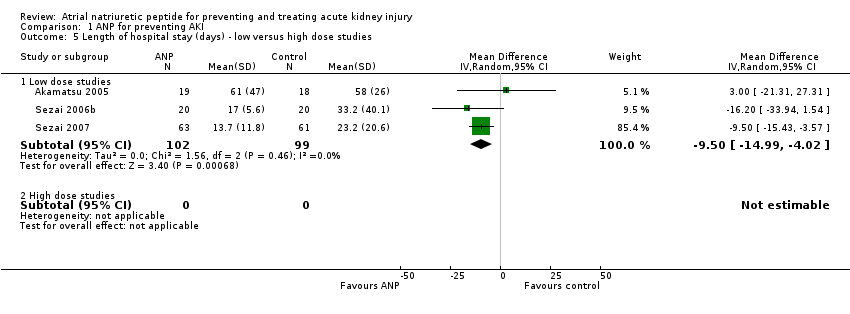
| 5 Length of hospital stay (days) ‐ low versus high dose studies Show forest plot | 3 | | Mean Difference (IV, Random, 95% CI) | Subtotals only |
|
| 5.1 Low dose studies | 3 | 201 | Mean Difference (IV, Random, 95% CI) | ‐9.50 [‐14.99, ‐4.02] |
| 5.2 High dose studies | 0 | 0 | Mean Difference (IV, Random, 95% CI) | 0.0 [0.0, 0.0] |
| 6 Length of hospital stay (days) ‐ active versus placebo/no treatment control group Show forest plot | 3 | 201 | Mean Difference (IV, Random, 95% CI) | ‐9.50 [‐14.99, ‐4.02] |
|
| 6.1 Active control group | 1 | 37 | Mean Difference (IV, Random, 95% CI) | 3.0 [‐21.31, 27.31] |
| 6.2 Placebo/no treatment control group | 2 | 164 | Mean Difference (IV, Random, 95% CI) | ‐10.17 [‐15.80, ‐4.55] |
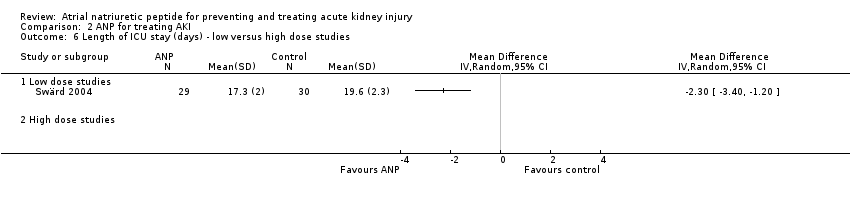
| 7 Length of ICU stay (days) ‐ low versus high dose studies Show forest plot | 4 | 219 | Mean Difference (IV, Random, 95% CI) | ‐0.90 [‐1.79, ‐0.01] |
|
| 7.1 Low dose studies | 4 | 219 | Mean Difference (IV, Random, 95% CI) | ‐0.90 [‐1.79, ‐0.01] |
| 7.2 High dose studies | 0 | 0 | Mean Difference (IV, Random, 95% CI) | 0.0 [0.0, 0.0] |
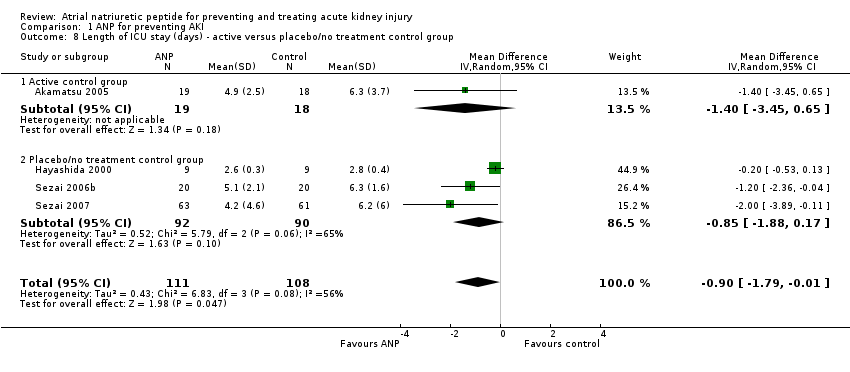
| 8 Length of ICU stay (days) ‐ active versus placebo/no treatment control group Show forest plot | 4 | 219 | Mean Difference (IV, Random, 95% CI) | ‐0.90 [‐1.79, ‐0.01] |
|
| 8.1 Active control group | 1 | 37 | Mean Difference (IV, Random, 95% CI) | ‐1.40 [‐3.45, 0.65] |
| 8.2 Placebo/no treatment control group | 3 | 182 | Mean Difference (IV, Random, 95% CI) | ‐0.85 [‐1.88, 0.17] |
| 9 Change in SCr (mg/dL) ‐ low versus high dose studies Show forest plot | 2 | | Mean Difference (IV, Random, 95% CI) | Subtotals only |
|
| 9.1 Low dose studies | 2 | 57 | Mean Difference (IV, Random, 95% CI) | 0.13 [‐0.15, 0.42] |
| 9.2 High dose studies | 0 | 0 | Mean Difference (IV, Random, 95% CI) | 0.0 [0.0, 0.0] |
| 10 Change in SCr (mg/dL) ‐ active versus placebo/no treatment control group Show forest plot | 2 | | Mean Difference (IV, Random, 95% CI) | Subtotals only |
|
| 10.1 Active control group | 2 | 57 | Mean Difference (IV, Random, 95% CI) | 0.13 [‐0.15, 0.42] |
| 10.2 Placebo/no treatment control | 0 | 0 | Mean Difference (IV, Random, 95% CI) | 0.0 [0.0, 0.0] |
| 11 Hypotension ‐ low versus high dose studies Show forest plot | 10 | | Risk Ratio (M‐H, Random, 95% CI) | Totals not selected |
|
| 11.1 Low dose studies | 9 | | Risk Ratio (M‐H, Random, 95% CI) | 0.0 [0.0, 0.0] |
| 11.2 High dose studies | 1 | | Risk Ratio (M‐H, Random, 95% CI) | 0.0 [0.0, 0.0] |
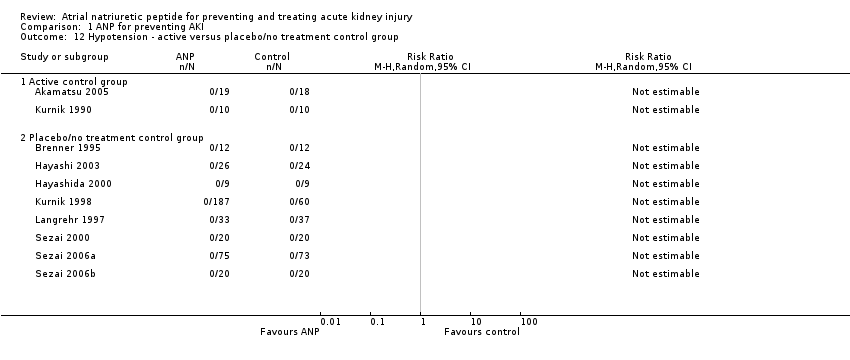
| 12 Hypotension ‐ active versus placebo/no treatment control group Show forest plot | 10 | | Risk Ratio (M‐H, Random, 95% CI) | Totals not selected |
|
| 12.1 Active control group | 2 | | Risk Ratio (M‐H, Random, 95% CI) | 0.0 [0.0, 0.0] |
| 12.2 Placebo/no treatment control group | 8 | | Risk Ratio (M‐H, Random, 95% CI) | 0.0 [0.0, 0.0] |
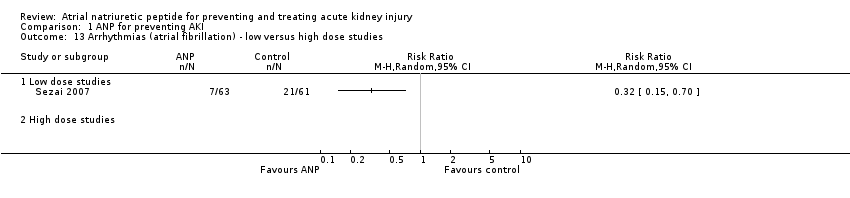
| 13 Arrhythmias (atrial fibrillation) ‐ low versus high dose studies Show forest plot | 1 | | Risk Ratio (M‐H, Random, 95% CI) | Totals not selected |
|
| 13.1 Low dose studies | 1 | | Risk Ratio (M‐H, Random, 95% CI) | 0.0 [0.0, 0.0] |
| 13.2 High dose studies | 0 | | Risk Ratio (M‐H, Random, 95% CI) | 0.0 [0.0, 0.0] |
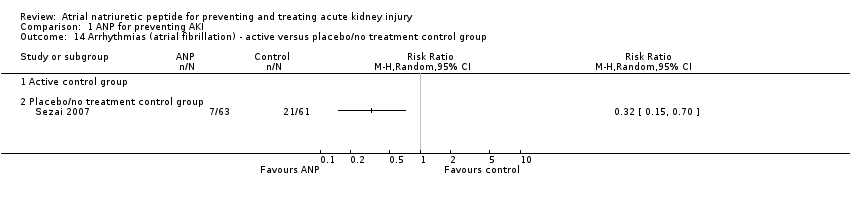
| 14 Arrhythmias (atrial fibrillation) ‐ active versus placebo/no treatment control group Show forest plot | 1 | | Risk Ratio (M‐H, Random, 95% CI) | Totals not selected |
|
| 14.1 Active control group | 0 | | Risk Ratio (M‐H, Random, 95% CI) | 0.0 [0.0, 0.0] |
| 14.2 Placebo/no treatment control group | 1 | | Risk Ratio (M‐H, Random, 95% CI) | 0.0 [0.0, 0.0] |
| 15 Arrhythmias (premature ventricular contractions) ‐ low versus high dose studies Show forest plot | 2 | | Risk Ratio (M‐H, Random, 95% CI) | Subtotals only |
|
| 15.1 Low dose studies | 2 | 272 | Risk Ratio (M‐H, Random, 95% CI) | 0.26 [0.14, 0.48] |
| 15.2 High dose studies | 0 | 0 | Risk Ratio (M‐H, Random, 95% CI) | 0.0 [0.0, 0.0] |
| 16 Arrhythmias (premature ventricular contractions) ‐ active versus placebo/no treatment control group Show forest plot | 2 | | Risk Ratio (M‐H, Random, 95% CI) | Subtotals only |
|
| 16.1 Active control group | 0 | 0 | Risk Ratio (M‐H, Random, 95% CI) | 0.0 [0.0, 0.0] |
| 16.2 Placebo/no treatment group | 2 | 272 | Risk Ratio (M‐H, Random, 95% CI) | 0.26 [0.14, 0.48] |
| 17 Arrhythmias (ventricular tachycardia) ‐ low versus high dose studies Show forest plot | 1 | | Risk Ratio (M‐H, Random, 95% CI) | Totals not selected |
|
| 17.1 Low dose studies | 1 | | Risk Ratio (M‐H, Random, 95% CI) | 0.0 [0.0, 0.0] |
| 17.2 High dose studies | 0 | | Risk Ratio (M‐H, Random, 95% CI) | 0.0 [0.0, 0.0] |
| 18 Arrhythmias (ventricular tachycardia) ‐ active versus placebo/no treatment control group Show forest plot | 1 | | Risk Ratio (M‐H, Random, 95% CI) | Totals not selected |
|
| 18.1 Active control group | 0 | | Risk Ratio (M‐H, Random, 95% CI) | 0.0 [0.0, 0.0] |
| 18.2 Placebo/no treatment control group | 1 | | Risk Ratio (M‐H, Random, 95% CI) | 0.0 [0.0, 0.0] |