Scolaris Content Display Scolaris Content Display

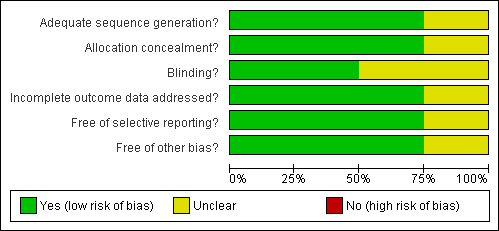
Methodological quality graph: review authors' judgements about each methodological quality item presented as percentages across all included studies.
Figuras y tablas -
Figure 1

Methodological quality graph: review authors' judgements about each methodological quality item presented as percentages across all included studies.

Methodological quality summary: review authors' judgements about each methodological quality item for each included study.
Figuras y tablas -
Figure 2

Methodological quality summary: review authors' judgements about each methodological quality item for each included study.

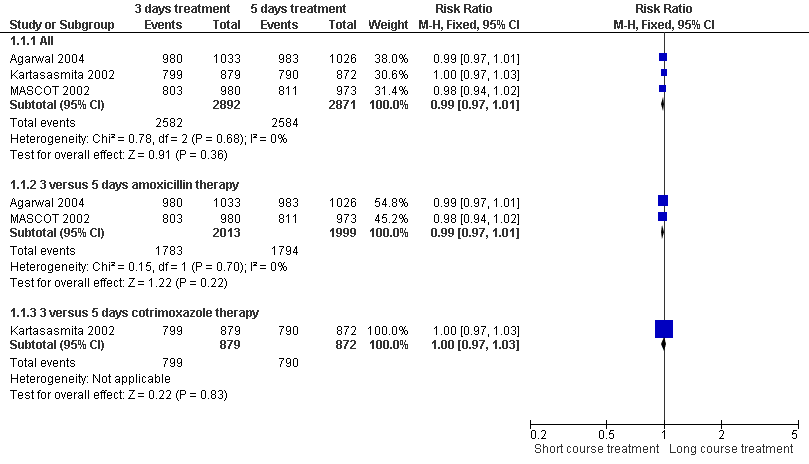
Forest plot of comparison: 1 3 days versus 5 days treatment with the same antibiotic, outcome: 1.1 Clinical cure.
Figuras y tablas -
Figure 3

Forest plot of comparison: 1 3 days versus 5 days treatment with the same antibiotic, outcome: 1.1 Clinical cure.

Forest plot of comparison: 1 3 days versus 5 days treatment with the same antibiotic, outcome: 1.2 Treatment failure.
Figuras y tablas -
Figure 4

Forest plot of comparison: 1 3 days versus 5 days treatment with the same antibiotic, outcome: 1.2 Treatment failure.

Forest plot of comparison: 1 3 days versus 5 days treatment with the same antibiotic, outcome: 1.3 Relapse rate.
Figuras y tablas -
Figure 5

Forest plot of comparison: 1 3 days versus 5 days treatment with the same antibiotic, outcome: 1.3 Relapse rate.

Comparison 1 3 days versus 5 days treatment with the same antibiotic, Outcome 1 Clinical cure.
Figuras y tablas -
Analysis 1.1

Comparison 1 3 days versus 5 days treatment with the same antibiotic, Outcome 1 Clinical cure.

Comparison 1 3 days versus 5 days treatment with the same antibiotic, Outcome 2 Treatment failure.
Figuras y tablas -
Analysis 1.2

Comparison 1 3 days versus 5 days treatment with the same antibiotic, Outcome 2 Treatment failure.

Comparison 1 3 days versus 5 days treatment with the same antibiotic, Outcome 3 Relapse rate.
Figuras y tablas -
Analysis 1.3

Comparison 1 3 days versus 5 days treatment with the same antibiotic, Outcome 3 Relapse rate.

Comparison 1. 3 days versus 5 days treatment with the same antibiotic

Outcome or subgroup title

No. of studies

No. of participants

Statistical method

Effect size

1 Clinical cure Show forest plot

3

Risk Ratio (M‐H, Fixed, 95% CI)

Subtotals only

1.1 All

3

5763

Risk Ratio (M‐H, Fixed, 95% CI)

0.99 [0.97, 1.01]

1.2 3 versus 5 days amoxicillin therapy

2

4012

Risk Ratio (M‐H, Fixed, 95% CI)

0.99 [0.97, 1.01]

1.3 3 versus 5 days cotrimoxazole therapy

1

1751

Risk Ratio (M‐H, Fixed, 95% CI)

1.00 [0.97, 1.03]

2 Treatment failure Show forest plot

3

Risk Ratio (M‐H, Fixed, 95% CI)

Subtotals only

2.1 All

3

5763

Risk Ratio (M‐H, Fixed, 95% CI)

1.07 [0.92, 1.25]

2.2 3 versus 5 days amoxicillin therapy

2

4012

Risk Ratio (M‐H, Fixed, 95% CI)

1.11 [0.94, 1.33]

2.3 3 versus 5 days cotrimoxazole therapy

1

1751

Risk Ratio (M‐H, Fixed, 95% CI)

0.97 [0.72, 1.30]

3 Relapse rate Show forest plot

4

Risk Ratio (M‐H, Fixed, 95% CI)

Subtotals only

3.1 All

4

5469

Risk Ratio (M‐H, Fixed, 95% CI)

1.09 [0.84, 1.42]

3.2 3 versus 5 days amoxicillin therapy

2

3577

Risk Ratio (M‐H, Fixed, 95% CI)

1.05 [0.69, 1.60]

3.3 3 versus 5 days cotrimoxazole therapy

2

1892

Risk Ratio (M‐H, Fixed, 95% CI)

1.12 [0.80, 1.58]

Figuras y tablas -
Comparison 1. 3 days versus 5 days treatment with the same antibiotic