Oxigenoterapia para las infecciones de las vías respiratorias inferiores en niños de entre tres meses y 15 años de edad
Información
- DOI:
- https://doi.org/10.1002/14651858.CD005975.pub3Copiar DOI

- Base de datos:
-
- Cochrane Database of Systematic Reviews
- Versión publicada:
-
- 10 diciembre 2014see what's new
- Tipo:
-
- Intervention
- Etapa:
-
- Review
- Grupo Editorial Cochrane:
-
Grupo Cochrane de Infecciones respiratorias agudas
- Copyright:
-
- Copyright © 2014 The Cochrane Collaboration. Published by John Wiley & Sons, Ltd.
Cifras del artículo
Altmetric:
Citado por:
Autores
Contributions of authors
MXR was mainly responsible for writing the first version of this review, and drove and completed the whole updating process. CG and LCH reviewed and approved the final version for publication of the 2014 updated review.
Sources of support
Internal sources
-
Facultad de Medicina. Pontificia Universidad Javeriana, Colombia.
Protected the time dedicated by authors and gave monetary support to pay for full‐text articles.
External sources
-
The Effective Health Care Research Consortium, funded by the Department for International Development, UK.
Dr Claudia Granados Rugeles was supported by the Effective Health Care Research Consortium, which is funded by UK aid from the UK Government Department for International Development to work at the editorial office of the Acute Respiratory Infections Group, Faculty of Health Sciences and Medicine, Australia, to complete the update of this 2014 review.
Declarations of interest
Laura Patricia Charry‐Anzola: none known.
Claudia Granados Rugeles: none known.
Maria Ximena Rojas‐Reyes: none known.
Acknowledgements
We thank Sarah Thorning for designing and running the searches for updating the review. We also thank medical doctor Carolina Ardila Hani, research assistant at the Department of Clinical Epidemiology and Biostatistics, for assisting the authors in the updating process. To the Department of Clinical Epidemiology from the Faculty of Medicine of Pontificia Universidad Javeriana, for giving us the time and support to conduct this review. To all trial authors who kindly shared their data to improve the quality of this review. Finally, we wish to thank the following people for commenting on the first draft of the review manuscript: Anne Lyddiatt, Hasan Ashraf, Teresa Neeman and Peter Morris.
Version history
| Published | Title | Stage | Authors | Version |
| 2014 Dec 10 | Oxygen therapy for lower respiratory tract infections in children between 3 months and 15 years of age | Review | Maria Ximena Rojas‐Reyes, Claudia Granados Rugeles, Laura Patricia Charry‐Anzola | |
| 2009 Jan 21 | Oxygen therapy for lower respiratory tract infections in children between 3 months and 15 years of age | Review | Maria Ximena Rojas‐Reyes, Claudia Granados Rugeles, Laura Patricia Charry‐Anzola | |
| 2006 Apr 19 | Oxygen therapy for lower respiratory tract infections in children between 3 months and 15 years of age | Protocol | Maria Ximena Rojas, Claudia Granados Rugeles | |
Differences between protocol and review
As highlighted in the Types of studies section, during the development of this review we decided to consider observational studies for inclusion to respond to the following secondary objective (already considered in the protocol for this review): to determine the indications for oxygen therapy in children with LRTIs (i.e. to describe the oxygen saturation values or clinical signs that would indicate the use of oxygen therapy). The main reason for this deviation from the protocol was that, as we did not find any trials comparing oxygen versus no oxygen therapy in these patients, we could not determine the indications for that intervention for this specific population. We consider it very important that clinicians can make decisions about oxygen therapy in this population when no oximeters are available.
This decision involved an amendment to the search strategy, as described in the Search methods for identification of studies section.
As part of the update process we included an evaluation of certainty in the body of evidence by following the GRADE approach (see summary of findings Table for the main comparison).
Notes
This review has two large aims: one relates to the effectiveness and safety of oxygen supplementation therapy and oxygen delivery methods in children presenting with severe LRTI; the second aim is to identify clinical predictors of hypoxaemia in children. This last question has been addressed as a secondary objective and we tried to answer it by including observational studies that evaluated the diagnostic accuracy of the signs and symptoms of children presenting with LRTI in detecting hypoxaemia. However, we excluded studies conducted in specific populations with other respiratory problems (such as chronic pulmonary diseases, asthma, bronchopulmonary dysplasia, pulmonary hypertension, complicated pneumonia) and studies conducted in specific populations with other underlying diseases. There is an important amount of evidence addressing this question in specific populations, such as malnourished children that we, as authors, consider could be included as part of the synthesis of evidence as subgroup analyses in a review that specifically aims to address this diagnostic question.
The above reasons mean that in future publications we will split this review in two reviews: 1) one intervention review: 'Oxygen therapy for lower respiratory tract infections in children between 3 months and 15 years of age', which will focus just on the effectiveness and safety of oxygen therapy and oxygen delivery methods, and 2) one diagnostic test accuracy review, which will focus on signs and symptoms that accurately predict hypoxaemia. In doing this we will be able to use appropriate tools for synthesising the diagnostic test evidence (such as methods for summarising sensitivity and specificity results, and the specific GRADE framework for assessing the quality of evidence from diagnostic test studies). We will also be able to include new studies conducted in malnourished children and conduct the appropriate subgroup analysis by type and severity of underlying disease, altitude where patients live, etc.
Keywords
MeSH
Medical Subject Headings (MeSH) Keywords
Medical Subject Headings Check Words
Adolescent; Child; Child, Preschool; Humans; Infant;
PICO
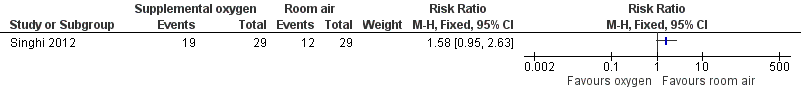
Forest plot of comparison: 1 Supplemental oxygen versus room air, outcome: 1.1 Incidence of subsequent hypoxaemia.

Forest plot of comparison: 1 Supplemental oxygen versus room air, outcome: 1.2 Duration of tachypnoea.
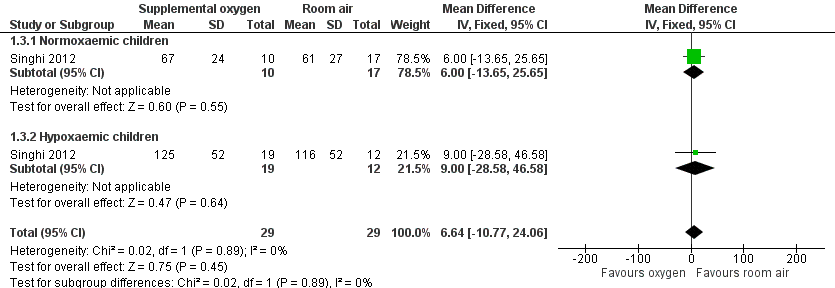
Forest plot of comparison: 1 Supplemental oxygen versus room air, outcome: 1.3 Duration of chest indrawing.

Forest plot of comparison: 2 Nasal prongs versus nasopharyngeal catheter, outcome: 2.1 Treatment failure to achieve adequate oxygenation.

Forest plot of comparison: 2 Nasal prongs versus nasopharyngeal catheter, outcome: 2.4 Nose ulceration or bleeding.

Forest plot of comparison: 2 Nasal prongs versus nasopharyngeal catheter, outcome: 2.6 Death during treatment.

Comparison 1 Supplemental oxygen versus room air, Outcome 1 Incidence of subsequent hypoxaemia.

Comparison 1 Supplemental oxygen versus room air, Outcome 2 Duration of tachypnoea.

Comparison 1 Supplemental oxygen versus room air, Outcome 3 Duration of chest indrawing.

Comparison 2 Nasal prongs versus nasopharyngeal catheter, Outcome 1 Treatment failure to achieve adequate oxygenation.
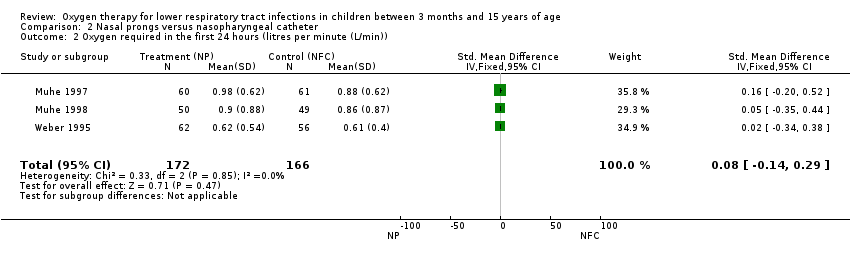
Comparison 2 Nasal prongs versus nasopharyngeal catheter, Outcome 2 Oxygen required in the first 24 hours (litres per minute (L/min)).

Comparison 2 Nasal prongs versus nasopharyngeal catheter, Outcome 3 Nasal obstruction/severe mucus production.

Comparison 2 Nasal prongs versus nasopharyngeal catheter, Outcome 4 Nose ulceration or bleeding.

Comparison 2 Nasal prongs versus nasopharyngeal catheter, Outcome 5 Fighting/discomfort in the first 24 hours.

Comparison 2 Nasal prongs versus nasopharyngeal catheter, Outcome 6 Death during treatment.
| Nasal prongs versus nasopharyngeal catheter for lower respiratory tract infections | ||||||
| Patient or population: children with acute lower respiratory tract infections | ||||||
| Outcomes | Illustrative comparative risks* (95% CI) | Relative effect | No. of participants | Quality of the evidence | Comments | |
| Assumed risk | Corresponding risk | |||||
| Nasopharyngeal catheter | Nasal prongs | |||||
| Treatment failure | Study population | RR 0.97 | 399 | ⊕⊝⊝⊝ | ||
| 91 per 1000 | 89 per 1000 | |||||
| Moderate | ||||||
| 107 per 1000 | 104 per 1000 | |||||
| Oxygen required in the first 24 hours | The mean oxygen required in the first 24 hours in the intervention groups was | 338 | ⊕⊕⊝⊝ | SMD 0.08 (‐0.14 to 0.29) | ||
| Nasal obstruction/severe mucus production | Study population | RR 0.2 | 338 | ⊕⊕⊝⊝ | ||
| 199 per 1000 | 40 per 1000 | |||||
| Moderate | ||||||
| 213 per 1000 | 43 per 1000 | |||||
| Nose ulceration or bleeding | Study population | RR 0.43 | 338 | ⊕⊕⊝⊝ | ||
| 96 per 1000 | 41 per 1000 | |||||
| Moderate | ||||||
| 61 per 1000 | 26 per 1000 | |||||
| Fighting/discomfort in the first 24 hours | Study population | RR 0.77 | 239 | ⊕⊕⊝⊝ | ||
| 205 per 1000 | 158 per 1000 | |||||
| Moderate | ||||||
| 210 per 1000 | 162 per 1000 | |||||
| Death during treatment | Study population | RR 0.64 | 338 | ⊕⊕⊝⊝ | ||
| 145 per 1000 | 93 per 1000 | |||||
| Moderate | ||||||
| 122 per 1000 | 78 per 1000 | |||||
| *The basis for the assumed risk (e.g. the median control group risk across studies) is provided in footnotes. The corresponding risk (and its 95% confidence interval) is based on the assumed risk in the comparison group and the relative effect of the intervention (and its 95% CI). | ||||||
| GRADE Working Group grades of evidence | ||||||
| 1One trial used quasi‐randomised methods for assignment of interventions. Evaluation of the main outcome was not blinded in all studies. | ||||||
| Face mask compared to nasopharyngeal catheter for severe acute LRTIs in children | ||||||
| Patient or population: children with severe acute LRTIs | ||||||
| Outcomes | Illustrative comparative risks* (95% CI) | Relative effect | No. of participants | Quality of the evidence | Comments | |
| Assumed risk | Corresponding risk | |||||
| Nasopharyngeal catheter | Face mask | |||||
| Treatment failure | Moderate | OR 0.20 | 80 | ⊕⊕⊝⊝ | ||
| 107 per 1000 | 23 per 1000 | |||||
| *The basis for the assumed risk (e.g. the median control group risk across studies) is provided in footnotes. The corresponding risk (and its 95% confidence interval) is based on the assumed risk in the comparison group and the relative effect of the intervention (and its 95% CI). | ||||||
| GRADE Working Group grades of evidence | ||||||
| 1Non‐randomised. Used sequential assignment methods. | ||||||
| Head box compared to nasopharyngeal catheter for severe acute LRTIs in children | ||||||
| Patient or population: children with severe acute LRTIs | ||||||
| Outcomes | Illustrative comparative risks* (95% CI) | Relative effect | No. of participants | Quality of the evidence | Comments | |
| Assumed risk | Corresponding risk | |||||
| Nasopharyngeal catheter | Head box | |||||
| Treatment failure | Moderate | OR 0.40 | 80 | ⊕⊝⊝⊝ | ||
| 107 per 1000 | 46 per 1000 | |||||
| *The basis for the assumed risk (e.g. the median control group risk across studies) is provided in footnotes. The corresponding risk (and its 95% confidence interval) is based on the assumed risk in the comparison group and the relative effect of the intervention (and its 95% CI). | ||||||
| GRADE Working Group grades of evidence | ||||||
| 1Non‐randomised. Used sequential assignment methods. | ||||||
| Study | Adverse event | Oxygen delivery method |
| Pneumocephalus in an 8‐month old girl with severe staphylococcal pneumonia | Nasopharyngeal catheter | |
| Pneumocephalus and right side severe exophthalmos in a 11‐month old boy with bacterial pneumonia and sinusitis | Nasopharyngeal catheter |
| Study | Altitude | Hypoxaemia | Age | Sensitivity | Specificity | LR+ |
| 3750 MASL | SpO2 < 82% | 2 to 11 months | 13 | 99 | 13 | |
| 3750 MASL | SpO2 < 85% | > 11 months | 13 | 99 | 13 | |
| 1670 MASL | SpO2 < 91% | 3 to 11 months | 9 | 96 | 2.3 | |
| 1600 MASL | SpO2 < 86% | 1 month to 5 years | 42 | 84 | 2.6 | |
| Sea level | SpO2 < 90% | 2 months to 5 years | 39 | 100 | ||
| Sea level | SpO2 < 90% | 2 to 36 months | 25 | 95 | 5.0 | |
| 1600 MASL | SpO2 < 88% | 1 month to 5 years | 38 | 98 | 19.9 | |
| 239 MASL | SpO2 < 90% | < 5 years | 14 | 96 | 3.7 | |
| 35 MASL | SpO2 < 93% | 1 month to 5 years | 74 | 93 | 10.5 | |
| 35 MASL | SpO2 < 90% | 1 month to 5 years | 70 | 75 | 2.8 | |
| 1336 MASL | SpO2 < 90% | 2 month to 5 years | 5 | 100 | ||
| Sea level | SpO2 < 90% | 2 months to 5 years | 20 | 100 | 66.9 | |
| MASL: metres above sea level LR: likelihood ratio | ||||||
| Study | Altitude | Hypoxaemia | Age | Sensitivity | Specificity | LR+ |
| 1670 MASL | SpO2 < 91% | 3 to 11 months | 64 | 73 | 2.4 | |
| 1670 MASL | SpO2 < 91% | 12 to 36 months | 56 | 76 | 2.3 | |
| 2640 MASL | SpO2 < 88% | 7 days to 36 months | 45 | 72 | 1.6 | |
| 1600 MASL | SpO2 < 86% | 3 months to 5 years | 42 | 89 | 3.8 | |
| Sea level | SpO2 < 90% | 2 months to 5 years | 48 | 61 | 1.2 | |
| Sea level | SpO2 < 90% | 2 to 36 months | 46 | 86 | 3.3 | |
| 1600 MASL | SpO2 < 88% | 1 month to 5 years | 22 | 87 | 1.6 | |
| 239 MASL | SpO2 < 90% | < 5 years | 14 | 93 | 1.9 | |
| 35 MASL | SpO2 < 93% | 1 month to 5 years | 82 | 72 | 3.0 | |
| 35 MASL | SpO2 < 90% | 1 month to 5 years | 90 | 61 | 2.3 | |
| 1336 MASL | SpO2 < 90% | 2 months to 5 years | 36 | 99 | 32.9 | |
| Sea level | SpO2 < 90% | 2 months to 5 years | 60 | 77 | 2.66 | |
| MASL: metres above sea level LR: likelihood ratio | ||||||
| Study | Altitude | Hypoxaemia | Age | Sensitivity | Specificity | LR+ |
| 2640 MASL | SpO2 < 88% | 7 days to 36 months | 63 | 65 | 1.8 | |
| 1600 MASL | SpO2 < 86% | 3 months to 5 years | 56 | 84 | 3.5 | |
| Sea level | SpO2 < 90% | 2 months to 5 years | 71 | 54 | 1.5 | |
| Sea level | SpO2 < 90% | 2 to 36 months | 98 | 17 | 1.2 | |
| 35 MASL | SpO2 < 93% | 1 month to 5 years | 71 | 58 | 1.7 | |
| 1336 MASL | SpO2 < 90% | 2 months to 5 years | 48 | 98 | 22.0 | |
| MASL: metres above sea level LR: likelihood ratio | ||||||
| Study | Altitude | Hypoxaemia | Type of indrawing | Age | Sensitivity | Specificity | LR+ |
| 3750 MASL | SpO2 < 82% | Any chest retractions | 2 to 11 months | 35 | 94 | 5.8 | |
| 3750 MASL | SpO2 < 85% | Any chest retractions | > 11 months | 35 | 94 | ||
| 1670 MASL | SpO2 < 91% | Any retractions | 3 to 11 months | 97 | 29 | 1.4 | |
| 1670 MASL | SpO2 < 91% | Any retractions | > 11 months | 88 | 30 | 1.3 | |
| 2640 MASL | SpO2 < 88% | Intercostal | 7 days to 36 months | 79 | 55 | 1.8 | |
| 2640 MASL | SpO2 < 88% | Subcostal | 7 days to 36 months | 76 | 43 | 1.3 | |
| 2640 MASL | SpO2 < 88% | Any chest retractions | 7 days to 36 months | 83 | 40 | 1.4 | |
| 1600 MASL | SpO2 < 86% | Indrawing | 1 week to 5 years | 98 | 7 | 1.1 | |
| Sea level | SpO2 < 90% | Intercostal indrawing | 2 months to 5 years | 65 | 69 | 2.1 | |
| Sea level | SpO2 < 90% | Lower chest indrawing | 2 months to 5 years | 74 | 37 | 1.2 | |
| 43 MASL | SpO2 < 95% | Any chest retractions | 1 month to 5 years | 59 | 63 | 1.6 | |
| 239 MASL | SpO2 < 90% | Intercostal indrawing | < 5 years | 32 | 88 | 2.6 | |
| 239 MASL | SpO2 < 90% | Lower chest indrawing | < 5 years | 36 | 86 | 2.6 | |
| 1336 MASL | SpO2 < 90% | Chest indrawing | 2 months to 5 years | 69 | 83 | 4.0 | |
| MASL: metres above sea level LR: likelihood ratio | |||||||
| Study | Altitude | Hypoxaemia | Definition | Age | Sensitivity | Specificity | LR+ | LR‐ |
| 1670 MASL | SpO2 < 91% | Unresponsive | 3 to 11 months | 63 | 67 | 1.9 | 0.6 | |
| 1670 MASL | SpO2 < 91% | Unresponsive | > 11 months | 56 | 78 | 2.5 | 0.6 | |
| 2640 MASL | SpO2 < 88% | Difficult to awake/abnormal sleepiness | 7 days to 36 months | 12 | 89 | 1.1 | 1.0 | |
| 1600 MASL | SpO2 < 86% | Decrease of consciousness/restlessness | 3 months to 5 years | 36 | 91 | 4.0 | 0.7 | |
| Sea level | SpO2 < 91% | Arousal | 2 months to 5 years | 70 | 78 | 3.2 | 0.4 | |
| Sea level | SpO2 < 91% | Irritability | 2 months to 5 years | 41 | 43 | 0.7 | 1.4 | |
| Sea level | SpO2 < 91% | Difficult to awake/abnormal sleepiness | 2 months to 5 years | 42 | 78 | 1.9 | 0.7 | |
| Sea level | SpO2 < 90% | No spontaneous movement | 2 to 36 months | 46 | 84 | 2.9 | 0.6 | |
| 1600 MASL | SpO2 < 88% | Reduced activity | 1 month to 5 years | 44 | 69 | 1.4 | 0.8 | |
| 35 MASL | SpO2 < 93% | Drowsy | 1 month to 5 years | 85 | 83 | 7.3 | 0.4 | |
| 35 MASL | SpO2 < 90% | Drowsy | 1 month to 5 years | 68 | 91 | 5.0 | 0.2 | |
| 1336 MASL | SpO2 < 90% | Lethargy | 2 months to 5 years | 40 | 100 | 0.6 | ||
| MASL: metres above sea level LR: likelihood ratio | ||||||||
| Study | Altitude | Hypoxaemia | Age | Sensitivity | Specificity | LR+ |
| 1670 MASL | SpO2 < 91% | 3 to 11 months | 50 | 75 | 2.0 | |
| 1670 MASL | SpO2 < 91% | > 12 months | 40 | 71 | 1.4 | |
| 2640 MASL | SpO2 < 88% | 7 days to 36 months | 35 | 60 | 0.9 | |
| Sea level | SpO2 < 90% | 2 months to 5 years | 71 | 67 | 2.2 | |
| Sea level | SpO2 < 90% | 2 to 36 months | 33 | 91 | 3.7 | |
| 1600 MASL | SpO2 < 88% | 1 month to 5 years | 42 | 76 | 1.8 | |
| 1336 MASL | SpO2 < 90% | 2 months to 5 years | 28 | 99 | 28 | |
| Sea level | SpO2 < 90% | 2 months to 5 years | 9 | 94 | 1.39 | |
| MASL: metres above sea level LR: likelihood ratio | ||||||
| Study | Altitude | Hypoxaemia | Tachypnoea | Age | Sensitivity | Specificity | LR+ |
| 1670 MASL | SpO2 < 91% | > 60 r/min | 3 to 11 months | 86 | 56 | 2.0 | |
| 1670 MASL | SpO2 < 91% | > 70 r/min | 3 to 11 months | 51 | 83 | 3.0 | |
| 2640 MASL | SpO2 < 88% | > 50 r/min | 0 to 11 months | 76 | 71 | 2.6 | |
| 2640 MASL | SpO2 < 88% | > 60 r/min | 0 to 11 months | 40 | 86 | 2.9 | |
| 2640 MASL | SpO2 < 88% | > 70 r/min | 0 to 11 months | 16 | 100 | ||
| 43 MASL | SpO2 < 95% | > 50 r/min | 2 to 11 months | 64 | 56 | 1.5 | |
| 239 MASL | SpO2 < 90% | > 50 r/min | 4 to 12 months | 89 | 24 | 1.2 | |
| 239 MASL | SpO2 < 90% | > 60 r/min | 4 to 12 months | 82 | 52 | 1.7 | |
| 239 MASL | SpO2 < 90% | > 70 r/min | 4 to 12 months | 54 | 78 | 2.5 | |
| 1336 MASL | SpO2 < 90% | > 50 r/min | 2 to 12 months | 90 | 44 | 1.6 | |
| MASL: metres above sea level LR: likelihood ratio | |||||||
| Study | Altitude | Hypoxaemia | Tachypnoea | Age | Sensitivity | Specificity | LR+ |
| 1670 MASL | SpO2 < 91% | > 60 r/min | 12 to 36 months | 65 | 76 | 2.7 | |
| 1670 MASL | SpO2 < 91% | > 70 r/min | 12 to 36 months | 32 | 90 | 3.2 | |
| 2640 MASL | SpO2 < 88% | > 50 r/min | 12 to 36 months | 39 | 71 | 1.3 | |
| 2640 MASL | SpO2 < 88% | > 60 r/min | 12 to 36 months | 12 | 100 | ||
| 2640 MASL | SpO2 < 88% | > 70 r/min | 12 to 36 months | 4 | 100 | ||
| 43 MASL | SpO2 < 95% | > 40 r/min | 12 months to 5 years | 64 | 56 | 1.4 | |
| 239 MASL | SpO2 < 90% | > 40 r/min | 12 months to 5 years | 89 | 24 | 1.2 | |
| 239 MASL | SpO2 < 90% | > 50 r/min | 12 months to 5 years | 82 | 52 | 1.7 | |
| 239 MASL | SpO2 < 90% | > 60 r/min | 12 months to 5 years | 54 | 78 | 2.5 | |
| 1336 MASL | SpO2 < 90% | > 40 r/min | 13 months to 5 years | 100 | 43 | 1.8 | |
| MASL: metres above sea level LR: likelihood ratio | |||||||
| Study | Altitude | Hypoxaemia | Age | Sensitivity | Specificity | LR+ | LR‐ |
| 3750 MASL | SpO2 < 82% | 2 to 11 months | 50 | 92 | 6.3 | 0.5 | |
| 1670 MASL | SpO2 < 91% | 3 to 11 months | 77 | 40 | 1.3 | 0.6 | |
| 1670 MASL | SpO2 < 91% | 12 to 36 months | 91 | 36 | 1.4 | 0.3 | |
| 2640 MASL | SpO2 < 88% | 7 days to 36 moths | 79 | 53 | 1.7 | 0.4 | |
| 1600 MASL | SpO2 < 86% | 3 months to 5 years | 90 | 16 | 1.1 | 0.6 | |
| Sea level | SpO2 < 90% | 2 months to 5 years | 93 | 12 | 1.1 | 0.6 | |
| Sea level | SpO2 < 90% | 2 to 36 months | 86 | 30 | 1.2 | 0.5 | |
| 239 MASL | SpO2 < 90% | < 5 years | 68 | 68 | 2.1 | 0.5 | |
| 1336 MASL | SpO2 < 90% | 2 months to 5 years | 93 | 22 | 1.2 | 0.3 | |
| MASL: metres above sea level LR: likelihood ratio | |||||||
| Outcome or subgroup title | No. of studies | No. of participants | Statistical method | Effect size |
| 1 Incidence of subsequent hypoxaemia Show forest plot | 1 | Risk Ratio (M‐H, Fixed, 95% CI) | Subtotals only | |
| 2 Duration of tachypnoea Show forest plot | 1 | 58 | Mean Difference (IV, Fixed, 95% CI) | 4.49 [‐16.30, 25.28] |
| 2.1 Normoxaemic children | 1 | 27 | Mean Difference (IV, Fixed, 95% CI) | 6.00 [‐18.02, 30.02] |
| 2.2 Hypoxaemic children | 1 | 31 | Mean Difference (IV, Fixed, 95% CI) | 0.0 [‐41.48, 41.48] |
| 3 Duration of chest indrawing Show forest plot | 1 | 58 | Mean Difference (IV, Fixed, 95% CI) | 6.64 [‐10.77, 24.06] |
| 3.1 Normoxaemic children | 1 | 27 | Mean Difference (IV, Fixed, 95% CI) | 6.0 [‐13.65, 25.65] |
| 3.2 Hypoxaemic children | 1 | 31 | Mean Difference (IV, Fixed, 95% CI) | 9.0 [‐28.58, 46.58] |
| Outcome or subgroup title | No. of studies | No. of participants | Statistical method | Effect size |
| 1 Treatment failure to achieve adequate oxygenation Show forest plot | 3 | Risk Ratio (M‐H, Fixed, 95% CI) | Subtotals only | |
| 1.1 Randomised clinical trials | 2 | 239 | Risk Ratio (M‐H, Fixed, 95% CI) | 0.93 [0.36, 2.38] |
| 1.2 Non‐randomised studies | 1 | 160 | Risk Ratio (M‐H, Fixed, 95% CI) | 1.0 [0.44, 2.27] |
| 2 Oxygen required in the first 24 hours (litres per minute (L/min)) Show forest plot | 3 | 338 | Std. Mean Difference (IV, Fixed, 95% CI) | 0.08 [‐0.14, 0.29] |
| 3 Nasal obstruction/severe mucus production Show forest plot | 3 | 338 | Risk Ratio (M‐H, Fixed, 95% CI) | 0.20 [0.09, 0.44] |
| 4 Nose ulceration or bleeding Show forest plot | 3 | 338 | Risk Ratio (M‐H, Fixed, 95% CI) | 0.43 [0.18, 1.02] |
| 5 Fighting/discomfort in the first 24 hours Show forest plot | 2 | 239 | Risk Ratio (M‐H, Fixed, 95% CI) | 0.77 [0.46, 1.28] |
| 6 Death during treatment Show forest plot | 3 | 338 | Risk Ratio (M‐H, Fixed, 95% CI) | 0.64 [0.35, 1.15] |