Primjena terapije kisikom za infekcije donjeg dišnog sustava u djece dobi od 3 mjeseca do 15 godina
Abstract
Background
Treatment for lower respiratory tract infections (LRTIs) includes administering complementary oxygen. The effectiveness of oxygen therapy and of different delivery methods remains uncertain.
Objectives
To determine the effectiveness and safety of oxygen therapy and oxygen delivery methods in the treatment of LRTIs and to define the indications for oxygen therapy in children with LRTIs.
Search methods
For this update, we searched CENTRAL, MEDLINE, EMBASE and LILACS from March 2008 to October 2014.
Selection criteria
Randomised controlled trials (RCTs) or non‐RCTs comparing oxygen versus no oxygen therapy or different methods of oxygen delivery in children with LRTI aged from three months to 15 years. To determine the indications for oxygen therapy, we included observational studies or diagnostic test accuracy studies.
Data collection and analysis
Three review authors independently scanned the search results to identify studies for inclusion. Two authors independently performed the methodological assessment and the third author resolved any disagreements. We calculated risk ratios (RRs) and their 95% confidence intervals (CIs) for dichotomous outcomes and adverse events (AEs). We performed fixed‐effect meta‐analyses for the estimation of pooled effects whenever there was no heterogeneity between included RCTs. We summarised the results reported in the included observational studies for the clinical indicators of hypoxaemia.
Main results
In this review update, we included four studies (479 participants) assessing the efficacy of non‐invasive delivery methods for the treatment of LRTI in children and 14 observational studies assessing the clinical sign indicators of hypoxaemia in children with LRTIs.
Three RCTs (399 participants) compared the effectiveness of nasal prongs or nasal cannula with nasopharyngeal catheter; one non‐RCT (80 participants) compared head box, face mask, nasopharyngeal catheter and nasal cannula. The nasopharyngeal catheter was the control group. Treatment failure was defined as number of children failing to achieve adequate arterial oxygen saturation. All included studies had a high risk of bias because of allocation methods and lack of blinded outcome assessment.
For nasal prongs versus nasopharyngeal catheter, the pooled effect estimate for RCTs showed a worrying trend towards no difference between the groups (two RCTs; 239 participants; RR 0.93, 95% CI 0.36 to 2.38). Similar results were shown in the one non‐RCT (RR 1.0, 95% CI 0.44 to 2.27). The overall quality of this evidence is very low. Nasal obstruction due to severe mucus production was different between treatment groups (three RCTs, 338 participants; RR 0.20, 95% CI 0.09 to 0.44; I2 statistic = 0%). The quality of this evidence is low.
The use of a face mask showed a statistically significant lower risk of failure to achieve arterial oxygen > 60 mmHg than the nasopharyngeal catheter (one non‐RCT; 80 participants; odds ratio (OR) 0.20, 95% CI 0.05 to 0.88).
The use of a head box showed a non‐statistically significant trend towards a reduced risk of treatment failure compared to the nasopharyngeal catheter (one non‐RCT; OR 0.40, 95% CI 0.13 to 1.12). The quality of this evidence is very low.
To determine the presence of hypoxaemia in children presenting with LRTI, we assessed the sensitivity and specificity of nine clinical signs reported by the included observational studies and used this information to calculate likelihood ratios. The results showed that there is no single clinical sign or symptom that accurately identifies hypoxaemia.
Authors' conclusions
It appears that oxygen therapy given early in the course of pneumonia via nasal prongs at a flow rate of 1 to 2 L/min does not prevent children with severe pneumonia from developing hypoxaemia. However, the applicability of this evidence is limited as it comes from a small pilot trial.
Nasal prongs and nasopharyngeal catheter are similar in effectiveness when used for children with LRTI. Nasal prongs are associated with fewer nasal obstruction problems. The use of a face mask and head box has been poorly studied and it is not superior to a nasopharyngeal catheter in terms of effectiveness or safety in children with LRTI.
Studies assessing the effectiveness of oxygen therapy and oxygen delivery methods in children with different baseline risks are needed.
There is no single clinical sign or symptom that accurately identifies hypoxaemia in children with LRTI. The summary of results presented here can help clinicians to identify children with more severe conditions.
This review is limited by the small number of trials assessing oxygen therapy and oxygen delivery methods as part of LRTI treatment. There is insufficient evidence to determine which non‐invasive delivery methods should be used in children with LRTI and low levels of oxygen in their blood.
PICO
Laički sažetak
Terapija kisikom u liječenju infekcija dišnog sustava u djece
Istraživačko pitanje
U ovom Cochrane sustavnom pregledu ispitani su dokazi o korisnom učinku terapije kisikom kao dodatka liječenju akutnih upala donjeg dišnog sustava (eng. LRTI) u djece. Kako se kisik može primjenjivati raznim metodama, istražili smo najčešće metode primjene kisika u djece. Kao dodatno pitanje, provjerili smo dokaze koji se tiču znakova i simptoma koji bi mogli ukazati na potrebu takve terapije u djece koja se javljaju s naglim (akutnim) LRTI.
Dosadašnje spoznaje
Akutni LRTI je najčešći uzrok bolničkog liječenja od svih infekcija dišnog sustava te jedan od glavnih uzroka pobola i smrtnosti djece mlađe od 5 godina u zemljama niskog standarda. Terapija kisikom se koristi kod teških slučajeva LRTI‐a, ali valjalo bi odrediti je li takva terapija korisna za sprječavanje razvoja težih oblika početne bolesti. Kisik se može primijeniti raznim neinvazivnim metodama (nosna kanila, kateter koji se uvodi u nos ‐ nazofaringealni kateter, maska te kaciga) te je cilj bio saznati koliko su učinkovite te metode.
Značajke istraživanja
Za odgovor na glavno istraživačko pitanje analizirali smo kliničke pokuse koji su ispitivali korist kisika nasuprot nekorištenja kisika te studije koje su uspoređivale različite sustave davanja kisika u djece od 1. do 5. godine s akutnim LRTI. Pronašli smo jednu pilot studiju (58 djece) koja je procjenjivala terapiju kisikom u djece s upalom pluća te 4 studije (479 sudionika) koje su procjenjivale korisnost različitih neinvazivnih sustava za dovod kisika.
Za odgovor na ostala istraživačka pitanja, uključili smo 14 opservacijskih istraživanja koja su služila za određivanje kliničkih indikatora manjka kisika (hipoksemije) u djece s akutnim LRTI.
Rezultati
Terapija kisikom u ranim fazama upale pluća, putem nosnih kanila, brzinom protoka 1 do 2 L/min nije dovela do smanjena broja hipoksemija kod djece s teškom upalom pluća. No,primjenjivost ovog dokaza je ograničeno jer podatci dolaze iz male pilot studije. Kliničari koji liječe dijete trebaju procijeniti na individualnoj bazi hoće li kisik biti koristan kao dodatak liječenju.
Nosne kanile i nazofaringealni kateteri su bili slične djelotvornosti kad su primjenjivani u djece s akutnim LRTI. Nosne kanile su povezane s manjim brojem začepljenja nosa. Korištenje maske ili kacige je slabo istraženo te se čini kako nije djelotvornije ili sigurnije od nazofaringealnih katetera kod djece s akutnim LRTI.
Nema jednog znaka ili simptoma koji točno prepoznaje hipoksemiju u djece s akutnim LRTI. No, sažetak rezultata koji je ovdje predstavljen može pomoći kliničaru prepoznati djecu s težim oblikom bolesti.
Potrebna su dodatna istraživanja koja procjenjuju djelotvornost terapije kisikom u djece s različitim početnim rizicima, kao i studije koje istražuju najdjelotvorniju i najsigurniju metodu primjene kisika.
Ovaj sustavni pregled uključuje istraživanja objavljena do listopada 2014.
Authors' conclusions
Summary of findings
| Nasal prongs versus nasopharyngeal catheter for lower respiratory tract infections | ||||||
| Patient or population: children with acute lower respiratory tract infections | ||||||
| Outcomes | Illustrative comparative risks* (95% CI) | Relative effect | No. of participants | Quality of the evidence | Comments | |
| Assumed risk | Corresponding risk | |||||
| Nasopharyngeal catheter | Nasal prongs | |||||
| Treatment failure | Study population | RR 0.97 | 399 | ⊕⊝⊝⊝ | ||
| 91 per 1000 | 89 per 1000 | |||||
| Moderate | ||||||
| 107 per 1000 | 104 per 1000 | |||||
| Oxygen required in the first 24 hours | The mean oxygen required in the first 24 hours in the intervention groups was | 338 | ⊕⊕⊝⊝ | SMD 0.08 (‐0.14 to 0.29) | ||
| Nasal obstruction/severe mucus production | Study population | RR 0.2 | 338 | ⊕⊕⊝⊝ | ||
| 199 per 1000 | 40 per 1000 | |||||
| Moderate | ||||||
| 213 per 1000 | 43 per 1000 | |||||
| Nose ulceration or bleeding | Study population | RR 0.43 | 338 | ⊕⊕⊝⊝ | ||
| 96 per 1000 | 41 per 1000 | |||||
| Moderate | ||||||
| 61 per 1000 | 26 per 1000 | |||||
| Fighting/discomfort in the first 24 hours | Study population | RR 0.77 | 239 | ⊕⊕⊝⊝ | ||
| 205 per 1000 | 158 per 1000 | |||||
| Moderate | ||||||
| 210 per 1000 | 162 per 1000 | |||||
| Death during treatment | Study population | RR 0.64 | 338 | ⊕⊕⊝⊝ | ||
| 145 per 1000 | 93 per 1000 | |||||
| Moderate | ||||||
| 122 per 1000 | 78 per 1000 | |||||
| *The basis for the assumed risk (e.g. the median control group risk across studies) is provided in footnotes. The corresponding risk (and its 95% confidence interval) is based on the assumed risk in the comparison group and the relative effect of the intervention (and its 95% CI). | ||||||
| GRADE Working Group grades of evidence | ||||||
| 1One trial used quasi‐randomised methods for assignment of interventions. Evaluation of the main outcome was not blinded in all studies. | ||||||
| Face mask compared to nasopharyngeal catheter for severe acute LRTIs in children | ||||||
| Patient or population: children with severe acute LRTIs | ||||||
| Outcomes | Illustrative comparative risks* (95% CI) | Relative effect | No. of participants | Quality of the evidence | Comments | |
| Assumed risk | Corresponding risk | |||||
| Nasopharyngeal catheter | Face mask | |||||
| Treatment failure | Moderate | OR 0.20 | 80 | ⊕⊕⊝⊝ | ||
| 107 per 1000 | 23 per 1000 | |||||
| *The basis for the assumed risk (e.g. the median control group risk across studies) is provided in footnotes. The corresponding risk (and its 95% confidence interval) is based on the assumed risk in the comparison group and the relative effect of the intervention (and its 95% CI). | ||||||
| GRADE Working Group grades of evidence | ||||||
| 1Non‐randomised. Used sequential assignment methods. | ||||||
| Head box compared to nasopharyngeal catheter for severe acute LRTIs in children | ||||||
| Patient or population: children with severe acute LRTIs | ||||||
| Outcomes | Illustrative comparative risks* (95% CI) | Relative effect | No. of participants | Quality of the evidence | Comments | |
| Assumed risk | Corresponding risk | |||||
| Nasopharyngeal catheter | Head box | |||||
| Treatment failure | Moderate | OR 0.40 | 80 | ⊕⊝⊝⊝ | ||
| 107 per 1000 | 46 per 1000 | |||||
| *The basis for the assumed risk (e.g. the median control group risk across studies) is provided in footnotes. The corresponding risk (and its 95% confidence interval) is based on the assumed risk in the comparison group and the relative effect of the intervention (and its 95% CI). | ||||||
| GRADE Working Group grades of evidence | ||||||
| 1Non‐randomised. Used sequential assignment methods. | ||||||
Background
Description of the condition
Acute lower respiratory tract infection (LRTI) is one of the leading causes of morbidity and mortality in children under five years of age in low‐income countries (Benguigui 1999; Rudan 2004).
It is estimated that 4.3 million children under the age of five die each year from acute LRTIs. Pneumonia in particular has been named by the Word Heath Organization (WHO) as "the world's biggest killer of children" (UNICEF/PAHO 2006), and accounts for nearly one‐fifth of childhood deaths worldwide, with approximately two million children under the age of five dying each year. The majority of deaths occur in Africa and South‐East Asia (Bryce 2005). In Latin America the mortality rate varies widely in children under five years of age: from 5 per 1000 live births in Cuba to 49 per 1000 in Haiti (CEPAL/UNICEF 2011), and acute LRTI accounts for 20% to 25% of the total deaths in countries with higher mortality rates in this age group. Longitudinal studies conducted by the Institute of Nutrition of Central America and Panama (INCAP) have shown that in Central American countries, preschool children suffer about seven episodes of respiratory tract infection (RTI) per year with a median duration of 11 days and 5% of these are serious LRTI. Acute LRTIs, particularly pneumonia and bronchiolitis, are the most frequent cause for hospitalisation in children less than five years of age.
In low‐income countries supplementary oxygen is limited, as well as in rural areas of middle‐income countries, where few healthcare centres are able to provide it. Children presenting with LRTI are frequently referred to a hospital, far away from their home, in order to have access to this resource. These situations are often difficult for families for several reasons: lack of economic resources, armed conflict or forced displacement, among others, which mean parents are unable to accept referrals, leaving children without complete treatment and therefore increasing their risk of complications and death as result of the delay in receiving adequate attention.
Since 1993, multiple clinical practice guidelines and protocols have recommended oxygen therapy as an important treatment component for severe acute LRTI (Arango 1999; Bradley 2011; Harris 2011; UNICEF/PAHO 2004; WHO 1993). Since 2000, the WHO has made recommendations regarding acute LRTIs in children under five years of age, which have been included in the WHO/UNICEF Integrated Management of Childhood Illness (IMCI) programme (WHO 2000). In this simple strategy, healthcare providers are advised to treat children with a cough and normal respiratory rate (cough or cold) without antibiotics and without hospitalisation. They recommend that children who have fast breathing and no chest indrawing should be classified as having pneumonia and should receive antibiotics as outpatients. The WHO classifies children with pneumonia and chest indrawing as having severe pneumonia and this requires hospitalisation and treatment with appropriate antibiotics.
Description of the intervention
Oxygen supplementation is most important in the presence of hypoxaemia and its value changes depending on the altitude (Lozano 2001; Reuland 1991). There are no specific guidelines on the method of oxygen delivery for acute LRTIs. A number of studies and guidelines have described different flow rates according to the age and weight of patients and the concentrations depend on the methods used (Kumar 1997; Muhe 2001; Myers 2002; WHO 1993). There are several non‐invasive methods for uncomplicated LRTIs, including the following.
-
Face mask: a plastic mask connected to an oxygen source, fitted over the patient's nose and mouth with side‐to‐side perforations that allow room air entrance when placed over the infant's face. Usually high flow rates are needed to avoid the risk of carbon dioxide accumulation. With this method oxygen concentration delivery varies depending on the infant's respiratory flow rate and the oxygen flow into the system (Frey 2003). It interferes with feeding because it must be removed. Many infants refuse to keep the mask on.
-
Head box or hood: a plastic box or tent placed surrounding the infant's head (Myers 2002). It needs high flow rates (more than 5 L/min) to avoid re‐breathing carbon dioxide (Frey 2003). It is the only method that allows fraction of inspired oxygen (FiO2) to be measured precisely. The infant's mobility and feeding are limited. There is no increased risk of gastric distension or airway obstruction.
-
Nasopharyngeal catheter: soft tubes with several distal holes inserted into the nose to a depth equal to the distance from the side of the nostril to the front of the ear (Frey 2003; Myers 2002). It is used at low flow rates. Humidifiers are needed to avoid pharyngeal secretions drying. It can be blocked with mucus that can cause airway obstruction. There is risk of gastric distension if the catheter is displaced. According to the WHO an 8F nasopharyngeal catheter is recommended.
-
Nasal catheter: a thin, flexible tube passed through the nose and ending with its tip in the nasal cavity (Frey 2003), to a depth equal to the distance from the side of the nostril to the inner margin of the eyebrow. It has the same disadvantages as the nasopharyngeal catheter.
-
Nasal prongs or nasal cannula: consists of two soft prongs that are designed to lie just within the nostrils which arise from oxygen supply tubing. The FiO2 varies with the patient's inspiratory flow, the cannula gas flow, the relationship between the prong and nasal diameter and the patient's body weight. This means that it is not easy to determine the FiO2 reaching the patient's airway. It can be blocked with secretions, but there is no risk of gastric distension (Frey 2003; Myers 2002).
How the intervention might work
One of the must important signs associated with severe LRTI is hypoxaemia. Hypoxaemia is defined as a decrease in the partial pressure of oxygen in the blood (Theodore 2013). Hypoxaemia does not necessarily indicate tissue hypoxia. It can be caused by hypoventilation, ventilation‐perfusion mismatch, right‐to‐left shunt, diffusion impairment, or reduced inspired oxygen tension (Rodriguez 2005). In LRTI, inflammation causing alveolar congestion, respiratory tract secretions, fatigue of respiratory muscles and reduced central system response to hypoxia, act synergically contributing to hypoventilation, ventilation‐perfusion mismatch and reduced inspired oxygen tension; all of which contribute to hypoxaemia.
Hypoxaemia in children with LRTI has been associated with increased risk of mortality and long‐term morbility (West 1999). Therefore, supplemental oxygen therapy may improve outcomes of hypoxaemic children presenting with LRTI.
Why it is important to do this review
Children under five years of age may also be affected by bronchiolitis or viral pneumonia (with no active bacterial infection). In certain clinical contexts, clinicians may be able to establish these diagnoses and withholding antibiotic therapy may be appropriate (Lozano 1994). In the case of bronchiolitis, the only universally accepted treatment is oxygen therapy when needed. In some places oxygen administration in children with respiratory infections is a routine procedure and we propose to find out its efficacy, risk and impact.
In addition, little is known from experimental data about the effects of supplemental oxygen and the impact of the different non‐invasive methods of oxygen administration in children with acute LRTIs. Oxygen is recommended for children with severe pneumonia plus cyanosis or an inability to feed ('very severe disease' or 'very severe pneumonia'). In the latest WHO publication Recommendations of management common childhood conditions (WHO 2010), oxygen therapy continues to be recommended for LRTI, based mainly on the evidence presented in the previous version of this review (Rojas‐Reyes 2009), without any further evidence of its effectiveness. The WHO generally recommends the use of nasopharyngeal catheters and nasal cannula (nasal prongs) as safe and efficient methods of oxygen delivery (WHO 1993). Whether or not this is a more effective way of preventing children from developing a more severe condition or subsequent hypoxaemia remains unknown. It is possible that more severely ill patients will benefit from other more invasive oxygen delivery methods such as continuous positive air pressure (CPAP).
This review assesses the effect of oxygen therapy as well as the effectiveness of non‐invasive oxygen delivery systems on children's recovery in terms of oxygen saturation, improvement in signs of respiratory distress, length of hospital stay, mortality rates and ventilation requirements.
Objectives
To determine the effectiveness and safety of oxygen therapy and oxygen delivery methods in the treatment of LRTIs and to define the indications for oxygen therapy in children with LRTIs.
Primary objectives
-
To determine the effectiveness of oxygen therapy in the treatment of severe LRTIs in children.
-
To determine the effectiveness and safety of the different oxygen delivery methods in the treatment of severe acute LRTIs in children given measured by:
-
the frequency of treatment failure or clinical deterioration presented with each method;
-
the type and frequency of side effects reported with each method;
-
the type and frequency of severe adverse events reported with each method;
-
the flow rates required to achieve adequate oxygen saturation.
-
Secondary objectives
-
To determine the indications for oxygen therapy in children with LRTIs (i.e. describe the oxygen saturation values or clinical signs that would indicate the use of oxygen therapy).
-
To describe the factors (type of underlying disease, severity of hypoxaemia at presentation etc.) influencing the length of oxygen therapy with each oxygen delivery method.
-
To describe the clinical criteria for ending oxygen therapy.
-
To determine the indications for continuing oxygen therapy after discharge.
-
To estimate the costs associated with each method of oxygen delivery.
Methods
Criteria for considering studies for this review
Types of studies
For our primary objectives we included randomised controlled trials (RCTs) or non‐RCTs comparing either:
-
oxygen therapy versus no oxygen therapy; or
-
different methods of oxygen delivery for the treatment of severe or hypoxaemic acute LRTIs in children (between three months and 15 years of age).
We decided to include non‐RCTs assessing the effectiveness of the interventions because this is unlikely to be studied in RCTs as the usual practice is to treat these patients with supplemental oxygen. Also, we identified only a small number of RCTs assessing oxygen delivery methods. However, we did not combine the evidence from RCTs with non‐RCTs because we considered it inappropriate.
For our secondary objective we included observational studies assessing:
-
clinical signs and symptoms associated with hypoxaemia in children with acute LRTI.
Types of participants
Children aged between three months and 15 years diagnosed with severe LRTI such as pneumonia or bronchiolitis. We included children up to 15 years of age because older children also present with LRTI and the results of this review will apply to them.
LRTI is defined as the presence of cough with or without fever, signs of respiratory distress (subcostal indrawing, fast breathing, use of accessory respiratory muscles, cyanosis, nasal flaring), or bronchiolitis defined as first wheezing episode in children younger than three years of age, with or without radiological diagnosis of pneumonia/bronchiolitis, with or without low blood oxygen saturation.
We excluded studies conducted in specific populations with other respiratory problems (such as chronic pulmonary diseases, asthma, bronchopulmonary dysplasia, pulmonary hypertension, complicated pneumonia) and studies conducted in specific populations of patients with other underlying diseases (such as immunodeficiencies, malnourishment, metabolic disorders, neurological pathologies affecting pulmonary function or cardiac problems).
Types of interventions
-
Oxygen therapy versus no oxygen therapy.
-
Oxygen administration through any of the following non‐invasive delivery methods:
-
face mask: a plastic mask fitting over the patient's nose and mouth with side perforations that allow for room air, connected to an oxygen source;
-
head box or hood: plastic box or tent placed around the infant's head;
-
nasopharyngeal catheter: soft tubes with several distal holes inserted into the nose to a depth equal to the distance from the side of the nostril to the front of the ear;
-
nasal catheter: a thin, flexible tube passed through the nose and ending with its tip in the nasal cavity to a depth equal to the distance from the side of the nostril to the inner margin of the eyebrow;
-
nasal prongs or nasal cannula: two soft prongs that are designed to lie just within the nostrils, connected to an oxygen source.
-
For this 2014 review update we did not include studies assessing nasal continuous positive airway pressure (CPAP) in the treatment of LRTI since it is not only an oxygen delivery method but also a system using pressure to support pulmonary ventilation in respiratory distress. We consider that its effectiveness in LRTIs such as bronchiolitis must be evaluated in a separate review.
Types of outcome measures
Primary outcomes
The effectiveness of oxygen therapy in the treatment of severe LRTIs in children, based on the following.
-
Clinical failure (defined as the need for any additional intervention or change in treatment, no improvement in signs or arterial blood gases (SaO2) values or progression of other clinical signs associated with more severe hypoxaemia in children with acute LRTIs: cyanosis, neurological impairment, inability to drink or death) by a maximum of two hours after the intervention.
-
Improvement in respiratory signs during the first 24 hours after oxygen therapy was initiated (subcostal indrawing and fast breathing) and/or improvement of oxygen saturation measured either by SaO2 or by oximeter (SpO2).
The effectiveness and safety of non‐invasive oxygen delivery methods, based on the following.
-
Treatment failure (considered when the oxygen saturation, measured by SpO2 or SaO2, remains below the cut‐off point established in advanced by the trial authors (i.e. clearly defined SaO2 that indicates hypoxaemia according to the altitude and using a reliable definition)).
-
Presence of clinical deterioration or signs of a more severe illness, such as laryngeal stridor, somnolence, lethargy, inability to feed and drink and/or convulsions, or needing invasive respiratory support.
-
Mean flow rates required with each method to achieve adequate SaO2.
-
Type and frequency of side effects.
-
Type and frequency of severe adverse events (defined as the frequency of complications in children using each method; complications include the accumulation of mucus, nasal ulceration, nasal bleeding, nasal blockage due to drying of secretions or upper airway obstruction, abdominal distension or aspiration of gastric contents).
-
Need for mechanical ventilation.
Secondary outcomes
-
Clinical criteria that would indicate the need for oxygen therapy or hypoxaemia in children.
-
Sensitivity and specificity of signs and symptoms detecting hypoxaemia.
-
Factors influencing the duration of oxygen therapy with each delivery method.
-
Clinical criteria for ending oxygen therapy.
-
Clinical criteria for continuing oxygen therapy after discharge.
-
Costs associated with oxygen therapy or with each method.
Search methods for identification of studies
Electronic searches
For this 2014 update, we updated searches from March 2008 to October 2014. We searched CENTRAL (2014, Issue 1); MEDLINE (1 March 2014 to February week 3, 2014 to 1 February to October week 1, 2014); EMBASE (1 March 2008 to February 2014; 1 February to October week 1, 2014) and LILACS (1 March 2008 to May 2014; 1 May to October 2014). See Appendix 1 for details of the previous searches.
We used the following search strategy to search MEDLINE and CENTRAL. We combined the search terms with a filter for identifying child studies (Boluyt 2008). We combined the MEDLINE search with the Cochrane Highly Sensitive Search Strategy for identifying randomised trials in MEDLINE; sensitivity and precision‐maximising version 2008 revision; Ovid format (Lefebvre 2011).
We adapted the search strategy to search EMBASE (Appendix 2) and LILACS (Appendix 3).
MEDLINE (OVID)
1 exp Respiratory Tract Infections/
2 lower respiratory tract infection*.tw.
3 lower respiratory infection*.tw.
4 lrti.tw.
5 (infection* adj3 lower respiratory).tw
6 Respiratory Syncytial Virus Infections/
7 respiratory syncytial viruses/ or respiratory syncytial virus, human/
8 (respiratory syncytial virus* or rsv).tw.
9 parainfluenza virus 1, human/ or parainfluenza virus 3, human/
10 Parainfluenza virus 2, human/
11 parainfluenza virus*.tw.
12 exp Pneumonia/
13 pneumon*.tw.
14 bronchopneumon*.tw.
15 exp Bronchitis/
16 bronchit*.tw.
17 bronchiolit*.tw.
18 Croup/
19 croup.tw.
20 laryngotracheobronchit*.tw.
21 or/1‐20
22 exp Oxygen Inhalation Therapy/
23 oxygen or O2
24 22 or 23
25 21 and 24
Limited to: Child: birth‐18 years
We added the following term to the original strategy to search for observational studies reporting clinical signs that would indicate the use of oxygen therapy:
1 exp anoxia/
2 OR/1‐25
Limited to: Child: birth‐18 years
Searching other resources
There were no language or publication restrictions. We also checked clinical practice guidelines and the reference lists of selected articles to identify further trials. To avoid publication bias we conducted a search to identify unpublished studies using the British Library website (www.bl.uk) and scientific societies' websites.
Data collection and analysis
Selection of studies
The three review authors (MXR, CG, LCH) independently scanned all titles identified by the electronic searches. After reviewing the abstracts, we retrieved the full text of potentially relevant studies for inclusion. Two review authors reviewed each article (MXR/LCH or CG/MXR). When disagreements arose, the third review author who was not included in the first evaluation (CG or LCH) reviewed the article without knowing the previous evaluation.
To achieve the primary objective of comparing the effectiveness of oxygen therapy in children with LRTI, we selected published or unpublished RCTs or non‐RCTs that compared any of those therapies.
To achieve the objective of evaluating the effectiveness of oxygen delivery methods used in children with LRTI, we selected published or unpublished RCTs or non‐RCTs that compared any of those therapies. In addition to the included RCTs, to assess potential unexpected or rare harms of interventions case reports, we included case series or case‐control studies describing any side effects related to each method.
To achieve the secondary objectives related to the indications for oxygen therapy in children with LRTI, we selected observational studies that independently compared the signs or symptoms with a measurement of oxygen saturation with a gold standard technique (i.e. oximeter or by arterial blood gases).
To achieve the other secondary objectives, such as factors influencing the duration of oxygen therapy, the clinical criteria for ending oxygen therapy and the indications for continuing oxygen therapy after discharge, we included high‐quality cohort studies.
Data extraction and management
The three review authors independently extracted and recorded the data when available in the study report, or from direct contact with the trial authors. We collected the following data from intervention studies.
-
Type of design
-
Objective or clinical research question answered
-
Demographic characteristics from the population studied (sex, age, altitude)
-
Outcome measures
-
Underlying condition and relevant baseline characteristics (signs of respiratory distress, fever and other important physical and laboratory characteristics)
-
Severity of the underlying disease
-
Criteria for oxygen initiation (diagnosis criteria)
-
Concomitant treatment (antibiotics yes/no)
-
Oxygen saturation at the time of admission
-
Monitoring measures of oxygen saturation after oxygen was started
-
Type of oxygen delivery system used
-
Doses of oxygen (number of litres per minute administered)
-
Time from admission to recovery from respiratory distress symptoms
-
Time from oxygen initiation to recovery from respiratory distress symptoms
-
Time to recover normoxaemia
-
Duration of oxygen therapy
-
Length of hospital stay
-
Progression to a more severe disease (sign of progression of illness: cyanosis, neurological impairment and inability to drink, pneumothorax, mechanical ventilation requirement or pulmonary hypertension) or death
-
Side effects or complications reported
-
Outcome assessment
-
Follow‐up (time of follow‐up, drop‐outs)
Data collected from observational studies assessing signs that are predictors of hypoxaemia included the following.
-
Type of design
-
Objective or clinical research question answered
-
Demographic characteristics from the population studied (sex, age, altitude)
-
Underlying condition and relevant baseline characteristics (signs of respiratory distress, fever and other important physical and laboratory characteristics)
-
Severity of the underlying disease (subgroups)
-
Clinical signs assessed
-
Method used for measuring the oxygen saturation
-
Blindness (from saturation) at the time of assessment of the clinical sings
-
Sensitivity‐specificity
Assessment of risk of bias in included studies
The three review authors independently performed a methodological assessment of the studies that met the eligibility criteria using the Users' Guides to the Medical Literature (Guyatt 2002). For this 2014 review update we reassessed the following methodological aspects of the included RCTs using the 'Risk of bias' tool in RevMan 5.3 (RevMan 2014). We evaluated the risk of bias in non‐randomised studies assessing interventions in a similar way to randomised trials, but we paid more attention to the possibility of selection and classification bias. The aspects were as follows.
which describes each of these domains as reported in the trial and then assigning a judgement about the adequacy of each entry: low, high risk of bias or unclear (or unknown) risk of bias.
-
Sequence generation (checking for possible selection bias). Was the allocation sequence adequately generated? For each included study, we categorised the method used to generate the allocation sequence as: low risk (any truly random process, e.g. random number table; computer random number generator); high risk (any non‐random process, e.g. odd or even date of birth; hospital or clinic record number) or unclear risk.
-
Allocation concealment (checking for possible selection bias). Was allocation adequately concealed? For each included study, we categorised the method used to conceal the allocation sequence as: low risk (e.g. telephone or central randomisation; consecutively numbered, sealed, opaque envelopes); high risk (open random allocation; unsealed or non‐opaque envelopes, alternation; date of birth); or unclear risk.
-
Blinding (checking for possible performance bias). Was knowledge of the allocated intervention adequately prevented during the study? At study entry? At the time of outcome assessment? For each included study, we categorised the methods used to blind study participants and personnel from knowledge of which intervention a participant received. We assessed blinding separately for different outcomes or classes of outcomes. We categorised the methods as: low risk, high risk or unclear risk for participants; adequate, inadequate or unclear for personnel; adequate, inadequate or unclear risk for outcome assessors.
-
Incomplete outcome data (checking for possible attrition bias through withdrawals, drop‐outs, protocol deviations). Were incomplete outcome data adequately addressed? For each included study and for each outcome, we described the completeness of data including attrition and exclusions from the analysis. We noted whether attrition and exclusions were reported, the numbers included in the analysis at each stage (compared with the total randomised participants), reasons for attrition or exclusion where reported, and whether missing data were balanced across groups or were related to outcomes. Where sufficient information was reported or supplied by the trial authors, we re‐included missing data in the analyses. We categorised the methods as: low risk (< 20% missing data); high risk (≥ 20% missing data) or unclear risk.
-
Selective reporting bias. Are reports of the study free of suggestion of selective outcome reporting? For each included study, we described how we investigated the possibility of selective outcome reporting bias and what we found. We assessed the methods as: low risk (where it is clear that all of the study's pre‐specified outcomes and all expected outcomes of interest to the review have been reported); high risk (where not all the study's prespecified outcomes have been reported; one or more reported primary outcomes were not pre‐specified; outcomes of interest are reported incompletely and so cannot be used; study fails to include results of a key outcome that would have been expected to have been reported); or unclear risk.
-
Other sources of bias. Was the study apparently free of other problems that could put it at a high risk of bias? For each included study, we described any important concerns we had about other possible sources of bias (for example, whether there was a potential source of bias related to the specific study design or whether the trial was stopped early due to some data‐dependent process). We assessed whether each study was free of other problems that could put it at risk of bias as: low risk; high risk or unclear risk.
-
The quality assessment of diagnostic studies evaluating the clinical signs associated with hypoxaemia considered the independency and blinding of the evaluation of diagnostic tests and their results (Guyatt 2002). Results of this assessment are summarised in the Risk of bias in included studies section.
-
-
Finally, we assessed the overall quality and certainty of the evidence resulting from the comparison of oxygen delivery methods for each main outcome, following the GRADE framework (Atkins 2004). We used the non‐randomised study as a complement to RCTs for the outcome 'treatment failure'. To do this we focused on judgements in the context of the domains that influence the overall quality of the body of evidence, such as limitations in the detailed study design and execution, inconsistency, imprecision and factors that may decrease our confidence in effects (Schünemann 2013).
Measures of treatment effect
We analysed each study individually to determine the risk ratio/odds ratio (RR/OR) for the pre‐determined outcomes such as failure to achieve adequate oxygenation (treatment failure), nose ulceration or bleeding, nasal obstruction, discomfort in the first 24 hours and death during treatment.
We used standardised mean difference (SMD) for continuous outcomes such as litres per minute (L/min) of oxygen required in the first 24 hours to achieve adequate oxygen saturation measured by oximeter (SpO2).
We obtained an overall effect for the main outcomes reported by RCTs using the fixed‐effect model. Quantitative analysis of outcomes (RCTs) was based on the intention‐to‐treat (ITT) principle. As both RCTs and non‐RCTs were included to assess the effects of interventions, we presented results separately by study design.
For the secondary outcome 'Clinical criteria that would indicate the need for oxygen therapy or hypoxaemia in children' the treatment effect measure was the sensitivity and specificity of each sign or symptom in predicting hypoxaemia. In the Characteristics of included studies table we present a description of the included studies that answer our secondary objectives, where RCTs were not available.
Unit of analysis issues
To obtain an overall effect for the main outcomes (treatment failure, nose ulceration or bleeding, nasal obstruction, discomfort in the first 24 hours and death during treatment) we did not combine evidence from RCTs and non‐RCTs.
Due to the clinical heterogeneity of data from observational studies assessing clinical signs and symptoms associated with hypoxaemia (differences in baseline population characteristics, different altitudes where study population was living, no disaggregated data for age and severity of LRTI, etc.), we did not perform a statistical analysis of these data. In order to obtain valid estimates, we considered that the complicated subgroup analysis processes required to deal with the sources of heterogeneity exceeded the purposes of this review. We calculated sensitivity, specificity and likelihood ratios for each sign or symptom evaluated in the included studies and presented them in a summary table.
Dealing with missing data
None of the included studies had missing data for the outcomes assessed, therefore we did not need to deal with this issue.
Assessment of heterogeneity
We estimated the treatment effects of individual trials and examined heterogeneity between trials by inspecting the forest plots and quantifying the impact of heterogeneity using the I2 statistic. If we detected moderate, substantial or considerable statistical heterogeneity, we explored the possible causes (for example, differences in study quality, participants, interventions or outcomes assessments). We considered an I2 value of 0% to 40% not to represent important heterogeneity; 30% to 60% to represent moderate heterogeneity; 60% to 90% to represent substantial heterogeneity and an I2 value greater than 90% to represent considerable heterogeneity (Higgins 2003).
Assessment of reporting biases
We assessed within‐study selective outcome reporting as a part of the overall 'Risk of bias' assessment by comparing the outcomes listed in the methods section of each article with the reported results. We identified only four RCTs, therefore we did not create a funnel plot of effect estimates against their standard errors to assess possible between‐study reporting bias.
Data synthesis
We performed fixed‐effect meta‐analyses of RCTs for the estimation of pooled effects according to the statistical guidelines of the Cochrane Handbook for Systematic Reviews of Interventions (Higgins 2011). Results from the non‐RCTs are presented independently and we did not include them in the overall effect estimations.
Subgroup analysis and investigation of heterogeneity
We had planned to conduct a subgroup analysis by age (three months to one year; one to five years; more than five years). However, it was not possible because of the lack of disaggregated information. We identified three trials comparing the same interventions (nasal canula versus nasal prongs) in similar populations. The fixed‐effect meta‐analysis did not show heterogeneity (I2 statistic = 0%). For the other comparisons (face mask and head box versus nasopharyngeal catheter) only one non‐RCT was identified.
Sensitivity analysis
We had planned to explore the impact of the level of bias by undertaking sensitivity analyses. However, this was not necessary since all the included studies were of similar quality and showed a similar direction of results.
Results
Description of studies
Results of the search
The initial search conducted in March 2008 retrieved a total of 559 references. For this 2014 update of the review, we ran searches from 1 March 2008 to 8 October 2014. These new searches yielded 831 references in MEDLINE; 117 in EMBASE; 28 in CENTRAL and 34 in LILACS, after de‐duplication. Adding the 'anoxia' term yielded 18 additional references in MEDLINE and in EMBASE.
In total (from old and new searches), we identified 77 studies as potentially eligible. References from the studies yielded an additional 35 potentially eligible studies and we identified four studies from manual searching. From these, we initially selected 30 studies: eight studies compared oxygen therapy or oxygen delivery methods and 24 observational studies addressed different questions related to our secondary objectives. One study assessed the presence of clinical deterioration or signs of a more severe illness or needing invasive respiratory support; 20 studies assessed clinical signs predictors of hypoxaemia, two studies reported side effects and one study evaluated the costs of oxygen therapies. We rejected the remaining 45 studies for the following reasons: narrative reviews, non‐randomised studies, included neonates or preterms, included patients with other pathologies, compared treatment strategies other than oxygen therapy or oxygen delivery methods, compared CPAP with high flow nasal prongs, were editorials or letters, practice guidelines or had adult populations. We did not find any studies including children older than five years of age.
We later excluded 12 studies after reading the full text (see Excluded studies). This left us with five studies that met all the criteria for eligibility to answer the primary objectives: one pilot RCT that compared supplemental oxygen (nasal prongs, one to two L/min flow) versus no oxygen therapy (room air) (Singhi 2012); three RCTs (Muhe 1997; Muhe 1998; Weber 1995) and one non‐RCT (Kumar 1997) that compared non‐invasive oxygen delivery methods.
To answer the secondary objectives a total of 16 observational studies met all the selection criteria and we included them: 14 studies were conducted with the aim of identifying clinical predictors of hypoxaemia (Basnet 2006; Duke 2002; Dyke 1995; Gutierrez 2001; Kuti 2013; Laman 2005; Lodha 2004; Lozano 1994; Onyango 1993; Orimadegun 2013; Reuland 1991; Smyth 1998; Usen 1999; Weber 1997), and two studies reported the side effects of non‐invasive methods (Campos 1994; Frenckner 1990).
Included studies
RCTs assessing the effectiveness of oxygen supplementation
Singhi 2012 is a report of a pilot RCT conducted in Chandigarh, India with the aim of studying the incidence of subsequent hypoxaemia in initially normoxaemic children with pneumonia and lower chest indrawing. They included patients aged two to 59 months with severe pneumonia and without hypoxaemia (SpO2 > 90%). Patients with a known chronic systemic illness, major malformations, congenital heart disease, pneumonia secondary to aspiration/chemicals or suspected tuberculosis were excluded. Children (n = 58, three to 59 months) with pneumonia, lower chest indrawing and normoxaemia were randomly assigned to receive supplemental oxygen (nasal prongs, 1 to 2 L/min flow) (n = 29) or room air (n = 29). Vital signs and SpO2 were monitored continuously and recorded every six hours. All patients were treated with intravenous ampicillin and gentamicin followed by oral antimicrobial therapy once they were clinically stable. Outcome variables were incidence of hypoxaemia, length of tachypnoea and lower chest indrawing. Patients who developed hypoxaemia later were similar to those who did not, except for a lower SpO2 at enrolment
RCTs assessing the effectiveness of delivery methods
The Muhe 1997 RCT was conducted in Addis Ababa (2800 metres above sea level (MASL)), with the aim of comparing the frequency and nature of complications when nasopharyngeal catheters or nasal prongs were used to deliver oxygen. A total of 121 children between two weeks and five years of age with hypoxaemia (SpO2 < 90%) due to acute LRTI were randomised to receive oxygen by nasopharyngeal catheters (n = 61) or nasal prongs (n = 60). Randomisation was grouped by age into three groups: two to seven weeks, eight weeks to 11 months, and 12 months to five years. Authors measured daily SaO2 and complications (catheter blockage, nasal ulceration, nasal blockage due to drying of secretions around the catheters, abdominal distension and aspiration of gastric contents). Patients who failed to achieve adequate oxygenation with the assigned treatment were classified as primary treatment failures and the alternative treatment was then tried.
The Muhe 1998 RCT was performed in Addis Ababa (2800 MASL) with the aim of comparing the safety and effectiveness of nasal prongs compared to a modified version of the nasopharyngeal catheter (an 8 FG catheter was passed through the nose up to the same distance measured from the side of the nostril to the inner margin of the eyebrow). The study included children between two weeks and five years of age with acute LRTI associated with hypoxaemia (SpO2 < 90%). Children were randomly assigned to receive oxygen by nasal catheter (n = 49) or nasal prongs (n = 50). Patients were stabilised on one method and then shifted to the other method to compare the oxygen required and the amount of time needed to achieve SaO2 above 90%. Complications (nasal blockage, nasal ulcerations and nasal bleeding) were documented and recorded by the research physician.
The Weber 1995 RCT was carried out in Banjul, Gambia (27 MASL) to determine the flow rate necessary to achieve an haemoglobin oxygen saturation (SaO2) higher than 95%. It included 118 children between seven days and five years of age with a LRTI and with SaO2 < 90%. Children were randomly assigned to receive oxygen by nasopharyngeal catheter (n = 56) or nasal prongs (n = 62). Every two hours oxygen flow rates and SaO2 were recorded. Nurses recorded adverse events and complications (episodic desaturations, nasal obstruction, nasal ulcerations, gastric distension and apnoea episodes) and acceptability for each delivery method. If children were not able to oxygenate with the highest flow rate of 4 L/min, they were switched to another method.
Kumar 1997 is a non‐RCT that was conducted in New Delhi at 239 MASL to compare the efficacy and acceptability of four commonly used oxygen delivery systems: head box, face mask, nasopharyngeal catheter and twin‐holed pre‐nasal catheter. They included 80 children younger than five years of age presenting with acute respiratory distress, who required oxygen to achieve a PaO2 of 60 mmHg. Children were assigned to receive oxygen administered by all four methods for 15 minutes in a predetermined sequence. Measures of efficacy included arterial blood gas analysis and SaO2. Acceptability in terms of child comfort was assessed by a tolerance score as perceived by the mother.
Observational studies determining the indications for oxygen therapy in children with LRTIs
From the 14 studies identified to determine the indications for oxygen therapy in children with LRTIs (i.e. which describe the oxygen saturation values or clinical signs that would indicate the need for oxygen therapy) we finally included only 13 (Basnet 2006; Duke 2002; Dyke 1995; Gutierrez 2001; Kuti 2013; Laman 2005; Lodha 2004; Lozano 1994; Onyango 1993; Reuland 1991; Smyth 1998; Usen 1999; Weber 1997). The study by Orimadegun 2013 has been assigned to the Studies awaiting classification section because the information regarding the outcomes in the LRTI subgroup of the population studied is misleading and personal communication with the trial author was unsuccessful in gathering this information. Characteristics of the observational studies included are presented in Characteristics of included studies.
The study by Reuland 1991 was conducted in Junin, the Peruvian Andes (3750 MASL) to determine the effect of respiratory infections on oxygen saturation. The prospective study included 423 children between 2 and 60 months with acute respiratory infections. Children with chronic illnesses such as asthma, congenital cardiac malformation or heart murmurs were excluded. Clinical signs and symptoms present at the time of admission were recorded by an expert physician who was blinded to the oximeter reading. SpO2 was also measured at this time. Using two clinical categories, upper respiratory tract infection (URTI) and LRTI and balancing by age group, they determined the sensitivity, specificity and likelihood ratios (LR) for several potential indicators of hypoxaemia. The SpO2 cut‐off was determined by studying 153 healthy children from the same population. Hypoxaemia was considered to be present if SpO2 was > 2 standard deviations below the mean value for healthy children (2 to 11 months: SpO2 < 84 and 12 to 60 months: SpO2 < 86).
Onyango 1993 conducted a study in the Kenyatta National Hospital, Nairobi, Kenya (1676 MASL) in order to predict hypoxaemia based on clinical signs and symptoms present at the time of admission to the hospital. They included 256 children aged from 7 days to 36 months with LRTI. Children presenting with moderate or severe dehydration, with anaemia, central nervous system, cardiac, renal or metabolic diseases were excluded. Recorded data included respiratory rates, pulse, central cyanosis, chest retractions, grunting, nasal flaring, wheezing, crepitations or rhonchi on auscultation. SpO2 breathing room air and a chest radiograph read by a blinded physician were taken as the gold standard for diagnosis of hypoxaemia associated with LRTI. To define the SpO2 cut‐off point, oxygen saturation was measured with an oximeter in 87 healthy children attending the child welfare clinics (SpO2 = mean 95.7 standard deviation (SD) 1.6%). Each clinical finding was assessed for its sensitivity and specificity in the diagnosis of hypoxaemia. Results are presented in three age strata.
The Lozano 1994 study was conducted in Bogota, Colombia (2640 MASL). It assessed the usefulness of clinical signs and symptoms in the diagnosis of radiological pneumonia or hypoxaemia (SpO2 < 88%), or both. They included 201 children aged from seven days to 36 months, presenting with cough lasting up to seven days and whose evaluation included a chest radiograph. Children were excluded if they had cardiovascular, pulmonary, neurological or congenital defects; a chronic disease including asthma, cancer, immunosuppression and metabolic disorders; or previous episodes of wheezing. Data on symptoms and clinical signs of acute respiratory infection were obtained using a standardised questionnaire and a physical examination performed by a paediatrician. The gold standard used to calculate sensitivity and specificity for each symptom was a chest radiograph read by a blinded physician plus the oxygen saturation measured by oximeter.
The study by Dyke 1995 was undertaken in Tari, New Guinea (1600 MASL), with the aim of identifying the indications for administering oxygen based on easily recognisable signs. This study included 91 children between three months and five years with a clinical diagnosis of pneumonia. Clinical signs present at the initial evaluation (cyanosis, poor feeding, crepitations, bronchial breathing, grunting, chest indrawing, nasal flaring, drowsiness and hepatomegaly) were recorded. To establish the 'adequate' values of oxygen saturation, 100 healthy children from Tari were assessed with oximeter and hypoxaemia was defined as SpO2 equal to or less than 85%. Sensitivity and specificity of each sign were calculated, to indicate whether hypoxaemia was present, taking the oximeter readings as the gold standard. Authors also developed regression equations to predict hypoxaemia.
Weber 1997 was a case‐control study conducted in the Royal Victoria Hospital in Banjul, Gambia at sea level, with the aim of studying the signs and symptoms indicating hypoxaemia in children with pneumonia. It included 69 children with LRTI and hypoxaemia (SpO2 < 90%) classified as cases and 111 children with the same selection criteria but without hypoxaemia classified as controls (enrolled in two different hospitals: 67 control form the Royal Victoria and 44 from the Medical Research Council, Fajara). Cases and controls were matched by age. Clinical findings were recorded at the time of admission from physical examination and anthropometric measurements. Chest radiographic findings were evaluated by a blinded physician. Using multi‐regression analysis, they derived models to determine the clinical predictors of hypoxaemia. The sensitivity and specificity of each single model was calculated.
The study by Smyth 1998 was performed in Katete, Zambia (1150 MASL). The study included 158 rural children between four weeks and five years with severe or very severe pneumonia according to the WHO classification. Their purpose was to investigate the clinical signs (respiratory rate, chest indrawing, grunting, crepitations/bronchial breathing, cyanosis, failure to drink) that predict hypoxaemia. In a pilot study with 85 healthy infants they established a cut‐off point of normal oxygen saturation at Zambia altitude (SpO2 > 92%). Data were used to develop a multiple regression equation to predict hypoxaemia stratified by age group. Individual data for the sensitivity and specificity of respiratory rate to confirm the presence of hypoxaemia were reported for nine different cut‐off points (increments of four breaths/min). The SpO2 measure was taken as the gold standard. Multiple logistic regression analysis was carried out to predict hypoxaemia.
The Usen 1999 study was undertaken in two hospitals in Banjul, Gambia at sea level. The authors analysed data collected as part of the 'haemophilus influenza vaccine for the prevention of infant pneumonia' trial, to study the clinical signs that could predict hypoxaemia. The study included 1072 children aged between 2 and 33 months in the trial cohort who were admitted with pneumonia or any other form of acute LRTI. Any child who had signs of structural heart disease, Down's syndrome or those who had been included in a previous case‐control study of hypoxaemia were excluded. The sensitivity and specificity of symptoms and clinical signs reported by the patients' mothers, as well as multi‐regression models, were used to confirm the presence of hypoxaemia (SpO2 < 90%). The oximeter readings were taken as the gold standard.
The Gutierrez 2001 study was conducted in Montevideo, Uruguay (43 MASL). A total of 216 hospitalised children between one month and five years with LRTI or with asthma were evaluated to determine the sensitivity, specificity and predictive values of tachypnoea, tachycardia and chest retractions to determine the presence of hypoxaemia associated with LRTI. Children with chronic respiratory distress and neuromuscular diseases were excluded from the study. Hypoxaemia was defined as SpO2 < 95%. Oxygen saturation measured by oximeter was taken as the gold standard. Results are presented in group of signs or symptoms.
The study by Duke 2002 was conducted in the Eastern Highlands of Papua New Guinea (1600 MASL). Two hundred and fifty‐seven neonates and children (59%) were enrolled in the study with the aim of determining the incidence and severity of hypoxaemia in neonates and children with acute respiratory and non‐respiratory illnesses. To establish normal values of oxygen saturation among well neonates and children they studied 67 neonates and 151 children from 1 to 60 months. Clinical symptoms or signs such as inability to feed, reduced activity, cyanosis, fast respiratory rate, failure to resist examination, grunting and head nodding were assessed as indicators of hypoxaemia (SpO2 < 86%). Presence of hypoxaemia was determined using the oximeter readings as the gold standard. Logistic regression analysis was used to determine the best independent combination of clinical signs predicting hypoxaemia. Results are presented as odds ratio, sensitivity, specificity, and positive and negative predictive values for each predictive model.
The Lodha 2004 study was conducted in the Indian Institutes of Medical Sciences, New Delhi (239 MASL). One hundred and nine children less than five years of age were evaluated in a cross‐sectional study, with the aim of determining the prevalence of hypoxaemia (SpO2 < 90%) in children with acute LRTI and identifying the clinical signs associated with the presence of hypoxaemia in children with LRTI. Children with a history of cough and rapid respiration or difficulty in breathing were included. Children with asthma, congenital heart disease, severe anaemia, peripheral circulatory failure, needing ventilatory support and severe dehydration were excluded. Data were obtained from the mother's report about the presence and duration of various respiratory symptoms, and by physical examination of the child to establish the presence of signs such as: appearance, weight, heart rate, respiratory rate, oxygen saturation, cyanosis, chest retraction, grunting, nasal flaring, head nodding, pallor, crepitation or rhonchi and the state of consciousness. Sensitivity, specificity and likelihood ratios were calculated for each symptom or sign and for various combinations of clinical signs as well. The oximeter readings were taken as the gold standard.
The Laman 2005 study was done in Port Moresby, Papua New Guinea (at sea level). The study included 77 children between 1 and 60 months of age with a diagnosis of moderate or severe pneumonia defined according to the WHO classification. Children with underlying pathology such as congenital heart disease, asthma, HIV infection and severe malnourishment (< 60% standard weight for age) were excluded. History and clinical signs were taken at the time of admission. Clinical findings were correlated with different levels of hypoxaemia (< 93%, < 90% and < 85%). Sensitivity, specificity and predicted values of clinical signs were calculated for each level of hypoxaemia established in advanced, using the oximeter readings as the gold standard.
The study by Basnet 2006 was conducted from December 1999 to July 2000 in the Kathmandu valley (1336 MASL). Trial authors assessed the prevalence of hypoxaemia (SpO2 < 90%) in 264 children, aged from two months to five years, with a diagnosis of pneumonia. Children with heart disease or any other disease were excluded. Data about relevant history of the illness and examination were collected following a structured questionnaire prepared in advanced, before the child received any treatment. Based on the clinical findings the patients were categorised into four groups according to the severity of illness described in the WHO guidelines. They determined the frequency and the increase of hypoxaemia according to the severity of the illness. Sensitivity and specificity of clinical signs were calculated, taking the oximeter readings as the gold standard.
The study by Kuti 2013 was conducted in Gambia at sea level, with the aim of determining factors that predict hypoxaemia at presentation in children with severe pneumonia. They included 420 patients aged from 2 to 59 months with severe pneumonia, 81 of them had hypoxaemia (oxygen saturation < 90%). Children aged 2 to 11 months, with grunting respiration, cyanosis and head nodding and those with cardiomegaly on chest radiograph were at higher risk of hypoxaemia. Patients with wheeze and cough lasting more than two weeks were excluded. All patients enrolled had a chest radiograph at admission and were examined to obtain weight, height to derive nutritional state parameters, axillary temperature, respiratory rate, nasal flaring, presence of pallor, central cyanosis, head nodding, altered sensorium at presentation and abnormal breath sounds on auscultation as well as abnormal heart sounds were recorded. Oxygen saturation was measured using a pulse oximeter and recorded after stabilisation of the reading by a trained nurse. All children were placed on intravenous antibiotics for pneumonia. Grunting respiration and cyanosis were independent predictors of hypoxaemia in childhood pneumonia. They concluded that children that grunt and are centrally cyanosed should be preferentially commenced on oxygen therapy even when there is no facility to confirm hypoxaemia.
The Orimadegun 2013 study was conducted in south western Nigeria, at sea level. The authors investigated the prevalence and predictors of hypoxaemia in ALRI and non‐ALRI according to age and primary diagnoses. The study included 1726 children admitted to a tertiary hospital from which 313 were diagnosed with ALRI. Oxygen saturation was measured shortly after admission. Hypoxaemia was defined as 90% oxygen saturation. Clinical features and the primary admission diagnoses were recorded. Prevalence of hypoxaemia according to age and diagnoses was calculated. Signs and symptoms associated with hypoxaemia were compared between children with ALRI and those with non‐ALRI. Logistic regression was used to determine the association between clinical signs and hypoxaemia adjusting for age.
Case reports assessing adverse events
Two case report studies were found describing severe adverse events related to non‐invasive oxygen delivery methods in infants between three months and five years of age with LRTI (Campos 1994; Frenckner 1990). The characteristics of the studies reporting adverse events are presented in Table 1.
| Study | Adverse event | Oxygen delivery method |
| Pneumocephalus in an 8‐month old girl with severe staphylococcal pneumonia | Nasopharyngeal catheter | |
| Pneumocephalus and right side severe exophthalmos in a 11‐month old boy with bacterial pneumonia and sinusitis | Nasopharyngeal catheter |
Frenckner 1990 reported a pneumocephalus detected in an eight‐month old girl with severe staphylococcal pneumonia. Supplementary oxygen was delivered through a nasopharyngeal catheter introduced 5 to 7 cm from the nostril. Twenty‐four hours after the catheter insertion, exophthalmos was noticed. The computed tomography (CT) scans showed a pronounced pneumocephalus with 2 cm of subdural air in the frontal region. It was determined that the catheter had perforated the skull bone and had been located intracranial.
Campos 1994 reported a pneumocephalus and right sided severe exophthalmos developed by an 11‐month old boy while he was receiving oxygen by a nasopharyngeal catheter as part of the treatment of bacterial pneumonia and sinusitis. The catheter was inserted in the right nostril and was delivering oxygen at 2 L/min. The adverse event occurred eight days after the catheter insertion. The CT scan revealed air in the orbital cavity and a moderate pneumocephalus in the frontal and right temporal regions.
Excluded studies
For the main objectives (effectiveness and safety of interventions) we excluded three studies. We excluded one RCT because it did not address any of the clinical endpoints of interest in this review as described in Types of outcome measures (Thia 2008). We excluded one non‐RCT because it is a descriptive study and included all children presenting with hypoxaemia for any clinical reason and did not report desegregated data for those with severe LRTI (de Camargo 2008). We excluded one open pilot study assessing the safety and feasibility of using heated humidified high flow nasal cannula therapy in infants with bronchiolitis comparing with head box, because the population studied included infants less than two months old (range 0.3 to 11.3 months) and the small sample size did not allow us to obtain valid results in a subgroup analysis (Hilliard 2012). This study may be more appropriate in the Umoren 2011 Cochrane Review.
For the secondary objectives we excluded a total of seven studies assessing the clinical predictors of hypoxaemia: four cohort studies (Kelly 2013; Margolis 1994; Mwaniki 2009; Rubin 2003); one case‐control study (Chisti 2013); and two case reports (Ackley 1978; Borstlap 1992).
Rubin 2003 evaluated children with acute viral bronchiolitis treated with oxygen therapy using nasal prongs. We excluded this study because it did not assess the clinical predictors of hypoxaemia and other outcomes of interest for this review.
We excluded the Margolis 1994 study because its results are presented in different categories of combined clinical signs and it was not possible to contact the trial authors to obtain disaggregated data.
The Mwaniki 2009 study evaluated the clinical signs predicting hypoxaemia in a cohort of more than 13,000 children in Kenya. However, the trial authors did not report independent data for the subgroup of children with LRTIs. We contacted the main study author twice via email asking for the disgregated information but we did not receive any response.
The Kelly 2013 study assessed the clinical and patient characteristics that predict success or failure of high flow nasal cannula therapy in children. We excluded the study because the population included children with all‐cause respiratory distress and there were no desegregated data available for LRTI children.
The Chisti 2013 study assessed the clinical predictors of hypoxaemia. However, we excluded it because the study was conducted in severely malnourished children with pneumonia.
We excluded the studies by Ackley 1978 and Borstlap 1992 because they only reported events in two‐month old infants.
Finally, we excluded one cost‐effectiveness study because it evaluated the economic impact of introducing the oxygen concentrators and pulse oximeters in hospitals from low‐income countries but it did not assess the cost or relative cost‐effectiveness of non‐invasive oxygen delivery methods (Duke 2008).
Risk of bias in included studies
A complete description of the risk of bias for the included RCTs is presented in the 'Risk of bias' tables (see Characteristics of included studies). In summary, the Singhi 2012 study has a low risk of bias; it used adequate allocation concealment and randomisation, although the intervention was not blinded. The outcome measurement was done using hard variables. We classified Muhe 1997, Muhe 1998 and Weber 1995 as having medium risk of bias. The Kumar 1997 study had a high risk of bias because it used a sequential design for testing four delivery methods in each participant (15 minutes each one) and the main outcome assessment was not standardised. Therefore it is very likely that results for the number of children who achieve the target PaO2 were biased by contamination.
Results from the assessment of the overall quality and certainty of the evidence resulting from the comparison between 'oxygen delivery methods' for each main outcome are presented in summary of findings Table for the main comparison and discussed in the Effects of interventions section. We are not presenting the assessment of the overall quality of evidence for the outcomes under the comparison 'oxygen therapy versus no oxygen therapy' as the evidence comes just from one pilot study including 58 participants, and the quality of this evidence is easily anticipated as being very low because of limitations in trial design, the small number of events/participants (inconsistency) and imprecision of estimates (Figure 1; Figure 2).
Forest plot of comparison: 1 Supplemental oxygen versus room air, outcome: 1.1 Incidence of subsequent hypoxaemia.

Forest plot of comparison: 1 Supplemental oxygen versus room air, outcome: 1.2 Duration of tachypnoea.
For the observational studies included to determine the indicators for oxygen therapy in children with LRTIs (Basnet 2006; Duke 2002; Dyke 1995; Gutierrez 2001; Kuti 2013; Laman 2005; Lodha 2004; Lozano 1994; Onyango 1993; Reuland 1991Smyth 1998; Usen 1999; Weber 1997), the 'Risk of bias' assessment showed that, in general, these studies presented a low risk of bias. In all of these studies, the investigators performed a physical evaluation to determine the presence of each clinical sign at the time of admission and took measurements of the oxygen saturation with a pulse oximeter while children were breathing room air. In all cases, physicians caring for patients were blinded to the SpO2 results. The oximeter readings were used as the gold standard in all studies and SpO2 was measured in every child included in the studies. The definition of hypoxaemia was established in advance depending on the expected SaO2 for the altitude of the city where the study was conducted (between 92% to 96%).
Allocation
Muhe 1997, Muhe 1998 and Singhi 2012 randomised participants using sealed envelopes. In Muhe 1997, the enrolment of children was limited by the availability of beds and pulse oximeter. Muhe 1998 used a cross‐over study design. Weber 1995 used a random method of sequentially numbered, sealed envelopes to assign patients to treatment. Kumar 1997 used a quasi‐randomised method to assign patients to the treatment groups in a cross‐over design (predetermined sequence) but the allocation sequence was not clearly described. There was no description of the order in which children were assigned to the different delivery methods.
Blinding
In four of the included trials the therapies were not masked and the assessment of outcomes was not blinded, but SaO2 was documented in all children using an oximeter (Muhe 1997; Muhe 1998; Singhi 2012; Weber 1995). Complications and other secondary outcomes were also assessed in a non‐blinded way. In Kumar 1997, the evaluation of the main outcome seems to be objective even though it was not blinded. They used arterial blood gas analysis and a pulse oximeter but the main outcome assessment was not standardised. The risk of detection bias is moderate.
Incomplete outcome data
The studies conducted by Muhe 1997, Muhe 1998 and Singhi 2012 did not report loss to follow‐up; outcomes were measured in all randomised participants. The other studies reported comparable attrition rates in both intervention groups and provided reasons for loss to follow‐up. The risk of attrition bias is low.
Selective reporting
None of the four included RCTs, nor the non‐RCT, registered the protocol in an appropriate clinical trials database. We could not make the comparison between the 'planned measures' with those finally reported. All four included RCTs reported results for the same outcomes listed in their methods section. All important outcomes, especially those adverse effects related to the interventions, were included. Therefore we considered that the risk of reporting bias was low.
Other potential sources of bias
We did not identify other sources of bias in the included RCTs and non‐RCT other than those already described.
Effects of interventions
See: Summary of findings for the main comparison Nasal prongs versus nasopharyngeal catheter for lower respiratory tract infections; Summary of findings 2 Face mask compared to nasopharyngeal catheter for severe acute LRTIs in children; Summary of findings 3 Head box compared to nasopharyngeal catheter for severe acute LRTIs in children
Primary outcomes
The effectiveness of oxygen therapy in the treatment of severe lower respiratory tract infections (LRTIs) in children
1. Clinical failure
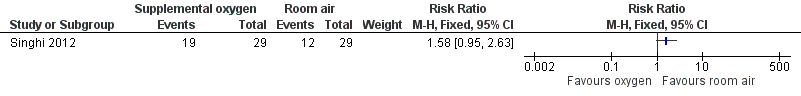
As already stated, we found just one study assessing the effectiveness of oxygen therapy in the treatment of severe LRTI in children (Singhi 2012). The primary outcome measure was incidence of subsequent hypoxaemia. A total of 31 patients (53.5%) developed hypoxaemia within 60 hours of enrolment; 66% were in the supplemental oxygen group and 42% were in the room air group. The results showed a trend towards an increased risk of developing hypoxaemia in the group receiving oxygen supplementation compared to the room air group. This estimate was not statistically significant (one study; 58 participants; risk ratio (RR) 1.58, 95% confidence interval (CI) 0.95 to 2.63) (Analysis 1.1; Figure 1).
2. Improvement in respiratory signs achieved during the first 24 hours after oxygen therapy was initiated
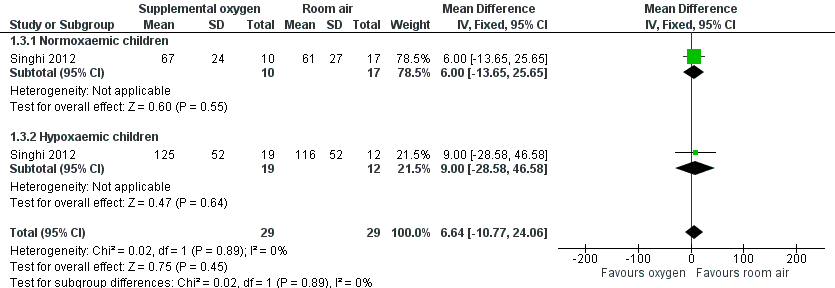
The Singhi 2012 study reported on the "cessation of lower chest indrawing and tachypnoea". The results showed that for lower chest indrawing and tachypnoea no significant differences were shown between groups (one study; 58 participants; chest indrawing: standardised mean difference (SMD) 6.64, 95% CI ‐10.77 to 24.06 (Analysis 1.3); tachypnoea: SMD 4.49, 95% CI ‐16.30 to 25.28) (Analysis 1.2). Similar findings were reported for the duration of hypoxaemia in those children who developed this outcome in both groups. In a subgroup analysis comparing those who remained normoxaemic with those who developed hypoxaemia, the authors found similar baseline clinical and laboratory characteristics. However, children who developed hypoxaemia had presented with lower SpO2 at time of enrolment, and had significantly longer tachypnoea (Figure 2) and longer presence of lower chest indrawing (Figure 3). These findings were similar among children in both interventions groups.
Forest plot of comparison: 1 Supplemental oxygen versus room air, outcome: 1.3 Duration of chest indrawing.
The effectiveness and safety of non‐invasive oxygen delivery methods
We found four studies assessing the efficacy of non‐invasive delivery methods for the treatment of LRTI in children. Three studies were randomised controlled trials (RCTs) and evaluated the effectiveness of nasal prongs or nasal cannula compared with nasopharyngeal catheter (Muhe 1997; Muhe 1998; Weber 1995). One non‐RCT compared head box, face mask, nasopharyngeal catheter and nasal cannula (Kumar 1997). All reported outcomes considered nasopharyngeal catheters or nasal catheters as the control group, as they are the most widely used methods in low‐income countries.
Comparison 1. Effectiveness of nasal prongs versus nasopharyngeal catheter in the treatment of severe acute LRTIs in children
1. Treatment failure
Three of the included studies assessed the effectiveness of nasal prongs in comparison with nasopharyngeal catheter (Kumar 1997; Muhe 1997; Weber 1995) (Analysis 2.1; Figure 4). These studies reported treatment failure as the number of children that failed to achieve adequate SaO2 in the hours after each method was administered. The pooled estimate of the effect from the RCTs showed a concerning trend towards no difference in treatment failure between groups (two studies; 239 participants; RR 0.93, 95% CI 0.36 to 2.38; I2 statistic = 0%) (Analysis 2.1; Figure 4). Results from the non‐RCT also showed a trend towards to no difference in treatment failure between groups (one study; 160 participants; RR 1.00, 95% CI 0.44 to 2.27) (Analysis 2.1; Figure 4).

Forest plot of comparison: 2 Nasal prongs versus nasopharyngeal catheter, outcome: 2.1 Treatment failure to achieve adequate oxygenation.
One study compared the effectiveness of nasal prongs versus nasal catheter (Muhe 1998). This study reported treatment failure as the mean number of episodes of oxygen desaturation per child. In the nasal catheter group 36 children presented with oxygen desaturation (mean 2.75; standard deviation (SD) ± 2.18 episodes/child) and in the nasal prongs group 38 children presented with oxygen desaturation (mean 3; SD ± 2.5 episodes/child). This study also showed no difference in the frequency of episodes of desaturation between the groups (t test P value = 0.64). According to the GRADE approach, we considered the quality of the body of evidence for this outcome very low due to important risk of bias and serious imprecision (summary of findings Table for the main comparison).
2. Presence of clinical deterioration or signs of a more severe illness
None of the included studies reported on this outcome.
3. Mean flow rates required with each method to achieve adequate SaO2
Three of the included studies assessed this outcome (Muhe 1997; Muhe 1998; Weber 1995). The results were similar in both intervention groups, nasopharyngeal catheter/nasal catheter and nasal prongs (three studies; 338 participants; SMD 0.08 L/min, 95% CI ‐0.14 to 0.29) (Analysis 2.2). The quality of the evidence for this outcome is low due to risk of bias in trial design and imprecision in the estimates (summary of findings Table for the main comparison).
4. Type and frequency of side effects
Muhe 1997, Muhe 1998 and Weber 1995 reported the presence of nasal obstruction/severe mucus production, nose ulceration or bleeding, fighting or discomfort in the first 24 hours and deaths.
The only adverse effect that showed a significant difference between groups was nasal obstruction due to severe mucus production. It was less frequent in the nasal prongs group (three studies; 338 participants; RR 0.20, 95% CI 0.09 to 0.44; I2 statistic = 0%) (Analysis 2.3). According to the GRADE quality assessment, the quality of the evidence for this outcome is low due to risk of bias in trial design and imprecision in the estimates (summary of findings Table for the main comparison).
Nose ulceration or bleeding (Analysis 2.4; Figure 5), fighting or discomfort in the first 24 hours (Analysis 2.5) and deaths (Analysis 2.6; Figure 6) were shown to be less frequent in the nasal prongs group. However, the pooled effect estimates showed a lack of precision, therefore they could not be considered to show significant differences between the groups. We considered the quality of the evidence for these two outcomes low due to risk of bias and imprecision (summary of findings Table for the main comparison).

Forest plot of comparison: 2 Nasal prongs versus nasopharyngeal catheter, outcome: 2.4 Nose ulceration or bleeding.

Forest plot of comparison: 2 Nasal prongs versus nasopharyngeal catheter, outcome: 2.6 Death during treatment.
5. Type and frequency of severe adverse events
The only severe adverse event reported in children from three months to five years of age was the development of pneumocephalus. It was reported twice in infants with supplementary oxygen delivered through a nasopharyngeal catheter as part of the treatment of LRTI (Campos 1994; Frenckner 1990).
6. Need for mechanical ventilation
This was not reported on.
Comparison 2. Effectiveness of face mask versus nasopharyngeal catheter in the treatment of severe acute LRTIs in children
1. Treatment failure
One study reported the comparative effectiveness of the face mask and the nasopharyngeal catheter (Kumar 1997). According to the results, the face mask group presented fewer treatment failures (failure to achieve a PaO2 > 60 mmHg) than the nasopharyngeal catheter group (odds ratio (OR) 0.20, 95% CI 0.05 to 0.88), which was highly significant.
According to the GRADE approach, we considered the quality of the evidence for this outcome low due to important risk of bias and imprecision (summary of findings Table 2).
2. Presence of clinical deterioration or signs of a more severe illness
This was not reported on.
3. Mean flow rates required with each method to achieve adequate SaO2
This was not reported on.
4. Type and frequency of side effects
This study did not report side effects associated with the methods evaluated.
5. Type and frequency of severe adverse events
We found no study that reported any severe adverse events associated with the use of a face mask in children from three months to five years.
6. Need for mechanical ventilation
This was not reported on.
Comparison 3. Effectiveness of head box versus nasopharyngeal catheter in the treatment of severe acute LRTIs in children
1. Treatment failure
One study reported the comparative effectiveness of the head box and nasopharyngeal catheter (Kumar 1997). The frequency of treatment failure in the head box group was lower than in the nasopharyngeal catheter group (OR 0.40, 95% CI 0.13 to 1.12). However, this estimate lacks precision and the differences are not significant.
According to the GRADE approach, we considered the quality of the evidence for this outcome very low due to important risk of bias and very serious imprecision (summary of findings Table 3).
2. Presence of clinical deterioration or signs of a more severe illness
This was not reported on.
3. Mean flow rates required with each method to achieve adequate SaO2
This was not reported on.
4. Type and frequency of side effects
This study did not report side effects associated with the methods evaluated.
5. Type and frequency of severe adverse events
We found no study that reported any severe adverse events associated with the use of the head box in children from three months to five years. Kumar 1997 reported the "tolerance score" for each method as part of the effectiveness assessment. According to the results, the head box and nasal cannula (two‐holed pre‐nasal catheter) were the best accepted methods for oxygen delivery.
6. Need for mechanical ventilation
This was not reported on.
Secondary outcomes
1. Clinical criteria that would indicate the need for oxygen therapy or hypoxaemia in children with LRTI
To describe the oxygen saturation values or clinical signs that would indicate the use of oxygen therapy, we included 13 studies conducted with the aim of assessing the accuracy of each sign and symptom present at the time of admission to indicate the presence of hypoxaemia. The included studies showed important sources of clinical heterogeneity, such as population baseline characteristics (type and severity of underlying diseases, age groups etc). Due to this heterogeneity we did not perform a meta‐analysis.
Since most of the included studies assessed similar signs and symptoms as predictors of hypoxaemia, we presented the findings in tables grouped by each sign reported within a consistent definition among studies (Table 2; Table 3; Table 4; Table 5; Table 6; Table 7; Table 8; Table 9; Table 10). As already stated, the definition of hypoxaemia used was different in the included studies and was established, in the majority of cases, by evaluating healthy children from a similar population. Differences in altitude and the definition of hypoxaemia used are also presented in these tables.
| Study | Altitude | Hypoxaemia | Age | Sensitivity | Specificity | LR+ |
| 3750 MASL | SpO2 < 82% | 2 to 11 months | 13 | 99 | 13 | |
| 3750 MASL | SpO2 < 85% | > 11 months | 13 | 99 | 13 | |
| 1670 MASL | SpO2 < 91% | 3 to 11 months | 9 | 96 | 2.3 | |
| 1600 MASL | SpO2 < 86% | 1 month to 5 years | 42 | 84 | 2.6 | |
| Sea level | SpO2 < 90% | 2 months to 5 years | 39 | 100 | ||
| Sea level | SpO2 < 90% | 2 to 36 months | 25 | 95 | 5.0 | |
| 1600 MASL | SpO2 < 88% | 1 month to 5 years | 38 | 98 | 19.9 | |
| 239 MASL | SpO2 < 90% | < 5 years | 14 | 96 | 3.7 | |
| 35 MASL | SpO2 < 93% | 1 month to 5 years | 74 | 93 | 10.5 | |
| 35 MASL | SpO2 < 90% | 1 month to 5 years | 70 | 75 | 2.8 | |
| 1336 MASL | SpO2 < 90% | 2 month to 5 years | 5 | 100 | ||
| Sea level | SpO2 < 90% | 2 months to 5 years | 20 | 100 | 66.9 |
MASL: metres above sea level
SpO2: oxygen saturation measured by pulse oximeter
LR: likelihood ratio
| Study | Altitude | Hypoxaemia | Age | Sensitivity | Specificity | LR+ |
| 1670 MASL | SpO2 < 91% | 3 to 11 months | 64 | 73 | 2.4 | |
| 1670 MASL | SpO2 < 91% | 12 to 36 months | 56 | 76 | 2.3 | |
| 2640 MASL | SpO2 < 88% | 7 days to 36 months | 45 | 72 | 1.6 | |
| 1600 MASL | SpO2 < 86% | 3 months to 5 years | 42 | 89 | 3.8 | |
| Sea level | SpO2 < 90% | 2 months to 5 years | 48 | 61 | 1.2 | |
| Sea level | SpO2 < 90% | 2 to 36 months | 46 | 86 | 3.3 | |
| 1600 MASL | SpO2 < 88% | 1 month to 5 years | 22 | 87 | 1.6 | |
| 239 MASL | SpO2 < 90% | < 5 years | 14 | 93 | 1.9 | |
| 35 MASL | SpO2 < 93% | 1 month to 5 years | 82 | 72 | 3.0 | |
| 35 MASL | SpO2 < 90% | 1 month to 5 years | 90 | 61 | 2.3 | |
| 1336 MASL | SpO2 < 90% | 2 months to 5 years | 36 | 99 | 32.9 | |
| Sea level | SpO2 < 90% | 2 months to 5 years | 60 | 77 | 2.66 |
MASL: metres above sea level
SpO2: oxygen saturation measured by pulse oximeter
LR: likelihood ratio
| Study | Altitude | Hypoxaemia | Age | Sensitivity | Specificity | LR+ |
| 2640 MASL | SpO2 < 88% | 7 days to 36 months | 63 | 65 | 1.8 | |
| 1600 MASL | SpO2 < 86% | 3 months to 5 years | 56 | 84 | 3.5 | |
| Sea level | SpO2 < 90% | 2 months to 5 years | 71 | 54 | 1.5 | |
| Sea level | SpO2 < 90% | 2 to 36 months | 98 | 17 | 1.2 | |
| 35 MASL | SpO2 < 93% | 1 month to 5 years | 71 | 58 | 1.7 | |
| 1336 MASL | SpO2 < 90% | 2 months to 5 years | 48 | 98 | 22.0 |
MASL: metres above sea level
SpO2: oxygen saturation measured by pulse oximeter
LR: likelihood ratio
| Study | Altitude | Hypoxaemia | Type of indrawing | Age | Sensitivity | Specificity | LR+ |
| 3750 MASL | SpO2 < 82% | Any chest retractions | 2 to 11 months | 35 | 94 | 5.8 | |
| 3750 MASL | SpO2 < 85% | Any chest retractions | > 11 months | 35 | 94 | ||
| 1670 MASL | SpO2 < 91% | Any retractions | 3 to 11 months | 97 | 29 | 1.4 | |
| 1670 MASL | SpO2 < 91% | Any retractions | > 11 months | 88 | 30 | 1.3 | |
| 2640 MASL | SpO2 < 88% | Intercostal | 7 days to 36 months | 79 | 55 | 1.8 | |
| 2640 MASL | SpO2 < 88% | Subcostal | 7 days to 36 months | 76 | 43 | 1.3 | |
| 2640 MASL | SpO2 < 88% | Any chest retractions | 7 days to 36 months | 83 | 40 | 1.4 | |
| 1600 MASL | SpO2 < 86% | Indrawing | 1 week to 5 years | 98 | 7 | 1.1 | |
| Sea level | SpO2 < 90% | Intercostal indrawing | 2 months to 5 years | 65 | 69 | 2.1 | |
| Sea level | SpO2 < 90% | Lower chest indrawing | 2 months to 5 years | 74 | 37 | 1.2 | |
| 43 MASL | SpO2 < 95% | Any chest retractions | 1 month to 5 years | 59 | 63 | 1.6 | |
| 239 MASL | SpO2 < 90% | Intercostal indrawing | < 5 years | 32 | 88 | 2.6 | |
| 239 MASL | SpO2 < 90% | Lower chest indrawing | < 5 years | 36 | 86 | 2.6 | |
| 1336 MASL | SpO2 < 90% | Chest indrawing | 2 months to 5 years | 69 | 83 | 4.0 |
MASL: metres above sea level
SpO2: oxygen saturation measured by pulse oximeter
LR: likelihood ratio
| Study | Altitude | Hypoxaemia | Definition | Age | Sensitivity | Specificity | LR+ | LR‐ |
| 1670 MASL | SpO2 < 91% | Unresponsive | 3 to 11 months | 63 | 67 | 1.9 | 0.6 | |
| 1670 MASL | SpO2 < 91% | Unresponsive | > 11 months | 56 | 78 | 2.5 | 0.6 | |
| 2640 MASL | SpO2 < 88% | Difficult to awake/abnormal sleepiness | 7 days to 36 months | 12 | 89 | 1.1 | 1.0 | |
| 1600 MASL | SpO2 < 86% | Decrease of consciousness/restlessness | 3 months to 5 years | 36 | 91 | 4.0 | 0.7 | |
| Sea level | SpO2 < 91% | Arousal | 2 months to 5 years | 70 | 78 | 3.2 | 0.4 | |
| Sea level | SpO2 < 91% | Irritability | 2 months to 5 years | 41 | 43 | 0.7 | 1.4 | |
| Sea level | SpO2 < 91% | Difficult to awake/abnormal sleepiness | 2 months to 5 years | 42 | 78 | 1.9 | 0.7 | |
| Sea level | SpO2 < 90% | No spontaneous movement | 2 to 36 months | 46 | 84 | 2.9 | 0.6 | |
| 1600 MASL | SpO2 < 88% | Reduced activity | 1 month to 5 years | 44 | 69 | 1.4 | 0.8 | |
| 35 MASL | SpO2 < 93% | Drowsy | 1 month to 5 years | 85 | 83 | 7.3 | 0.4 | |
| 35 MASL | SpO2 < 90% | Drowsy | 1 month to 5 years | 68 | 91 | 5.0 | 0.2 | |
| 1336 MASL | SpO2 < 90% | Lethargy | 2 months to 5 years | 40 | 100 | 0.6 |
MASL: metres above sea level
SpO2: oxygen saturation measured by pulse oximeter
LR: likelihood ratio
| Study | Altitude | Hypoxaemia | Age | Sensitivity | Specificity | LR+ |
| 1670 MASL | SpO2 < 91% | 3 to 11 months | 50 | 75 | 2.0 | |
| 1670 MASL | SpO2 < 91% | > 12 months | 40 | 71 | 1.4 | |
| 2640 MASL | SpO2 < 88% | 7 days to 36 months | 35 | 60 | 0.9 | |
| Sea level | SpO2 < 90% | 2 months to 5 years | 71 | 67 | 2.2 | |
| Sea level | SpO2 < 90% | 2 to 36 months | 33 | 91 | 3.7 | |
| 1600 MASL | SpO2 < 88% | 1 month to 5 years | 42 | 76 | 1.8 | |
| 1336 MASL | SpO2 < 90% | 2 months to 5 years | 28 | 99 | 28 | |
| Sea level | SpO2 < 90% | 2 months to 5 years | 9 | 94 | 1.39 |
MASL: metres above sea level
SpO2: oxygen saturation measured by pulse oximeter
LR: likelihood ratio
| Study | Altitude | Hypoxaemia | Tachypnoea | Age | Sensitivity | Specificity | LR+ |
| 1670 MASL | SpO2 < 91% | > 60 r/min | 3 to 11 months | 86 | 56 | 2.0 | |
| 1670 MASL | SpO2 < 91% | > 70 r/min | 3 to 11 months | 51 | 83 | 3.0 | |
| 2640 MASL | SpO2 < 88% | > 50 r/min | 0 to 11 months | 76 | 71 | 2.6 | |
| 2640 MASL | SpO2 < 88% | > 60 r/min | 0 to 11 months | 40 | 86 | 2.9 | |
| 2640 MASL | SpO2 < 88% | > 70 r/min | 0 to 11 months | 16 | 100 | ||
| 43 MASL | SpO2 < 95% | > 50 r/min | 2 to 11 months | 64 | 56 | 1.5 | |
| 239 MASL | SpO2 < 90% | > 50 r/min | 4 to 12 months | 89 | 24 | 1.2 | |
| 239 MASL | SpO2 < 90% | > 60 r/min | 4 to 12 months | 82 | 52 | 1.7 | |
| 239 MASL | SpO2 < 90% | > 70 r/min | 4 to 12 months | 54 | 78 | 2.5 | |
| 1336 MASL | SpO2 < 90% | > 50 r/min | 2 to 12 months | 90 | 44 | 1.6 |
MASL: metres above sea level
r/min: respirations per minute (respiratory rate)
SpO2: oxygen saturation measured by pulse oximeter
LR: likelihood ratio
| Study | Altitude | Hypoxaemia | Tachypnoea | Age | Sensitivity | Specificity | LR+ |
| 1670 MASL | SpO2 < 91% | > 60 r/min | 12 to 36 months | 65 | 76 | 2.7 | |
| 1670 MASL | SpO2 < 91% | > 70 r/min | 12 to 36 months | 32 | 90 | 3.2 | |
| 2640 MASL | SpO2 < 88% | > 50 r/min | 12 to 36 months | 39 | 71 | 1.3 | |
| 2640 MASL | SpO2 < 88% | > 60 r/min | 12 to 36 months | 12 | 100 | ||
| 2640 MASL | SpO2 < 88% | > 70 r/min | 12 to 36 months | 4 | 100 | ||
| 43 MASL | SpO2 < 95% | > 40 r/min | 12 months to 5 years | 64 | 56 | 1.4 | |
| 239 MASL | SpO2 < 90% | > 40 r/min | 12 months to 5 years | 89 | 24 | 1.2 | |
| 239 MASL | SpO2 < 90% | > 50 r/min | 12 months to 5 years | 82 | 52 | 1.7 | |
| 239 MASL | SpO2 < 90% | > 60 r/min | 12 months to 5 years | 54 | 78 | 2.5 | |
| 1336 MASL | SpO2 < 90% | > 40 r/min | 13 months to 5 years | 100 | 43 | 1.8 |
MASL: metres above sea level
r/min: respirations per minute (respiratory rate)
SpO2: oxygen saturation measured by pulse oximeter
LR: likelihood ratio
| Study | Altitude | Hypoxaemia | Age | Sensitivity | Specificity | LR+ | LR‐ |
| 3750 MASL | SpO2 < 82% | 2 to 11 months | 50 | 92 | 6.3 | 0.5 | |
| 1670 MASL | SpO2 < 91% | 3 to 11 months | 77 | 40 | 1.3 | 0.6 | |
| 1670 MASL | SpO2 < 91% | 12 to 36 months | 91 | 36 | 1.4 | 0.3 | |
| 2640 MASL | SpO2 < 88% | 7 days to 36 moths | 79 | 53 | 1.7 | 0.4 | |
| 1600 MASL | SpO2 < 86% | 3 months to 5 years | 90 | 16 | 1.1 | 0.6 | |
| Sea level | SpO2 < 90% | 2 months to 5 years | 93 | 12 | 1.1 | 0.6 | |
| Sea level | SpO2 < 90% | 2 to 36 months | 86 | 30 | 1.2 | 0.5 | |
| 239 MASL | SpO2 < 90% | < 5 years | 68 | 68 | 2.1 | 0.5 | |
| 1336 MASL | SpO2 < 90% | 2 months to 5 years | 93 | 22 | 1.2 | 0.3 |
MASL: metres above sea level
SpO2: oxygen saturation measured by pulse oximeter
LR: likelihood ratio
2. Sensitivity and specificity of signs and symptoms detecting hypoxaemia
The clinical signs more commonly reported were cyanosis, tachypnoea, nasal flaring, grunting, chest indrawing, crepitations, difficulty in feeding and alteration in mental status. The sensitivity and specificity of these signs varied between studies and age groups. Cyanosis, grunting, difficulty in feeding and alteration of mental status were shown to have better specificity in predicting hypoxaemia and the results were consistent among studies. However, the sensitivity of these signs was variable, especially for the presence of cyanosis, and was not related to the age group or the altitude.
The presence of crepitations at the time of admission was shown to have good sensitivity (min 50, max 93) for determining the presence of hypoxaemia in all age groups, but this sign was not specific in most of the studies (Table 10).
Tachypnoea was shown to have better sensitivity in the prediction of hypoxaemia in children from 2 to 11 months, especially when the cut‐off point used to define tachypnoea was 50 breaths/minute (Table 8). The specificity of this sign is quite different between age groups (2 to 11 months; older than 12 months) and depends on the cut‐off point chosen. This means that tachypnoea alone is not a useful indicator for oxygen therapy.
Study results also showed that the sensitivity and specificity of indrawing are widely variable in all age groups reported (sensitivity: min 32, max 98; specificity: min 7, max 94) (Table 5). For this reason, the use of this sign as the only indicator for oxygen therapy, as the WHO recommends, could lead clinicians to an inappropriate use of this limited resource.
The presence of nasal flaring was the only sign reported that showed consistent characteristics as an indicator for the presence of hypoxaemia in all included studies (Table 4). It was studied in populations of children aged between seven days and five years and was shown to have overall good sensitivity (min 48, max 98) and specificity (min 54, max 98), except in one study conducted in infants from 2 months to 36 months where its specificity was 17.
3. Factors influencing the duration of oxygen therapy with each delivery method
None of the included studies reported on the factors influencing duration of oxygen therapy with each delivery method.
4. Clinical criteria for ending oxygen therapy
None of the included studies reported on clinical criteria for ending oxygen therapy.
5. Clinical criteria for continuing oxygen therapy after discharge
None of the included studies reported on continuing oxygen therapy after discharge.
6. Costs associated with each method
None of the included studies reported on costs associated with each method.
Discussion
Summary of main results
Effectiveness of oxygen therapy in the treatment of severe lower respiratory tract infections (LRTIs) in children
One study assessed the effectiveness of oxygen therapy in the treatment of severe LRTI in children by studying children with signs and symptoms of severe disease but who were normoxaemic at time of admission (Singhi 2012). There was no difference in the risk of developing subsequent hypoxaemia between the treatment groups. This study also showed that lower chest indrawing, tachypnoea and fever were similar in both groups. The subgroup analysis showed that children who developed hypoxaemia had significantly longer tachypnoea and a longer presence of lower chest indrawing. These findings were similar among children in both interventions groups
Effectiveness of the non‐invasive delivery methods in the treatment of severe acute LRTIs in children
Three of the included studies assessed the effectiveness of nasal prongs in comparison with nasopharyngeal catheter by recording the failure to achieve adequate SpO2 in the hours following oxygen administration (Kumar 1997; Muhe 1997; Weber 1995). There was no difference in the risk of treatment failure between the groups. There was also no difference in the frequency of oxygen desaturation episodes between the groups when comparing nasal prongs versus nasal catheter (a shorter version of nasopharyngeal catheter) (Muhe 1998). Regarding the side effects associated with each method, the only adverse effect that showed a significant difference between the groups was nasal obstruction due to severe mucus production, which was more frequent in the nasopharyngeal catheter group. Pneumocephalus was the only severe adverse event associated with the nasopharyngeal catheter that was reported. With respect to the mean flow rates required to achieve adequate SaO2, the results were similar in both groups (nasopharyngeal catheter/nasal catheter and nasal prongs) and we found no significant differences.
Findings from the Kumar 1997 study showed that the high flow rates used in head boxes and face masks are much more effective in achieving adequate oxygen saturation than the low flow rates used in nasopharyngeal catheters. However, the differences in the amount of oxygen required by these methods are significant (4 L/min versus 1 L/min respectively) and this could increase the treatment cost per day. Oxygen supply in many hospital settings in low‐income countries is limited and the use of high‐flow systems could increase this problem.
Indications for oxygen therapy in children with LRTIs
Several studies have been carried out to try to identify clinical predictors of hypoxaemia in children with LRTI. This research interest responds to the need of physicians and health workers from low‐income and middle‐income countries, where health resources and supplies are limited, to determine the presence of hypoxaemia in infants and children without using an oximeter or arterial blood gases. However, all these efforts have shown that there is no single sign or symptom that clearly indicates the presence of hypoxaemia. This review confirms the previous findings of 12 authors who used similar clinical sign and hypoxaemia measurement methods (all used an oximeter) in showing the wide variability in the sensitivity and specificity of each sign or symptom. This wide variability could be due to differences in the definitions of hypoxaemia used among studies conducted at similar altitudes; for example Onyango 1993, conducted at 1670 MASL, defined hypoxaemia as SpO2 < 91%; Dyke 1995, conducted at a similar altitude (1600 MASL), defined hypoxaemia as SaO2 < 86%; and Duke 2002, conducted at the same altitude as Dyke 1995, defined hypoxaemia as SaO2 < 88%. Another important issue that can explain this variability is the implication of setting a cut‐off value for respiratory rates that indicates tachypnoea at any particular level according to children's age. As Smyth 1998 and Lozano 1994 showed, the sensitivity and specificity of this sign would change depending on the cut‐off point established for respiratory rate. This means that the use of 'tachypnoea' as an indicator for oxygen therapy would result in a proportion of children being treated with oxygen unnecessarily, and another proportion who would not receive oxygen when they actually need it.
Even with these sources of variability, some authors have made different efforts to improve the predictive value of hypoxaemia in children with LRTI by deriving clinical predictor rules or prediction models based on the combination of clinical signs and symptoms present at the time of admission. These models are not comparable across studies and their reliability in predicting hypoxaemia is still unclear.
The WHO 1993 guidelines for oxygen therapy in children with acute respiratory infections recommend oxygen therapy for infants and children presenting with cyanosis or an inability to drink, as priority cases. According to the evidence presented in this review, cyanosis is indeed one of the more specific signs in determining the presence of hypoxaemia but inability to feed/drink has been shown to be very unspecific and not sensitive amongst the studies that evaluated it. WHO 1993 also recommends giving oxygen to children presenting with severe chest indrawing, or with a respiratory rate greater than or equal to 70 breaths/minute, or to young infants who grunt when breathing. In this review, these three signs, when considered individually, have all shown to be very unspecific in determining the presence of hypoxaemia. Sensitivity and specificity of chest indrawing is widely variable in all age groups reported (sensitivity: min 32, max 98; specificity: min 7, max 94); respiratory rate, as stated above, is not a useful predictor of hypoxaemia since there are no accurate cut‐off points established by age groups; and grunting is specific but not sensitive in determining the presence of hypoxaemia.
Some of the included studies assessed the precision of regression models that included all criteria recommended by WHO 1993 (inability to feed, cyanosis, respiratory rates > 70 breaths/minute or severe chest indrawing) in predicting hypoxaemia (Duke 2002; Gutierrez 2001; Smyth 1998; Usen 1999; Weber 1997). In general, this model showed high sensitivity among studies (62%, 76%, 80.9% and 27% respectively) in determining the presence of hypoxaemia, but low specificity (this finding was expected since the addition of signs improves sensitivity and decreases specificity). Given this, following the algorithm recommended by WHO 1993 will result in giving oxygen to patients who do not have hypoxaemia. Duke 2002, for example, found that by using this highly sensitive model, almost 50% of children studied would be given oxygen without requiring it. According to these results, using the WHO criteria for giving oxygen can lead to an inappropriate use of medical oxygen, which is a very limited resource in most health facilities in low‐income countries. By following these criteria we are also increasing the medical treatment costs of acute respiratory infections in infants and children.
Overall completeness and applicability of evidence
It is important to highlight the lack of randomised controlled trials (RCTs) or well‐designed cohort studies assessing the effects of oxygen therapy versus no oxygen therapy in children with LRTI. Evidence on the effect of the oxygen therapy comes from a small pilot study (58 children enrolled) that suggests there are no advantages of early oxygen supplementation in children with pneumonia for preventing more severe disease or subsequent hypoxaemia. The lack of precision in these estimates means that the applicability of this evidence is not reasonable.
The evidence regarding effectiveness and safety of oxygen delivery methods suggests that nasal prongs may be more effective than nasopharyngeal and nasal catheters for oxygen delivery in paediatric patients with LRTIs, as nasal prongs cause fewer side effects and have not been associated with any severe adverse events. However, the results obtained for the risk of treatment failure and risk of adverse events are imprecise and do not allow us to confirm that nasal prongs are a more effective and safer method of oxygen delivery, as other authors have previously stated (Muhe 1997; Weber 1995). Therefore, there is not enough evidence to define which of the non‐invasive delivery methods is the best one to be used in the treatment of hypoxaemia in children with LRTI.
Since resources differ by setting, efficacy, patient tolerability, patient safety, cost and availability, all have to be considered when choosing the best non‐invasive oxygen delivery method in the treatment of children with hypoxaemic LRTI. To help health workers make the correct decision, studies aimed at identifying the safest and most effective non‐invasive oxygen delivery method are required. Further research must consider the efficacy, tolerability, safety and costs of the methods studied.
Regarding the prediction of hypoxaemia in children with LRTI, this review has shown that there is still no clinical sign, model or scoring system that accurately identifies hypoxaemic children. The measurement of SaO2 is still a particularly important test for physicians to make the correct decision regarding whether or not to give oxygen supplementation to infants and children with LRTI. As many authors have stated, to improve the rational use of medical oxygen, it is necessary to invest resources in supplying clinical settings and all health facilities in low‐income countries with oxygen saturation monitors. Having an oxygen saturation monitor in emergency rooms could contribute not only to the rational use of medical oxygen but also avoid the risk of secondary effects associated with the use of oxygen in infants and young children. In the long term, this investment could result in more cost‐effective alternatives by minimising the 'waste' of oxygen.
Quality of the evidence
The quality of the evidence from the pilot study is low due to lack of precision of the estimates. It could be a consequence of the small sample size included in the study and the small number of events presented in the studied participants. Therefore, our confidence in the effects on the main outcomes is very uncertain and it is very likely that new research findings will change the direction of effects. A similar situation was seen for the evidence on the effectiveness of the oxygen delivery methods more commonly used as part of the treatment of LRTIs. We found evidence from more than one trial for the use of nasal prongs in comparison with nasopharyngeal catheter. However, for all other comparisons (nasal prongs versus nasal catheter, mask versus nasopharyngeal catheter and head box versus nasopharyngeal catheter) we only identified one study. The evidence for these comparisons is also therefore very uncertain.
We performed a complete 'Risk of bias' assessment for all included RCTs. The methods used for randomisation and outcome assessment in some of the studies were not clearly described and explanations were missing, therefore presenting a source of potential bias. The quality of the evidence, assessed following the GRADE framework, resulted in low to very low quality for the main outcomes (treatment failure and adverse events).
Potential biases in the review process
It is unlikely that we have missed any relevant studies. We conducted a comprehensive search and contacted experts in the clinical field to identify unpublished studies. The selection process and independent data extraction performed by the review authors assessing the evidence minimised errors and bias in data extraction.
The major limitation of this review is the lack of information from RCTs or well‐designed cohort studies evaluating the effectiveness of oxygen therapy and oxygen delivery methods.
Agreements and disagreements with other studies or reviews
There are no RCTs reporting on non‐invasive delivery methods other than those included in this review. The comparison between oxygen supplementation versus non oxygen (room air) as well as the comparison of nasal prongs and nasopharyngeal catheter showed imprecise results for the outcome 'treatment failure', as a consequence of lack of power of the included studies, which showed a trend towards no difference between treatment groups.
Regarding safety outcomes, our results showed a trend towards an increased risk of nose ulceration with the nasopharyngeal catheter, a finding that is in consonance with the Muhe 1997 study results. For all other safety outcomes, the results were imprecise.

Forest plot of comparison: 1 Supplemental oxygen versus room air, outcome: 1.1 Incidence of subsequent hypoxaemia.

Forest plot of comparison: 1 Supplemental oxygen versus room air, outcome: 1.2 Duration of tachypnoea.

Forest plot of comparison: 1 Supplemental oxygen versus room air, outcome: 1.3 Duration of chest indrawing.

Forest plot of comparison: 2 Nasal prongs versus nasopharyngeal catheter, outcome: 2.1 Treatment failure to achieve adequate oxygenation.

Forest plot of comparison: 2 Nasal prongs versus nasopharyngeal catheter, outcome: 2.4 Nose ulceration or bleeding.

Forest plot of comparison: 2 Nasal prongs versus nasopharyngeal catheter, outcome: 2.6 Death during treatment.

Comparison 1 Supplemental oxygen versus room air, Outcome 1 Incidence of subsequent hypoxaemia.

Comparison 1 Supplemental oxygen versus room air, Outcome 2 Duration of tachypnoea.

Comparison 1 Supplemental oxygen versus room air, Outcome 3 Duration of chest indrawing.

Comparison 2 Nasal prongs versus nasopharyngeal catheter, Outcome 1 Treatment failure to achieve adequate oxygenation.
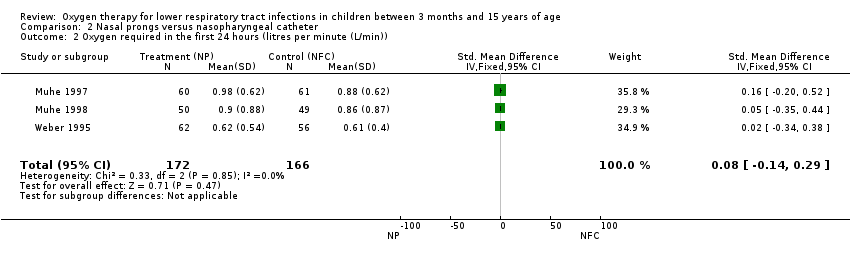
Comparison 2 Nasal prongs versus nasopharyngeal catheter, Outcome 2 Oxygen required in the first 24 hours (litres per minute (L/min)).

Comparison 2 Nasal prongs versus nasopharyngeal catheter, Outcome 3 Nasal obstruction/severe mucus production.

Comparison 2 Nasal prongs versus nasopharyngeal catheter, Outcome 4 Nose ulceration or bleeding.

Comparison 2 Nasal prongs versus nasopharyngeal catheter, Outcome 5 Fighting/discomfort in the first 24 hours.

Comparison 2 Nasal prongs versus nasopharyngeal catheter, Outcome 6 Death during treatment.
| Nasal prongs versus nasopharyngeal catheter for lower respiratory tract infections | ||||||
| Patient or population: children with acute lower respiratory tract infections | ||||||
| Outcomes | Illustrative comparative risks* (95% CI) | Relative effect | No. of participants | Quality of the evidence | Comments | |
| Assumed risk | Corresponding risk | |||||
| Nasopharyngeal catheter | Nasal prongs | |||||
| Treatment failure | Study population | RR 0.97 | 399 | ⊕⊝⊝⊝ | ||
| 91 per 1000 | 89 per 1000 | |||||
| Moderate | ||||||
| 107 per 1000 | 104 per 1000 | |||||
| Oxygen required in the first 24 hours | The mean oxygen required in the first 24 hours in the intervention groups was | 338 | ⊕⊕⊝⊝ | SMD 0.08 (‐0.14 to 0.29) | ||
| Nasal obstruction/severe mucus production | Study population | RR 0.2 | 338 | ⊕⊕⊝⊝ | ||
| 199 per 1000 | 40 per 1000 | |||||
| Moderate | ||||||
| 213 per 1000 | 43 per 1000 | |||||
| Nose ulceration or bleeding | Study population | RR 0.43 | 338 | ⊕⊕⊝⊝ | ||
| 96 per 1000 | 41 per 1000 | |||||
| Moderate | ||||||
| 61 per 1000 | 26 per 1000 | |||||
| Fighting/discomfort in the first 24 hours | Study population | RR 0.77 | 239 | ⊕⊕⊝⊝ | ||
| 205 per 1000 | 158 per 1000 | |||||
| Moderate | ||||||
| 210 per 1000 | 162 per 1000 | |||||
| Death during treatment | Study population | RR 0.64 | 338 | ⊕⊕⊝⊝ | ||
| 145 per 1000 | 93 per 1000 | |||||
| Moderate | ||||||
| 122 per 1000 | 78 per 1000 | |||||
| *The basis for the assumed risk (e.g. the median control group risk across studies) is provided in footnotes. The corresponding risk (and its 95% confidence interval) is based on the assumed risk in the comparison group and the relative effect of the intervention (and its 95% CI). | ||||||
| GRADE Working Group grades of evidence | ||||||
| 1One trial used quasi‐randomised methods for assignment of interventions. Evaluation of the main outcome was not blinded in all studies. | ||||||
| Face mask compared to nasopharyngeal catheter for severe acute LRTIs in children | ||||||
| Patient or population: children with severe acute LRTIs | ||||||
| Outcomes | Illustrative comparative risks* (95% CI) | Relative effect | No. of participants | Quality of the evidence | Comments | |
| Assumed risk | Corresponding risk | |||||
| Nasopharyngeal catheter | Face mask | |||||
| Treatment failure | Moderate | OR 0.20 | 80 | ⊕⊕⊝⊝ | ||
| 107 per 1000 | 23 per 1000 | |||||
| *The basis for the assumed risk (e.g. the median control group risk across studies) is provided in footnotes. The corresponding risk (and its 95% confidence interval) is based on the assumed risk in the comparison group and the relative effect of the intervention (and its 95% CI). | ||||||
| GRADE Working Group grades of evidence | ||||||
| 1Non‐randomised. Used sequential assignment methods. | ||||||
| Head box compared to nasopharyngeal catheter for severe acute LRTIs in children | ||||||
| Patient or population: children with severe acute LRTIs | ||||||
| Outcomes | Illustrative comparative risks* (95% CI) | Relative effect | No. of participants | Quality of the evidence | Comments | |
| Assumed risk | Corresponding risk | |||||
| Nasopharyngeal catheter | Head box | |||||
| Treatment failure | Moderate | OR 0.40 | 80 | ⊕⊝⊝⊝ | ||
| 107 per 1000 | 46 per 1000 | |||||
| *The basis for the assumed risk (e.g. the median control group risk across studies) is provided in footnotes. The corresponding risk (and its 95% confidence interval) is based on the assumed risk in the comparison group and the relative effect of the intervention (and its 95% CI). | ||||||
| GRADE Working Group grades of evidence | ||||||
| 1Non‐randomised. Used sequential assignment methods. | ||||||
| Study | Adverse event | Oxygen delivery method |
| Pneumocephalus in an 8‐month old girl with severe staphylococcal pneumonia | Nasopharyngeal catheter | |
| Pneumocephalus and right side severe exophthalmos in a 11‐month old boy with bacterial pneumonia and sinusitis | Nasopharyngeal catheter |
| Study | Altitude | Hypoxaemia | Age | Sensitivity | Specificity | LR+ |
| 3750 MASL | SpO2 < 82% | 2 to 11 months | 13 | 99 | 13 | |
| 3750 MASL | SpO2 < 85% | > 11 months | 13 | 99 | 13 | |
| 1670 MASL | SpO2 < 91% | 3 to 11 months | 9 | 96 | 2.3 | |
| 1600 MASL | SpO2 < 86% | 1 month to 5 years | 42 | 84 | 2.6 | |
| Sea level | SpO2 < 90% | 2 months to 5 years | 39 | 100 | ||
| Sea level | SpO2 < 90% | 2 to 36 months | 25 | 95 | 5.0 | |
| 1600 MASL | SpO2 < 88% | 1 month to 5 years | 38 | 98 | 19.9 | |
| 239 MASL | SpO2 < 90% | < 5 years | 14 | 96 | 3.7 | |
| 35 MASL | SpO2 < 93% | 1 month to 5 years | 74 | 93 | 10.5 | |
| 35 MASL | SpO2 < 90% | 1 month to 5 years | 70 | 75 | 2.8 | |
| 1336 MASL | SpO2 < 90% | 2 month to 5 years | 5 | 100 | ||
| Sea level | SpO2 < 90% | 2 months to 5 years | 20 | 100 | 66.9 | |
| MASL: metres above sea level LR: likelihood ratio | ||||||
| Study | Altitude | Hypoxaemia | Age | Sensitivity | Specificity | LR+ |
| 1670 MASL | SpO2 < 91% | 3 to 11 months | 64 | 73 | 2.4 | |
| 1670 MASL | SpO2 < 91% | 12 to 36 months | 56 | 76 | 2.3 | |
| 2640 MASL | SpO2 < 88% | 7 days to 36 months | 45 | 72 | 1.6 | |
| 1600 MASL | SpO2 < 86% | 3 months to 5 years | 42 | 89 | 3.8 | |
| Sea level | SpO2 < 90% | 2 months to 5 years | 48 | 61 | 1.2 | |
| Sea level | SpO2 < 90% | 2 to 36 months | 46 | 86 | 3.3 | |
| 1600 MASL | SpO2 < 88% | 1 month to 5 years | 22 | 87 | 1.6 | |
| 239 MASL | SpO2 < 90% | < 5 years | 14 | 93 | 1.9 | |
| 35 MASL | SpO2 < 93% | 1 month to 5 years | 82 | 72 | 3.0 | |
| 35 MASL | SpO2 < 90% | 1 month to 5 years | 90 | 61 | 2.3 | |
| 1336 MASL | SpO2 < 90% | 2 months to 5 years | 36 | 99 | 32.9 | |
| Sea level | SpO2 < 90% | 2 months to 5 years | 60 | 77 | 2.66 | |
| MASL: metres above sea level LR: likelihood ratio | ||||||
| Study | Altitude | Hypoxaemia | Age | Sensitivity | Specificity | LR+ |
| 2640 MASL | SpO2 < 88% | 7 days to 36 months | 63 | 65 | 1.8 | |
| 1600 MASL | SpO2 < 86% | 3 months to 5 years | 56 | 84 | 3.5 | |
| Sea level | SpO2 < 90% | 2 months to 5 years | 71 | 54 | 1.5 | |
| Sea level | SpO2 < 90% | 2 to 36 months | 98 | 17 | 1.2 | |
| 35 MASL | SpO2 < 93% | 1 month to 5 years | 71 | 58 | 1.7 | |
| 1336 MASL | SpO2 < 90% | 2 months to 5 years | 48 | 98 | 22.0 | |
| MASL: metres above sea level LR: likelihood ratio | ||||||
| Study | Altitude | Hypoxaemia | Type of indrawing | Age | Sensitivity | Specificity | LR+ |
| 3750 MASL | SpO2 < 82% | Any chest retractions | 2 to 11 months | 35 | 94 | 5.8 | |
| 3750 MASL | SpO2 < 85% | Any chest retractions | > 11 months | 35 | 94 | ||
| 1670 MASL | SpO2 < 91% | Any retractions | 3 to 11 months | 97 | 29 | 1.4 | |
| 1670 MASL | SpO2 < 91% | Any retractions | > 11 months | 88 | 30 | 1.3 | |
| 2640 MASL | SpO2 < 88% | Intercostal | 7 days to 36 months | 79 | 55 | 1.8 | |
| 2640 MASL | SpO2 < 88% | Subcostal | 7 days to 36 months | 76 | 43 | 1.3 | |
| 2640 MASL | SpO2 < 88% | Any chest retractions | 7 days to 36 months | 83 | 40 | 1.4 | |
| 1600 MASL | SpO2 < 86% | Indrawing | 1 week to 5 years | 98 | 7 | 1.1 | |
| Sea level | SpO2 < 90% | Intercostal indrawing | 2 months to 5 years | 65 | 69 | 2.1 | |
| Sea level | SpO2 < 90% | Lower chest indrawing | 2 months to 5 years | 74 | 37 | 1.2 | |
| 43 MASL | SpO2 < 95% | Any chest retractions | 1 month to 5 years | 59 | 63 | 1.6 | |
| 239 MASL | SpO2 < 90% | Intercostal indrawing | < 5 years | 32 | 88 | 2.6 | |
| 239 MASL | SpO2 < 90% | Lower chest indrawing | < 5 years | 36 | 86 | 2.6 | |
| 1336 MASL | SpO2 < 90% | Chest indrawing | 2 months to 5 years | 69 | 83 | 4.0 | |
| MASL: metres above sea level LR: likelihood ratio | |||||||
| Study | Altitude | Hypoxaemia | Definition | Age | Sensitivity | Specificity | LR+ | LR‐ |
| 1670 MASL | SpO2 < 91% | Unresponsive | 3 to 11 months | 63 | 67 | 1.9 | 0.6 | |
| 1670 MASL | SpO2 < 91% | Unresponsive | > 11 months | 56 | 78 | 2.5 | 0.6 | |
| 2640 MASL | SpO2 < 88% | Difficult to awake/abnormal sleepiness | 7 days to 36 months | 12 | 89 | 1.1 | 1.0 | |
| 1600 MASL | SpO2 < 86% | Decrease of consciousness/restlessness | 3 months to 5 years | 36 | 91 | 4.0 | 0.7 | |
| Sea level | SpO2 < 91% | Arousal | 2 months to 5 years | 70 | 78 | 3.2 | 0.4 | |
| Sea level | SpO2 < 91% | Irritability | 2 months to 5 years | 41 | 43 | 0.7 | 1.4 | |
| Sea level | SpO2 < 91% | Difficult to awake/abnormal sleepiness | 2 months to 5 years | 42 | 78 | 1.9 | 0.7 | |
| Sea level | SpO2 < 90% | No spontaneous movement | 2 to 36 months | 46 | 84 | 2.9 | 0.6 | |
| 1600 MASL | SpO2 < 88% | Reduced activity | 1 month to 5 years | 44 | 69 | 1.4 | 0.8 | |
| 35 MASL | SpO2 < 93% | Drowsy | 1 month to 5 years | 85 | 83 | 7.3 | 0.4 | |
| 35 MASL | SpO2 < 90% | Drowsy | 1 month to 5 years | 68 | 91 | 5.0 | 0.2 | |
| 1336 MASL | SpO2 < 90% | Lethargy | 2 months to 5 years | 40 | 100 | 0.6 | ||
| MASL: metres above sea level LR: likelihood ratio | ||||||||
| Study | Altitude | Hypoxaemia | Age | Sensitivity | Specificity | LR+ |
| 1670 MASL | SpO2 < 91% | 3 to 11 months | 50 | 75 | 2.0 | |
| 1670 MASL | SpO2 < 91% | > 12 months | 40 | 71 | 1.4 | |
| 2640 MASL | SpO2 < 88% | 7 days to 36 months | 35 | 60 | 0.9 | |
| Sea level | SpO2 < 90% | 2 months to 5 years | 71 | 67 | 2.2 | |
| Sea level | SpO2 < 90% | 2 to 36 months | 33 | 91 | 3.7 | |
| 1600 MASL | SpO2 < 88% | 1 month to 5 years | 42 | 76 | 1.8 | |
| 1336 MASL | SpO2 < 90% | 2 months to 5 years | 28 | 99 | 28 | |
| Sea level | SpO2 < 90% | 2 months to 5 years | 9 | 94 | 1.39 | |
| MASL: metres above sea level LR: likelihood ratio | ||||||
| Study | Altitude | Hypoxaemia | Tachypnoea | Age | Sensitivity | Specificity | LR+ |
| 1670 MASL | SpO2 < 91% | > 60 r/min | 3 to 11 months | 86 | 56 | 2.0 | |
| 1670 MASL | SpO2 < 91% | > 70 r/min | 3 to 11 months | 51 | 83 | 3.0 | |
| 2640 MASL | SpO2 < 88% | > 50 r/min | 0 to 11 months | 76 | 71 | 2.6 | |
| 2640 MASL | SpO2 < 88% | > 60 r/min | 0 to 11 months | 40 | 86 | 2.9 | |
| 2640 MASL | SpO2 < 88% | > 70 r/min | 0 to 11 months | 16 | 100 | ||
| 43 MASL | SpO2 < 95% | > 50 r/min | 2 to 11 months | 64 | 56 | 1.5 | |
| 239 MASL | SpO2 < 90% | > 50 r/min | 4 to 12 months | 89 | 24 | 1.2 | |
| 239 MASL | SpO2 < 90% | > 60 r/min | 4 to 12 months | 82 | 52 | 1.7 | |
| 239 MASL | SpO2 < 90% | > 70 r/min | 4 to 12 months | 54 | 78 | 2.5 | |
| 1336 MASL | SpO2 < 90% | > 50 r/min | 2 to 12 months | 90 | 44 | 1.6 | |
| MASL: metres above sea level LR: likelihood ratio | |||||||
| Study | Altitude | Hypoxaemia | Tachypnoea | Age | Sensitivity | Specificity | LR+ |
| 1670 MASL | SpO2 < 91% | > 60 r/min | 12 to 36 months | 65 | 76 | 2.7 | |
| 1670 MASL | SpO2 < 91% | > 70 r/min | 12 to 36 months | 32 | 90 | 3.2 | |
| 2640 MASL | SpO2 < 88% | > 50 r/min | 12 to 36 months | 39 | 71 | 1.3 | |
| 2640 MASL | SpO2 < 88% | > 60 r/min | 12 to 36 months | 12 | 100 | ||
| 2640 MASL | SpO2 < 88% | > 70 r/min | 12 to 36 months | 4 | 100 | ||
| 43 MASL | SpO2 < 95% | > 40 r/min | 12 months to 5 years | 64 | 56 | 1.4 | |
| 239 MASL | SpO2 < 90% | > 40 r/min | 12 months to 5 years | 89 | 24 | 1.2 | |
| 239 MASL | SpO2 < 90% | > 50 r/min | 12 months to 5 years | 82 | 52 | 1.7 | |
| 239 MASL | SpO2 < 90% | > 60 r/min | 12 months to 5 years | 54 | 78 | 2.5 | |
| 1336 MASL | SpO2 < 90% | > 40 r/min | 13 months to 5 years | 100 | 43 | 1.8 | |
| MASL: metres above sea level LR: likelihood ratio | |||||||
| Study | Altitude | Hypoxaemia | Age | Sensitivity | Specificity | LR+ | LR‐ |
| 3750 MASL | SpO2 < 82% | 2 to 11 months | 50 | 92 | 6.3 | 0.5 | |
| 1670 MASL | SpO2 < 91% | 3 to 11 months | 77 | 40 | 1.3 | 0.6 | |
| 1670 MASL | SpO2 < 91% | 12 to 36 months | 91 | 36 | 1.4 | 0.3 | |
| 2640 MASL | SpO2 < 88% | 7 days to 36 moths | 79 | 53 | 1.7 | 0.4 | |
| 1600 MASL | SpO2 < 86% | 3 months to 5 years | 90 | 16 | 1.1 | 0.6 | |
| Sea level | SpO2 < 90% | 2 months to 5 years | 93 | 12 | 1.1 | 0.6 | |
| Sea level | SpO2 < 90% | 2 to 36 months | 86 | 30 | 1.2 | 0.5 | |
| 239 MASL | SpO2 < 90% | < 5 years | 68 | 68 | 2.1 | 0.5 | |
| 1336 MASL | SpO2 < 90% | 2 months to 5 years | 93 | 22 | 1.2 | 0.3 | |
| MASL: metres above sea level LR: likelihood ratio | |||||||
| Outcome or subgroup title | No. of studies | No. of participants | Statistical method | Effect size |
| 1 Incidence of subsequent hypoxaemia Show forest plot | 1 | Risk Ratio (M‐H, Fixed, 95% CI) | Subtotals only | |
| 2 Duration of tachypnoea Show forest plot | 1 | 58 | Mean Difference (IV, Fixed, 95% CI) | 4.49 [‐16.30, 25.28] |
| 2.1 Normoxaemic children | 1 | 27 | Mean Difference (IV, Fixed, 95% CI) | 6.00 [‐18.02, 30.02] |
| 2.2 Hypoxaemic children | 1 | 31 | Mean Difference (IV, Fixed, 95% CI) | 0.0 [‐41.48, 41.48] |
| 3 Duration of chest indrawing Show forest plot | 1 | 58 | Mean Difference (IV, Fixed, 95% CI) | 6.64 [‐10.77, 24.06] |
| 3.1 Normoxaemic children | 1 | 27 | Mean Difference (IV, Fixed, 95% CI) | 6.0 [‐13.65, 25.65] |
| 3.2 Hypoxaemic children | 1 | 31 | Mean Difference (IV, Fixed, 95% CI) | 9.0 [‐28.58, 46.58] |
| Outcome or subgroup title | No. of studies | No. of participants | Statistical method | Effect size |
| 1 Treatment failure to achieve adequate oxygenation Show forest plot | 3 | Risk Ratio (M‐H, Fixed, 95% CI) | Subtotals only | |
| 1.1 Randomised clinical trials | 2 | 239 | Risk Ratio (M‐H, Fixed, 95% CI) | 0.93 [0.36, 2.38] |
| 1.2 Non‐randomised studies | 1 | 160 | Risk Ratio (M‐H, Fixed, 95% CI) | 1.0 [0.44, 2.27] |
| 2 Oxygen required in the first 24 hours (litres per minute (L/min)) Show forest plot | 3 | 338 | Std. Mean Difference (IV, Fixed, 95% CI) | 0.08 [‐0.14, 0.29] |
| 3 Nasal obstruction/severe mucus production Show forest plot | 3 | 338 | Risk Ratio (M‐H, Fixed, 95% CI) | 0.20 [0.09, 0.44] |
| 4 Nose ulceration or bleeding Show forest plot | 3 | 338 | Risk Ratio (M‐H, Fixed, 95% CI) | 0.43 [0.18, 1.02] |
| 5 Fighting/discomfort in the first 24 hours Show forest plot | 2 | 239 | Risk Ratio (M‐H, Fixed, 95% CI) | 0.77 [0.46, 1.28] |
| 6 Death during treatment Show forest plot | 3 | 338 | Risk Ratio (M‐H, Fixed, 95% CI) | 0.64 [0.35, 1.15] |