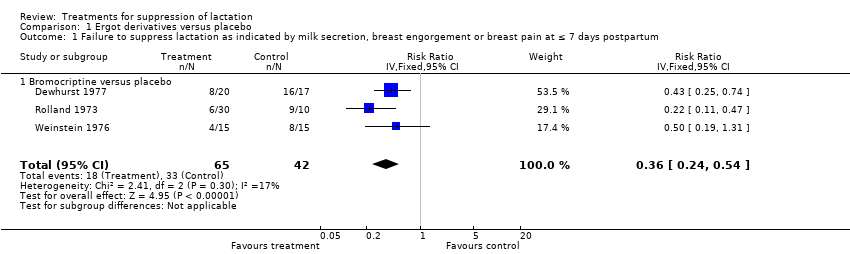
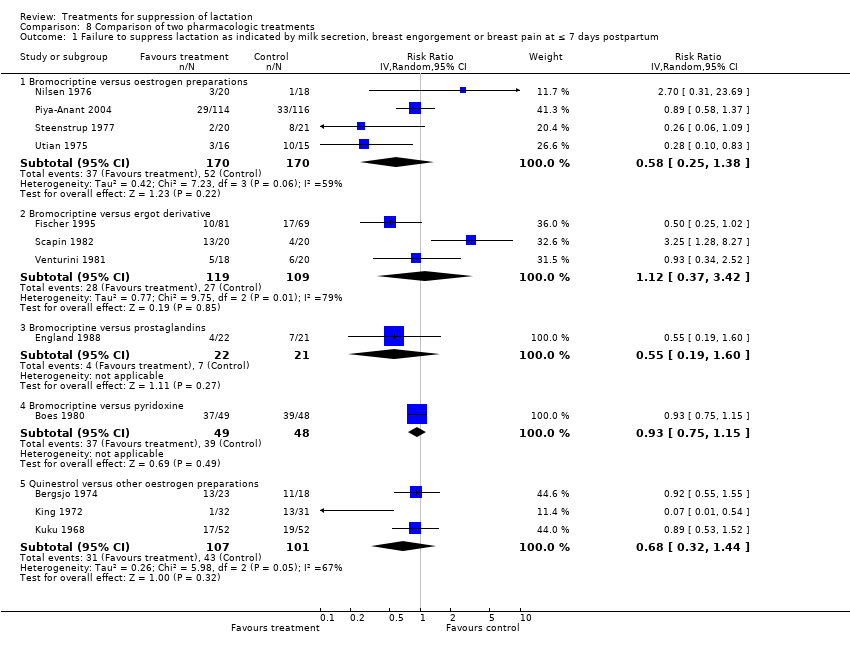
| 1 Failure to suppress lactation as indicated by milk secretion, breast engorgement or breast pain at ≤ 7 days postpartum Show forest plot | 12 | | Risk Ratio (IV, Random, 95% CI) | Subtotals only |
|
| 1.1 Bromocriptine versus oestrogen preparations | 4 | 340 | Risk Ratio (IV, Random, 95% CI) | 0.58 [0.25, 1.38] |
| 1.2 Bromocriptine versus ergot derivative | 3 | 228 | Risk Ratio (IV, Random, 95% CI) | 1.12 [0.37, 3.42] |
| 1.3 Bromocriptine versus prostaglandins | 1 | 43 | Risk Ratio (IV, Random, 95% CI) | 0.55 [0.19, 1.60] |
| 1.4 Bromocriptine versus pyridoxine | 1 | 97 | Risk Ratio (IV, Random, 95% CI) | 0.93 [0.75, 1.15] |
| 1.5 Quinestrol versus other oestrogen preparations | 3 | 208 | Risk Ratio (IV, Random, 95% CI) | 0.68 [0.32, 1.44] |
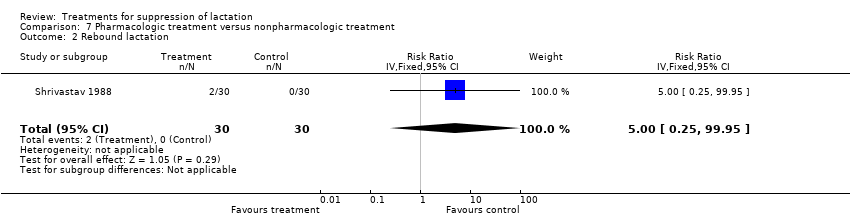
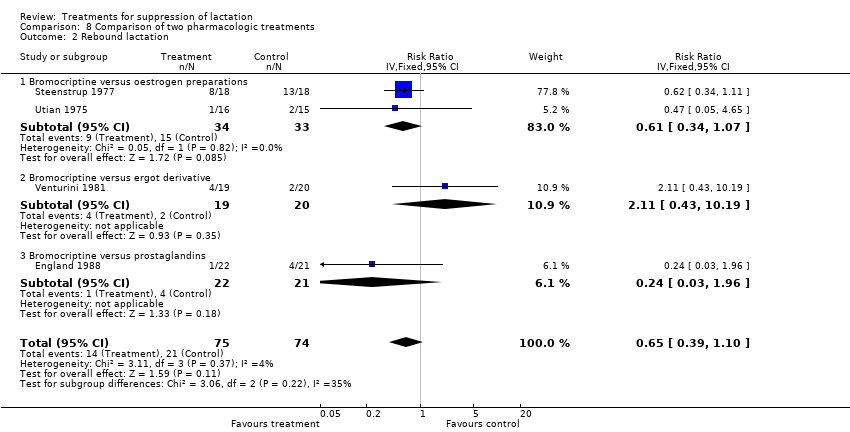
| 2 Rebound lactation Show forest plot | 4 | 149 | Risk Ratio (IV, Fixed, 95% CI) | 0.65 [0.39, 1.10] |
|
| 2.1 Bromocriptine versus oestrogen preparations | 2 | 67 | Risk Ratio (IV, Fixed, 95% CI) | 0.61 [0.34, 1.07] |
| 2.2 Bromocriptine versus ergot derivative | 1 | 39 | Risk Ratio (IV, Fixed, 95% CI) | 2.11 [0.43, 10.19] |
| 2.3 Bromocriptine versus prostaglandins | 1 | 43 | Risk Ratio (IV, Fixed, 95% CI) | 0.24 [0.03, 1.96] |
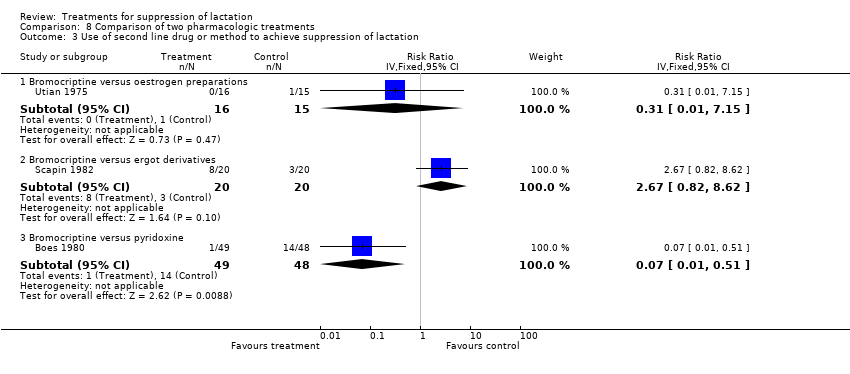
| 3 Use of second line drug or method to achieve suppression of lactation Show forest plot | 3 | | Risk Ratio (IV, Fixed, 95% CI) | Subtotals only |
|
| 3.1 Bromocriptine versus oestrogen preparations | 1 | 31 | Risk Ratio (IV, Fixed, 95% CI) | 0.31 [0.01, 7.15] |
| 3.2 Bromocriptine versus ergot derivatives | 1 | 40 | Risk Ratio (IV, Fixed, 95% CI) | 2.67 [0.82, 8.62] |
| 3.3 Bromocriptine versus pyridoxine | 1 | 97 | Risk Ratio (IV, Fixed, 95% CI) | 0.07 [0.01, 0.51] |
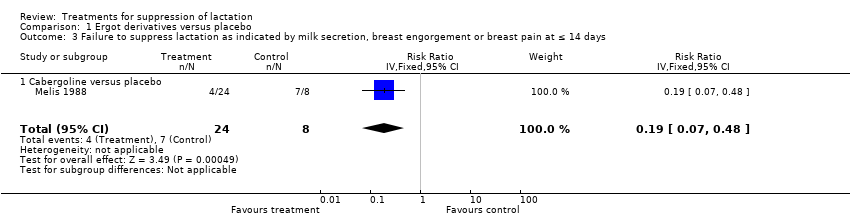
| 4 Failure to suppress lactation as indicated by milk secretion, breast engorgement or breast pain at ≤14 days Show forest plot | 6 | | Risk Ratio (IV, Random, 95% CI) | Subtotals only |
|
| 4.1 Bromocriptine versus carbegoline | 2 | 308 | Risk Ratio (IV, Random, 95% CI) | 1.38 [0.93, 2.05] |
| 4.2 Bromocriptine versus diethylstilbestrol | 1 | 38 | Risk Ratio (IV, Random, 95% CI) | 0.30 [0.07, 1.30] |
| 4.3 Bromocriptine versus cyclofenil | 1 | 24 | Risk Ratio (IV, Random, 95% CI) | 3.5 [0.16, 78.19] |
| 4.4 Bromocriptine versus chlorotrianisene | 1 | 39 | Risk Ratio (IV, Random, 95% CI) | 0.35 [0.19, 0.66] |
| 4.5 Quinestrol versus other oestrogen preparations | 1 | 99 | Risk Ratio (IV, Random, 95% CI) | 2.84 [1.56, 5.18] |