Pelvic floor muscle training versus no treatment, or inactive control treatments, for urinary incontinence in women
Información
- DOI:
- https://doi.org/10.1002/14651858.CD005654.pub3Copiar DOI

- Base de datos:
-
- Cochrane Database of Systematic Reviews
- Versión publicada:
-
- 14 mayo 2014see what's new
- Tipo:
-
- Intervention
- Etapa:
-
- Review
- Grupo Editorial Cochrane:
-
Grupo Cochrane de Incontinencia
- Copyright:
-
- Copyright © 2014 The Cochrane Collaboration. Published by John Wiley & Sons, Ltd.
Cifras del artículo
Altmetric:
Citado por:
Autores
Contributions of authors
All three review authors were involved in all stages of the review. Chantale Dumoulin wrote the first draft of the review update.
Sources of support
Internal sources
-
University of Montreal, Canada.
External sources
-
National Institute for Health Research (NIHR), UK.
The National Institute for Health Research (NIHR) is the largest single funder of the Cochrane Incontinence Group.
-
Chantale Dumoulin was funded by the International Continence Society Research Fellowship, UK.
-
Gabrielle Mac Habée‐Séguin was funded by the University of Montreal COPSE grant, Other.
Declarations of interest
Two of the three authors (CD, JHS) have published trials investigating the effects of PFMT; both trials were excluded from this review based on the participants (antenatal and postnatal women) or the comparison interventions (one type of PFMT versus another).
Acknowledgements
The authors of this review would like to acknowledge the following.
The considerable contribution made by Kari Bø, Bary Berghmans, Erik Hendriks, Rob de Bie and Ernst van Waalwijk van Doorn, co‐authors of one of the previous versions of the PFMT review (Hay‐Smith 2002b).
The assistance of Michael Albert and Peter Dietz in translating papers from German to English.
The considerable contribution made by Cathryn Glazener, Muhammad Imran Omar, Suzanne MacDonald and Sheila Wallace to the update of the present version of the PFMT review.
The support of the International Continence Society research fellowship.
Version history
| Published | Title | Stage | Authors | Version |
| 2018 Oct 04 | Pelvic floor muscle training versus no treatment, or inactive control treatments, for urinary incontinence in women | Review | Chantale Dumoulin, Licia P Cacciari, E Jean C Hay‐Smith | |
| 2014 May 14 | Pelvic floor muscle training versus no treatment, or inactive control treatments, for urinary incontinence in women | Review | Chantale Dumoulin, E. Jean C Hay‐Smith, Gabrielle Mac Habée‐Séguin | |
| 2010 Jan 20 | Pelvic floor muscle training versus no treatment, or inactive control treatments, for urinary incontinence in women | Review | Chantale Dumoulin, Jean Hay‐Smith | |
| 2006 Jan 25 | Pelvic floor muscle training versus no treatment, or inactive control treatments, for urinary incontinence in women | Review | Jean Hay‐Smith, Chantale Dumoulin | |
Keywords
MeSH
Medical Subject Headings (MeSH) Keywords
Medical Subject Headings Check Words
Female; Humans;
PICO

PRISMA study flow diagram.


Comparison 1 PFMT versus no treatment, placebo or control, Outcome 1 Participant perceived cure.

Comparison 1 PFMT versus no treatment, placebo or control, Outcome 2 Participant perceived cure or improvement after treatment.
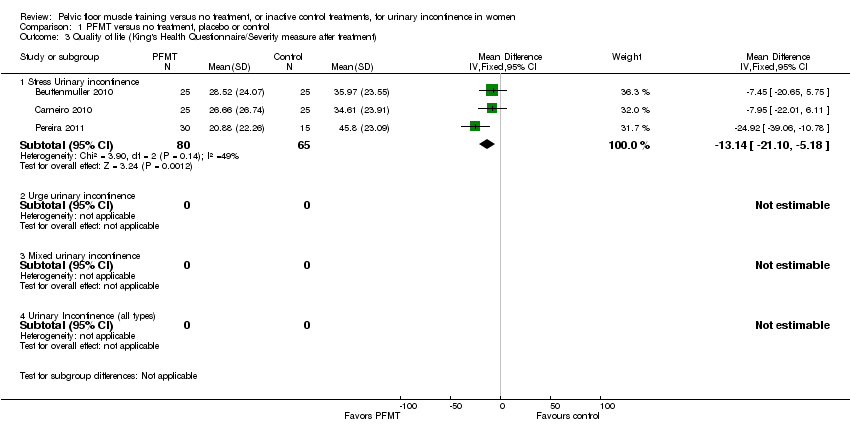
Comparison 1 PFMT versus no treatment, placebo or control, Outcome 3 Quality of life (King's Health Questionnaire/Severity measure after treatment).

Comparison 1 PFMT versus no treatment, placebo or control, Outcome 4 Quality of life (King's Health Questionnaire/Incontinence impact after treatment).

Comparison 1 PFMT versus no treatment, placebo or control, Outcome 5 Quality of life (King's Health Questionnaire/Physical limitation).

Comparison 1 PFMT versus no treatment, placebo or control, Outcome 6 Number of women with interference with life due to UI.

Comparison 1 PFMT versus no treatment, placebo or control, Outcome 7 I‐QOL.

Comparison 1 PFMT versus no treatment, placebo or control, Outcome 8 Quality of life (King's Health Questionnaire/General health score).

Comparison 1 PFMT versus no treatment, placebo or control, Outcome 9 Cure at up to one year.
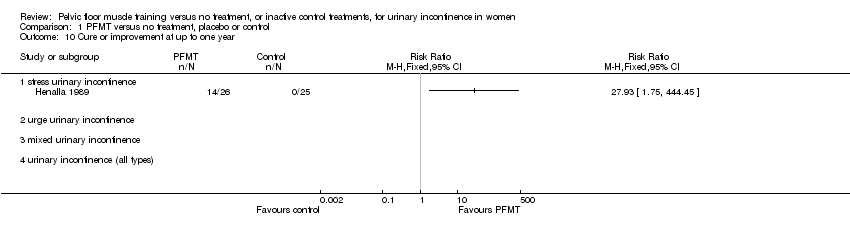
Comparison 1 PFMT versus no treatment, placebo or control, Outcome 10 Cure or improvement at up to one year.

Comparison 1 PFMT versus no treatment, placebo or control, Outcome 11 Patient perceived satisfaction.

Comparison 1 PFMT versus no treatment, placebo or control, Outcome 12 Number of women needing further treatment.

Comparison 1 PFMT versus no treatment, placebo or control, Outcome 13 Number of leakage episodes in 24 hours.

Comparison 1 PFMT versus no treatment, placebo or control, Outcome 14 Number of voids per day (frequency).
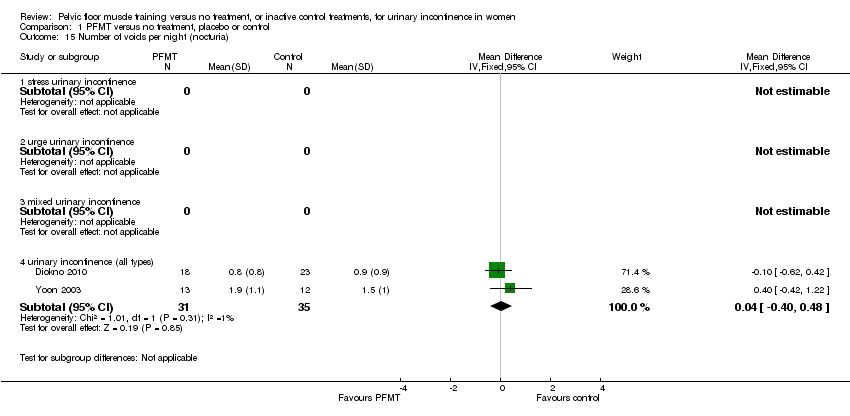
Comparison 1 PFMT versus no treatment, placebo or control, Outcome 15 Number of voids per night (nocturia).

Comparison 1 PFMT versus no treatment, placebo or control, Outcome 16 Short (up to one hour) pad test measured as grams of urine.

Comparison 1 PFMT versus no treatment, placebo or control, Outcome 17 24 hour pad test (grams).

Comparison 1 PFMT versus no treatment, placebo or control, Outcome 18 Number cured on short pad test (objective) after treatment.

Comparison 1 PFMT versus no treatment, placebo or control, Outcome 19 Number cured or improved on short pad test (objective) after treatment.

Comparison 1 PFMT versus no treatment, placebo or control, Outcome 20 Number of women with sex life spoilt by UI.

Comparison 1 PFMT versus no treatment, placebo or control, Outcome 21 Number of women with UI during intercourse.
| PFMT versus no treatment, placebo or control for urinary incontinence in women | ||||||
| Patient or population: patients with urinary incontinence in women | ||||||
| Outcomes | Illustrative comparative risks* (95% CI) | Relative effect | No of Participants | Quality of the evidence | Comments | |
| Assumed risk | Corresponding risk | |||||
| Control | PFMT versus no treatment, placebo or control | |||||
| Participant perceived cure ‐ stress urinary incontinence | Study population | RR 8.38 | 165 | ⊕⊕⊕⊕ | ||
| 60 per 1000 | 505 per 1000 | |||||
| Moderate | ||||||
| 62 per 1000 | 520 per 1000 | |||||
| Participant perceived cure or improvement after treatment ‐ stress urinary incontinence | Study population | RR 17 | 121 | ⊕⊕⊕⊝ | ||
| 32 per 1000 | 540 per 1000 | |||||
| Moderate | ||||||
| 32 per 1000 | 544 per 1000 | |||||
| Quality of life (King's Health Questionnaire/Incontinence impact after treatment) ‐ stress urinary incontinence | The mean quality of life (King's health questionnaire/incontinence impact after treatment) ‐ stress urinary incontinence in the intervention groups was | 145 | ⊕⊝⊝⊝ | |||
| Number of leakage episodes in 24 hours ‐ stress urinary incontinence | The mean number of leakage episodes in 24 hours ‐ stress urinary incontinence in the intervention groups was | 253 | ⊕⊕⊕⊝ | |||
| Short (up to one hour) pad test measured as grams of urine ‐ stress urinary incontinence | The mean short (up to one hour) pad test measured as grams of urine ‐ stress urinary incontinence in the intervention groups was | 150 | ⊕⊕⊕⊝ | |||
| Treatment adherence ‐ not reported | See comment | See comment | Not estimable | ‐ | See comment | |
| Formal economic analysis ‐ not reported | See comment | See comment | Not estimable | ‐ | See comment | |
| *The basis for the assumed risk (e.g. the median control group risk across studies) is provided in footnotes. The corresponding risk (and its 95% confidence interval) is based on the assumed risk in the comparison group and the relative effect of the intervention (and its 95% CI). | ||||||
| GRADE Working Group grades of evidence | ||||||
| 1 Not applicable. Fewer than 10 trials. | ||||||
| PFMT versus no treatment, placebo or control for urinary incontinence in women | ||||||
| Patient or population: patients with urinary incontinence in women | ||||||
| Outcomes | Illustrative comparative risks* (95% CI) | Relative effect | No of Participants | Quality of the evidence | Comments | |
| Assumed risk | Corresponding risk | |||||
| Control | PFMT versus no treatment, placebo or control | |||||
| Participant perceived cure ‐ urinary incontinence (all types) | Study population | RR 5.5 | 301 | ⊕⊕⊕⊝ | ||
| 57 per 1000 | 315 per 1000 | |||||
| Moderate | ||||||
| 16 per 1000 | 88 per 1000 | |||||
| Participant perceived cure or improvement after treatment ‐ urinary incontinence (all types) | Study population | RR 2.35 | 166 | ⊕⊕⊕⊝ | ||
| 288 per 1000 | 676 per 1000 | |||||
| Moderate | ||||||
| 245 per 1000 | 576 per 1000 | |||||
| Quality of life (King's Health Questionnaire/Incontinence impact after treatment) ‐ urinary Incontinence (all types) ‐ not reported | See comment | See comment | Not estimable | ‐ | See comment | |
| Number of leakage episodes in 24 hours ‐ urinary incontinence (all types) | The mean number of leakage episodes in 24 hours ‐ urinary incontinence (all types) in the intervention groups was | 125 | ⊕⊕⊕⊝ | |||
| Short (up to one hour) pad test measured as grams of urine ‐ urinary incontinence (all types) | The mean short (up to one hour) pad test measured as grams of urine ‐ urinary incontinence (all types) in the intervention groups was | 25 | ⊕⊕⊝⊝ | |||
| Treatment adherence ‐ not reported | See comment | See comment | Not estimable | ‐ | See comment | |
| Formal economic analysis ‐ not reported | See comment | See comment | Not estimable | ‐ | See comment | |
| *The basis for the assumed risk (e.g. the median control group risk across studies) is provided in footnotes. The corresponding risk (and its 95% confidence interval) is based on the assumed risk in the comparison group and the relative effect of the intervention (and its 95% CI). | ||||||
| GRADE Working Group grades of evidence | ||||||
| 1 Allocation concealment is unclear in Burgio 1998 which is the biggest trial. | ||||||
| Outcome or subgroup title | No. of studies | No. of participants | Statistical method | Effect size |
| 1 Participant perceived cure Show forest plot | 6 | Risk Ratio (M‐H, Fixed, 95% CI) | Subtotals only | |
| 1.1 stress urinary incontinence | 4 | 165 | Risk Ratio (M‐H, Fixed, 95% CI) | 8.38 [3.68, 19.07] |
| 1.2 urge urinary incontinence | 0 | 0 | Risk Ratio (M‐H, Fixed, 95% CI) | 0.0 [0.0, 0.0] |
| 1.3 mixed urinary incontinence | 0 | 0 | Risk Ratio (M‐H, Fixed, 95% CI) | 0.0 [0.0, 0.0] |
| 1.4 urinary incontinence (all types) | 3 | 290 | Risk Ratio (M‐H, Fixed, 95% CI) | 5.34 [2.78, 10.26] |
| 2 Participant perceived cure or improvement after treatment Show forest plot | 4 | Risk Ratio (M‐H, Fixed, 95% CI) | Subtotals only | |
| 2.1 stress urinary incontinence | 2 | 121 | Risk Ratio (M‐H, Fixed, 95% CI) | 17.33 [4.31, 69.64] |
| 2.2 urge urinary incontinence | 0 | 0 | Risk Ratio (M‐H, Fixed, 95% CI) | 0.0 [0.0, 0.0] |
| 2.3 mixed urinary incontinence | 0 | 0 | Risk Ratio (M‐H, Fixed, 95% CI) | 0.0 [0.0, 0.0] |
| 2.4 urinary incontinence (all types) | 2 | 166 | Risk Ratio (M‐H, Fixed, 95% CI) | 2.39 [1.64, 3.47] |
| 3 Quality of life (King's Health Questionnaire/Severity measure after treatment) Show forest plot | 3 | Mean Difference (IV, Fixed, 95% CI) | Subtotals only | |
| 3.1 Stress Urinary incontinence | 3 | 145 | Mean Difference (IV, Fixed, 95% CI) | ‐13.14 [‐21.10, ‐5.18] |
| 3.2 Urge urinary incontinence | 0 | 0 | Mean Difference (IV, Fixed, 95% CI) | 0.0 [0.0, 0.0] |
| 3.3 Mixed urinary incontinence | 0 | 0 | Mean Difference (IV, Fixed, 95% CI) | 0.0 [0.0, 0.0] |
| 3.4 Urinary Incontinence (all types) | 0 | 0 | Mean Difference (IV, Fixed, 95% CI) | 0.0 [0.0, 0.0] |
| 4 Quality of life (King's Health Questionnaire/Incontinence impact after treatment) Show forest plot | 3 | Mean Difference (IV, Fixed, 95% CI) | Subtotals only | |
| 4.1 Stress Urinary incontinence | 3 | 145 | Mean Difference (IV, Fixed, 95% CI) | ‐11.76 [‐20.83, ‐2.69] |
| 4.2 Urge urinary incontinence | 0 | 0 | Mean Difference (IV, Fixed, 95% CI) | 0.0 [0.0, 0.0] |
| 4.3 Mixed urinary incontinence | 0 | 0 | Mean Difference (IV, Fixed, 95% CI) | 0.0 [0.0, 0.0] |
| 4.4 Urinary Incontinence (all types) | 0 | 0 | Mean Difference (IV, Fixed, 95% CI) | 0.0 [0.0, 0.0] |
| 5 Quality of life (King's Health Questionnaire/Physical limitation) Show forest plot | 3 | Mean Difference (IV, Fixed, 95% CI) | Subtotals only | |
| 5.1 Stress Urinary incontinence | 3 | 145 | Mean Difference (IV, Fixed, 95% CI) | ‐11.89 [‐20.55, ‐3.23] |
| 5.2 Urge urinary incontinence | 0 | 0 | Mean Difference (IV, Fixed, 95% CI) | 0.0 [0.0, 0.0] |
| 5.3 Mixed urinary incontinence | 0 | 0 | Mean Difference (IV, Fixed, 95% CI) | 0.0 [0.0, 0.0] |
| 5.4 Urinary Incontinence (all types) | 0 | 0 | Mean Difference (IV, Fixed, 95% CI) | 0.0 [0.0, 0.0] |
| 6 Number of women with interference with life due to UI Show forest plot | 1 | Risk Ratio (M‐H, Fixed, 95% CI) | Totals not selected | |
| 6.1 stress urinary incontinence | 1 | Risk Ratio (M‐H, Fixed, 95% CI) | 0.0 [0.0, 0.0] | |
| 6.2 urge urinary incontinence | 0 | Risk Ratio (M‐H, Fixed, 95% CI) | 0.0 [0.0, 0.0] | |
| 6.3 mixed urinary incontinence | 0 | Risk Ratio (M‐H, Fixed, 95% CI) | 0.0 [0.0, 0.0] | |
| 6.4 urinary incontinence (all types) | 0 | Risk Ratio (M‐H, Fixed, 95% CI) | 0.0 [0.0, 0.0] | |
| 7 I‐QOL Show forest plot | 2 | Mean Difference (IV, Fixed, 95% CI) | Totals not selected | |
| 7.1 Stress urinary incontinence | 1 | Mean Difference (IV, Fixed, 95% CI) | 0.0 [0.0, 0.0] | |
| 7.2 Urge urinary incontinence | 0 | Mean Difference (IV, Fixed, 95% CI) | 0.0 [0.0, 0.0] | |
| 7.3 Mixed urinary incontinence | 0 | Mean Difference (IV, Fixed, 95% CI) | 0.0 [0.0, 0.0] | |
| 7.4 Urinary incontinence (all types) | 1 | Mean Difference (IV, Fixed, 95% CI) | 0.0 [0.0, 0.0] | |
| 8 Quality of life (King's Health Questionnaire/General health score) Show forest plot | 3 | Mean Difference (IV, Fixed, 95% CI) | Subtotals only | |
| 8.1 Stress Urinary incontinence | 3 | 145 | Mean Difference (IV, Fixed, 95% CI) | 1.81 [‐3.40, 7.03] |
| 8.2 Urge urinary incontinence | 0 | 0 | Mean Difference (IV, Fixed, 95% CI) | 0.0 [0.0, 0.0] |
| 8.3 Mixed urinary incontinence | 0 | 0 | Mean Difference (IV, Fixed, 95% CI) | 0.0 [0.0, 0.0] |
| 8.4 Urinary Incontinence (all types) | 0 | 0 | Mean Difference (IV, Fixed, 95% CI) | 0.0 [0.0, 0.0] |
| 9 Cure at up to one year Show forest plot | 1 | Risk Ratio (M‐H, Fixed, 95% CI) | Totals not selected | |
| 9.1 stress urinary incontinence | 0 | Risk Ratio (M‐H, Fixed, 95% CI) | 0.0 [0.0, 0.0] | |
| 9.2 urge urinary incontinence | 0 | Risk Ratio (M‐H, Fixed, 95% CI) | 0.0 [0.0, 0.0] | |
| 9.3 mixed urinary incontinence | 0 | Risk Ratio (M‐H, Fixed, 95% CI) | 0.0 [0.0, 0.0] | |
| 9.4 urinary incontinence (all types) | 1 | Risk Ratio (M‐H, Fixed, 95% CI) | 0.0 [0.0, 0.0] | |
| 10 Cure or improvement at up to one year Show forest plot | 1 | Risk Ratio (M‐H, Fixed, 95% CI) | Totals not selected | |
| 10.1 stress urinary incontinence | 1 | Risk Ratio (M‐H, Fixed, 95% CI) | 0.0 [0.0, 0.0] | |
| 10.2 urge urinary incontinence | 0 | Risk Ratio (M‐H, Fixed, 95% CI) | 0.0 [0.0, 0.0] | |
| 10.3 mixed urinary incontinence | 0 | Risk Ratio (M‐H, Fixed, 95% CI) | 0.0 [0.0, 0.0] | |
| 10.4 urinary incontinence (all types) | 0 | Risk Ratio (M‐H, Fixed, 95% CI) | 0.0 [0.0, 0.0] | |
| 11 Patient perceived satisfaction Show forest plot | 3 | Risk Ratio (M‐H, Fixed, 95% CI) | Subtotals only | |
| 11.1 stress urinary incontinence | 2 | 105 | Risk Ratio (M‐H, Fixed, 95% CI) | 5.32 [2.63, 10.74] |
| 11.2 urge urinary incontinence | 0 | 0 | Risk Ratio (M‐H, Fixed, 95% CI) | 0.0 [0.0, 0.0] |
| 11.3 mixed urinary incontinence | 0 | 0 | Risk Ratio (M‐H, Fixed, 95% CI) | 0.0 [0.0, 0.0] |
| 11.4 urinary incontinence (all types) | 1 | 108 | Risk Ratio (M‐H, Fixed, 95% CI) | 2.77 [1.74, 4.41] |
| 12 Number of women needing further treatment Show forest plot | 2 | Risk Ratio (M‐H, Fixed, 95% CI) | Subtotals only | |
| 12.1 stress urinary incontinence | 1 | 55 | Risk Ratio (M‐H, Fixed, 95% CI) | 0.17 [0.07, 0.42] |
| 12.2 urge urinary incontinence | 0 | 0 | Risk Ratio (M‐H, Fixed, 95% CI) | 0.0 [0.0, 0.0] |
| 12.3 mixed urinary incontinence | 0 | 0 | Risk Ratio (M‐H, Fixed, 95% CI) | 0.0 [0.0, 0.0] |
| 12.4 urinary incontinence (all types) | 1 | 106 | Risk Ratio (M‐H, Fixed, 95% CI) | 0.19 [0.10, 0.36] |
| 13 Number of leakage episodes in 24 hours Show forest plot | 5 | Mean Difference (IV, Fixed, 95% CI) | Subtotals only | |
| 13.1 stress urinary incontinence | 4 | 253 | Mean Difference (IV, Fixed, 95% CI) | ‐1.21 [‐1.52, ‐0.89] |
| 13.2 urge urinary incontinence | 0 | 0 | Mean Difference (IV, Fixed, 95% CI) | 0.0 [0.0, 0.0] |
| 13.3 mixed urinary incontinence | 0 | 0 | Mean Difference (IV, Fixed, 95% CI) | 0.0 [0.0, 0.0] |
| 13.4 urinary incontinence (all types) | 1 | 125 | Mean Difference (IV, Fixed, 95% CI) | ‐0.80 [‐1.26, ‐0.34] |
| 14 Number of voids per day (frequency) Show forest plot | 2 | Mean Difference (IV, Fixed, 95% CI) | Subtotals only | |
| 14.1 stress urinary incontinence | 0 | 0 | Mean Difference (IV, Fixed, 95% CI) | 0.0 [0.0, 0.0] |
| 14.2 urge urinary incontinence | 0 | 0 | Mean Difference (IV, Fixed, 95% CI) | 0.0 [0.0, 0.0] |
| 14.3 mixed urinary incontinence | 0 | 0 | Mean Difference (IV, Fixed, 95% CI) | 0.0 [0.0, 0.0] |
| 14.4 urinary incontinence (all types) | 2 | 66 | Mean Difference (IV, Fixed, 95% CI) | ‐2.56 [‐3.65, ‐1.48] |
| 15 Number of voids per night (nocturia) Show forest plot | 2 | Mean Difference (IV, Fixed, 95% CI) | Subtotals only | |
| 15.1 stress urinary incontinence | 0 | 0 | Mean Difference (IV, Fixed, 95% CI) | 0.0 [0.0, 0.0] |
| 15.2 urge urinary incontinence | 0 | 0 | Mean Difference (IV, Fixed, 95% CI) | 0.0 [0.0, 0.0] |
| 15.3 mixed urinary incontinence | 0 | 0 | Mean Difference (IV, Fixed, 95% CI) | 0.0 [0.0, 0.0] |
| 15.4 urinary incontinence (all types) | 2 | 66 | Mean Difference (IV, Fixed, 95% CI) | 0.04 [‐0.40, 0.48] |
| 16 Short (up to one hour) pad test measured as grams of urine Show forest plot | 4 | Mean Difference (IV, Fixed, 95% CI) | Subtotals only | |
| 16.1 Stress urinary incontinence | 3 | 150 | Mean Difference (IV, Fixed, 95% CI) | ‐4.36 [‐6.77, ‐1.96] |
| 16.2 Urge urinary incontinence | 0 | 0 | Mean Difference (IV, Fixed, 95% CI) | 0.0 [0.0, 0.0] |
| 16.3 mixed urinary incontinence | 0 | 0 | Mean Difference (IV, Fixed, 95% CI) | 0.0 [0.0, 0.0] |
| 16.4 urinary incontinence (all types) | 1 | 25 | Mean Difference (IV, Fixed, 95% CI) | ‐5.10 [‐11.16, 0.96] |
| 17 24 hour pad test (grams) Show forest plot | 2 | Mean Difference (IV, Fixed, 95% CI) | Subtotals only | |
| 17.1 Stress urinary incontinence | 1 | 55 | Mean Difference (IV, Fixed, 95% CI) | ‐27.5 [‐61.24, 6.24] |
| 17.2 Urge urinary incontinence | 0 | 0 | Mean Difference (IV, Fixed, 95% CI) | 0.0 [0.0, 0.0] |
| 17.3 Mixed urinary incontinence | 0 | 0 | Mean Difference (IV, Fixed, 95% CI) | 0.0 [0.0, 0.0] |
| 17.4 Urinary incontinence (all types) | 1 | 41 | Mean Difference (IV, Fixed, 95% CI) | ‐1.20 [‐15.24, 12.84] |
| 18 Number cured on short pad test (objective) after treatment Show forest plot | 3 | Risk Ratio (M‐H, Fixed, 95% CI) | Subtotals only | |
| 18.1 stress urinary incontinence | 3 | 135 | Risk Ratio (M‐H, Fixed, 95% CI) | 7.50 [2.89, 19.47] |
| 18.2 urge urinary incontinence | 0 | 0 | Risk Ratio (M‐H, Fixed, 95% CI) | 0.0 [0.0, 0.0] |
| 18.3 mixed urinary incontinence | 0 | 0 | Risk Ratio (M‐H, Fixed, 95% CI) | 0.0 [0.0, 0.0] |
| 18.4 urinary incontinence (all types) | 0 | 0 | Risk Ratio (M‐H, Fixed, 95% CI) | 0.0 [0.0, 0.0] |
| 19 Number cured or improved on short pad test (objective) after treatment Show forest plot | 3 | Risk Ratio (M‐H, Fixed, 95% CI) | Subtotals only | |
| 19.1 stress urinary incontinence | 3 | 96 | Risk Ratio (M‐H, Fixed, 95% CI) | 8.22 [3.17, 21.28] |
| 19.2 urge urinary incontinence | 0 | 0 | Risk Ratio (M‐H, Fixed, 95% CI) | 0.0 [0.0, 0.0] |
| 19.3 mixed urinary incontinence | 0 | 0 | Risk Ratio (M‐H, Fixed, 95% CI) | 0.0 [0.0, 0.0] |
| 19.4 urinary incontinence (all types) | 0 | 0 | Risk Ratio (M‐H, Fixed, 95% CI) | 0.0 [0.0, 0.0] |
| 20 Number of women with sex life spoilt by UI Show forest plot | 1 | Risk Ratio (M‐H, Fixed, 95% CI) | Totals not selected | |
| 20.1 stress urinary incontinence | 1 | Risk Ratio (M‐H, Fixed, 95% CI) | 0.0 [0.0, 0.0] | |
| 20.2 urge urinary incontinence | 0 | Risk Ratio (M‐H, Fixed, 95% CI) | 0.0 [0.0, 0.0] | |
| 20.3 mixed urinary incontinence | 0 | Risk Ratio (M‐H, Fixed, 95% CI) | 0.0 [0.0, 0.0] | |
| 20.4 urinary incontinence (all types) | 0 | Risk Ratio (M‐H, Fixed, 95% CI) | 0.0 [0.0, 0.0] | |
| 21 Number of women with UI during intercourse Show forest plot | 1 | Risk Ratio (M‐H, Fixed, 95% CI) | Totals not selected | |
| 21.1 stress urinary incontinence | 1 | Risk Ratio (M‐H, Fixed, 95% CI) | 0.0 [0.0, 0.0] | |
| 21.2 urge urinary incontinence | 0 | Risk Ratio (M‐H, Fixed, 95% CI) | 0.0 [0.0, 0.0] | |
| 21.3 mixed urinary incontinence | 0 | Risk Ratio (M‐H, Fixed, 95% CI) | 0.0 [0.0, 0.0] | |
| 21.4 urinary incontinence (all types) | 0 | Risk Ratio (M‐H, Fixed, 95% CI) | 0.0 [0.0, 0.0] | |